Quantitative Assessment of Vulnerability to Climate Change in Rural Municipalities of Bosnia and Herzegovina

1
Department of International Environment and Development Studies, Norwegian University of Life Sciences (NMBU), Universitetstunet 3, 1433 Ås, Norway
2
Faculty of Agriculture and Food Sciences, University of Sarajevo, Zmaja od Bosne 8, 71000 Sarajevo, Bosnia and Herzegovina
*
Author to whom correspondence should be addressed.
Sustainability 2017, 9(7), 1208; https://doi.org/10.3390/su9071208
Submission received: 6 June 2017
/
Revised: 3 July 2017
/
Accepted: 8 July 2017
/
Published: 10 July 2017
(This article belongs to the Special Issue The Impacts of Climate Changes: From Sustainability Perspectives)
Abstract
:The rural population in Bosnia and Herzegovina (BH), which constitutes more than half of the total population, experienced serious incidences of extreme weather events in the past two decades. This part of the population is vulnerable to climate change due to significant dependence on agriculture as a climate-sensitive livelihood option. However, the source of their vulnerability is due not only to the extent and magnitude of these extreme climate events, but also to the internal status within the vulnerable systems before the occurrence of such events. In order to explore the different dimensions of vulnerability, we used a set of 20 indicators to quantitatively assess the vulnerability of the rural population to climate change at the local level in BH. Two summarizing and two weighting methods were applied to assess vulnerability—Equal weights (EW) and principal component analysis (PCA). Based on the results obtained, we concluded that the current socio-economic conditions and the increased environmental pressure as a result of the present human-environment interactions are the main determinants of vulnerability in most vulnerable municipalities, rather than the degree to which these municipalities are exposed to significant climatic variations. Most vulnerable municipalities are located across the north, with a gradual decrease in vulnerability towards the central, north, and east of the country. Vulnerability increases again from here towards the south of the country. The number of municipalities classified as the highest and highly vulnerable increased when the second summarizing method and weighted indicators were used. However, the general geographic distribution of vulnerability did not change substantially compared to the first method. The approaches used in this study provide some valuable results at the local level, and are presented in a way that is practical for decision-making processes and may serve as a base for further research when designing effective adaptation and mitigation strategies, especially in the regions with similar climatic and socio-economic conditions.
1. Introduction
Bosnia and Herzegovina (BH) has experienced serious incidences of extreme weather events in the past two decades, causing severe economic losses. Based on available data and current, available climate projections, exposure to threats from climate change will continue to increase [1,2]. BH is a predominantly rural country. It is estimated that nearly two thirds of the population live in rural areas [2]. The rural population in these regions is vulnerable to climate change due to heavy dependence on climate sensitive livelihood options (agriculture in particular) and limited adaptive capacity to cope with changes, similar to what is described in the case of the developing countries [3,4]. Understanding climate change, and its effects and interactions with other global challenges, is a crucial step in designing effective adaptation and mitigation measures. Therefore, vulnerability assessment is one of the key tools used to learn more about the degree of impact of climate hazards within human and ecological systems and how these systems respond and cope with this potential threat [5]. In order to provide the best possible outcome in terms of adaptation and mitigation strategies, vulnerability assessment has to be holistic, at the appropriate scale, and must integrate a wide range of relevant factors [6].
In the last decade, there has been a gradual rise of awareness about climate change, and its importance and impact in BH and the Western Balkan region in general. This is primarily reflected in the growing number of national reports and strategic documents in which climate change is increasingly recognized as an issue of key strategic importance [7,8]. Preliminary findings are based on the existing climate change scenarios and their impact on different sectors, as well as identification of the most vulnerable sectors and estimated potentials for mitigating climate change. Although the basic foundations for building the necessary capacities and policies towards more climate resilient development have been set on the national level, more detailed studies and scientific contribution regarding climate change impacts and vulnerability, especially at the local level, are still modest and insufficient. Local governments and communities have a critical role in adaptation to climate change by structuring responses to local impacts, mediating between individual and collective responses to vulnerability, and governing the delivery of resources to facilitate adaptation [9]. Spatial vulnerability assessment carried out at a local level can thus be a useful tool, which allows for engagement between researchers and local stakeholders through the visualization of climate vulnerability and the integration of its biophysical and socio-economic determinants [10]. Therefore, the objective of our study was to quantitatively assess the current state of vulnerability of the rural population to climate change at the local level in BH and to present it in a way that will facilitate further discussion between researchers, local governments, and stakeholders, ultimately leading to more detailed assessments and adaptation strategies.
2. Choice of Framework and Indicators
2.1. Choice of Framework
Many different methods and approaches have been developed and applied to quantitatively assess vulnerability on different scales [11]. While not without their constraints, these approaches are practical for decision-making processes, since they give a clear picture about the geographical location of the most vulnerable populations and allows the implementation of measures for their protection and adaptation policies [12].
Approaches to conceptualizing vulnerability in the literature concerning climate change tend to fall into three categories. The first one, the end point approach, views vulnerability in terms of the amount of (potential) damage caused to a system by a particular climate-related event or hazard [13,14]. This approach is based on assessments of hazards and their impact, in which the role of human systems in mediating the outcomes of hazard events is downplayed or neglected and, as such, may be referred to as a physical or biophysical vulnerability [13]. This approach is focused on indicators of outcome rather than indicators of the state of a system prior to the occurrence of a hazard event. The second one, the starting point approach, views vulnerability as a state determined by the internal properties of a system that exist within a system before the occurrence of a hazard event. Vulnerability viewed as an inherent property of a system arising from its internal social and economic characteristics is known as social vulnerability [13,15]. Lastly, the third approach is based on the IPCC Third Assessment Report (TAR), in which vulnerability to climate change is defined as: “the degree to which a system is susceptible to, or unable to cope with, adverse effects of climate change, including climate variability and extremes. Vulnerability is a function of the character, magnitude, and rate of climate variation to which a system is exposed, its sensitivity, and its adaptive capacity” [16] (p. 21). Such an integrated approach includes an external biophysical dimension, represented through exposure to climate variations, as well as an internal social dimension of a system, which comprises its sensitivity and adaptive capacity [17].
Acknowledging that vulnerability of a certain area or system has an exogenous, biophysical dimension, as well as an internal, socio-economic dimension, we opted to construct a vulnerability index based on the IPCC definition of vulnerability using the indicators approach to assess socio-economic and biophysical factors contributing to vulnerability. According to the IPCC definition of vulnerability, vulnerability to climate change and variability is represented by three elements: exposure, sensitivity, and adaptive capacity [16]. According to the framework proposed by Füssel and Klein [17], exposure and sensitivity together compose the potential impact, while adaptive capacity is the potential of a system to cope with these impacts. Thus, vulnerability can be expressed with the following mathematical equation (Equation (1)):
where V is vulnerability, PI is potential impact, and AC is adaptive capacity. Therefore, vulnerability can be defined as a function of biophysical and social indicators, which constitute the three components of vulnerability.
2.2. Choice of Indicators
A commonly used quantitative approach to assess vulnerability is the construction of a vulnerability index based on specific sets or combinations of indicators, which serve as proxies [18]. Our study views population in rural municipalities as a vulnerable system and climate change and variability as a stressor. It is based on the assumption that the large number of rural households in BH are dependent on agriculture either as a main source of income or as a significant part of their livelihoods [19]. Agriculture is highly sensitive to variations in climate, which will be further increased with the ongoing climate change. Therefore, the chosen indicators should capture the biophysical aspects of climate change, the current state of the environment exposed to climate change, and the socio-economic situation which defines adaptive capacity in rural areas. In order to accomplish greater validity and cross-comparison, we picked most of our indicators based on past peer-reviewed studies, which dealt with quantitative assessment of agricultural vulnerability on a sub-national level, e.g., [12,20,21,22,23]. However, some of the indicators, most notably financial indicators in the case of adaptive capacity, were not available at the time of writing this study. In order to address the absence of such indicators, we chose some alternative, existing indicators, which were used as the same or similar proxies in previous peer-reviewed studies. Finally, the indicators were integrated into the sub-indices, in accordance with their belonging to particular components of vulnerability, together with the rationale why certain indicators were used, as shown in Table 1.
3. Study Area
Bosnia and Herzegovina is a country in south-eastern Europe, located in the Western Balkan region, with a total surface area of 51,209.2 km2, composed of 51,197 km2 of land and 12.2 km2 of sea. According to the most recent census in 2013, the population number is 3.53 million [28]. It is estimated that 61% of the total population lives in rural areas, which makes it one of the most rural countries in Europe [37]. The land is mainly hilly to mountainous, with an average altitude of 500 m. Of the total land area, 5% is lowlands, 24% hills, 42% mountains, and 29% karst region. The topography of the country and the location of the major cities are shown in Figure 1. Fertile flatlands comprise about 20% of agricultural land in BH, most of it in the northern lowlands and river valleys across the country. These areas are suitable for intensive agricultural production of a wide range of crops. Moderately to less fertile hilly and mountainous areas comprise 80% of the agricultural land, of which more than a half is relatively suitable for agricultural production, especially livestock production with its complementary grasslands and fodder production. The harsh Alpine environment (mountainous areas), steep slopes, or aridity in the vegetation period (especially in southern BH) usually limit agricultural production in the remaining areas.
The general atmospheric circulation and air mass flow, the dynamic topography, the orientation of mountain ranges, the hydrographical network, and the vicinity of the Adriatic Sea have all created conditions for a wide spectrum of climate types in BH [38], as shown in Supplementary Figure S2. These include a humid continental climate, represented mostly in the northern and lowland central parts of the territory; the sub-alpine and alpine climate of the mountainous region of central, eastern and western BH; and the Mediterranean climate represented in the coastal area and the lowlands of southern BH. This means that the effects of climate change and variability will depend on geographical location, and each region is facing specific challenges. For example, the Mediterranean region, characterized by scarce and shallow soils and significant areas under karst, and northern BH, which has the same climate as most of central Europe, are faced with the negative effects of increased temperatures and unfavorable rainfall distribution [39]. At the same time, the hilly and mountainous regions of central BH might even benefit from increased temperatures due to the increased vegetation season, allowing a wider range of crops and a higher productivity of grasslands.
BH, as a country in transition, is faced with numerous political, social, economic, and other problems in the post-war period. At the same time, it has been experiencing serious incidences of extreme weather events in the past two decades, causing severe economic consequences. Six extreme drought periods and three excessive floods in BH have been registered in the past 15 years, which have affected hundreds of thousands of people and resulted in enormous economic damage in agriculture and other sectors [2].
4. Methods
This study is focused on rural municipalities. Therefore, six municipalities, which are classified as urban based on the OECD criteria [40], were excluded from this study. These urban municipalities were excluded due to insignificant agricultural production and, secondly, because demographic and socio-economic indicators in these areas are substantially higher compared to the remaining 136 municipalities of BH. Therefore, their inclusion in this study may potentially have a negative effect on the normalization of indicators and the derived results, as they would act as outliers. According to the same typology, some municipalities are classified as intermediate, i.e., the share of the rural population is between 15% and 50%. In such cases, one might still expect some variation in adaptive capacity and even sensitivity based on proximity to urban centers. While there exists no specific indicator which would emphasize higher possibility of diversification of income sources or non-agricultural livelihood opportunities in such regions, many of the chosen indicators (e.g., population density, percent of the rural population, and most of the indicators used for adaptive capacity) act as proxies in this case.
4.1. Normalization of Indicators and Their Functional Relationships with Vulnerability
Each indicator used is measured in different scales and units. Therefore, they need to be normalized to ensure that they are comparable. This was carried out using the methodology developed for the calculation of the Human Development Index (HDI) [41]. All indicators were normalized to values between 0 and 1. Before the values are normalized, it was important to identify the two possible types of functional relationship between the indicators and vulnerability. This way it is ensured that the index values are always in positive correlation with vulnerability and that higher value means higher vulnerability and vice versa. Functional relationships with vulnerability for indicators were determined from the previous studies or based on the theoretical assumptions from Table 1. If vulnerability increases with an increase in the value of the indicator (positive correlation), and therefore has a positive functional relationship with vulnerability, normalization was carried out by using the following equation (Equation (2)),
where Xij is the normalized value of indicator (j) with respect to municipality (i), Xi is the actual value of the indicator with respect to municipality (i), and MinXj and MaxXj are the minimum and maximum values, respectively, of indicator (j) among all the municipalities.
If the functional relationship with vulnerability was negative, i.e., if vulnerability decreases with an increase in the value of the indicator (negative correlation), the following equation was used (Equation (3)):
4.2. Summarizing and Weighting Methods
The next step after normalization of indicators was to summarize indicators into composite indices and assign weights based on their degree of influence on vulnerability. For the purposes of our study, given that there are many different approaches used in the international literature, e.g., [21,42,43,44], we decided to use two different summarizing and weighting methods in order to demonstrate the differences between them.
Using equal weights (EW), normalized indicators were integrated in two calculated composite sub-indices in accordance with their belonging to particular components of vulnerability, as defined in Table 1. Sub-index for potential impact (PI) represents the arithmetic sum of indicators for exposure and sensitivity, whose arithmetic means were calculated separately based on the chosen set of indicators, while the arithmetic mean of indicators which represent adaptive capacity makes sub-index for adaptive capacity (AC). The final value of the vulnerability index for every municipality was obtained from the arithmetic sum of these two sub-indices. The same approach was used by O’Brien et al. [21], except that the sub-index for PI was labelled as the “index of climate sensitivity under exposure”. For the descriptive purposes of our discussion, we also calculated separate indices for exposure and sensitivity using the arithmetic mean of the indices which represent exposure/sensitivity, as shown in Table 1.
Principal components analysis (PCA) is a statistical method used to extract the linear combinations that best capture the information from a large group of variables. One of the methods is to use PCA to generate composite indices is by using the “eigenvalue-greater-than-one” rule proposed by Kaiser [45], which states that there are as many reliable factors as there are eigenvalues greater than one. This approach is found in Cutter et al. [46] and Wiréhn et al. [23]. After retaining all the components with eigenvalues greater than one, factor analysis in SPSS was used to generate factor loadings for all indicators, which were used as weights. Finally, we used the following equation to summarize all weighted indicators into the single composite index, as explained by [12] (Equation (4))
where V is a vulnerability index, w is the weight, i is the indicator, x is the indicator value, j is a specific municipality, is the mean indicator value, and s is the standard deviation.
4.3. Data Processing and Representation
The data used for indicators (Table 1) came in different formats, some of which had to be processed before their usage in this study. Spatial data used as biophysical indicators, such as changes in average annual temperatures, changes in average annual precipitation, and flood risk assessment for the housing sector, were retrieved in the raster format at a national level. In order to make these datasets suitable for the purposes of our study, we applied the Zonal Statistic Tool within ESRI ArcGIS’s Spatial Analyst on the output rasters to calculate the mean values for each spatially-explicit biophysical indicator within every separate municipality, after which they were normalized according to methods described in Chapter 3.1.
Frequency of extreme months in the vegetation period according to the Palmer moisture anomaly index (Z index) had to be calculated based on the available weather station data. This was carried out in four steps. In the first step, the Z index values were calculated from data retrieved from every weather station in BH, which recorded the necessary weather data for the required period (1961–2010). The second step was to calculate the frequency of extreme months, as described in the notes from Table 1. In the third step, the locations of weather stations were used as points for interpolation in order to generate prediction maps for the frequency of extreme months at a national level. The chosen interpolation method was cokriging, where the results from the weather stations were integrated with digital elevation data in order to provide more accurate results. Finally, in the fourth step, we used the same method described in the previous paragraph, where ESRI ArcGIS’s Spatial Analyst was used to calculate the mean values for every municipality.
In the case of socio-economical statistical data collected for the remaining indicators (Table 1) from census data, statistical yearbooks, and other public archives, this was a straightforward process, since the obtained data were already on the municipal level.
The resulting vulnerability scores represent current vulnerability of rural municipalities to changes in climate variability recorded so far. The value ranges for final vulnerability scores for both used weighting methods are divided into categories using equal intervals. This method sets the value ranges in each category equal in size. The entire range of data values is divided equally into five categories and each is assigned a qualitative indicator of vulnerability (from lowest to highest). The results are represented cartographically using ESRI ArcGIS in order to visualize and analyze the results in a geographic context.
5. Results and Discussion
5.1. The Overall Vulnerability Index
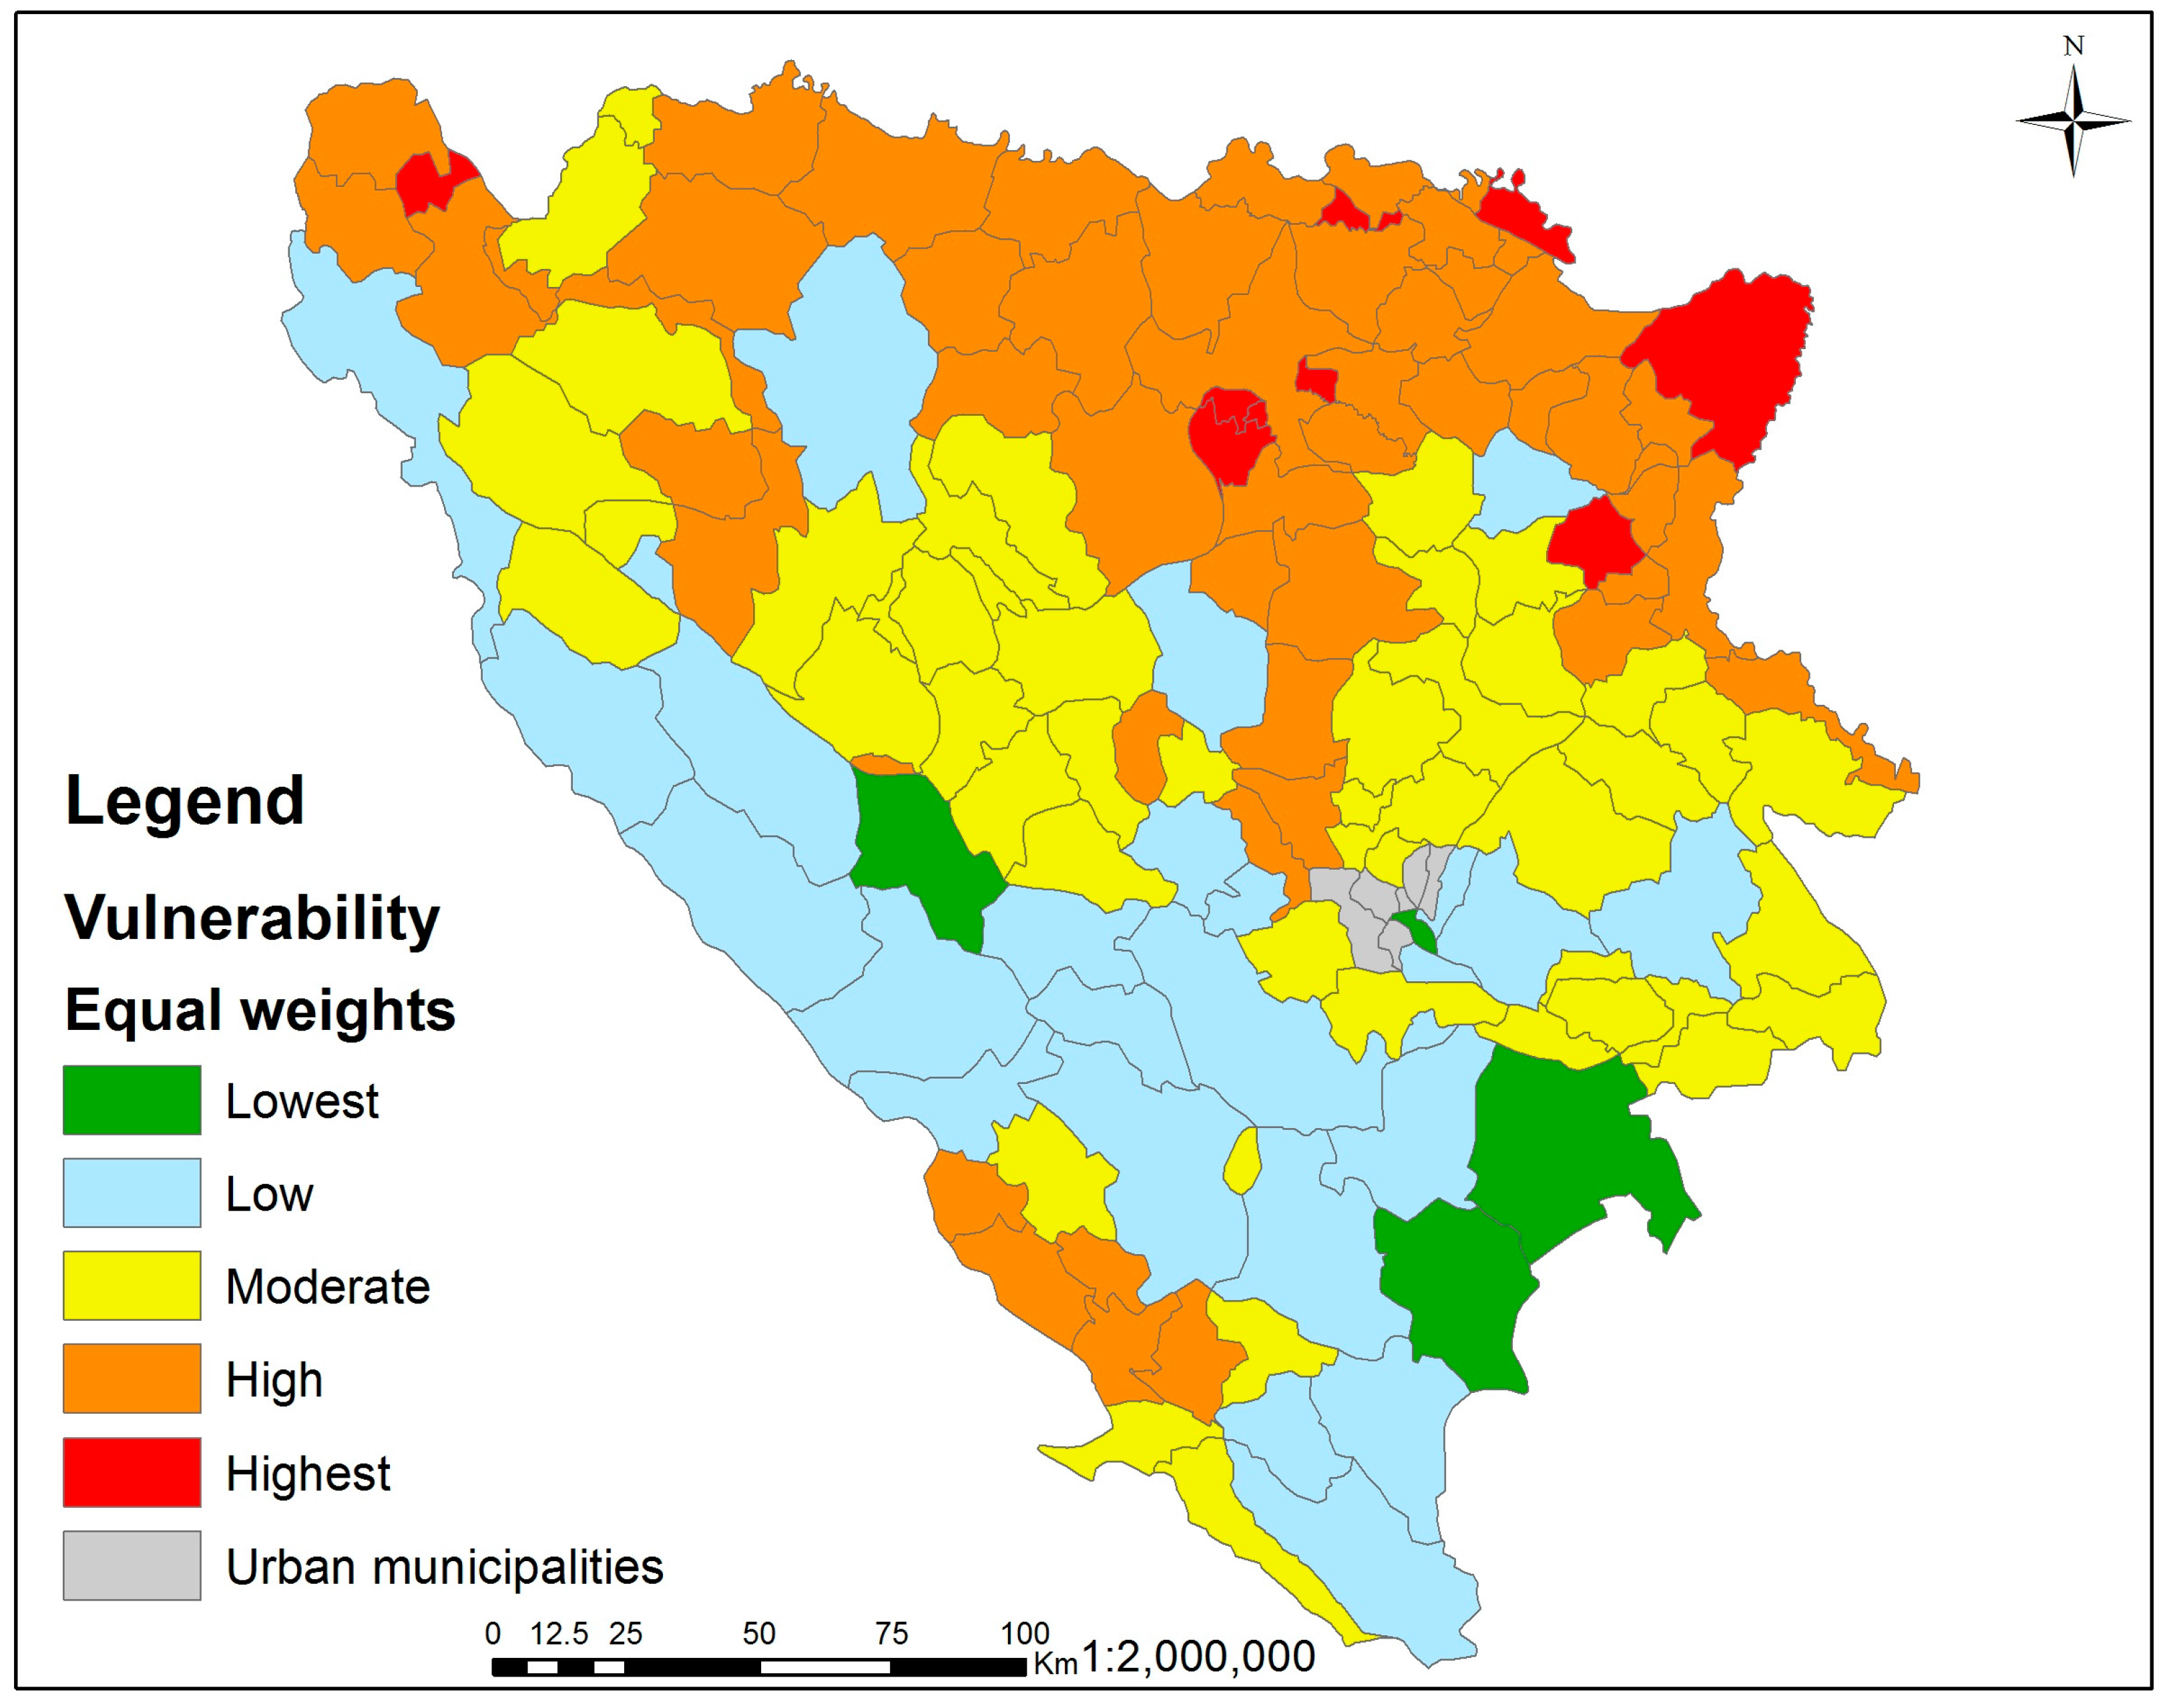
To obtain the overall index of vulnerability using EW, we summed the composite sub-indices for PI and AC. The results are shown in Figure 2. According to this method, nine municipalities (6.6%) had the highest vulnerability index, while only four municipalities (2.9%) had the lowest vulnerability index. The largest number of municipalities had high (51) or moderate (47) vulnerability (37.5% and 34.6%, respectively). 18.4% of the total number of municipalities (25) had a low vulnerability index. Geographically, the most vulnerable municipalities are located across the north, with a gradual decrease in vulnerability towards the central, eastern, and western parts of the country. In the south, most of municipalities in the lowland region of Herzegovina are classified as highly vulnerable, while municipalities in the surrounding region are mostly classified as low or moderately vulnerable.
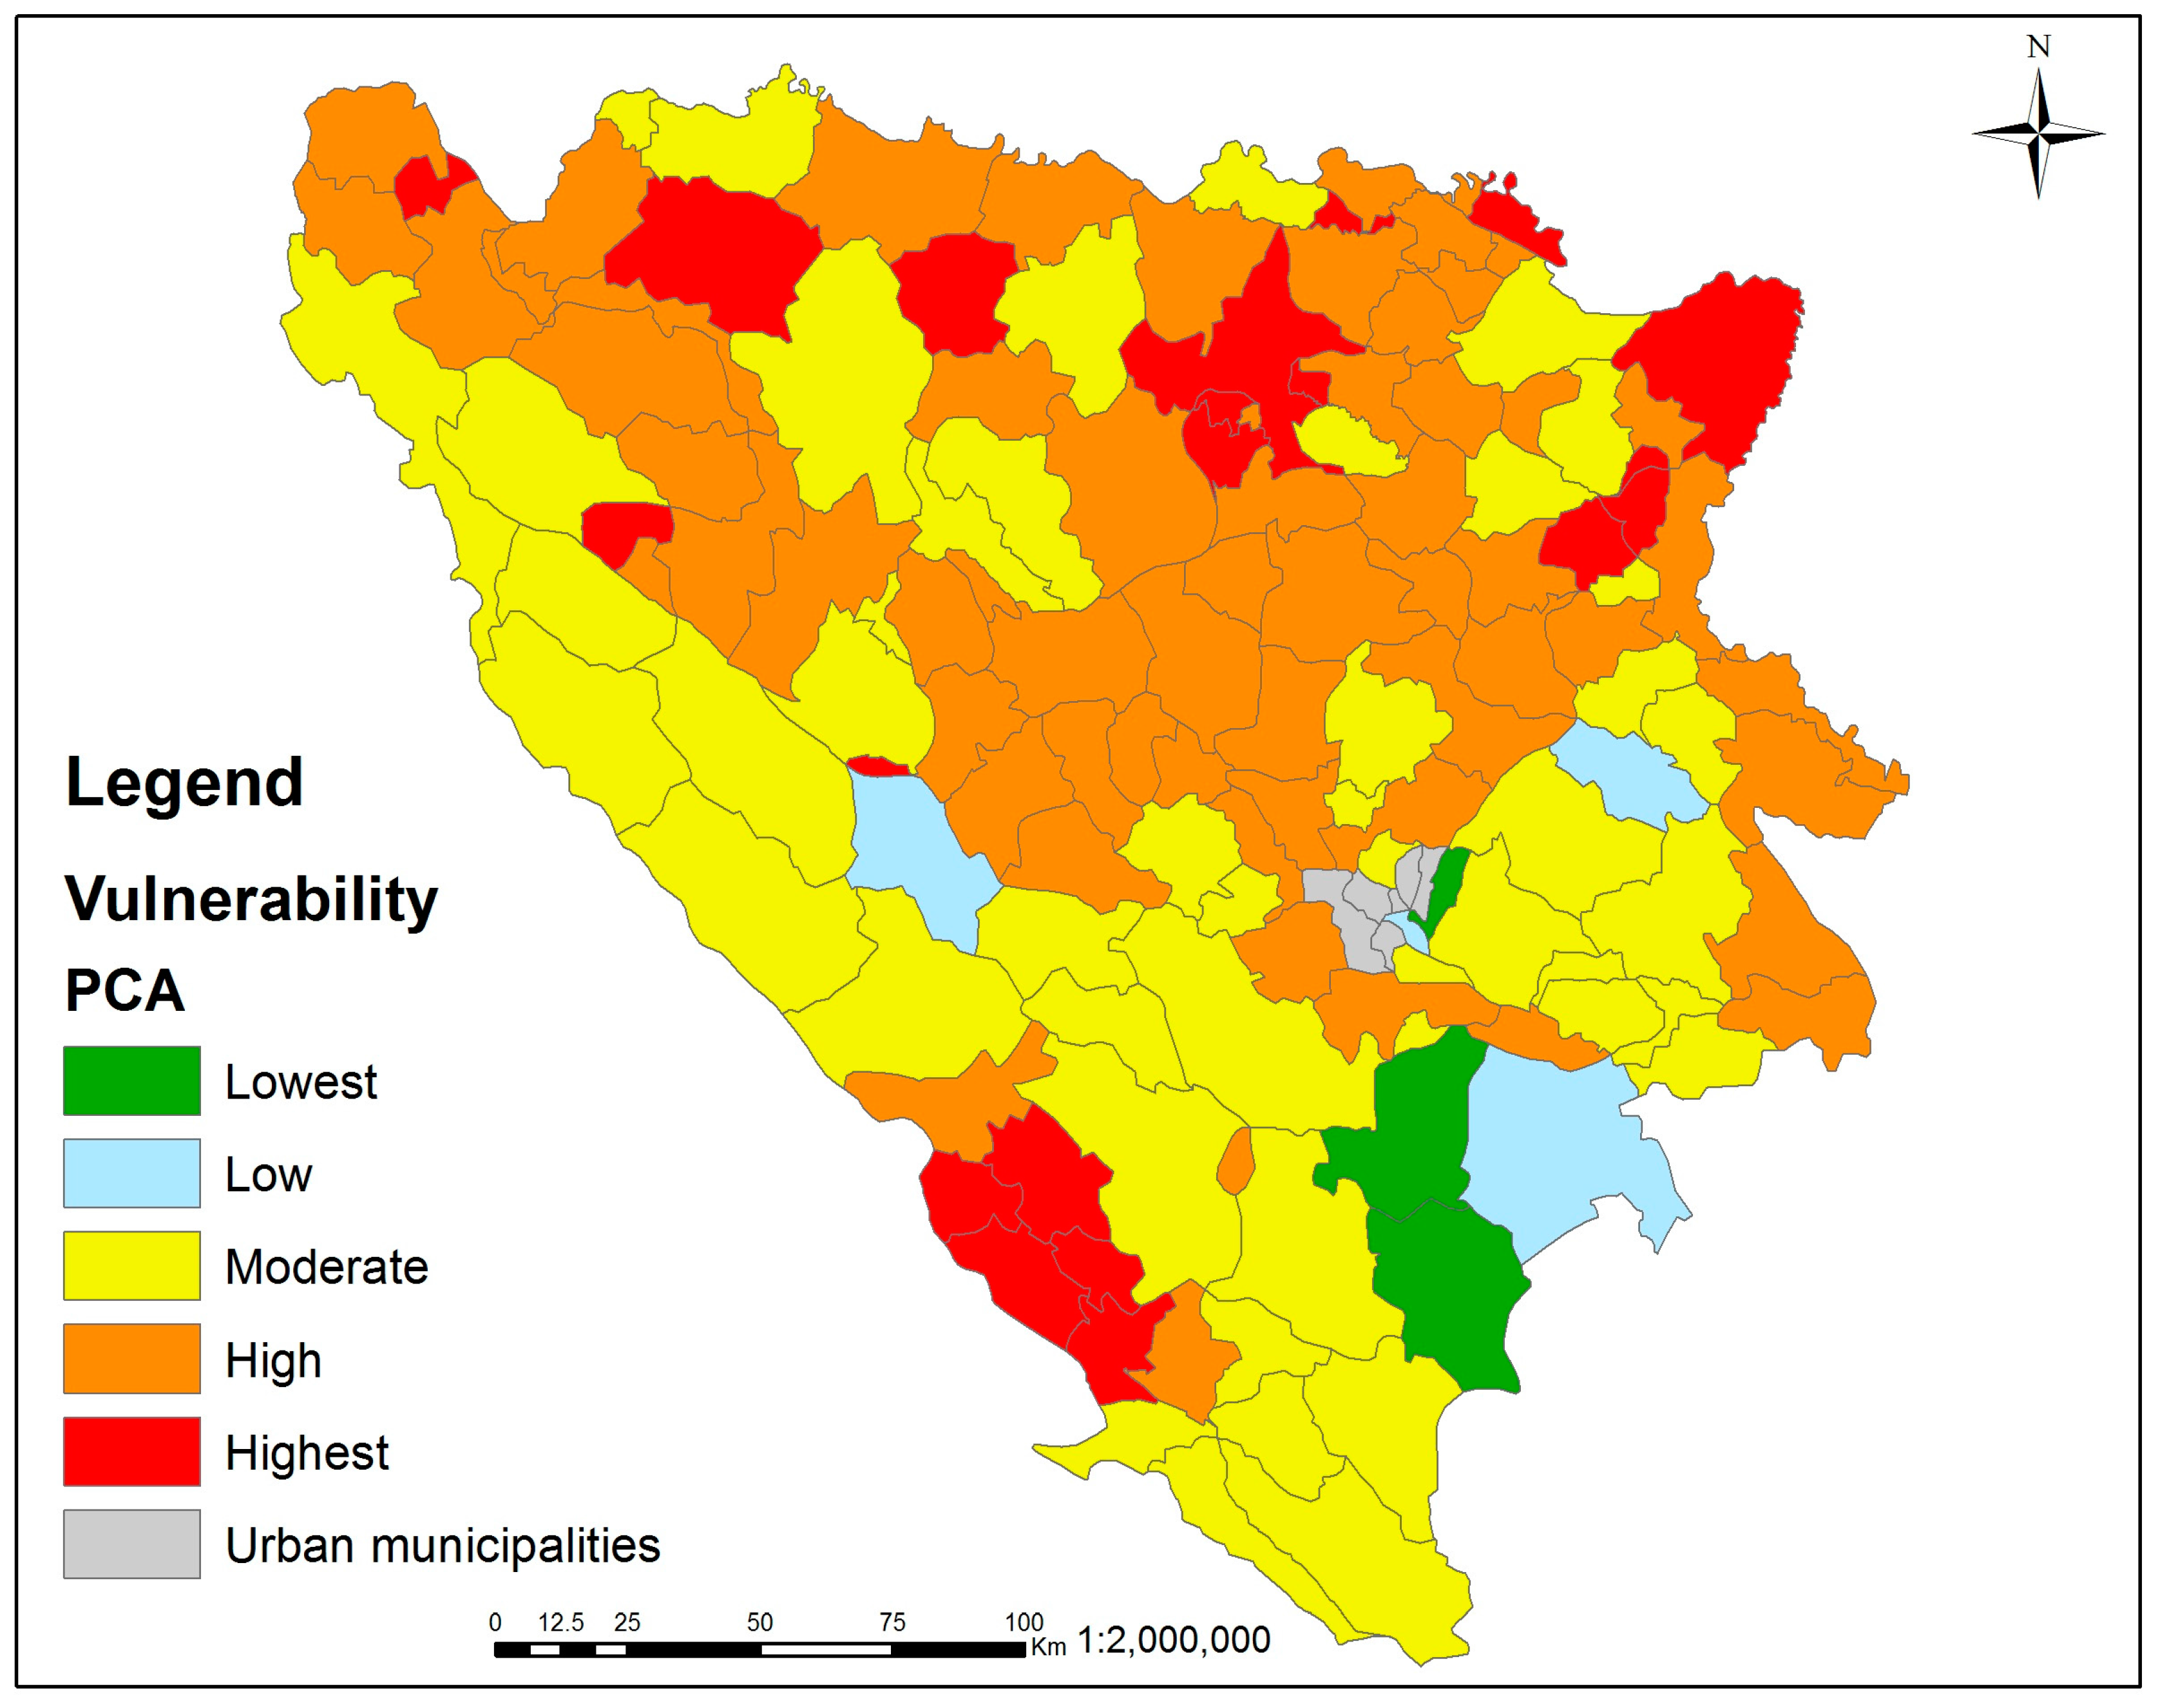
According to Filmer and Pritchett, the absolute value of the loading of the first single component is valid for assigning weights. This method was used in Gbetibouo et al. [12] to assign weights and construct an overall vulnerability index. In the case of our study, we decided to retain all components with eigenvalues greater than one, as recommended by Kaiser [45], in order to avoid a higher degree of uncertainty in our results caused by significant dimension reduction, since the first component describes only 23% of variance. In this study, six components had an eigenvalue greater than one and together they explained 71.1% of the variance observed. Using factor analysis, we assigned weights for all variables (indicators). The value of the Kaiser-Meyer-Olkin measure of sampling adequacy was 0.719, which is acceptable for factor analysis, as well as the significance level of Bartlett’s test of sphericity (p < 0.001). The sum of weighted variables for every municipality represents an overall vulnerability index as shown in Figure 3.
Compared to EW, nearly half of the municipalities retained the same class of vulnerability (46.3%), while 41.9% and 8.1% of the municipalities had increased or decreased vulnerability class, respectively. More substantial changes in vulnerability class occurred in the case of five municipalities, which had their class increased by two. Although the apparent increase in the number of vulnerable municipalities is evident, the general geographic distribution of vulnerability using weighted indicators did not markedly change compared to equally weighted indicators. Most vulnerable municipalities are still located in the north, and the least vulnerable ones in the east and southeast of BH. However, there was an increase in the number of highly vulnerable municipalities in central and western BH, as well as an overall increase in vulnerability in the south. Overall, most notable is the decrease in the number of municipalities with low vulnerability indices, while there was an increase in the number of municipalities with the highest and high classes of vulnerability.
The difference in results between the two selected methods results from participation of individual indicators in the formation of the composite indices. This is conditioned by (1) summarizing method and (2) contribution of individual indicators in generation of composite indices determined by weights. The final value of the vulnerability index for our first method (EW) was obtained from the arithmetic sum of two sub-indices (PI and AC), while in the second method (PCA) a single composite index was generated from the arithmetic sum of all weighted indicators. The weighting method had a significant impact on our results. When using EW, every indicator had an equal impact on the final sub-index value, depending on whether or not it belonged to one of the three groups of indicators, while the weights used for some indicators in our study were so low they did not substantially affect the vulnerability index in the case of PCA as a weighting method. Only four indicators (average yields, road length, changes in temperature, and precipitation) had weights (loadings) above 0.3 and were therefore the main determinants of vulnerability, while nine indicators had weights below 0.1 (Supplementary Table S1). The difference in results between two weighting methods used in this study was expected, since only six components were extracted from PCA and they account for 71.1% of variance. Similar differences between these two summarizing and weighting methods were reported by Wiréhn et al. [23].
While EW and PCA are some of the common weighting methods found in the relevant literature, other methods are used, such as inverse of variance and expert opinion [44]. Each of these methods has its own constraints and the scientific debate about the optimal approach is as old as the first attempts to quantitatively assess vulnerability. The arbitrary strategy of assigning equal weights to indicators might mislead the calculations, since not all indicators can have equal influence on vulnerability or may lead to difficulties in reaching a consensus among expert panel members, similar to cases where assigning weights using expert judgment is carried out arbitrarily [12]. Assigning higher weights to indicators showing lower variance may ensure that large variations among the indicators would not unduly dominate the contribution of the rest of the indicators and distort inter regional comparisons. However, a downside to this approach is the suppression of the pronouncement of relevant indicators [43]. Using PCA, it is not guaranteed that correlations necessarily represent the real, or even statistical, influence of used sub-indicators on the phenomenon the composite indicator is measuring [47].
Representation of vulnerability with the single index might bring an insight about the degree of vulnerability on a sub-national level and identify the most vulnerable regions. However, such an approach may also be misleading and lead to simplistic policy conclusions [12,47]. In order to fully assess the “big picture”, composite indicators should be used in combination with the sub-indicators. Therefore, we used the results of our first summarizing method, which was composed of sub-indictors using EW, in order to better explain the main sources of vulnerability and the influence of different components of vulnerability in the development of the overall vulnerability index in the next section.
5.2. Influence of Different Components of Vulnerability on the Overall Vulnerability Index
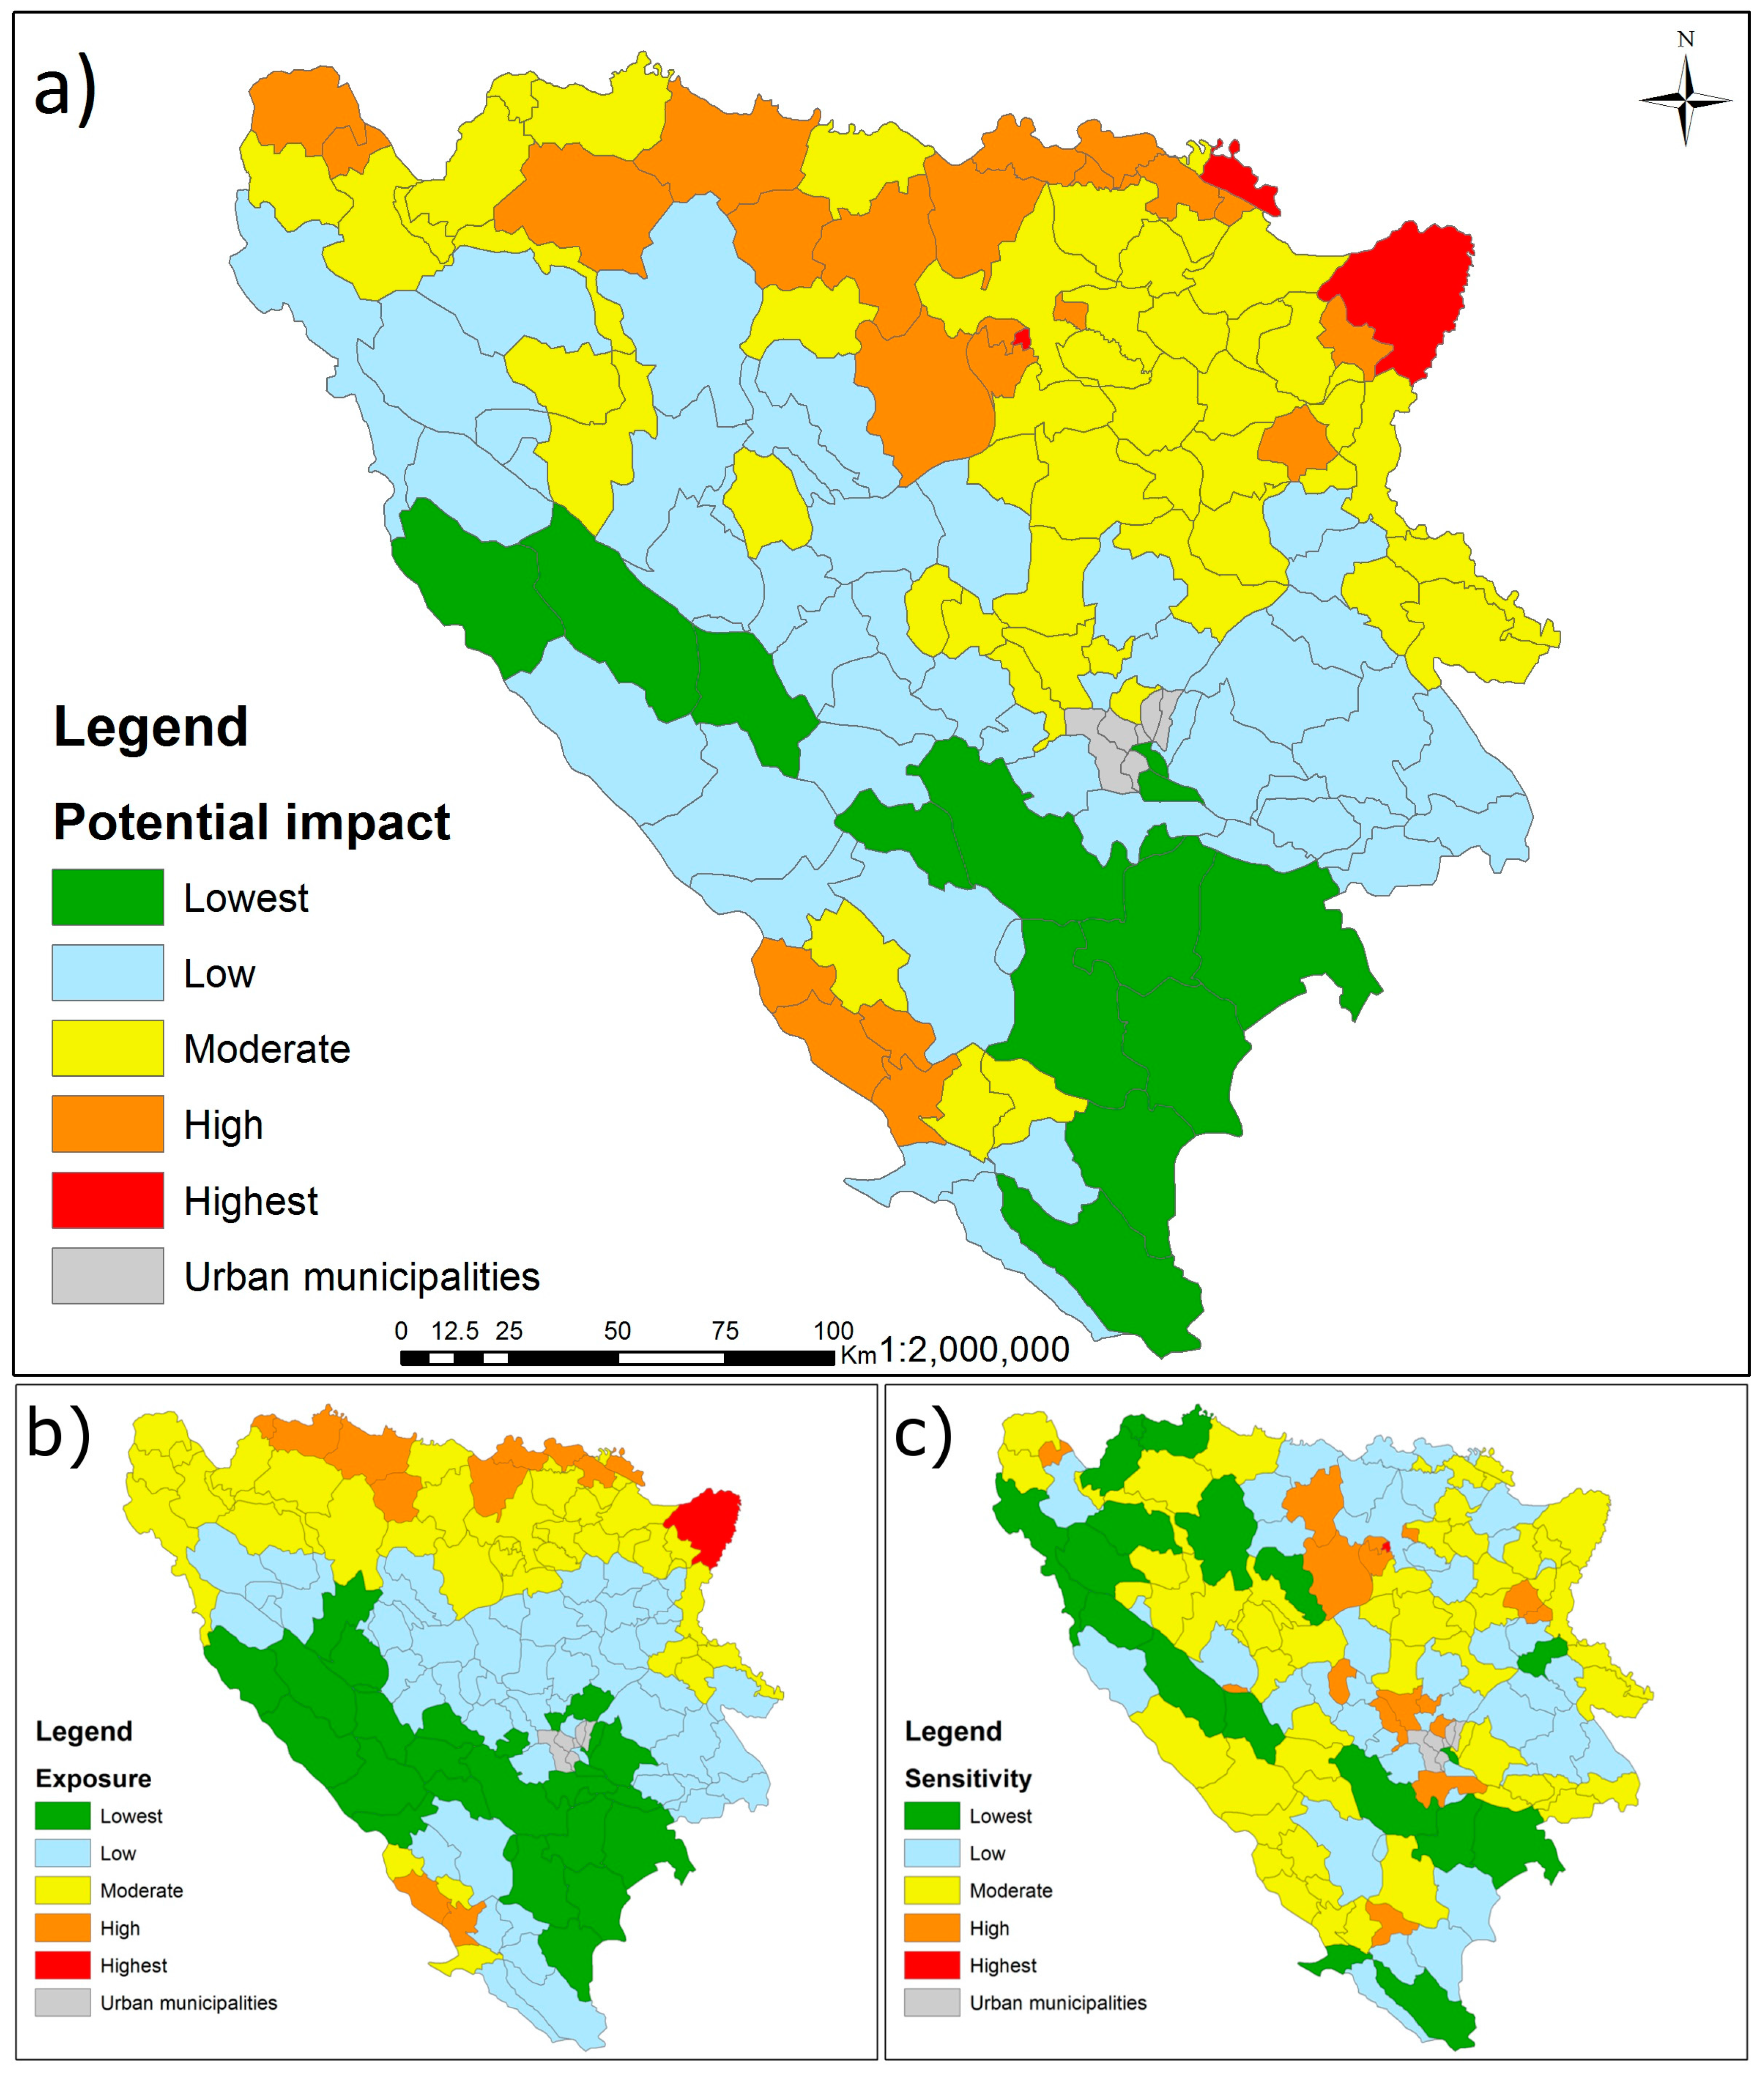
According to the PI index shown in Figure 4a, it is notable that the municipalities experiencing a high degree of PI from current climate variability are located in the northern part of BH, with the exception of four municipalities located on the south-western edge of the country. However, PI is composed of exposure and sensitivity [17] and therefore we have further decomposed the PI index into these two sub-indices in order to better understand the main sources contributing to PI index, as well as the degree and interaction between the components which form PI, as shown in Figure 4b,c.
Figure 4b shows the evident difference in degree of exposure between the hilly-mountainous parts of BH, which stretch from the north-west to the south-east, and the rest of the country (Figure 1). The main cause of high exposure in the northern part of BH is the highest difference in average yearly temperatures and the higher incidence of months with extreme weather conditions, while the south-western region has experienced the highest difference in the amount of precipitation. Two municipalities on the northern border of the country with the highest degree of PI are also highly vulnerable to flooding. These municipalities are in the plain region and located next to the river Sava, the biggest river in BH, which constitutes the northern border of BH and the tributaries in the territory of which BH forms the second largest sub-basin of the Danube river basin. The southern part of the country is the warmest, with a prevailing Mediterranean climate (unlike the rest of the country, which has different forms of the continental and alpine climates). The degree of exposure to climate change in these regions will continue to increase according to regional projections, with an expected average temperature increase of 4 °C in the coming decades, especially in the northern part of the country [8]. According to the same model, an additional unfavorable factor, which will affect the southern part of the country, is the further reduction in annual precipitation, especially during summer, while no significant changes in the amount of precipitation are expected in the rest of the country.
The observed sensitivity of municipalities in this study is quite heterogeneous geographically, as shown in Figure 4c. Similarly, the main indicators found to have the largest influence on sensitivity were variable. Municipalities from the central, mountainous part, or those found in the karst areas of the south, are limited by shallow and less fertile soils. The rest of the municipalities located mostly towards the north consist of highly rural communities with limited sources of income aside from agriculture. Other main characteristics identified in these areas are a high percentage of agricultural land and increased population pressure on it, which results in a low area of agricultural land per capita. It is important to note that central and eastern BH are rich in natural resources, especially water and mineral ores; therefore, they are not highly dependent on agriculture, as a large part of the industrial production in the country is based in these regions.
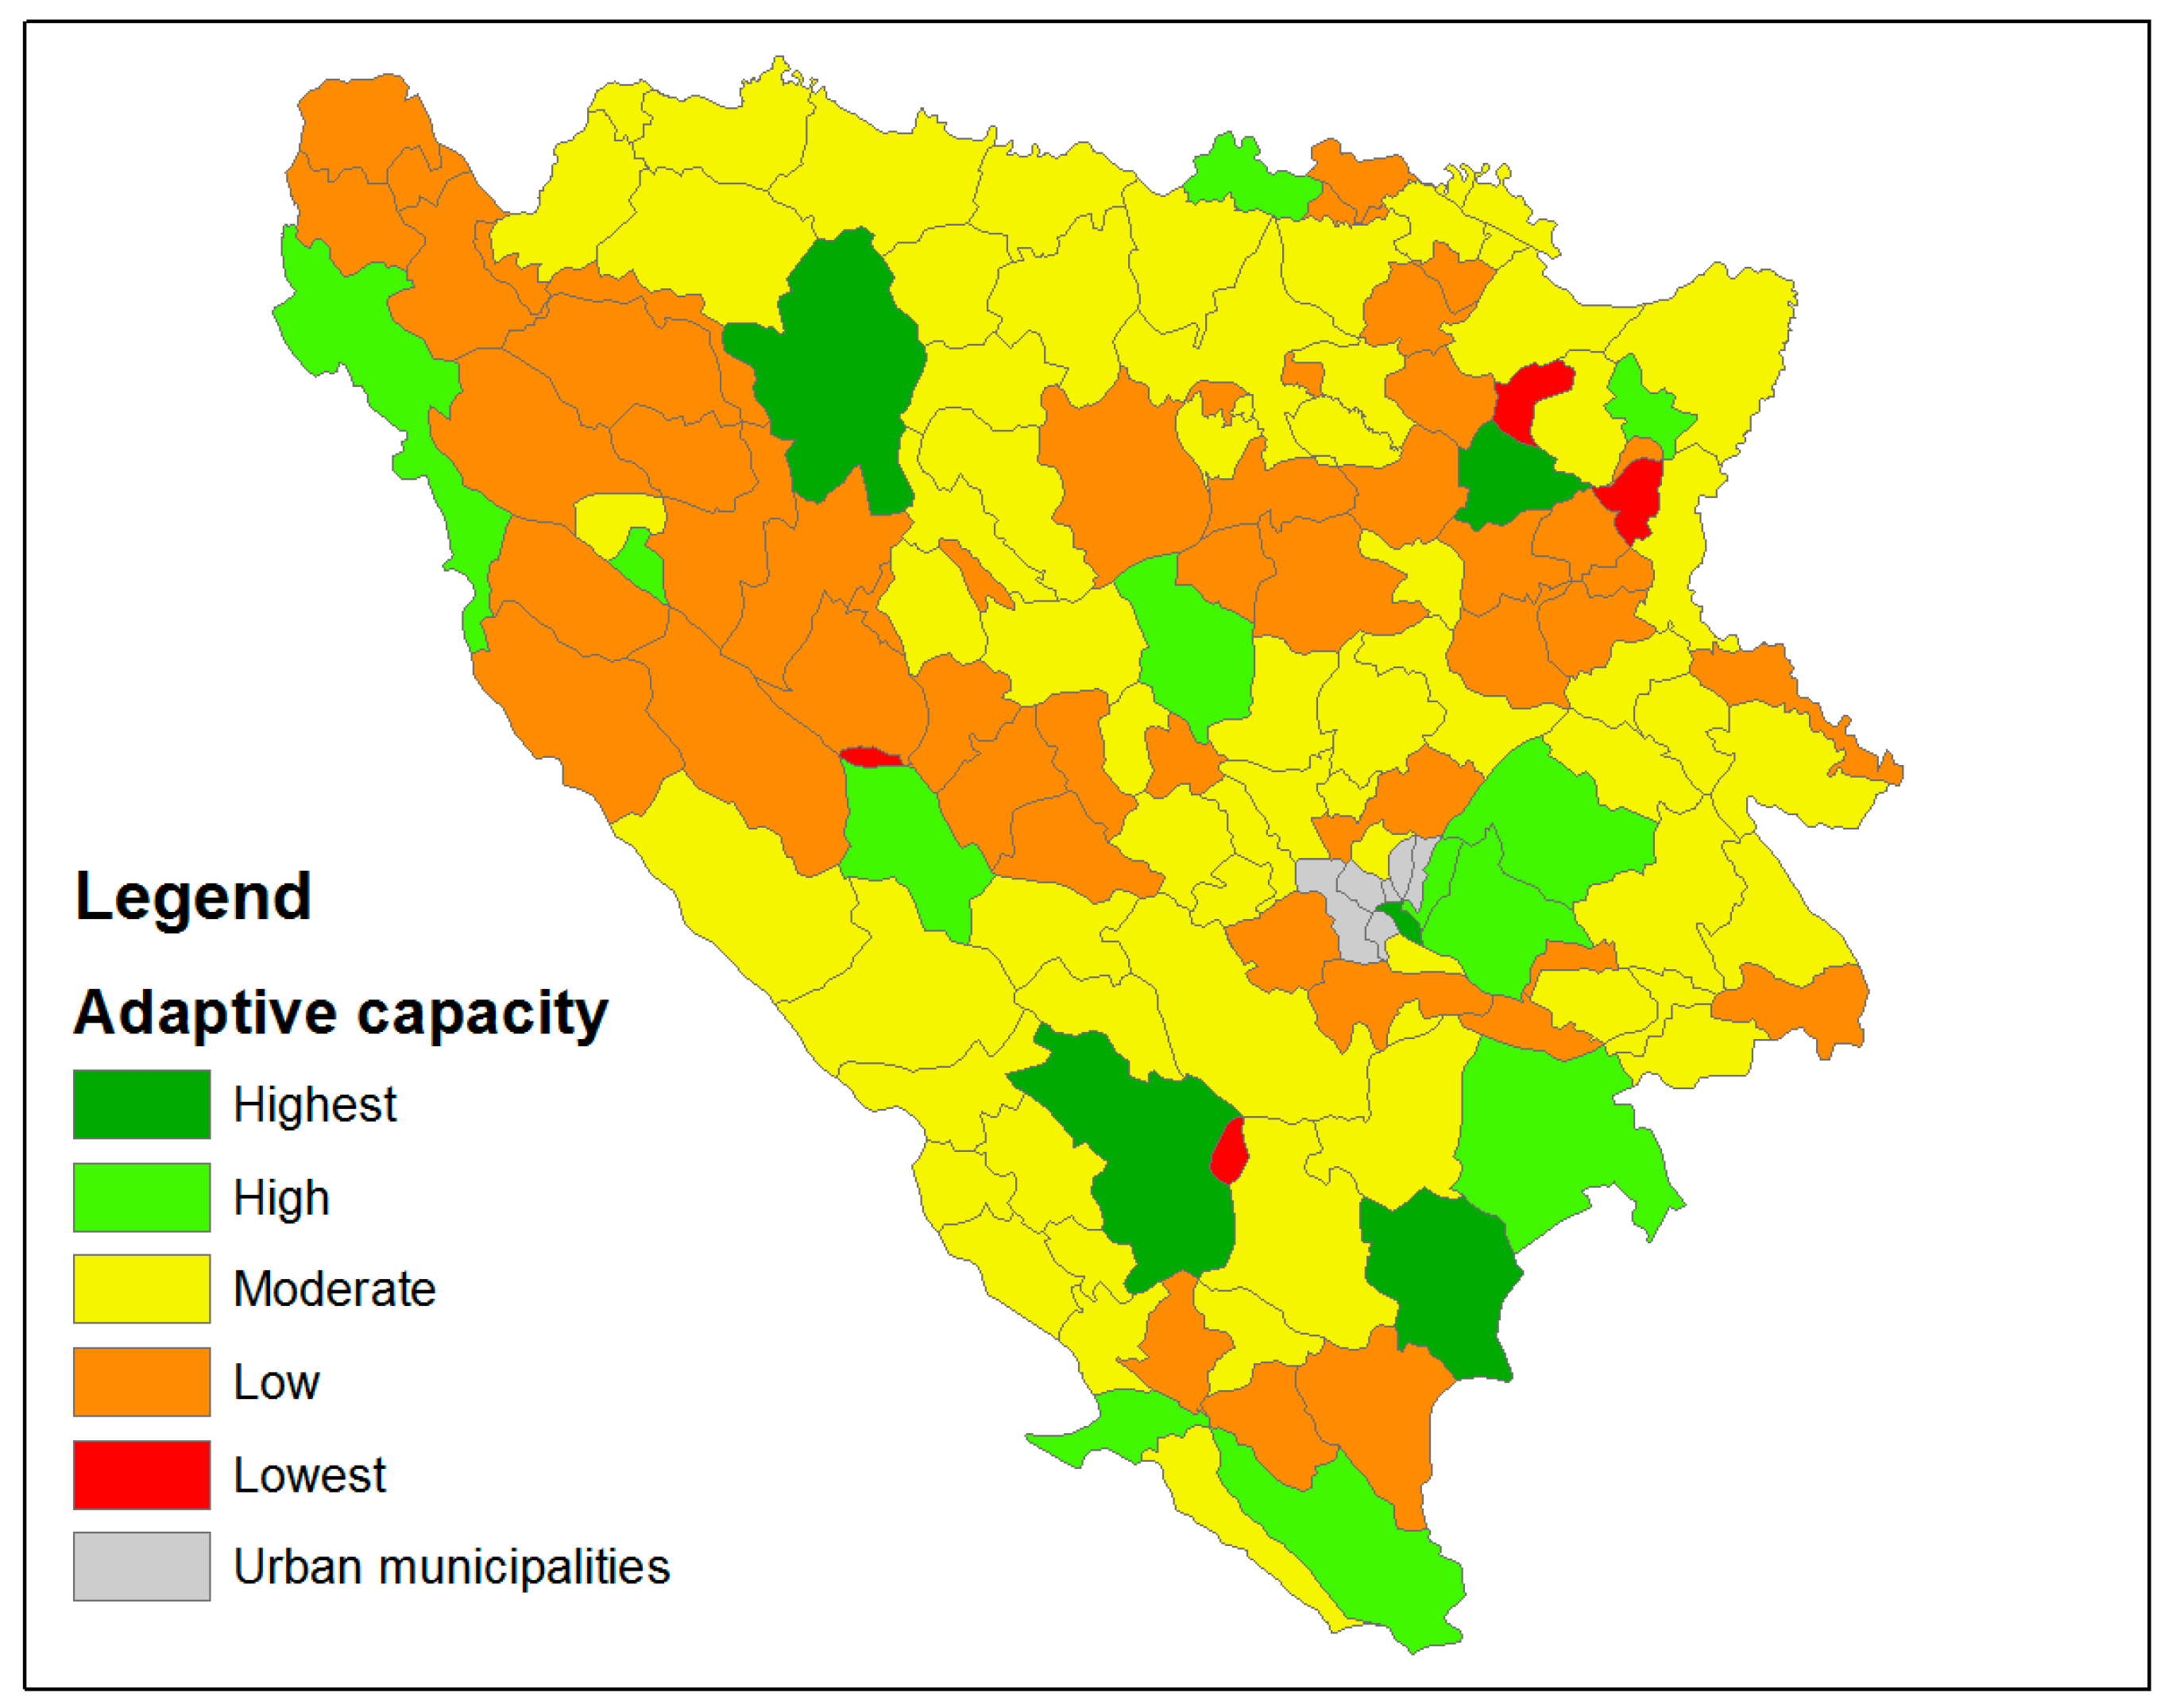
The situation is diverse when it comes to the adaptive capacity of municipalities, shown in Figure 5. However, some common characteristics are found between the municipalities with low and high adaptive capacity. Municipalities with the highest adaptive capacity have a larger GDP and lower unemployment rates. This is mainly due to the presence of larger towns or cities located within their borders, which likely creates more business opportunities for the local population. Some municipalities have developed into industrial and entrepreneurial centers in the past two decades, with a multitude of varying business activities varying from small to large in size and in outputs/activities [48]. On the other hand, municipalities with low adaptive capacity were found to have a high dependency ratio, underdeveloped infrastructure, public and social services, and high unemployment rates. A significant percentage of the population in these municipalities are smallholder farmers engaged in extensive, often subsistence, agriculture [2].
The example from Table 2 is used to gain a more detailed insight into the main determinants of vulnerability in the nine most vulnerable municipalities in BH. Looking at the overall results based on the vulnerability index and two sub-indices from which the overall vulnerability index is composed, it is clear that the most vulnerable rural municipalities in BH are those with the high degree of PI, as well as low AC to cope with this impact. Furthermore, when the two components which generate PI (exposure and sensitivity) are analyzed separately, there is a difference as to which component determines the higher degree of PI. Apart from the most vulnerable municipality of Bijeljina, which is much more vulnerable to flooding than the rest of the municipalities of BH, it is evident that the sensitivity index is the main determinant of PI, rather than the exposure index. Therefore, it can be concluded that the current socio-economic conditions (social vulnerability) and the increased environmental pressure as a result of the present human-environment interactions are usually the main determinant of vulnerability in the most vulnerable municipalities, rather than the degree to which these municipalities are exposed to significant climatic variations (biophysical vulnerability).
5.3. Future Considerations for Quantitative Assessment of Vulnerability to Climate Change with Special Focus on Choice of Biophysical Indicators
The results indicate variability between the chosen summarizing and weighting methods, which would certainly increase even more if additional methods from recent studies were used for further comparison, as shown by Wiréhn et al. [23]. Development of the vulnerability index involves sequential stages, including the selection of indicators, their normalization, and summation to a final value. There is a significant degree of uncertainty in vulnerability assessments and data transformation in these stages, as described in more detail by Tate [49]. Also, while a number of indicators have been used and developed for assessing vulnerability, the choice of indicators should be context and region-specific, as there is no “one size fits all” blueprint that can be used regardless of the context [50]. Based on these arguments and the experiences which we obtained during the preparation of this study, as well as reviewing literature related to vulnerability assessment in the context of agriculture and climate change, we would like to emphasize the importance of the right choice of biophysical data when doing local vulnerability assessments to climate change. We believe that the indicators used to measure exposure, such as frequency of extreme weather events (such as drought and floods) and variation of temperature and rainfall, might be misleading depending on the climate zone in which the study is conducted, as they may not fully capture the magnitude and the extent of such events.
Drought is a normal, recurring feature of climate, which occurs in all climatic regimes (in contrast to aridity, which is a permanent feature of the climate and is restricted to low rainfall areas [51]). Like vulnerability, drought has both a natural and social component, i.e., the risk associated with drought is a product of both the region’s exposure to the drought, as well as the resilience of the ecosystem or adaptive capacity of that region [52]. Impacts also differ spatially and temporally, as well as depending on the type of drought. Drought has been grouped by type as follows: meteorological, hydrological, agricultural, and socioeconomic [53]. Meteorological droughts result from precipitation deficiencies, while agricultural droughts are largely the result of soil moisture deficiencies. Agriculture is usually the first economic sector to be affected by drought because soil moisture supplies are often quickly depleted, especially if the period of moisture deficiency is associated with high temperatures and windy conditions [51].
Similar to drought, waterlogging is another phenomenon which limits agricultural productivity. Unlike floods, which are in a more conventional sense defined as an overflow of water from water bodies, waterlogging occurs when the soil becomes saturated in cases when the amount of precipitation exceeds the ability of the soil to infiltrate or evaporate the excessive moisture. Like in the case of drought, the extent and duration of waterlogging is mainly related to climatic and soil water-physical properties [54]. Waterlogging causes anaerobic conditions in the crop-root zone and leads to reduced crop growth and yields; it also delays agricultural field operations, such as tillage and harvesting, and can lead to abundant surface runoff, inducing soil erosion and the loss of nutrients [55,56,57].
Based on the above definitions, we believe that agricultural drought should be the starting point when using drought as an indicator of agricultural vulnerability to climate change, and that the impact of drought should be based on soil moisture, not meteorological data. We also believe that waterlogging of heavy soils in humid, and in some cases sub-humid, areas, especially flatlands and valleys, can cause the same amount of damage as drought, and therefore we recommend it as an important indicator when assessing exposure to climate change in such conditions. For the purposes of this study, the approach developed by Wells and Goddard [33] was used to classify Palmer Z-index values and calculate the frequency of extreme months (both dry and wet) in the last 50 years, which was used as an indicator for exposure in our study. Most studies related to climate hazard analyses and monitoring systems have been conducted using either: (1) The Palmer Drought Severity Index (PDSI) or Palmer moisture anomaly index (Z Index) [24], based on a soil water balance equation; or (2) The Standardized Precipitation Index (SPI) [58], based on a precipitation probabilistic approach. They are called drought indices, but they have ability to measure dryness (negative values) and wetness (positive values) at the same time. The Palmer drought indices show how monthly moisture conditions differ from normal conditions for the specific area based on available soil water content, reference evapotranspiration, and precipitation, and they are sensitive to unusual dry (and wet) months even in extended dry (or wet) spells. While PDSI is used to quantify the long-term changes in soil moisture, the Z-index is usually used for detection of short-term deviations from normal moisture conditions, which are important for agriculture and were therefore included as an indicator in our study [59].
SPI can also be calculated at different time scales to monitor droughts with respect to different usable water resources. However, it might not be suitable for climate change analysis, since it does not take temperature or evapotranspiration as input parameters [60]. A new climatic drought index similar to SPI, the Standardized Precipitation Evapotranspiration Index (SPEI), has been proposed recently by Vicente-Serrano et al. [61]. SPEI is similar to SPI, but includes temperature as a parameter of calculation, which makes it closer to PDSI. As such, it has been already used in studies concerning agriculture and climate change, e.g., [62,63], and with its multiscalar character is suitable to use in drought-related vulnerability assessments.
6. Conclusions
This study was a first assessment of vulnerability to climate change at the sub-national level in BH. Quantitative assessment of vulnerability to climate change in rural municipalities was carried out for 136 rural and semi-rural municipalities in BH. The chosen conceptual framework for this research, based on the IPCC definition of vulnerability, views vulnerability as a function of biophysical and social indicators, which constitute the three components of vulnerability: exposure, sensitivity, and adaptive capacity. 20 biophysical and socio-economic indicators were used to reflect these three components. For the purposes of our study, we decided to use two different summarizing and weighting methods (EW and PCA) to assess vulnerability to demonstrate the differences between them.
Based on the results obtained for the overall vulnerability index using the first summarizing method and EW, the most vulnerable municipalities are mostly located across the north, with the gradual decrease in vulnerability towards the central, northern and eastern parts of the country. Less vulnerable municipalities are those with larger towns and cities within their territory and the ones located in hilly-mountainous central-south, central-west and south-eastern regions. From there, towards the south of BH, most of the municipalities in the Mediterranean lowland region of southern BH are classified as highly vulnerable, while municipalities in the surrounding region are mostly classified as low or moderately vulnerable. General geographic distribution of vulnerability using the second summarizing method and weighted indicators did not change substantially compared to the first method. However, there was an overall increase in the number of highly vulnerable municipalities, most notably in the central, east, and south of BH, while the number of municipalities with low vulnerability index decreased.
We used the results of our first summarizing method using EW to better explain the main sources of vulnerability and the influence of different components of vulnerability on the development of the overall vulnerability index. Based on these results, it was concluded that the current socio-economic conditions (adaptive capacity) and increased environmental pressure as a result of present human-environment interactions (sensitivity) are the usually the main determinants of vulnerability in the most vulnerable municipalities, rather than the degree to which these municipalities are exposed to significant climatic variations.
The results of this study provided valuable knowledge about the current state of vulnerability of the rural population of BH to climate change and the main determinants of vulnerability. They also establish a baseline, which can be further updated at regular intervals, and they represent the first step towards further local assessments and improvements, as new indicators become available and are discussed by the main stakeholders and the local communities. The same or similar approaches can also be applied in regions with similar climatic and socio-economic conditions, particularly the countries of the Western Balkan region and South-eastern Europe.
Supplementary Materials
The following are available online at www.mdpi.com/2071-1050/9/7/1208/s1, Figure S1: Administrative structure and municipalities of Bosnia and Herzegovina, Figure S2: Climate zones of Bosnia and Herzegovina according to Köppen-Geiger climate classification, Table S1: Factor loadings for extracted principal components.
Acknowledgments
This study was supported by the project “Agricultural Adaptation to Climate Change—Networking, Education, Research, and Extension in the West Balkans”, funded by HERD, the Programme for Higher Education, Research and Development 2010–2014. The authors are very grateful to Espen Sjaastad and the anonymous reviewers for valuable comments and suggestions during the earlier versions of the manuscript. We would also like to thank Hamid Čustović, Goran Trbić, Davorin Bajić, Sretenka Srdić, and the hydrometeorological institutes in BH for providing some of the datasets used in this study, and Maria Hayes for proofreading the manuscript. The open access publishing costs were covered by the publishing fund of the Norwegian University of Life Sciences (NMBU).
Author Contributions
Ognjen Žurovec conceived the study, chose the framework and methods, analyzed the data and wrote the paper; Sabrija Čadro analyzed the weather data and drought indices; Bishal Kumar Sitaula contributed significantly with writing and feedback during every stage of the manuscript.
Conflicts of Interest
The authors declare no conflict of interest.
References
- United Nations Framework Convention on Climate Change (UNFCCC). Initial National Communication of Bosnia and Herzegovina under the United Nation Framework Convention on Climate Change (INCBiH); Ministry for Spatial Planning, Construction and Ecology of Republic of Srpska: Banja Luka, Bosnia and Herzegovina, 2009.
- Zurovec, O.; Vedeld, P.O.; Sitaula, B.K. Agricultural sector of Bosnia and Herzegovina and climate change—Challenges and opportunities. Agriculture 2015, 5, 245–266. [Google Scholar] [CrossRef]
- Sharma, V.; Reddy, B.; Sahu, N. Sustainable rural livelihoods approach for climate change adaptation in western Odisha, Eastern India. Dev. Pract. 2014, 24, 591–604. [Google Scholar] [CrossRef]
- Thompson, H.E.; Berrang-Ford, L.; Ford, J.D. Climate change and food security in Sub-saharan Africa: A systematic literature review. Sustainability 2010, 2, 2719. [Google Scholar] [CrossRef]
- Adger, W.N.; Agrawala, S.; Mirza, M.M.Q.; Conde, C.; O’Brien, K.; Pulhin, J.; Pulwarty, R.; Smit, B.; Takahashi, K. Assessment of adaptation practices, options, constraints and capacity. In Climate Change 2007: Impacts, Adaptation and Vulnerability (Contribution of Working Group II to the Fourth Assessment Report of the Intergovernmental Panel On Climate Change); Parry, M., Canziani, O., Palutikof, J., van der Linden, P., Hanson, C., Eds.; Cambridge University Press: Cambridge, UK, 2007. [Google Scholar]
- Sullivan, C.; Meigh, J. Targeting attention on local vulnerabilities using an integrated index approach: The example of the climate vulnerability index. Water. Sci. Technol. 2005, 51, 69–78. [Google Scholar] [PubMed]
- Council of Ministers of Bosnia and Herzegovina. Climate Change Adaptation and Low-Emission Development Strategy for Bosnia and Herzegovina. Available online: http://www.ba.undp.org/content/bosnia_and_herzegovina/en/home/library/environment_energy/climate-change-adaptation-and-low-emission-development-strategy-/ (accessed on 4 August 2016).
- United Nations Framework Convention on Climate Change (UNFCCC). Second National Communication of Bosnia and Herzegovina under the United Nation Framework Convention on Climate Change (SNCBIH); Ministry for Spatial Planning, Construction and Ecology of Republic of Srpska: Banja Luka, Bosnia and Herzegovina, 2013.
- Agrawal, A. Local institutions and adaptation to climate change. In Social Dimensions of Climate Change: Equity and Vulnerability in a Warming World; Mearns, R., Ed.; The World Bank: Washington, DC, USA, 2010; pp. 173–198. [Google Scholar]
- Preston, B.L.; Brooke, C.; Measham, T.G.; Smith, T.F.; Gorddard, R. Igniting change in local government: Lessons learned from a bushfire vulnerability assessment. Mitig. Adapt. Strateg. Glob. Chang. 2009, 14, 251–283. [Google Scholar] [CrossRef]
- Füssel, H.-M. Vulnerability: A generally applicable conceptual framework for climate change research. Glob. Environ. Chang. 2007, 17, 155–167. [Google Scholar] [CrossRef]
- Gbetibouo, G.A.; Ringler, C.; Hassan, R. Vulnerability of the South African farming sector to climate change and variability: An indicator approach. Nat. Resour. Forum 2010, 34, 175–187. [Google Scholar] [CrossRef]
- Brooks, N. Vulnerability, Risk and Adaptation: A Conceptual Framework; Tyndall Centre for Climate Change Research and Centre for Social and Economic Research on the Global Environment (CSERGE), School of Environmental Sciences University of East Anglia: Norwich, UK, 2003; pp. 1–16. [Google Scholar]
- Kelly, P.M.; Adger, W.N. Theory and practice in assessing vulnerability to climate change and facilitating adaptation. Clim. Chang. 2000, 47, 325–352. [Google Scholar] [CrossRef]
- Adger, W.N. Social vulnerability to climate change and extremes in coastal vietnam. World Dev. 1999, 27, 249–269. [Google Scholar] [CrossRef]
- Intergovernmental Panel on Climate Change (IPCC). Climate Change 2001: Synthesis Report. A Contribution of Working Groups I, II, and III to the Third Assessment Report of the Integovernmental Panel on Climate Change; Watson, R.T., Core Writing Team, Eds.; Cambridge University Press: Cambridge, UK; New York, NY, USA, 2001; p. 398. [Google Scholar]
- Füssel, H.-M.; Klein, R.J.T. Climate change vulnerability assessments: An evolution of conceptual thinking. Clim. Chang. 2006, 75, 301–329. [Google Scholar] [CrossRef]
- Adger, W.N.; Brooks, N.; Bentham, G.; Agnew, M.; Eriksen, S. New Indicators of Vulnerability and Adaptive Capacity; Tyndall Centre for Climate Change Research: Norwich, UK, 2004. [Google Scholar]
- Berjan, S.; Jovanović, M.; Mrdalj, V.; Paspalj, M.; Matović, F.; Driouech, N.; El Bilali, H.; Abouabdillah, A. Rural livelihood diversification in south-eastern Bosnia: Influence of household financial management. Int. J. Environ. Rural Dev. 2014, 5, 17–22. [Google Scholar]
- Monterroso, A.; Conde, C.; Gay, C.; Gómez, D.; López, J. Two methods to assess vulnerability to climate change in the Mexican agricultural sector. Mitig. Adapt. Strateg. Glob. Chang. 2014, 19, 445–461. [Google Scholar] [CrossRef]
- O’Brien, K.; Leichenko, R.; Kelkar, U.; Venema, H.; Aandahl, G.; Tompkins, H.; Javed, A.; Bhadwal, S.; Barg, S.; Nygaard, L.; et al. Mapping vulnerability to multiple stressors: Climate change and globalization in India. Glob. Environ. Chang. 2004, 14, 303–313. [Google Scholar] [CrossRef]
- Ravindranath, N.; Rao, S.; Sharma, N.; Nair, M.; Gopalakrishnan, R.; Rao, A.S.; Malaviya, S.; Tiwari, R.; Sagadevan, A.; Munsi, M. Climate change vulnerability profiles for north east India. Curr. Sci. India 2011, 101. [Google Scholar]
- Wiréhn, L.; Danielsson, Å.; Neset, T.-S.S. Assessment of composite index methods for agricultural vulnerability to climate change. J. Environ. Manag. 2015, 156, 70–80. [Google Scholar] [CrossRef] [PubMed]
- Palmer, W.C. Meteorological Drought; US Department of Commerce, Weather Bureau Washington: Washington, DC, USA, 1965; Volume 30.
- Hydro-Engineering Institute Sarajevo (HEIS). Assessment on Floods and Landslides Risk for the Housing Sector in Bosnia and Herzegovina; Hydro-Engineering Institute: Sarajevo, Bosnia and Herzegovina, 2015. [Google Scholar]
- Federal Institute for Agropedology. FAO Soil and Terrain Database (SOTER) for Bosnia and Herzegovina: Dominant Soil Types, Scale 1:1000000; Federal Institute for Agropedology: Sarajevo, Bosnia and Herzegovina, 2000. [Google Scholar]
- European Environment Agency (EEA). Corine Land Cover Database—Bosnia and Herzegovina. Available online: http://cdr.eionet.europa.eu/ba/eea/clc/envvu5ofg (accessed on 16 August 2015).
- Agency for Statistics of Bosnia and Herzegovina—Census 2013 Data. Available online: http://popis2013.ba/ (accessed on 3 July 2016).
- Institute for Statistics of Federation of Bosnia and Herzegovina—Kantoni U Brojkama (Cantons in Numbers). Available online: http://www.fzs.ba/kantoniubrojkama.htm (accessed on 22 April 2016).
- Institute for Statistics of Republic of Srpska—Statistical Yearbook of Republic of Srpska 2014: Review by Municipalities. Available online: http://www.rzs.rs.ba/front/article/1331/?left_mi=287&add=287 (accessed on 22 April 2015).
- Ministry of Justice of Bosnia and Herzegovina—Registry of Associations. Available online: http://www.mpr.gov.ba/web_dokumenti/RU_23_03_12.pdf (accessed on 13 July 2015).
- NGO Members of the Portal. Available online: http://www.ngo.ba/index.php/nvo-clanice-portala (accessed on 16 July 2015).
- Wells, N.; Goddard, S. A self-calibrating Palmer drought severity index. J. Clim. 2004, 17, 2335–2351. [Google Scholar] [CrossRef]
- Bruinsma, J. World Agriculture: Towards 2015/2030: An FAO Perspective; Earthscan: London, UK, 2003. [Google Scholar]
- Houghton, A.; Austin, J.; Beerman, A.; Horton, C. An approach to developing local climate change environmental public health indicators in a rural district. J. Environ. Public Health 2017, 2017, 1–16. [Google Scholar] [CrossRef] [PubMed]
- Muttarak, R.; Lutz, W. Is education a key to reducing vulnerability to natural disasters and hence unavoidable climate change? Ecol. Soc. 2014, 19, 42. [Google Scholar] [CrossRef]
- United Nations Development Programme (UNDP). Rural Development in Bosnia and Herzegovina: Myth and Reality. Available online: http://hdr.undp.org/en/content/rural-development-bosnia-and-herzegovina-myth-and-reality (accessed on 10 April 2017).
- Bajić, D.; Trbić, G. Climate Atlas of Bosnia and Herzegovina; Faculty of Science: Banja Luka, Bosnia and Herzegovina, 2016. [Google Scholar]
- European Environment Agency (EEA). Climate Change, Impacts and Vulnerability in Europe 2016; An Indicator-Based Report; EEA Report No 1/2017; European Environment Agency: Luxembourg, 2017. [Google Scholar]
- Brezzi, M.; Dijkstra, L.; Ruiz, V. OECD Extended Regional Typology: The Economic Performance of Remote Rural Regions; OECD Publishing: Paris, France, 2011. [Google Scholar]
- United Nations Development Programme (UNDP). Human Development Report: Concept and Measurement of Human Development; United Nations Development Programme: New York, NY, USA, 1990. [Google Scholar]
- Palanisami, K.; Paramasivam, P.; Ranganathan, C.; Aggarwal, P.; Senthilnathan, S. Quantifying vulnerability and impact of climate change on production of major crops in Tamil Nadu, India. In From Headwaters to the Ocean: Hydrological Change and Water Management-Hydrochange; Taniguchi, M., Burnett, W.C., Fukushima, Y., Haigh, M., Umezawa, Y., Eds.; CRC Press/Balkema: Boca Raton, FL, USA, 2008. [Google Scholar]
- Varadan, R.J.; Kumar, P. Mapping agricultural vulnerability of Tamil Nadu, India to climate change: A dynamic approach to take forward the vulnerability assessment methodology. Clim. Chang. 2015, 129, 159–181. [Google Scholar] [CrossRef]
- Yusuf, A.A.; Francisco, H. Climate Change Vulnerability Mapping for Southeast Asia; Economy and Environment Program for Southeast Asia (EEPSEA): Singapore, 2009; pp. 10–15. [Google Scholar]
- Kaiser, H.F. The application of electronic computers to factor analysis. Educ. Psychol. Meas. 1960, 20, 141–151. [Google Scholar] [CrossRef]
- Cutter, S.L.; Boruff, B.J.; Shirley, W.L. Social vulnerability to environmental hazards. Soc. Sci. Q. 2003, 84, 242–261. [Google Scholar] [CrossRef]
- Saisana, M.; Tarantola, S. State-of-the-Art Report on Current Methodologies and Practices for Composite Indicator Development; European Commission, Joint Research Centre: Ispra, Italy, 2002. [Google Scholar]
- Alagić, I.; Petković, D. Economic Development of Small Areas Based on Own Resources as Opposed to Existence/Nonexistence of the Support of the Capital City. In Special editions of The Academy of Sciences and Arts of Bosnia and Herzegovina, Department of Social Science, Book 6; Osmanković, J., Pejanović, M., Eds.; The Academy of Sciences and Arts of Bosnia and Herzegovina: Sarajevo, Bosnia and Herzegovina, 2016; pp. 179–194. [Google Scholar]
- Tate, E. Uncertainty analysis for a social vulnerability index. Ann. Assoc. Am. Geogr. 2013, 103, 526–543. [Google Scholar] [CrossRef]
- Vincent, K.; Cull, T. Using indicators to assess climate change vulnerabilities: Are there lessons to learn for emerging loss and damage debates? Geogr. Compass 2014, 8, 1–12. [Google Scholar] [CrossRef]
- Wilhite, D.A. Drought as a natural hazard: Concepts and definitions. In Drought: A Global Assessment; Wilhite, D.A., Ed.; Routledge: London, UK, 2000; Volume 2, pp. 3–18. [Google Scholar]
- Zarafshani, K.; Sharafi, L.; Azadi, H.; Van Passel, S. Vulnerability assessment models to drought: Toward a conceptual framework. Sustainability 2016, 8, 588. [Google Scholar] [CrossRef]
- Wilhite, D.A.; Glantz, M.H. Understanding: The drought phenomenon: The role of definitions. Water Int. 1985, 10, 111–120. [Google Scholar] [CrossRef]
- Moore, G.A. Soilguide. In A Handbook for Understanding and Managing Agricultural Soils; Department of Agriculture and Food, Bulletin No. 4343; Department of Agriculture and Food: Perth, Australia, 2001; Chapter 3. [Google Scholar]
- Dickin, E.; Wright, D. The effects of winter waterlogging and summer drought on the growth and yield of winter wheat (Triticum Aestivum L.). Eur. J. Agron. 2008, 28, 234–244. [Google Scholar] [CrossRef]
- Drew, M.C.; Lynch, J.M. Soil anaerobiosis, microorganisms, and root function. Annu. Rev. Phytopathol. 1980, 18, 37–66. [Google Scholar] [CrossRef]
- Turtola, E.; Paajanen, A. Influence of improved subsurface drainage on phosphorus losses and nitrogen leaching from a heavy clay soil. Agric. Water Manag. 1995, 28, 295–310. [Google Scholar] [CrossRef]
- McKee, T.B.; Doesken, N.J.; Kleist, J. The relationship of drought frequency and duration to time scales. In Proceedings of the 8th Conference on Applied Climatology, American Meteorological Society, Anaheim, CA, USA, 17–22 January 1993; Volume 17, pp. 179–183. [Google Scholar]
- Vicente-Serrano, S.M.; Beguería, S.; Lorenzo-Lacruz, J.; Camarero, J.J.; López-Moreno, J.I.; Azorin-Molina, C.; Revuelto, J.; Morán-Tejeda, E.; Sanchez-Lorenzo, A. Performance of drought indices for ecological, agricultural, and hydrological applications. Earth Interact. 2012, 16, 1–27. [Google Scholar] [CrossRef]
- World Meteorological Organization (WMO). Standardized Precipitation Index User Guide; World Meteorological Organization: Geneva, Switzerland, 2012. [Google Scholar]
- Vicente-Serrano, S.M.; Beguería, S.; López-Moreno, J.I. A multiscalar drought index sensitive to global warming: The standardized precipitation evapotranspiration index. J. Clim. 2010, 23, 1696–1718. [Google Scholar] [CrossRef]
- Potop, V.; Možný, M.; Soukup, J. Drought evolution at various time scales in the lowland regions and their impact on vegetable crops in the Czech Republic. Agric. For. Meteorol. 2012, 156, 121–133. [Google Scholar] [CrossRef]
- Yu, M.; Li, Q.; Hayes, M.J.; Svoboda, M.D.; Heim, R.R. Are droughts becoming more frequent or severe in China based on the standardized precipitation evapotranspiration index: 1951–2010? Int. J. Climatol. 2014, 34, 545–558. [Google Scholar] [CrossRef]
Figure 1.
Geographical location, cities, and a digital elevation map of Bosnia and Herzegovina.
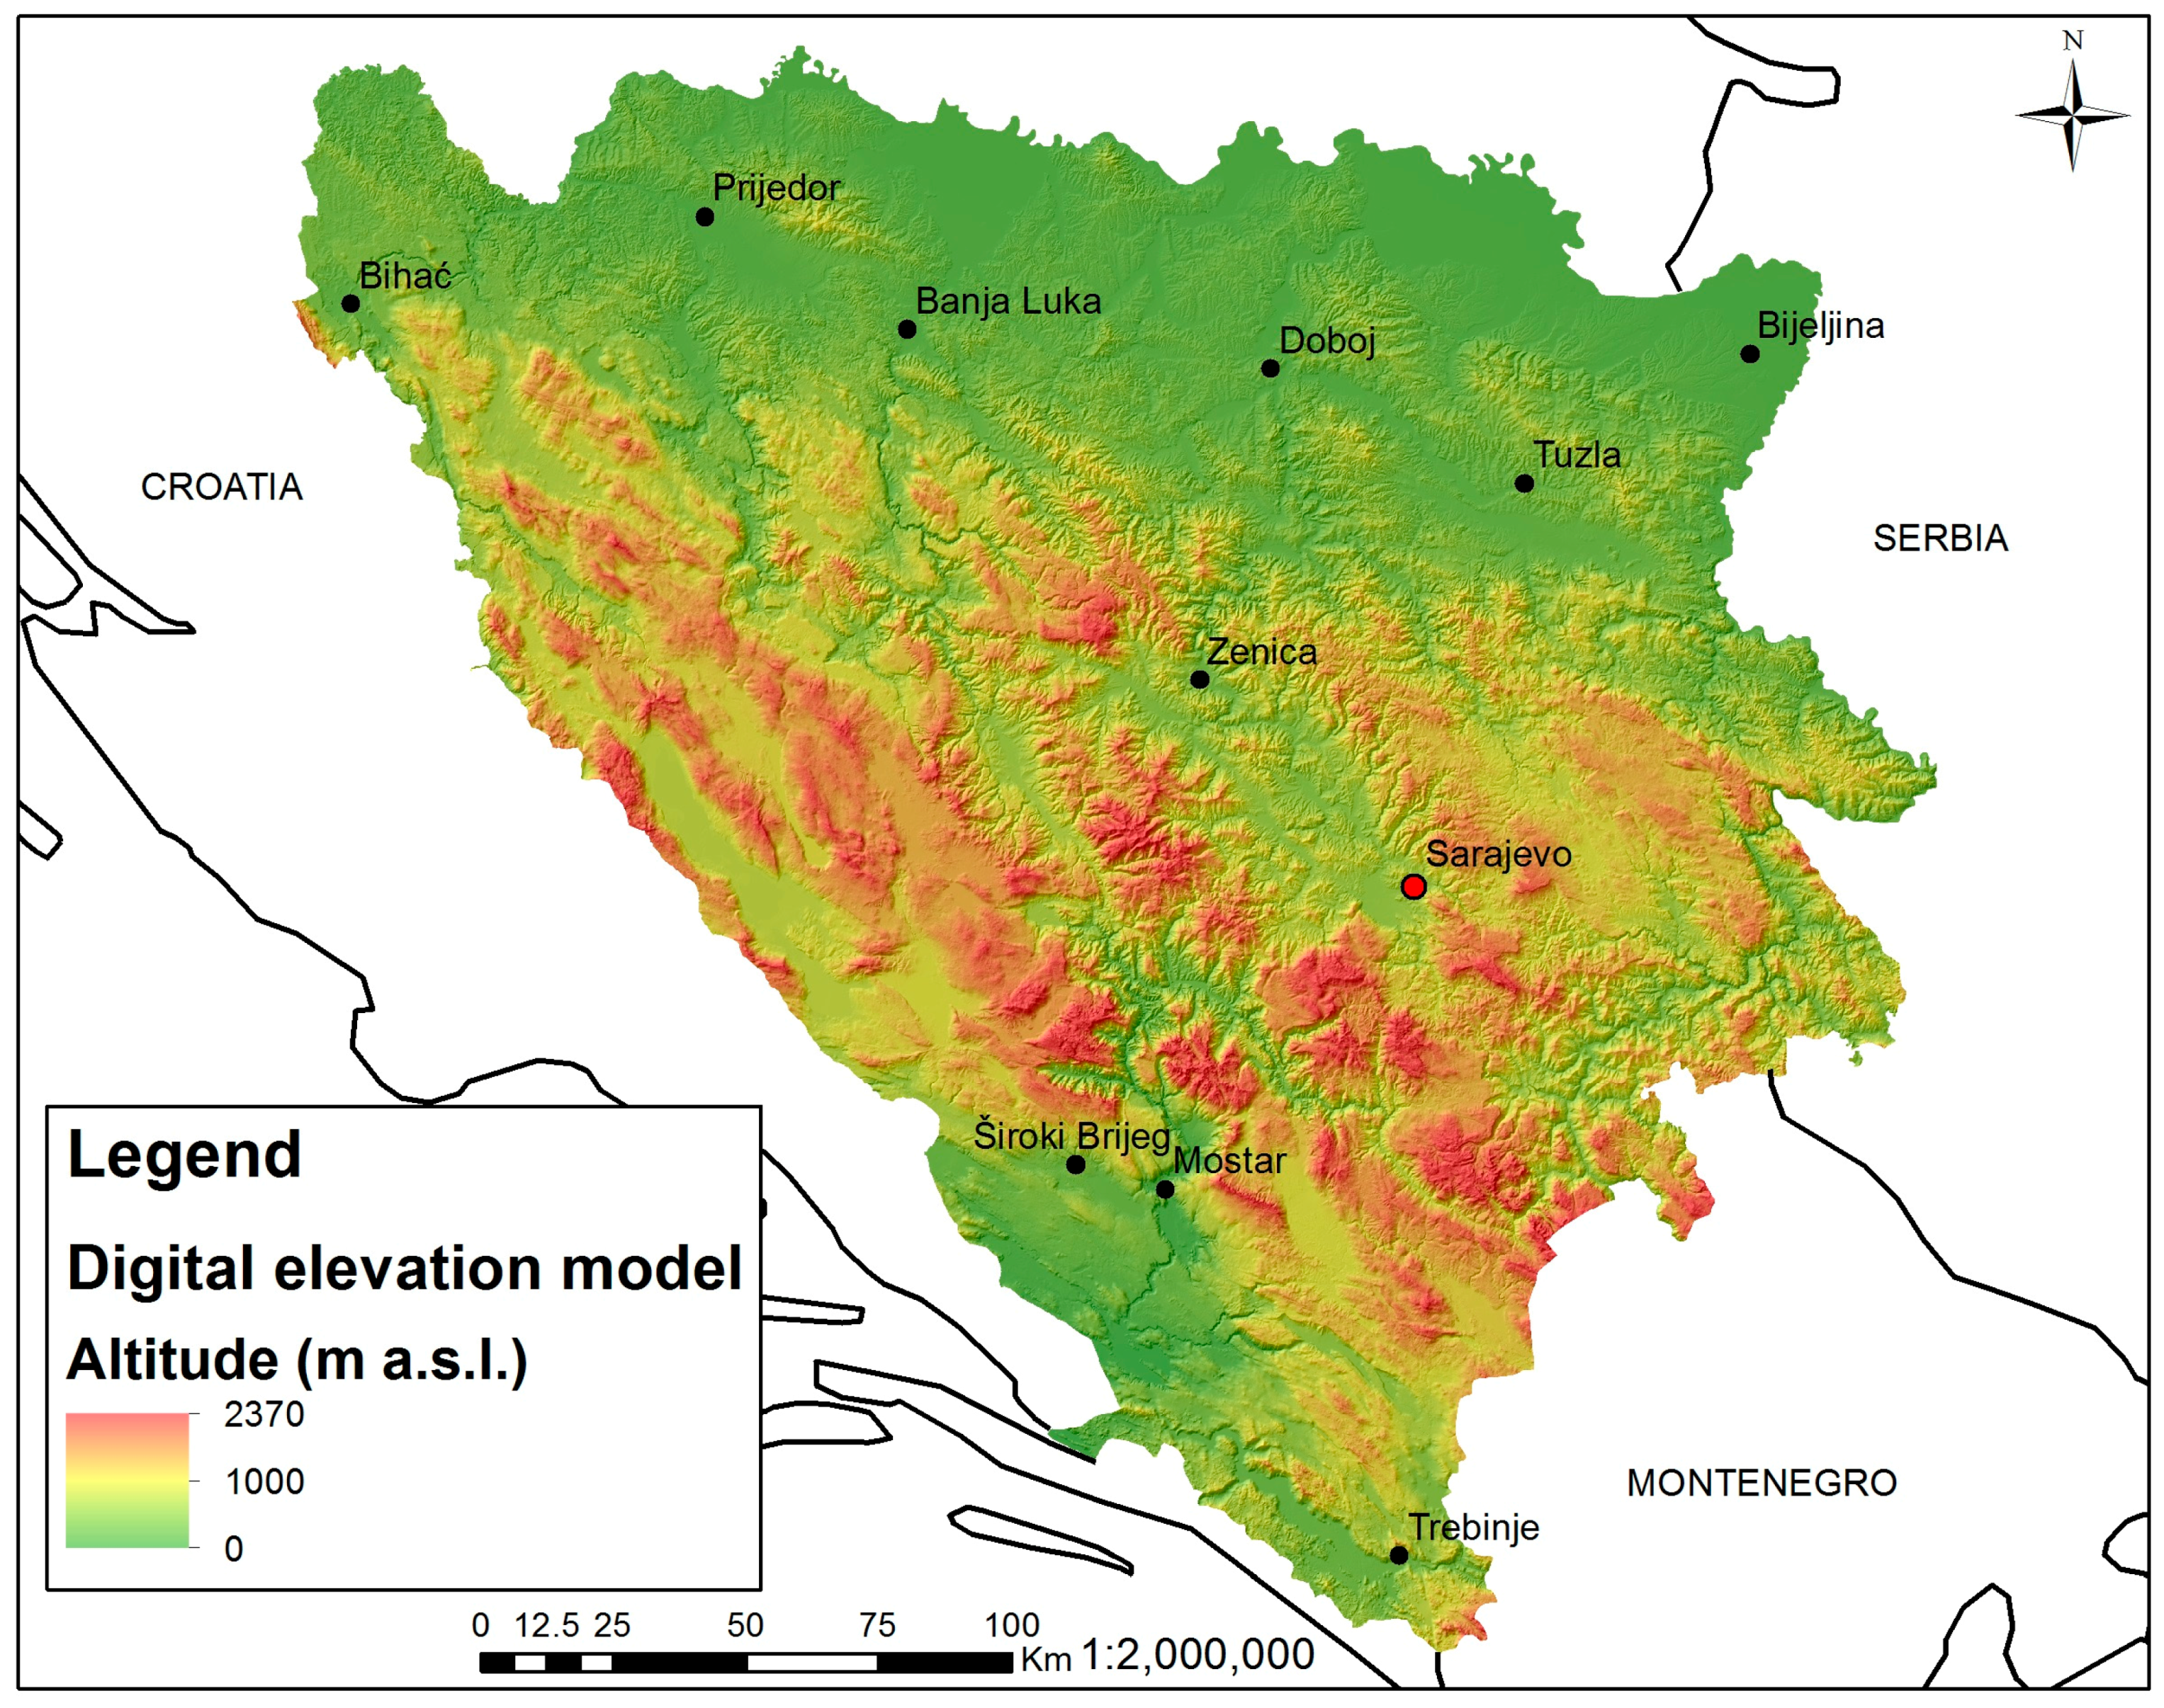
Figure 2.
Vulnerability index across municipalities using equal weights.

Figure 3.
Vulnerability index across municipalities using PCA as weighting method.

Figure 4.
(a) Potential impact index, composed of (b) exposure and (c) sensitivity.

Figure 5.
Adaptive capacity index.


Table 1.
Indicators used for the three components of vulnerability.
| Component | Indicator | Functional Relationship * | Source |
|---|---|---|---|
| Exposure | Changes in average annual temperatures between reference periods 1960–1990 and 1981–2010 1 | + | [8] |
| Changes in average annual precipitation between reference periods 1960–1990 and 1981–2010 1 | + | [8] | |
| Frequency of extreme months in the vegetation period (both dry and wet) in the analyzed period (1961–2010) according to the Palmer moisture anomaly index (Z Index) [24] | + | Authors * | |
| Flood risk assessment for the housing sector 1,a | + | [25] | |
| Sensitivity | Soil depth 2 | - | [26] |
| Percentage of agricultural land 4 | + | [27] | |
| Percentage of households engaged in agricultural production 2,a | + | [28] | |
| Percentage of rural population b | + | [29,30] | |
| Arable land per capita c | - | [27,28] | |
| Population density 1,3 | + | [28] | |
| Adaptive capacity | Unemployment rate 1 | + | [29,30] |
| GDP per capita 5 | - | [29,30] | |
| Dependency ratio 4 | - | [28] | |
| Literacy rate 1 | - | [28] | |
| Percentage of population with higher education d | - | [28] | |
| Schools per 1000 population 1 | - | [29,30] | |
| Doctors per 1000 population 1 | - | [29,30] | |
| Road length per sq. km 2 | [29,30] | ||
| Social capital (derived from total number of associations, NGOs, and foundations) 1,a | - | [31,32] | |
| Average yield for major crops (based on the yields of wheat, maize, potato, and main fruits) 3,4 | - | [29,30] |
* We calculated the frequency of extreme dry and wet months of the vegetation period for every weather station in BH which has measured the required data from 1961 to 2010. The extreme months were considered as those that had the index value lower than −3 (severe and extreme drought) and higher than 3 (very and extremely wet), based on the classification according to Wells and Goddard [33]. Positive relationship with vulnerability is assumed, since the higher frequency of extreme months increases vulnerability. 1 Indicator used in [12]; 2 Indicator used in [21]; 3 Indicator used in [22]; 4 Indicator used in [23]; 5 Indicator used in [20]; a Not identical to indicator used in the cited source; b Population in rural areas is more dependent on natural resources, has less developed infrastructure and services, as well as limited income sources compared to population in urban areas. Therefore, highly rural regions are more vulnerable [34,35]. c Used as a proxy for population pressure on available agroecosystems in the absence of any more reliable indicator. A negative correlation with vulnerability is assumed, since higher area per capita reduces the population pressure on arable land and therefore reduces vulnerability [34]. d Proxy for human capital. It is assumed that the higher percentage of the population with higher education reduces vulnerability, therefore a negative correlation with vulnerability is assumed [36].
Table 2.
The most vulnerable municipalities in BH and their rankings according to different components of vulnerability.
Table 2.
The most vulnerable municipalities in BH and their rankings according to different components of vulnerability.
| Municipality | Potential impact | Adaptive Capacity | ||
|---|---|---|---|---|
| Exposure | Sensitivity | Overall | ||
| Bijeljina | highest | moderate | highest | moderate |
| Doboj-Jug | moderate | highest | highest | moderate |
| Doboj-Istok | moderate | high | high | low |
| Orašje | moderate | high | highest | moderate |
| Usora | moderate | high | high | low |
| Tešanj | moderate | high | high | moderate |
| Kalesija | low | high | high | low |
| Bužim | moderate | high | high | low |
| Vukosavlje | moderate | moderate | high | low |
© 2017 by the authors. Licensee MDPI, Basel, Switzerland. This article is an open access article distributed under the terms and conditions of the Creative Commons Attribution (CC BY) license (http://creativecommons.org/licenses/by/4.0/).
Share and Cite
MDPI and ACS Style
Žurovec, O.; Čadro, S.; Sitaula, B.K. Quantitative Assessment of Vulnerability to Climate Change in Rural Municipalities of Bosnia and Herzegovina. Sustainability 2017, 9, 1208. https://doi.org/10.3390/su9071208
AMA Style
Žurovec O, Čadro S, Sitaula BK. Quantitative Assessment of Vulnerability to Climate Change in Rural Municipalities of Bosnia and Herzegovina. Sustainability. 2017; 9(7):1208. https://doi.org/10.3390/su9071208
Chicago/Turabian StyleŽurovec, Ognjen, Sabrija Čadro, and Bishal Kumar Sitaula. 2017. "Quantitative Assessment of Vulnerability to Climate Change in Rural Municipalities of Bosnia and Herzegovina" Sustainability 9, no. 7: 1208. https://doi.org/10.3390/su9071208
Note that from the first issue of 2016, this journal uses article numbers instead of page numbers. See further details here.