Testing the Correlations between Corporate Giving, Performance and Company Value

1
Department of Accounting and Audit, Faculty of Economics and Business Administration, West University of Timisoara, 16 Pestalozzi Street, 300115 Timisoara, Romania
2
Department of Economics and Modeling, Faculty of Economics and Business Administration, West University of Timisoara, 16 Pestalozzi Street, 300115 Timisoara, Romania
*
Author to whom correspondence should be addressed.
Sustainability 2017, 9(7), 1210; https://doi.org/10.3390/su9071210
Submission received: 14 June 2017
/
Revised: 2 July 2017
/
Accepted: 6 July 2017
/
Published: 10 July 2017
(This article belongs to the Section Economic and Business Aspects of Sustainability)
Abstract
:The paper seeks to identify the relationship between the charitable contributions, performance, and market value of Romanian listed companies. To achieve the objective, a panel data analysis was conducted on a group of companies listed at Bucharest Stock Exchange in the period 2011 to 2016, which registered profit for the entire period. The empirical analysis points out, using a logistic regression, which financial and non-financial indicators contribute to the decisions of the companies to make the charitable contributions. It also tests the impact of those indicators and corporate giving activities like Corporate Social Responsibility (CSR) activities on company value, represented by Tobin’s Q Ratio and on company performance, expressed by Return on Equity (ROE). The results show that there is a positive correlation between the charitable contributions, performance, and market value of the Romanian listed companies.
1. Introduction
In the context of economic development, the information published by companies in their financial statements is not enough to give a complete picture of their activity. Thus, the need for non-financial reporting to show the involvement of companies in society was imposed. Non-financial reports include information on corporate social responsibility (CSR), including environmental, social, and corporate governance activities [1]. In the literature, it is mentioned that their performance is influenced by CSR activities [2,3,4,5,6,7].
Friedman, in 1970, considered that ‘the social responsibility of business is to increase profits’. In general, CSR describes how businesses manage business processes to produce a positive global impact on society beyond what is legally and financially needed for the company [8].
An aspect similar to CSR is corporate philanthropy, which Peloza and Shang identified as being used in 65% of the studies they analyzed [9]. Seifert et al. classifies that corporate philanthropy can be cash and/or in-kind donations, gifts representing a company’s products, services, infrastructure, or know-how directly or indirectly sponsored by a company [10]. Peake et al. analyze the intentions of entrepreneurs to engage in philanthropic actions and conclude that these are ‘grounded in enlightened self-interest’ [11]. The main reasons why companies offer charitable donations and are involved in CSR are to strengthen their image as a responsible company, which would suggest that well-functioning companies should support charitable activities, to strengthen the image of the CEO as a citizen concerned with the issues of society like political, lobbying, or clientele considerations, and as a way for companies to show social responsibility to local communities and to satisfy the interests of the involved parties [12].
From the literature, it results that, in order to measure the relationship between CSR and performance, the instruments utilized are reputation indices, content analyses, and questionnaire-based surveys for CSR activities and accounting-based measures, market-based measures, and combined measures for performance. The disadvantages regarding the utilized instruments lie in the subjectivity of the research and the tendency to select only some information, but these can be diminished by a standardization of integrating reports and the mandatory disclosure of information [13].
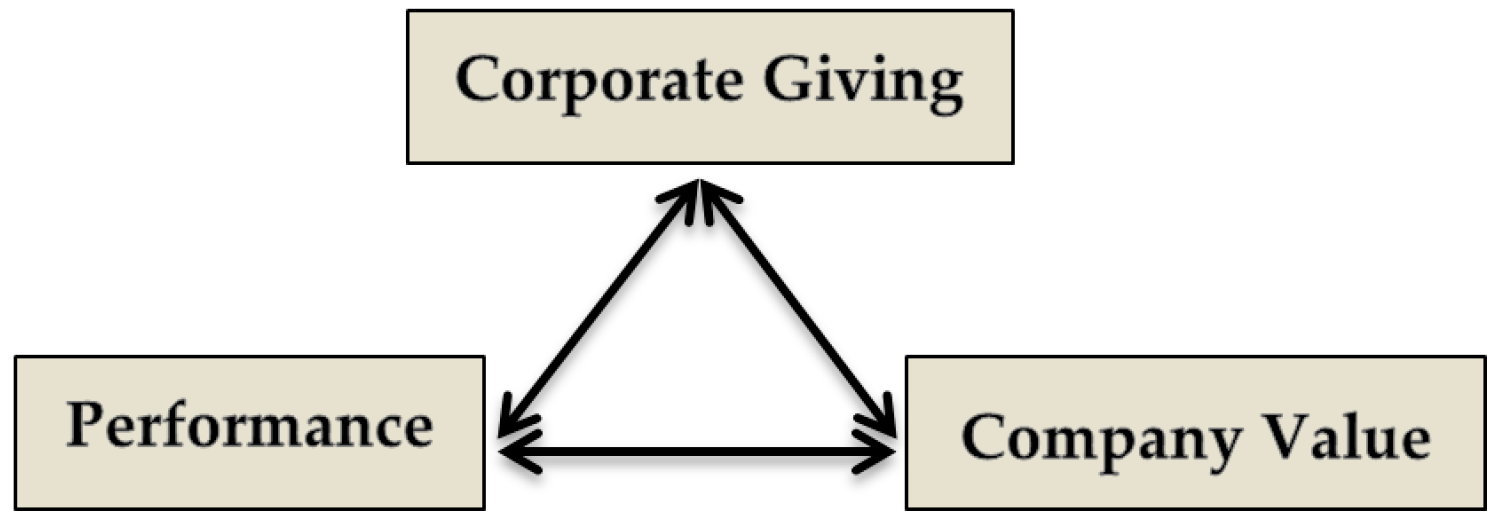
In this context, our purpose is to test the correlations between the main objectives of the companies; namely, a financial one, expressed by performance and market value, and a social-sustainable one, expressed by charitable contributions, as can be seen in Figure 1. The main source of information on performance is represented by the financial and accounting indicators that have different degrees of relevance depending on the interests of each stakeholder group involved in the company’s activities.
The remainder of the paper describes the literature review in Section 2 and the research methodology and methods used in Section 3. In Section 4, the relevant interpretations of the main results of our study are discussed, and the final section concludes, giving some limitations and future research directions.
2. Literature Review
The concept of Corporate Social Responsibility is a controversial one; Okoye demonstrates this starting from the theory of an essentially contested concept [14], and Isa concludes that, in addition to the stated theory, CSR is also a multidimensional construction [15]. In 1991, Archie Carroll introduced the concept of ‘The Pyramid of Corporate Social Responsibility with four identified components: economic, ethical, legal and discretionary or philanthropic’ [16], which he revised in 2016 by explaining the issues that were not clarified in the initial model, concluding that ‘the pyramid could be perceived to be a static snapshot of responsibilities, it is intended to be seen as a dynamic, adaptable framework the content of which focuses both on the present and the future’ [17].
Hill et al. define CSR as ‘the economic, legal, moral, and philanthropic actions of firms that influence the quality of life of relevant stakeholders’ [18]. Generally, CSR describes how business processes are managed by firms with the scope to produce positive impacts on society.
Basu and Palazzo analyzed the concept of CSR in terms of organizational character by a ‘set of cognitive, linguistic, and conative dimensions that explains how managers think, discuss and act with respect to their key stakeholders’ [19].
Lev et al. analyze the causality between CSR (measured by charitable contributions) and financial performance, measured by sales growth. Their study has shown that companies are willing to invest in corporate giving only if this brings additional economic value [20].
Researchers are concerned about identifying the relationship between philanthropy and company performance, but the results of the studies are contradictory; some consider that there is a positive relationship, and others consider that there is a negative relationship. Wang et al. affirm that this is best captured by an inverse U-shape.; they use the generalized concept that corporate philanthropy enhances reputation among companies’ stakeholders, which, in turn, increases financial performance, as measured by the return on assets and Tobin’s Q [21].
Thus, when a business owner gives money to charity, it can mean that their business is successful and that they have made enough profit [22]. From the literature, it results that companies that have social shares increase their reputation; thus their value grows, as well as investor confidence [4,5,7,23,24].
Between the management of the company and other users of information, an asymmetry is formed due to different interests, which can be minimized [25,26] through a chain of actions such as cause and effect that originate in the decision of some managers to provide more information when they consider the company they are conducting is undervalued [27].
Profit is an expression of the financial performance of companies; thus, we have proposed that, in addition to the CSR indicators, we should establish the influence of the performance on the value of the companies. Some of the performance indicators we consider are return on asset, return on equity, total asset turnover, and debt ratio, which are also indicators of sustainable development [28,29,30]. Other authors find that ‘charitable donations are positively related to financial performance and the firm’s value, which is consistent with the value-enhancement hypothesis’ [31].
To determine the value of a company, researchers use different financial ratios; market to book ratio, earning per share, price to sale ratio, price to earnings ratio, and Tobin’s Q Ratio. The most commonly used indicator as a value proxy is Tobin’s Q. It is defined as the ratio of the company’s market value to its book value. However, the limitations of these indicators should be taken into account mainly because market value is influenced by information asymmetries between economic agents that determine demand and supply on the market.
By conducting a study on 3000 companies, using the value of the company expressed as a Tobin’s Q index, a variable dependent on the econometric regression, and as an independent CSR variable (defined as the dummy variable that takes a value of 1 when the firm is engaged in CSR activities), Harjoto et al. come to the conclusion that the relationship between CSR and firm value is significantly positive [32]. Opposite to this study are the ones conducted by Omar and Zallom [33] on companies from Iordan, which obtained a negative effect or no effect of CSR on market value, and by Crisostomo et al., who studied companies from Brazil and also found a negative correlation between CSR and market value [34].
From the meta-analysis of 52 studies, Orlitzky et al. found that ‘the corporate social performance (CSP) is positively correlated with corporate financial performance (CFP) because CSP increases managerial competencies’ [35], where CSP was measured by disclosures, reputation ratings, social audits, and the managerial principles of CSP and CFP was measured by indicators of market-based, accounting-based, and perceptual measures.
Eom and Nam analyzed the correlation between CSR activities, the cost of equity, and corporate value, but ‘the results failed to show any significant relation between the incorporation of the Socially Responsible Investment (SRI) index, used as the proxy variable of CSR, activities of companies and the cost of equity capital’ [36].
Iatridis conducted a study on companies listed on the New York Stock Exchange from 2008 to 2012 and found that corporate giving (quantified as the ratio between the charitable contribution and total assets) has a direct influence on the future profitability and growth of the company [37]. Also, Navaro calculated corporate giving as a ratio between charitable contribution and sales and concluded that maximizing profits is an important reason to make contributions [38].
Masuli et al. [39] have demonstrated that corporate giving reduces the company value attributed to shareholders because managers are willing to make charitable contributions in order to strengthen the social relations with the financed organizations, and they have an influence over the channeling of corporate giving. Lin et al. [40] show that the determinants of giving to charity for companies listed on the Taiwan Stock Exchange are profitability, the advertising ratio, the Research and Development (R&D) ratio, and labour intensity. Also, they concluded that the amount of contribution is important, not only the reason for the philanthropic decision.
Talebnia et al. [41] studied the relationship between the scale performance of Tobin’s Q, the ownership structure of investment companies, and the structure of state ownership, and they found a significant relationship. Also, they concluded that the age of a company as a number of years from the company’s establishment do not have an effect on the Tobin’s Q performance scale. Also, Yu [42] researched the correlation between state ownership and corporate performance in the case of listed companies in China from 2003 to 2010 and found that ‘state ownership has U-shaped relationship with corporate performance’.
Companies from Romania do not yet have an obligation to publish non-financial reports in accordance with Directive 2014/95/EU, so we analyzed which financial information published in the annual financial statements is closer to the requirements of non-financial reporting. From the information published by the analyzed companies, we focused our attention on social information, namely, the value of charitable contributions that are reflected in social involvement actions and the number of employees of companies, and we came to the conclusion that the listed companies we targeted ‘are not necessarily the most socially responsible, while non-listed companies are not subject to non-financial reporting requirements’ [43].
Baleanu et al. mention that almost half of the companies they studied ‘engage in CSR activity partially or fully through philanthropy—offering money or materials towards sponsoring projects, events or organisations but transferring the administrative burden to the beneficiary’ [44].
The charitable contributions of the companies are considered tax deductions within different limits from country to country, being either mandatory or voluntary. In Romania, the contributions are voluntary and are deductible within the limit of 20% of income tax and up to 0.5% of turnover [45]. In consequence, charitable contributions to social activities will negatively affect the state budget, which contributes to the growth of public debt [46], but, at the same time, they have a social positive effect on household incomes [47] and reduce social and material inequality [48]. In many countries, both the deduction mechanism from the taxable base, with the threshold of 10% (in the USA a ‘corporation cannot deduct charitable contributions that exceed 10% of its taxable income for the tax year’ [49], which is also true for Italy, the Czech Republic, and Poland), and the targeting of a percentage of the income tax owed are met. India has the highest CSR reporting in the world [50], as India’s large companies have an obligation to spend 2% of their net profit on CSR activities. In their study of 2100 firms listed on the National Stock Exchange (NSE) of India, Manchiraju and Rajgopal highlighted that ‘the law caused a significant drop in the stock price of firms forced to spend money on CSR’ [51], and thus the companies registered a decrease in Tobin’s Q Ratio.
Therefore, the indicator taken into account was the percentage of charitable contributions scaled by turnover, but relevant information can also be found in the ratio of charitable contributions to profit.
Corporate social responsibility activities could be charitable contributions to non-profit organizations such as fundraising and donations. Remittances could be a form of philanthropy and ‘forms a large share of today’s private flows’ [52]; in Romania in 2015, their value was around 950 million euro [53].
In Romania, the implications of the information contained in the performance indicators on the return on shares in a study conducted for the period from 2010 to 2013 on listed companies from the oil and retail sectors on the Bucharest Stock Exchange (BSE) showed the existence of a strong and direct correlation between stock market capitalization and turnover, trade profitability, and net profit [54]. A different study concerning listed companies determined that enhancing environmental and social protection could have an impact on long-term financial performance, as they detected a positive correlation between social or environmental performance and the profitability of the stock market one year after the changes took place [55].
Lacking the financial data provided by the BSE listed companies, Gherghina and Vintila [56] conducted a study to demonstrate the connection between CSR and company values, variables that were expressed by developing a global CSR index on the following domains: ‘social involvement, employees, products and services, environmental protection’, and Tobin’s Q Ratio. This resulted in a positive impact of the index on company value, but it was different for the companies listed on the primary market compared to those listed on the secondary market.
In the context of implementation, in Romania, from 1 January 2017, following Directive 2014/95/EU, this study is necessary to measure the corporate giving of the listed companies before reporting is made mandatory as a starting point for the future. Most of the studied companies have CSR policies and have published sustainability reports or presented them in their administrator’s reports. CSR activities could influence a company’s value, but governmental authorities should take into account the cost and benefits of CSR. An appreciated measure was to increase the charitable contribution deduction from 1 January 2016 from 0.3 to 0.5% of a company’s turnover, which contributes to the sustainable development of the Non-Governmental Organization (NGO) sector in Romania [57].
3. Materials and Methods
To test the correlations between corporate giving, performance, and market value, we selected 29 companies listed on the BSE that are non-financial institutions and that registered profit in the 2011 to 2016 period. The data series for all the indicators were manually collected from the Bucharest Stock Exchange database and each company’s website, including total assets, net profit, liabilities, turnover, charitable contributions, equity, market price, number of shares, number of employees, the year the companies were listed on BSE, and the type of majority shareholders. Based on these indicators, we calculated the variables presented in Table 1.
In order to reduce the risk of biases and control the reliability of the data, we validated the values of the indicators from three different sources; the BSE database, official data published by the Romanian Ministry of Public Finance, and the reports released by the companies on their websites. On 31 December 2016, 84 national companies were listed on the BSE; 11 financial institutions and 73 non-financial institutions. From the non-financial institution, eight were suspended, 29 made profit in all six years, 36 companies didn’t register profit in every year, and some of them weren’t listed for the whole period. Thus our sample represents 35% of the listed companies and 40% of the non-financial institutions.
Starting from 1 January 2012, the companies listed on the BSE were bound to use the International Financial Reporting Standards (IFRS), so we can consider this as a turning point in the financial reporting of companies. In order to obtain a higher degree of comparability, the analyzed period starts from the year 2011 because the companies had to retract their financial statements for 2011 to have comparable data.
Classifying the companies after the activity sector, 18 of them are in ‘Manufacturing’, four are in ‘Transportation and storage’, three are in ‘Wholesale and retail trade; repair of motor vehicles and motorcycles’, two are in ‘Accommodation and food service activities’, one is in ‘Electricity, gas, steam and air conditioning supply’, and one is in ‘Construction’ (Appendix A).
The companies’ performance indicators used in this paper were divided into two categories, financial and non-financial. The financial indicators were also divided in two categories, accounting based indicators of return on asset, return on equity, total asset turnover, debt ratio, and market based indicators and price-to-sale ratio and price-book value ratio (Figure 2). The non-financial indicators are listed period, number of employees, and ownership of the company (private or state-owned).
The methods that we used to calculate all the indicators are synthesized in Table 1, along with the literature from similar studies.
Based on the literature, we establish the following research hypotheses:
Hypothesis 1 (H1).
There is a significant correlation between market value, performance of a company, and its decision to give to charity.
Hypothesis 2 (H2).
There is a significant correlation between the performance, the charitable contributions of a company, and its market value.
Hypothesis 3 (H3).
There is a significant correlation between the charitable contributions, the market value of a company, and its performance.
For testing the correlation between non-financial indicators and our dependent variables, we formulated three hypotheses:
Hypothesis 4a (H4a).
There is a significant correlation between the non-financial indicators of a company and its market value.
Hypothesis 4b (H4b).
There is a significant correlation between the non-financial indicators of a company and its performance.
Hypothesis 4c (H4c).
There is a significant correlation between the non-financial indicators of a company and its decision to give to charity.
To test our hypotheses, we used a panel data regression analysis, which helps us to highlight the changes in the average value of the dependent variable when one of the independent variables increases by 1%.
Thus, the empirical research consists of a descriptive analysis of the companies’ financial and non-financial indicators, a correlation matrix, and panel data econometric models. To validate the econometric models, we used the Harris–Tzavalis test to check for stationarity. The results show that all variables are stationary at a 5% level of significance. We conducted a Modified Wald test for groupwise heteroskedasticity, from which it resulted that the independent variables do not have constant variance of the error terms. Therefore, in all the regressions, we used the robust option for the standard errors. After that, we checked for cross-sectional dependency using a Pesaran cross sectional dependence test and obtained that the residuals are not correlated. In consequence, we decided to use in our analysis the contemporaneous regressions with panels-corrected standard errors (PCSE) with the option of independent residuals.
The dependent variables chosen in the econometric models are; for corporate giving, we selected a dummy variable, which expresses the existence of charitable contributions, for the performance of the company, we selected ROE, and, for the company value, we choose Tobin’s Q Ratio.
Considering that the accounting data is published after the closing of the financial year, there is a time gap between the market price of the share and the financial information for that year; ‘often there is delay between an economic action and a consequence’ [82]. In consequence, we decided to analyze the models with time delay and without time delay.
In the first model, we tested which indicators influence most the decision to make charitable contributions. We defined the dependent variable, Corporate Giving, as a dummy variable, which takes the value 1 if the company made charitable contributions and the value 0 if not. Using a generalized estimating equations (GEE) population-averaged model with standard errors adjusted for clustering (robust) on an entity, we constructed two types of panel logistic regressions; with time delay (Equation (2)) and without time delay (Equation (1)).
The form of our regression is as follows:
where αit represents the unknown intercept of every company, β1–6 are the coefficients of each explanatory variable, εit is the error term, i = 1–29 companies, and t represents the years analyzed (2011 to 2016); t − 1 is the previous year.
Corporate Givingit = αit + β1qTobinit + β2ROEit + β3PBVit + εit,
Corporate Givingit = αit−1 + β1qTobinit−1 + β2ROEit−1+ β3PBVit−1 + εit−1,
The second model has Tobin’s Q Ratio as a dependent variable, and it is composed of two contemporaneous regressions with panels-corrected standard errors (PCSE) and independent residuals, with time delay (Equation (4)) and without time delay (Equation (3)).
qTobinit = αit + β1ROAit + β2TATit + β3ROEit + β4PBVit + β5PSit + β6CGivingit + β7DebtRatioit + εit,
qTobinit = αit−1 + β1ROAit−1 + β2TATit−1 + β3ROEit−1 + β4PBVit−1+ β5PSit−1 + β6CGivingit−1 + β7DebtRatioit−1 + εit−1,
The third model has as dependent variable Return on Equity, which is analysed without time delay because it is an accounting-based indicator and is not influenced by the results from the previous year.
ROEit = αit + β1ROAit + β2TATit + β3qTobinit + β4PBVit + β5PSit + β6CGivingit + β7DebtRatioit + εit,
In the last two models, β1 to β7 are the coefficients of each explanatory variable.
In the fourth model, we tested the correlation between the non-financial indicators of the company and Tobin Q’s Ratio and the Return on equity and corporate giving. In this model, we applied the regressions without time delay because the change from one year to another is very small (listed period) or none (ownership).
qTobinit = αit + β1LPit + β2NEit + β3OWNit + εit,
ROEit = αit + β1LPit + β2NEit + β3OWNit + εit,
CGivingit = αit + β1LPit + β2NEit + β3OWNit + εit
In this model, β1, β2, and β3 are the coefficients of each explanatory variable, and Ownership (OWN) is a dummy variable; if the company has a majority of private shareholders it takes a value of 1, and if it is majority state-owned, it takes a value of 0.
We applied the PCSE and logistic regressions and for all the companies (29) and for the companies with less than 500 employees (16). For testing the panel data-series and estimating the coefficients of the regression models, we used Stata Statistical Software: Release 13. (StataCorp LP, College Station, TX, USA)
4. Results and Discussion
In order to achieve the objective of testing the correlations between corporate giving, performance, and a company’s value, we begin by highlighting the characteristics of the selected variables. We summarize the panel data and obtained that, on average, the value of Tobin’s Q Ratio is 0.72, as seen in Table 2.
From all the entities, three companies register a value above 1 (BIO, CNTE, RPH) in all six years, which means that these companies are overvalued.
on average, the listed period of the companies is 14.8 years, the shortest period is three years (in 2011 for BCM and TGN), and the longest period on the stock market is 21 years (in 2016 for CMF and UAM).
The companies have an average of 858 employees; the smallest has 13 employees (MECE in 2012), and the biggest has 4951 (TGN in 2011). Due to this big difference, the data series has a stationarity issue.
On average, ROA is 4.6%; the minimum value is 0 because OIL Company registered a profit of 0 in 2013, and the maximum value is 19% (for CNTE in 2011 and ELGS in 2012).
On average, TAT is 70%, which means that, on average for all the companies, the use of total assets had a reduced intensity; the minimum value is 2% (for MECE in 2011–2013), and the maximum value is 270% for ELGS in 2011.
On average in the studied period, ROE is 7%, greater than the interest rate, which is approximately 3%. The minimum value is 0 because OIL Company registered a profit of 0 in 2013, and the maximum value is 29% for ELGS in 2012.
PBV is, on average, 0.68, which means that the value created for the shareholders is small; the shares are undervalued. The lowest ratio is 0.07 for MECE in 2011, and the biggest is 2.32 for ARS in 2016.
PS is, on average, 0.96; the lowest ratio is 0.08 for RMAH in 2015, and the biggest ratio is 6.62 for MECE in 2016. This indicator is mostly relevant for companies with similar characteristics. The big difference between the two aforementioned companies is due to the activity sector; RMAH is in the ‘Wholesale and retail trade’ sector, while MECE is in the ‘Manufacturing’ sector.
On average, in the studied period, the Debt Ratio is 53%, which is close to the acceptable value of 50%. The lowest ratio is 3% for MECE in 2011, and the biggest ratio is 380% for RMAH in 2012. The higher the value of the indicator, the more the business depends on its creditors.
On average, corporate giving is 0.11%, ranging from 0 for the companies who didn’t make charitable contributions to 0.71% of turnover (SOCP in 2012).
In Table 3, we observe a strong correlation coefficient between Tobin’s Q Ratio and Price-Booked Value Ratio (0.89), as the determination method is very similar, being a control variable. The weakest correlation is with PS (−0.04) and the number of employees (0.08). Another strong correlation of Tobin’s Q is with TAT (0.51), ROA (0.56), and ROE (0.56).
We also identify a stronger correlation between ROE and ROA (0.93) and a negative correlation between corporate giving and a company’s debt ratio (−0.26).
Applying a Harris–Tzavalis and Fisher-type unit-root test we obtained that all the variables are stationary at a 5% level of significance, and a Modified Wald test showed the presence of heteroskedasticity (in consequence, we used the option with robust standard errors). After that, we used a Pesaran cross sectional dependence test, and we were able to accept the null hypothesis that the residuals are not correlated and each panel was strongly balanced.
Due to the fact that the dependent variable is a dummy, we used a logistic regression to determine which financial indicators most influence the decision to make philanthropic actions.
In order to validate the first hypothesis, we tested the regression without time delay (Model 1), only with Tobin’s Q Ratio as a predictor, obtaining that the model is statistically significant (Pearson chi2(174) was 190.93, Wald chi2(1) was 11.78, and the p-value was 0.0006), and if the market value of the company increases by 1%, the probability that the company will give to charity increases by 5.22%. Model 2 is also statistically significant (Pearson chi2(145) was 148.70, Wald chi2(1) was 13.52, and the p-value was 0.0002) and maintained almost the same probability (5.31%).
Afterwards, we included multiple predictors in the regression to verify how much of the explanatory power of the model was increased. All the variables were tested, but only the significant ones are presented in the table.
We can observe from Table 4 that in the multivariate regression the explanatory power of the market value increased from 5.22 to 7.78 in Model 1, respectively from 5.31 to 8.78 in Model 2, at 1% of significance level.
Regarding the performance indicators, their influence on the decision to give to charity is indirect; if their value increases, the probability that the company will make charitable contributions decreases at the 5% significance level. The financial indicators from the previous year give more information than the ones from the year in which the charitable contribution is made and thus reveal a one year delay between the market price of the share, the financial information for that year, and the decision to give to charity.
To test the second hypothesis, we choose a contemporaneous regression with panels-corrected standard errors (PCSE), the residuals independent across each panel, and the method to compute autocorrelation based on Durbin-Watson in order to identify the correlations with the dependent variables, Tobin’s Q and ROE.
Analyzing Table 5, we can observe that, in Model 1 (without time delay), performance positively influences the value of the company; if each financial indicator from the model increases by 1%, the value of the company increases by 3.6%. With an increase of performance expressed by ROA, the company’s value increases by 6.1%. The coefficient of determination is 0.97, which means that 97% of the variation of Tobin’s Q Ratio could be explained by the variation in all the independent variables.
In Model 2 (with time delay), we can observe that, if each financial indicator from the model increases by 1%, the value of the company increases by 4.3%, which indicates that the indicators from the previous year have a bigger influence.
The p-values of β coefficients for both models, which express the probability of failure of the test, are very low, and we can say that there is a 99% probability that the parameter estimates are significant and that the models are statistically correct.
We have obtained a high level of coefficient of determination (0.97 and 0.95) because the elements composing the ratios of the dependent variable and the independent variables are common, either at the numerator or at the denominator. A causal link also exists between the financial indicators of a company (for example, if the liabilities of a company increased, the profit and the equity will decrease).
The third hypotheses is confirmed using ROE as a measurement of the performance of the company (in Table 6), which is positively and negatively influenced by the financial indicators from the model; in general, if they increase by 1%, ROE increases by 1.4%. The biggest positive influence on ROE is by ROA, followed by PBV and the Debt Ratio. The negative influence on ROE comes from Tobin’s Q Ratio and corporate giving, but this was very small.
The coefficient of determination is 0.97 which means that 97% of the variation of ROE could be explained by the variation in all the independent variables. All coefficients are significant at 10%, except PS, which has no significant influence on ROE.
All the listed companies from Romania, which have on average more than 500 employees, will have the obligation to provide complete data regarding sustainability information in their reporting starting from 1 January 2017 [1]. In this situation, we considered relevant to group the companies in two categories by the number of employees in order to observe the differences between them. In our sample are 13 companies with more than 500 employees and 16 with less than 500 employees.
We wanted to test H1, H2, and H3 on the companies from both categories, but we applied the regression models only to the group of companies with less than 500 employees because some of the variables from the other group did not pass the stationarity test.
All the variables presented in the equations were tested, but only the significative ones are shown in the following tables.
From Table 7, we can observe in both models the fact that PBV has no significative correlation with the decision to make philanthropic activities. In Model 1, the biggest influences on this decision are from Tobin’s Q Ratio, which is positive, and ROE, which is negative; both are significant at 5%.
Analyzing the Model 2 for the companies with less than 500 employees, we can state that the indicators from the previous year have a greater correlation with the decision to make charitable contributions. All coefficients are significant at 1%.
Comparing the results from Table 7 with those from Table 4, we ascertain that the intensity of the β coefficients is higher in the case of the companies with less than 500 employees than for all the companies, and we can draw the conclusion that small companies are more inclined to make donations.
Comparing the results from Table 8 with the results shown in Table 5, we can observe that the coefficient of ROA (the financial indicator that has the biggest influence on the company value) decreased from 6.12 to 4.98, which indicates a decrease in the influence of performance on a company’s market value. In general, if each financial indicator from the model increases by 1%, the value of the company increases only by 2.7%.
In Model 2, the financial indicators TAT and ROE were not included in the model because they did not pass the ANOVA and Student’s t tests. Even so, the influence of all the indicators is greater in the model with time delay; if they increase by 1%, the value of the company increases by 3.9%.
The p-values of the β coefficients for both models are very low, and we can say that there is a 95% probability that the parameter estimates are significant and that the models are statistically correct.
There are no significant differences between the regressions for all the companies and those for the companies with less than 500 employees, which are shown in Table 9. We excluded from the initial model PS and corporate giving because they did not pass the ANOVA and Student’s t tests. All the remaining coefficients are significative at 1%, and the strongest correlation is with ROA; if the indicator increases by 1%, ROE increases by 1.3%.
The p-values of the β coefficients are 0.000, so we can say that there is a 99% probability that the parameters estimates are significant and that the models are statistically correct.
In the following, we focused our attention on the non-financial indicators to test H4a, H4b, and H4c. This analysis is made for all the companies. The first thing we observe from Table 10 is that the coefficient of determination is lower. In the first model, Tobin’s Q Ratio could be an influence in a proportion of 86% by the listed period, the number of employees, and ownership, and, in the second model, ROE could be an influence in a proportion of 58% by the same variables.
From all three indicators, only the variable listed period seems to have an influence on the decision to make charitable contributions; the estimated odds that the company will give to charity are 17% higher if the listed period increases by one year.
The β coefficients for the number of employees (in all three models) are extremely low, and we can conclude that these do not have a significative influence on the dependent variables.
Ownership has a significative influence only on the market value; if the company has a majority private shareholders, the Tobin’s Q Ratio could increase by 0.3%.
We synthesized the results of our research for all companies in Table 11, highlighting whether the financial and non-financial indicators had a statistically significative influence on the dependent variables or not.
The results shown that Tobin’s Q Ratio is significantly influenced by all the studied indicators, financial and non-financial. For ROE, we didn’t find a significative correlation between PS, charitable contributions scaled by turnover, and the listed period; the decision to make philanthropic actions is not influenced by ownership of the companies. All our hypotheses were totally or partially validated: H1, H2, and H4b were validated, and H3, H4a, and H4c were partially validated. These results are consistent with the work of Lev et al. [20], Wang et al. [21], and Liang et al. [31] and the synthesis of Karagiorgios [83].
5. Conclusions
The objective of the paper was to identify the relationship between charitable contributions, performance, and the market values of Romanian listed companies. To achieve our purpose, we performed quantitative research by using panel-data econometric models with different types of regressions (logistic regression and contemporaneous regression with panels-corrected standard errors) to identify the correlations between corporate giving, performance, and company value.
The empirical analysis points out which financial and non-financial indicators contribute to the decisions of the companies to make charitable contributions. Our results show that the indicators from the previous year are more significant, especially ROE and Tobin’s Q Ratio. Considering the non-financial indicators, only the listed period had an influence on this decision; the estimated odds that the company will give to charity are 17% higher if the listed period increases by one year.
When testing the impact of the indicators and corporate giving activities like CSR activities on company value, represented by Tobin’s Q Ratio, we obtained that the financial indicator that has the biggest influence on the company value is return on assets (ROA). If this variable is increased by 1%, the company’s value increases by 6.1%. A similar result was obtained for the companies with less than 500 employees. Regarding non-financial indicators, only ownership had a significant influence on the market value; if the company has a majority of private shareholders, the Tobin’s Q Ratio could increase by 0.3%.
Analyzing the influence of financial indicators on the performance of the company, expressed by return on equity (ROE) we obtained that the biggest correlation coefficient is ROA, which was 1.46 for all the companies and 1.31 for the companies with less than 500 employees. None of the non-financial indicators had a significant effect on the dependent variable.
The results show that there is a positive correlation between charitable contributions, performance, and the market values of the Romanian listed companies, and return on asset had the most influence on the dependent variable. At the end of our paper we synthesized the main results from testing the hypothesis, which indicated that the independent variables have an influence over the dependent variable. In conclusion, H1, H2, and H4b were totally validated, while H3, H4a, and H4c were partially validated.
According to our research, the managers of Romanian listed companies are more inclined to give to charity to increase the value of the firm and its performance, and they realize that philanthropy is an activity with long lasting effects that induce social meaningful changes. Our results are similar to those of a study by Verbeeten et al. [84], which was conducted on companies from Germany and concluded that social information is positively associated with firm value and that management should implement CSR strategies and policies to attract investors.
Creating value can no longer be seen only from a strictly financial perspective; the strategies that economic entities define cannot only relate to quantitative (economic and financial) issues, but must also include qualitative (environmental and social) aspects. In the current context, performance requires complying with the requirements of sustainable development as a prerequisite for ensuring the viability of companies both domestic and international [85]. In sustainability research resulted the need for ‘new firm practices and/or approaches, able to encompass corporate sustainability issues and dimensions—social, economic, environmental, and time—as key issues, without forgetting the primary role of innovation’ [86].
Our research contributes to the development of the literature because it provides information on the behavior of Romanian listed companies regarding charitable contributions. This study may be of help to clarify the relationships between corporate giving, performance, and company value, and could be a reference point for companies that try to implement sustainability reporting.
The paper has also its limitations; the first one is the short period of time since the implementation of IFRS, which is only six years. Secondly, on the Bucharest Stock Exchange are a reduced number of companies (in comparison with other countries), and only 29 non-financial companies registered profit in all the years under consideration. This problem was identified by another researcher from Romania, who said that there is a reduced number of statistical observations for Romanian listed companies [56].
We consider that our models are reliable and that we achieved our goal because the obtained results are in concordance with the studied literature [40,51]. For this reason we want to continue our research, and we identify some future research directions; we could include financial companies like credit institutions, insurance, and financial investment companies in the econometric analysis, and also we could identify new variables to enhance the correlations between corporate giving, performance, and company value.
Acknowledgments
Curea-Pitorac Ruxandra Ioana’s work was supported by a grant from the Romanian National Authority for Scientific Research and Innovation, CNCS—UEFISCDI, project number 1/06.10.2016, within PNCDI III.
Author Contributions
Camelia-Daniela Hategan and Ruxandra Ioana Curea-Pitorac conceived, designed, prepared, analyzed the data and revised the paper. Both authors have read and approved the manuscript.
Conflicts of Interest
The authors declare no conflict of interest.
Appendix A

Table A1.
Information about the analyzed companies.
| Code | Name of the Company | Category | NACE Code | Ownership |
|---|---|---|---|---|
| ATB | ANTIBIOTICE S.A. | Premium | 2110 | State-Owned |
| BIO | BIOFARM S.A. | Premium | 2120 | Private |
| COTE | CONPET SA | Premium | 4950 | State-Owned |
| TEL | C.N.T.E.E. TRANSELECTRICA | Premium | 3512 | State-Owned |
| TGN | S.N.T.G.N. TRANSGAZ S.A. | Premium | 4950 | State-Owned |
| ALU | ALUMIL ROM INDUSTRY S.A. | Standard | 4672 | Private |
| ARS | AEROSTAR S.A. | Standard | 3030 | Private |
| ART | TMK—ARTROM S.A. | Standard | 2420 | Private |
| ARTE | ARTEGO SA | Standard | 2219 | Private |
| BCM | CASA DE BUCOVINA-CLUB DE MUNTE | Standard | 5510 | Private |
| BRM | BERMAS S.A. | Standard | 1105 | Private |
| CBC | CARBOCHIM S.A. | Standard | 2391 | Private |
| CMF | COMELF S.A. | Standard | 2892 | Private |
| CMP | COMPA S. A. | Standard | 2932 | Private |
| CNTE | CONTED SA | Standard | 1413 | Private |
| COTR | TRANSILVANIA CONSTRUCTII SA | Standard | 4120 | Private |
| ELGS | ELECTROARGES SA | Standard | 2751 | Private |
| IARV | IAR SA Brasov | Standard | 3316 | State-Owned |
| MECE | ROMCAB SA | Standard | 2731 | Private |
| MECF | MECANICA FINA SA | Standard | 2651 | Private |
| OIL | MECANICA CEAHLAU | Standard | 2830 | State-Owned |
| PREH | OIL TERMINAL S.A. | Standard | 5224 | Private |
| RMAH | PREFAB SA | Standard | 2361 | Private |
| ROCE | FARMACEUTICA REMEDIA SA | Standard | 4773 | Private |
| RPH | ROMCARBON SA | Standard | 2221 | Private |
| SOCP | ROPHARMA SA | Standard | 4773 | Private |
| STIB | SOCEP S.A. | Standard | 5224 | Private |
| TUFE | TURISM FELIX S.A. | Standard | 5510 | Private |
| UAM | UAMT S.A. | Standard | 2932 | Private |
References
- Directive 2014/95/EU of the European Parliament and of the Council of 22 October 2014 Amending Directive 2013/34/EU as Regards Disclosure of Non-Financial and Diversity Information by Certain Large Undertakings and Groups. Available online: http://eur-lex.europa.eu/legal-content/EN/TXT/?uri=CELEX%3A32014L0095 (accessed on 5 June 2017).
- Lin, C.-S.; Chang, R.-Y.; Dang, V.T. An Integrated Model to Explain How Corporate Social Responsibility Affects Corporate Financial Performance. Sustainability 2015, 7, 8292–8311. [Google Scholar] [CrossRef]
- Bird, R.; Hall, A.; Momente, F.; Reggiani, F. What Corporate Responsibility Activities Are Valued by the Market? J. Bus. Ethics 2007, 76, 189–206. [Google Scholar] [CrossRef]
- Waddock, S.A.; Googins, B.K. The Paradoxes of Communicating Corporate Social Responsibility. In The Handbook of Communication and Corporate Social Responsibility; Ihlen, Ø., Bartlett, J.L., May, S., Eds.; Wiley-Blackwell: Oxford, UK, 2011; pp. 23–43. [Google Scholar]
- Orlitzky, M. Does Firm Size Confound the Relationship between Corporate Social Performance and Firm Financial Performance? J. Bus. Ethics 2001, 33, 167–180. [Google Scholar] [CrossRef]
- McWilliams, A.; Siegel, D.S.; Wright, P.M. Corporate Social Responsibility: Strategic Implications. J. Manag. Stud. 2006, 43, 1–18. [Google Scholar] [CrossRef]
- Adams, M.; Hardwick, P. An Analysis of Corporate Donations: United Kingdom Evidence. J. Manag. Stud. 1998, 35, 641–654. [Google Scholar] [CrossRef]
- Friedman, M. The Social Responsibility of Business Is to Increase Profits. Available online: https://link.springer.com/chapter/10.1007%2F978-3-540-70818-6_14 (accessed on 5 June 2017).
- Peloza, J.; Shang, J. How can corporate social responsibility activities create value for stakeholders? A systematic review. J. Acad. Mark. Sci. 2011, 39, 117–135. [Google Scholar] [CrossRef]
- Seifert, B.; Morris, S.A.; Bartkus, B.R. Comparing big givers and small givers: Financial correlates of corporate philanthropy. J. Bus. Ethics 2003, 45, 195–211. [Google Scholar] [CrossRef]
- Peake, W.O.; Harris, M.L.; McDowell, W.C.; David, P.E. Get What You Give? An Examination of Enlightened Self-Interest, Philanthropic Intent, and Engagement in Philanthropy for Small Firm Owners. J. Small Bus. Strategy 2015, 25, 79–96. [Google Scholar]
- Marquis, C.; Glynn, M.A.; Davis, G.F. Community isomorphism and corporate social action. Acad. Manag. Rev. 2007, 32, 925–945. [Google Scholar] [CrossRef]
- Brammer, S.; Millington, A. Corporate Reputation and Philanthropy: An Empirical Analysis. J. Bus. Ethics 2005, 61, 29–44. [Google Scholar] [CrossRef]
- Okoye, A. Theorising Corporate Social Responsibility as an Essentially Contested Concept: Is a Definition Necessary? J. Bus. Ethics 2009, 89, 613–627. [Google Scholar] [CrossRef]
- Isa, S.M. Corporate Social Responsibility: What can We Learn from the Stakeholders? Procedia Soc. Behav. Sci. 2012, 65, 327–337. [Google Scholar] [CrossRef]
- Carroll, A.B. The pyramid of corporate social responsibility: Toward the moral management of organizational stakeholders. Bus. Horiz. 1991, 34, 39–48. [Google Scholar] [CrossRef]
- Carroll, A.B. Carroll’s pyramid of CSR: Taking another look. Int. J. Corp. Soc. Responsib. 2016, 1, 3. [Google Scholar] [CrossRef]
- Hill, R.P.; Ainscough, T.; Shank, T.; Manullang, D. Corporate Social Responsibility and Socially Responsible Investing: A Global Perspective. J. Bus. Ethics 2007, 70, 165–174. [Google Scholar] [CrossRef]
- Basu, K.; Palazzo, G. Corporate social responsibility: A process model of sensemaking. Acad. Manag. Rev. 2008, 33, 122–136. [Google Scholar] [CrossRef]
- Lev, B.I.; Petrovits, C.; Radhakrishnan, S. Is doing good good for you? How corporate charitable contributions enhance revenue growth. Strateg. Manag. J. 2008, 31, 182–200. [Google Scholar] [CrossRef]
- Wang, H.; Choi, J.; Li, J. Too little or too much? Untangling the relationship between corporate philanthropy and firm financial performance. Organ. Sci. 2008, 19, 142–159. [Google Scholar] [CrossRef]
- Galant, A.; Cadez, S. Corporate social responsibility and financial performance relationship: A review of measurement approaches. Econ. Res. Ekonomska Istraživanja 2017, 30, 676–693. [Google Scholar] [CrossRef]
- Vlaholias, E.; Thompson, K.; Every, D.; Dawson, D. Charity Starts … at Work? Conceptual Foundations for Research with Businesses that Donate to Food Redistribution Organisations. Sustainability 2015, 7, 7997–8021. [Google Scholar] [CrossRef]
- Saiia, D.H.; Carroll, A.B.; Buchholtz, A.K. Philanthropy as strategy when corporate charity ‘begins at home’. Bus. Soc. 2003, 42, 169–201. [Google Scholar] [CrossRef]
- Lev, B.I. Intangibles: Management, Measurement and Reporting; The Brookings Institution: Washington, DC, USA, 2001. [Google Scholar]
- Dhaliwal, D.; Li, O.Z.; Tsang, A.H.; Yang, Y.G. Voluntary non-financial disclosure and the cost of equity capital: The case of corporate social responsibility reporting. Account. Rev. 2011, 86, 59–100. [Google Scholar] [CrossRef]
- Stefan, I.O. The implications of financial performance on stock exchange indicators of listed companies: Empirical evidence for the Romanian capital market. Audit Financ. 2016, 14, 875–896. [Google Scholar] [CrossRef]
- Fama, E.F.; French, K.R. Industry costs of equity. J. Financ. Econ. 1997, 43, 153–193. [Google Scholar] [CrossRef]
- Wei, F.; Lu, J.; Kong, Y. Research on Sustainability Financial Performance of Chinese Listed Companies. Sustainability 2017, 9, 723. [Google Scholar] [CrossRef]
- Gode, D.; Mohanram, P. Inferring the cost of capital using the Ohlson-Juettner Model. Rev. Account. Stud. 2003, 8, 399–431. [Google Scholar] [CrossRef]
- Liang, H.; Renneboog, L. Corporate Donations and Shareholder Value; Finance Working Paper; European Corporate Governance Institute (ECGI): Brussels, Belgium, 2016. [Google Scholar]
- Harjoto, M.A.; Jo, H. Corporate governance and CSR Nexus. J. Bus. Ethics 2011, 100, 45–67. [Google Scholar] [CrossRef]
- Omar, B.F.; Zallom, N.O. Corporate social responsibility and market value: Evidence from Jordan. J. Financ. Rep. Account. 2016, 14, 2–29. [Google Scholar] [CrossRef]
- Crisóstomo, V.L.; Freire, F.S.; Vasconcellos, F.C. Corporate social responsibility, firm value and financial performance in Brazil. Soc. Responsib. J. 2011, 7, 295–309. [Google Scholar] [CrossRef]
- Orlitzky, M.; Schmidt, F.L.; Rynes, S.L. Corporate social and financial performance: A meta-analysis. Organ. Stud. 2009, 24, 403–441. [Google Scholar] [CrossRef]
- Eom, K.; Nam, G. Effect of Entry into Socially Responsible Investment Index on Cost of Equity and Firm Value. Sustainability 2017, 9, 717. [Google Scholar] [CrossRef]
- Iatridis, G.E. Corporate philanthropy in the US stock market: Evidence on corporate governance, value relevance and earnings manipulation. Int. Rev. Financ. Anal. 2015, 39, 113–126. [Google Scholar] [CrossRef]
- Navarro, P. Why do corporations give to charity? J. Bus. 1988, 61, 65–93. [Google Scholar] [CrossRef]
- Masulis, R.W.; Reza, S.W. Agency problem of corporate philanthropy. Rev. Financ. Stud. 2015, 28, 592–636. [Google Scholar] [CrossRef]
- Lin, C.-P.; Chen, M.-H.; Wang, J.; Tian, L. Corporate giving in Taiwan: Agency cost theory vs. value enhancement theory. Asia Pac. Bus. Rev. 2017, 23, 135–151. [Google Scholar] [CrossRef]
- Talebnia, G.; Salehi, M.; Valipour, H.; Shafiee, S. Empirical Study of the Relationship between Ownership Structure and Firm Performance: Some Evidence of Listed Companies in Tehran Stock Exchange. J. Sustain. Dev. 2010, 3, 264–270. [Google Scholar] [CrossRef]
- Yu, M. State ownership and firm performance: Empirical evidence from Chinese listed companies. China J. Account. Res. 2013, 6, 75–87. [Google Scholar] [CrossRef]
- Guse, R.G.; Almasan, A.; Circa, C.; Dumitru, M. The role of the stakeholders in the institutionalization of the CSR reporting in Romania. Account. Manag. Inf. Syst. 2016, 15, 304–340. [Google Scholar]
- Baleanu, T.E.; Chelcea, L.; Stancu, A. The Social Responsibility of the Top 100 Romanian Companies. An Analysis of Corporate Websites. Amfiteatru Econ. J. 2011, 13, 237–250. [Google Scholar]
- Romanian Parliament. Law No. 227/2015 Regarding the Fiscal Code. Available online: https://static.anaf.ro/static/10/Anaf/legislatie/Cod_fiscal_norme_24052017.htm (accessed on 5 June 2017).
- Bobes, F.M. The financial-economic crisis and public debt sustainability. Holist. J. Bus. Public Adm. 2015, 6, 116–126. [Google Scholar]
- Militaru, E. Income redistribution through the Romanian tax-benefit system: Estimation of pro-poor effects. Holist. J. Bus. Public Adm. 2015, 6, 78–88. [Google Scholar]
- Weziak-Bialowolska, D. Poverty in the regions of the European Union—Measurement with a composite indicator. Contemp. Econ. 2015, 9, 113–154. [Google Scholar] [CrossRef]
- Department of the Treasury Internal Revenue Service. Publication 542 Corporations, Rev. December 2016. Available online: https://www.irs.gov/pub/irs-pdf/p542.pdf (accessed on 5 June 2017).
- KPMG. The KPMG Survey of Corporate Responsibility Reporting 2015. Available online: https://home.kpmg.com/xx/en/home/insights/2015/11/kpmg-international-survey-of-corporate-responsibility-reporting-2015.html (accessed on 5 June 2017).
- Manchiraju, H.; Rajgopal, S. Does Corporate Social Responsibility (CSR) Create Shareholder Value? Evidence from the Indian Companies Act 2013. J. Account. Res. 2017. [Google Scholar] [CrossRef]
- Grady, H. Philanthropy as an Emerging Contributor to Development Cooperation. Available online: http://www.undp.org/content/undp/en/home/librarypage/corporate/philanthropy-as-an-emerging-contributor-to-development-cooperati.html (accessed on 4 June 2017).
- Romania Remittances. Available online: https://www.tradingeconomics.com/romania/remittances/forecast (accessed on 4 June 2017).
- Buse, L.; Stefan, I.O. Study on the Correlation between Economic and Financial Performance and Stock Exchange Performance in Romanian Companies from Oil and Retail Trade Industries. Procedia Econ. Financ. Elsevier 2014, 16, 149–159. [Google Scholar] [CrossRef]
- Dobre, E.; Stanila, G.O.; Brad, L. The Influence of Environmental and Social Performance on Financial Performance: Evidence from Romania’s Listed Entities. Sustainability 2015, 7, 2513–2553. [Google Scholar] [CrossRef]
- Gherghina, S.C.; Vintila, G. Exploring the Impact of Corporate Social Responsibility Policies on Firm Value: The Case of Listed Companies in Romania. Econ. Sociol. 2016, 9, 23–42. [Google Scholar] [CrossRef]
- Ceptureanu, S.-I.; Ceptureanu, E.-G.; Orzan, M.C.; Marin, I. Toward a Romanian NPOs Sustainability Model: Determinants of Sustainability. Sustainability 2017, 9, 966. [Google Scholar] [CrossRef]
- Dowell, G.; Hart, S.; Yeung, B. Do corporate global environmental standards create or destroy market value? Manag. Sci. 2000, 46, 1059–1074. [Google Scholar] [CrossRef]
- Chung, K.H.; Pruitt, S.W. A simple approximation of Tobin’s Q. Financ. Manag. 1994, 23, 70–74. [Google Scholar] [CrossRef]
- Callan, S.J.; Thomas, J.M. Corporate financial performance and corporate social performance: An update and reinvestigation. Corp. Soc. Responsib. Environ. Manag. 2009, 16, 61–78. [Google Scholar] [CrossRef]
- Erhemjamts, O.; Li, Q.; Venkateswaran, A. Corporate social responsibility and its impact on firms’ investment policy, organizational structure, and performance. J. Bus. Ethics 2013, 118, 395–412. [Google Scholar] [CrossRef]
- Guenster, N.; Bauer, R.; Derwall, J.; Koedijk, K. The economic value of corporate eco-efficiency. Eur. Financ. Manag. 2011, 17, 679–704. [Google Scholar] [CrossRef]
- Schreck, P. Reviewing the business case for corporate social responsibility: New evidence and analysis. J. Bus. Ethics 2011, 103, 167–188. [Google Scholar] [CrossRef]
- Surroca, J.; Tribo, J.A.; Waddock, S. Corporate responsibility and financial performance: The role of intangible resources. Strateg. Manag. J. 2010, 31, 463–490. [Google Scholar] [CrossRef]
- Garcia-Castro, R.; Arino, M.A.; Canela, M.A. Does social performance really lead to financial performance? Accounting for endogeneity. J. Bus. Ethics 2010, 92, 107–126. [Google Scholar] [CrossRef]
- Aras, G.; Aybars, A.; Kutlu, O. Managing corporate performance: Investigating the relationship between corporate social responsibility and financial performance in emerging markets. Int. J. Product. Perform. Manag. 2010, 59, 229–254. [Google Scholar] [CrossRef]
- Mahoney, L.; Roberts, R.W. Corporate social performance, financial performance and institutional ownership in Canadian firms. Account. Forum 2007, 31, 233–253. [Google Scholar] [CrossRef]
- Makni, R.; Francoeur, C.; Bellavance, F. Causality between corporate social performance and financial performance: Evidence from Canadian firms. J. Bus. Ethics 2009, 89, 409–422. [Google Scholar] [CrossRef]
- Bhagat, S.; Bolton, B. Corporate governance and firm performance. J. Corp. Financ. 2008, 14, 257–273. [Google Scholar] [CrossRef]
- Nelling, E.; Webb, E. Corporate social responsibility and financial performance: The ‘virtuous circle’ revisited. Rev. Quant. Financ. Account. 2009, 32, 197–209. [Google Scholar] [CrossRef]
- Shen, C.-H.; Chang, Y. Ambition versus conscience, does corporate social responsibility pay off? The application of matching methods. J. Bus. Ethics 2009, 88, 133–153. [Google Scholar] [CrossRef]
- Hull, C.E.; Rothenberg, S. Firm performance, the interactions of corporate social performance with innovation and industry differentiation. Strateg. Manag. J. 2008, 29, 781–789. [Google Scholar] [CrossRef]
- Waddock, S.A.; Graves, S.B. The corporate social performance—Financial performance link. Strateg. Manag. J. 1997, 18, 303–319. [Google Scholar] [CrossRef]
- Pirtea, M.; Botoc, C.; Jurcut, C. Risk and return analysis: Evidence from emerging markets. Transform. Bus. Econ. 2014, 13, 637–647. [Google Scholar]
- Felício, J.A.; Rodrigues, R.; Samagaio, A. Corporate Governance and the Performance of Commercial Banks: A Fuzzy-Set Qca Approach. J. Small Bus. Strategy 2016, 26, 87–101. [Google Scholar] [CrossRef]
- Lee, M.-D. A review of the theories of corporate social responsibility: Its evolutionary path and the road ahead. Int. J. Manag. Rev. 2008, 10, 53–73. [Google Scholar] [CrossRef]
- Fernandez-Sanchez, J.L.; Sotorrıo, L.L. The Creation of Value through Corporate Reputation. J. Bus. Ethics 2007, 76, 335–346. [Google Scholar] [CrossRef]
- Yuan, C.; Shen, C.H. Corporate social responsibility and profitability-Cost of debt as the mediator. Taipei Econ. Inq. 2014, 50, 291–397. [Google Scholar]
- Wang, Y.G. Corporate Social Responsibility and Stock Performance—Evidence from Taiwan. Mod. Econ. 2011, 2, 788–799. [Google Scholar] [CrossRef]
- Reverte, C. Corporate social responsibility disclosure and market valuation: Evidence from Spanish listed firms. Rev. Manag. Sci. 2014, 10, 1–25. [Google Scholar] [CrossRef]
- Flammer, C. Corporate Social Responsibility and Shareholder Reaction: The Environmental Awareness of Investors. Acad. Manag. J. 2013, 56, 758–781. [Google Scholar] [CrossRef]
- Sirghi, N.; Neamtu, M.; Cismas, L.M. The analysis of a competition and cooperation model of two enterprises with distributed time delay. In Proceedings of the International Conference ‘Current Economic Trends in Emerging and Developing Countries’, Timisoara, Romania, 18–20 June 2015; Mirton Publishing: Timisoara, Romania, 2015; pp. 1–11. [Google Scholar]
- Karagiorgos, T. Corporate Social Responsibility and Financial Performance: An Empirical Analysis on Greek Companies. Eur. Res. Stud. 2010, 13, 85–108. [Google Scholar]
- Verbeeten, F.H.M.; Gamerschlag, R.; Moeller, K. Are CSR disclosures relevant for investors? Empirical evidence from Germany. Manag. Decis. 2016, 54, 1359–1382. [Google Scholar] [CrossRef]
- Pintea, M.O. Performance Evaluation Literature Review and Time Evolution. J. Fac. Econ. 2012, 21, 753–758. [Google Scholar]
- Aquilani, B.; Silvestri, C.; Ioppolo, G.; Ruggieri, A. The challenging transition to bio-economies: Towards a new framework integrating corporate sustainability and value co-creation. J. Clean. Prod. 2017. [Google Scholar] [CrossRef]
Figure 1.
Interdependence between charitable contributions, performance, and market value.

Figure 2.
The selected performance indicators.
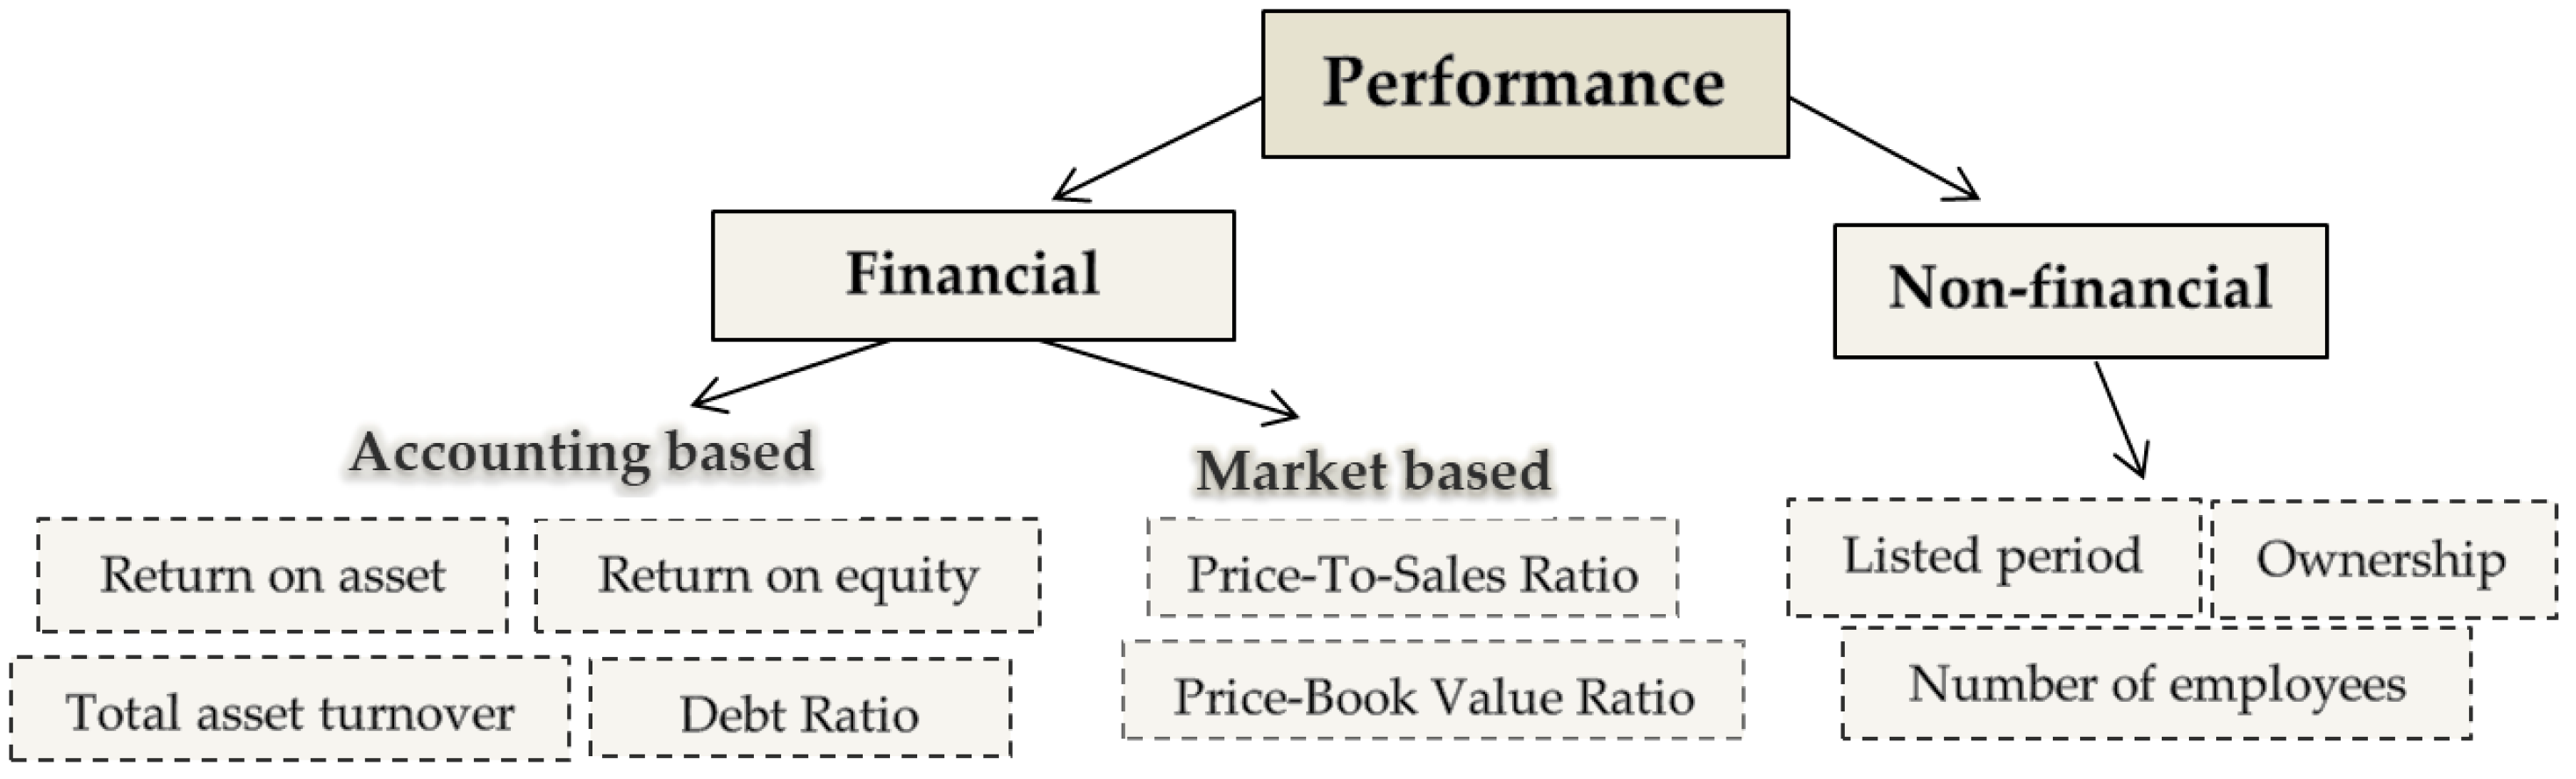
Table 1.
Calculation method for the analyzed indicators.
| Variables | Code | Literature | Formula |
|---|---|---|---|
| Tobins’ Q Ratio | QTobin | Wang et al. [21], Wei et al. [29], Harjoto and Jo [32], Omar and Zallom [33], Talebnia et al. [41], Manchiraju and Rajgopal [48], Dowell et al. [58], Chung and Pruitt [59], Callan and Thomas [60], Erhemjamts et al. [61], Guenster et al. [62], Schreck [63] Surroca et al. [64], Garcia-Castro et al. [65] | (Number of shares x market price at 31 December + Total liabilities) scaled by Total assets |
| Return on asset | ROA | Wang et al. [21], Callan and Thomas [60], Erhemjamts et al. [61], Garcia-Castro et al. [65], Guenster et al. [62], Aras et al. [66], Mahoney and Roberts [67], Makni et al. [68], Bhagat and Bolton [69], Nelling and Webb [70], Shen and Chang [71], Hull and Rothenberg [72], Waddock and Graves [73], Pirtea et al. [74], Felicio et al. [75], Lee [76], Fernandez-Sanchez and Sotorrıo [77] | Net profit scaled by Total assets |
| Return on equity | ROE | Callan and Thomas [60], Garcia-Castro et al. [65], Mahoney and Roberts [67], Makni et al. [68], Schreck [63], Shen and Chang [71] | Net profit scaled by Equity |
| Corporate Giving | Cgiving | Wang et al. [21], Liang and Renneboog [31], Harjoto and Jo [32], Iatridis [37], Navarro [38], Lin et al. [40] | Charitable contributions scaled by Turnover × 100 |
| Debt Ratio | DebtRatio | Chang and Chung-Hua [78] | Total liabilities scaled by Equity |
| Total asset turnover | TAT | Wei et al. [29] | Turnover scaled by Total assets |
| Price-To-Sales Ratio | PS | Wang Y.G. [79] | Market price at 31 December scaled by Turnover per share |
| Price-Book Value Ratio | PBV | Stefan [27] | Market price at 31 December scaled by Equity per share |
| No. of employees | NE | Reverte [80] | Number of the employees from the company |
| Listed period | LP | Flammer [81], Gherghina and Vintila [56] | Number of years since the company is on the stock market |
| Ownership | OWN | Talebnia et al. [41], Yu [42] | Dummy variable: it takes a value of 1 if the company has a majority of private shareholders and a value of 0 if the company is majority state-owned |
Table 2.
Descriptive statistics.
| Variable | Mean | Std. Dev. | Min | Max |
|---|---|---|---|---|
| Qtobin | 0.7231655 | 0.3006005 | 0.1007 | 1.7232 |
| LP | 14.81034 | 4.402273 | 3 | 21 |
| NE | 858.2241 | 952.3525 | 13 | 4951 |
| OWN | 0.7931034 | 0.4062498 | 0 | 1 |
| ROA | 0.0460707 | 0.0434227 | 0 | 0.1943 |
| TAT | 0.6999109 | 0.4536004 | 0.0214 | 2.7075 |
| ROE | 0.0704948 | 0.0637147 | 0 | 0.2928 |
| PBV | 0.6892678 | 0.4509658 | 0.0716 | 2.3279 |
| PS | 0.9608707 | 0.8920257 | 0.0888 | 6.6285 |
| DebtRatio | 0.5354695 | 0.6137672 | 0.0324 | 3.8006 |
| Cgiving | 0.1111632 | 0.1147411 | 0 | 0.7179 |
Table 3.
The correlation matrix.
| Variables | Qtobin | LP | NE | OWN | ROA | TAT | ROE | PBV | PS | Debtratio | Cgiving |
|---|---|---|---|---|---|---|---|---|---|---|---|
| Qtobin | 1 | ||||||||||
| LP | 0.1784 | 1 | |||||||||
| NE | 0.0892 | −0.3621 | 1 | ||||||||
| OWN | 0.1776 | 0.3270 | −0.5806 | 1 | |||||||
| ROA | 0.5614 | −0.0766 | 0.2495 | −0.0321 | 1 | ||||||
| TAT | 0.5140 | 0.2530 | −0.0135 | 0.2745 | 0.4218 | 1 | |||||
| ROE | 0.5645 | −0.0091 | 0.2649 | −0.0033 | 0.9377 | 0.5264 | 1 | ||||
| PBV | 0.8986 | 0.1036 | 0.1585 | 0.0600 | 0.5436 | 0.3961 | 0.5704 | 1 | |||
| PS | −0.0418 | −0.1589 | −0.0193 | −0.0221 | 0.0106 | −0.5395 | −0.1107 | 0.0552 | 1 | ||
| DebtRatio | 0.2347 | 0.2089 | −0.0487 | 0.2099 | −0.1985 | 0.4411 | 0.0378 | 0.1059 | −0.4115 | 1 | |
| Cgiving | 0.1703 | −0.0200 | −0.0223 | 0.0980 | 0.0940 | −0.1579 | −0.0327 | 0.1651 | 0.2447 | −0.2675 | 1 |
Table 4.
The result of logistic regression using corporate giving as dependent variable for all the companies.
Table 4.
The result of logistic regression using corporate giving as dependent variable for all the companies.
| Dependent Variable: Corporate Giving (Dummy) | ||||||||
|---|---|---|---|---|---|---|---|---|
| Variables | Model 1 | Model 2 | ||||||
| Coef. | Std. Err. | z | P > |z| | Coef. | Std. Err. | z | P > |z| | |
| qTobin | 7.787 | 1.7378 | 4.48 | 0.000 | 8.7861 | 1.7631 | 4.98 | 0.000 |
| ROE | −7.701 | 3.9725 | −1.94 | 0.053 | −11.437 | 5.1023 | −2.24 | 0.025 |
| PBV | −1.951 | 1.0050 | −1.94 | 0.052 | −2.3867 | 1.1189 | −2.12 | 0.033 |
| No of observation = 174 | No of observation = 145 | |||||||
| Pearson chi2(174) = 172.14 | Pearson chi2(145) = 100.62 | |||||||
| Wald chi2(3) = 26.56 | Wald chi2(3) = 35.96 | |||||||
| Prob > chi2 = 0.0000 | Prob > chi2 = 0.0000 | |||||||
Table 5.
The result of panels-corrected standard errors (PCSE) regression using Tobin’s Q Ratio as dependent variable for all the companies.
Table 5.
The result of panels-corrected standard errors (PCSE) regression using Tobin’s Q Ratio as dependent variable for all the companies.
| Dependent variable: Tobin’s Q Ratio | ||||||||
|---|---|---|---|---|---|---|---|---|
| Variables | Model 1 | Model 2 | ||||||
| Coef. | Std. Err. | z | P > |z| | Coef. | Std. Err. | z | P > |z| | |
| ROA | 6.1252 | 0.8203 | 7.47 | 0.000 | 5.5327 | 1.3457 | 4.11 | 0.000 |
| TAT | 0.1889 | 0.0255 | 7.38 | 0.000 | 0.1758 | 0.0440 | 3.96 | 0.000 |
| ROE | −3.696 | 0.5446 | −6.79 | 0.000 | −2.386 | 0.8895 | −2.68 | 0.007 |
| PBV | 0.5203 | 0.0255 | 20.40 | 0.000 | 0.4237 | 0.0416 | 10.17 | 0.000 |
| PS | 0.0602 | 0.0097 | 6.18 | 0.000 | 0.0685 | 0.0176 | 3.88 | 0.000 |
| CGiving | 0.2703 | 0.0810 | 3.34 | 0.001 | 0.3893 | 0.1368 | 2.82 | 0.004 |
| DebtRatio | 0.1947 | 0.0208 | 9.33 | 0.000 | 0.1727 | 0.0347 | 4.97 | 0.000 |
| No of observation = 174 | No of observation = 145 | |||||||
| R-squared = 0.97 | R-squared = 0.95 | |||||||
| Wald chi2(7) = 7966.15 | Wald chi2(7) = 2926.56 | |||||||
| Prob > chi2 = 0.0000 | Prob > chi2 = 0.0000 | |||||||
Table 6.
The result of PCSE regression using ROE as dependent variable for all the companies.
| Dependent Variable: ROE | ||||
|---|---|---|---|---|
| Variables | Coef. | Std. Err. | z | P > |z| |
| ROA | 1.4646 | 0.0358 | 40.89 | 0.000 |
| TAT | 0.0085 | 0.0035 | 2.40 | 0.016 |
| qTobin | −0.0566 | 0.0083 | −6.79 | 0.000 |
| PBV | 0.0342 | 0.0052 | 6.58 | 0.000 |
| PS | 0.0011 | 0.0013 | 0.86 | 0.392 |
| CGiving | −0.0175 | 0.0102 | −1.71 | 0.087 |
| DebtRatio | 0.0269 | 0.0024 | 11.12 | 0.000 |
| No of observation = 174 | ||||
| R-squared = 0.97 | ||||
| Wald chi2(7) = 7634.64 | ||||
| Prob > chi2 = 0.0000 | ||||
Table 7.
The result of logistic regression using corporate giving as dependent variable for the companies with less than 500 employees.
Table 7.
The result of logistic regression using corporate giving as dependent variable for the companies with less than 500 employees.
| Dependent variable: Corporate Giving (Dummy) | ||||||||
|---|---|---|---|---|---|---|---|---|
| Variables | Model 1 | Model 2 | ||||||
| Coef. | Std. Err. | z | P > |z| | Coef. | Std. Err. | z | P > |z| | |
| qTobin | 8.416 | 2.3818 | 3.53 | 0.000 | 10.985 | 2.8725 | 3.82 | 0.000 |
| ROE | −11.007 | 5.2309 | −2.10 | 0.035 | −15.888 | 5.8807 | −2.70 | 0.007 |
| PBV | −3.071 | 2.0698 | −1.48 | 0.138 | −4.8352 | 3.0327 | −1.59 | 0.111 |
| No of observation = 96 | No of observation = 80 | |||||||
| Pearson chi2(96) = 102.99 | Pearson chi2(80) = 59.04 | |||||||
| Wald chi2(7) = 14.29 | Wald chi2(7) = 23.72 | |||||||
| Prob > chi2 = 0.0025 | Prob > chi2 = 0.0000 | |||||||
Table 8.
The result of PCSE regression using Tobin’s Q Ratio as dependent variable for the companies with less than 500 employees.
Table 8.
The result of PCSE regression using Tobin’s Q Ratio as dependent variable for the companies with less than 500 employees.
| Dependent Variable: Tobin’s Q Ratio | ||||||||
|---|---|---|---|---|---|---|---|---|
| Variables | Model 1 | Model 2 | ||||||
| Coef. | Std. Err. | z | P > |z| | Coef. | Std. Err. | z | P > |z| | |
| ROA | 4.9871 | 0.9837 | 5.07 | 0.000 | 2.756 | 0.5989 | 4.60 | 0.000 |
| TAT | 0.0954 | 0.0269 | 3.54 | 0.000 | - | - | - | - |
| ROE | −3.5711 | 0.7232 | −4.94 | 0.000 | - | - | - | - |
| PBV | 0.7432 | 0.0321 | 23.15 | 0.000 | 0.5656 | 0.0734 | 7.71 | 0.000 |
| PS | 0.1564 | 0.0081 | 4.43 | 0.000 | 0.0504 | 0.0205 | 2.45 | 0.014 |
| CGiving | 0.1564 | 0.0690 | 2.27 | 0.023 | 0.3901 | 0.1634 | 2.39 | 0.017 |
| DebtRatio | 0.2037 | 0.0216 | 9.39 | 0.000 | 0.1675 | 0.0289 | 5.79 | 0.000 |
| No of observation = 96 | No of observation = 80 | |||||||
| R-squared = 0.98 | R-squared = 0.94 | |||||||
| Wald chi2(7) = 7400.49 | Wald chi2(5) = 1348.18 | |||||||
| Prob > chi2 = 0.0000 | Prob > chi2 = 0.0000 | |||||||
Table 9.
The result of PCSE regression using ROE as dependent variable for the companies with less than 500 employees.
Table 9.
The result of PCSE regression using ROE as dependent variable for the companies with less than 500 employees.
| Dependent Variable: ROE | ||||
|---|---|---|---|---|
| Variables | Coef. | Std. Err. | z | P > |z| |
| ROA | 1.316 | 0.0380 | 34.56 | 0.000 |
| TAT | 0.0118 | 0.0032 | 3.67 | 0.000 |
| qTobin | −0.0526 | 0.0099 | −5.30 | 0.000 |
| PBV | 0.0336 | 0.0094 | 3.55 | 0.000 |
| DebtRatio | 0.0260 | 0.0025 | 10.07 | 0.000 |
| No of observation = 96 | ||||
| R-squared = 0.98 | ||||
| Wald chi2(5) = 6626.12 | ||||
| Prob > chi2 = 0.0000 | ||||
Table 10.
The result of PCSE and logistic regressions for the non-financial indicators.
| DV: | Tobin’s Q Ratio | ROE | Corporate Giving (Dummy) | |||||||||
|---|---|---|---|---|---|---|---|---|---|---|---|---|
| Variables | Coef. | Std. Err. | z | P > |z| | Coef. | Std. Err. | z | P > |z| | Odds Ratio | Std. Err. | Z | P > |z| |
| LP | 0.02278 | 0.00366 | 6.21 | 0.000 | 0.00120 | 0.0077 | 1.56 | 0.118 | 1.178 | 0.0949 | 4.45 | 0.041 |
| NE | 0.00015 | 0.00002 | 7.11 | 0.000 | 0.00002 | 4.51 | 6.35 | 0.000 | 1.0009 | 0.0004 | 1.90 | 0.000 |
| OWN | 0.30823 | 0.05722 | 5.39 | 0.000 | 0.03514 | 0.0120 | 2.92 | 0.003 | 1.827 | 2.158 | 0.51 | 0.610 |
| No. of observation = 174 | No. of observation = 174 | No. of observation = 174 | ||||||||||
| R-squared = 0.86 | R-squared = 0.58 | Pearson chi2(174) = 151.18 | ||||||||||
| Wald chi2(3) = 1134.93 | Wald chi2(3) = 247.83 | Wald chi2(2) = 23.53 | ||||||||||
| Prob > chi2 = 0.0000 | Prob > chi2 = 0.0000 | Prob > chi2 = 0.0000 | ||||||||||
Table 11.
Summary.
| Dependent Variables | Corporate Giving | Tobin’s Q Ratio | Return on Equity |
|---|---|---|---|
| Independent Variables | |||
| Tobins’ Q Ratio | Yes | - | Yes |
| Return on asset | - | Yes | Yes |
| Total asset turnover | - | Yes | Yes |
| Return on equity | Yes | Yes | - |
| Price-Book Value Ratio | Yes | Yes | Yes |
| Price-To-Sales Ratio | - | Yes | No |
| Corporate Giving | - | Yes | No |
| Debt Ratio | - | Yes | Yes |
| Listed period | Yes | Yes | No |
| Number of employees | Yes | Yes | Yes |
| Ownership | No | Yes | Yes |
© 2017 by the authors. Licensee MDPI, Basel, Switzerland. This article is an open access article distributed under the terms and conditions of the Creative Commons Attribution (CC BY) license (http://creativecommons.org/licenses/by/4.0/).
Share and Cite
MDPI and ACS Style
Hategan, C.-D.; Curea-Pitorac, R.-I. Testing the Correlations between Corporate Giving, Performance and Company Value. Sustainability 2017, 9, 1210. https://doi.org/10.3390/su9071210
AMA Style
Hategan C-D, Curea-Pitorac R-I. Testing the Correlations between Corporate Giving, Performance and Company Value. Sustainability. 2017; 9(7):1210. https://doi.org/10.3390/su9071210
Chicago/Turabian StyleHategan, Camelia-Daniela, and Ruxandra-Ioana Curea-Pitorac. 2017. "Testing the Correlations between Corporate Giving, Performance and Company Value" Sustainability 9, no. 7: 1210. https://doi.org/10.3390/su9071210
Note that from the first issue of 2016, this journal uses article numbers instead of page numbers. See further details here.