1. Introduction
The criteria for the sustainable development of coal resources includes ensuring that their development and utilization cannot exceed the bearing capacity limit of the reserve, while simultaneously achieving the optimal development and utilization within the bearing capacity range. Rich coal resources are situated beneath the geological condition of a thick alluvium layer and thin bedrock layer in China. For instance, the Shendong Coalfield is a typical coal bed with a thick alluvium and thin bedrock. It has estimated coal reserves of 223.6 billion t, which accounts for one-third of the national proven reserves [
1,
2]. The Qinshui, Huainan, Huaibei, Jiaozuo, and Jining coalfields also contain large coal seam volumes under this special geological condition [
3]. When a coal seam is extracted from beneath this geological condition, major coal accidents in the form of water inrush, sand inrush, people being buried, etc. may occur in the mining face if mining-induced fractures and unconsolidated layers are connected in the mining process. This causes enormous economic losses and casualties, and safe and highly efficient coal mining cannot be realized [
4,
5,
6]. The conventional production mode not only prevents the working face from succeeding normally, leading to unsustainable production, but also results in a large quantity of coal resources being retained, critically shortening the mine service life. This causes the management and development of the mine to be unsustainable and for thousands of mine workers to be unemployed. Therefore, to ensure safe mining, resource recovery must be maximized to extend the service life of the mine, which is beneficial to the sustainable development of the mine.
Determining the developmental range of the water-conducting fractured zone (WCFZ) is the key to determining the safe mining upper limit. Considerable scientific research has been carried out globally regarding the height of the mining-induced water-conducting zone and practical experience methods for mining underwater bodies. Many important research results have been achieved. Liu and Qian developed an experience formula that calculates the developmental height of the water-conducting zone based on considerable relevant theoretical research and practical explorations in this area. In addition, they conducted further research on the factors that affect the developmental height and processes of the water-conducting zone [
7,
8,
9]. Chuen, Dahl, Booth, and Von Schonfeld, and Peng et al. [
10,
11,
12,
13,
14] claimed that it was critical to determine the height of the water-conducting zone above a mined panel that allows water inflow into the working panel for the safe extraction of coal reserves. Wang and Ozfirat analyzed the effect of different mining parameters and equipment combinations on the movement and fracture development of the overlying strata [
15,
16,
17]. Chena used the composite element method to simulate the fractures and drainage holes for seepage analysis of rock masses containing fractures and drainage holes [
18]. Wu et al. [
19] proposed the ‘three pictures–two predictions method’ for the quantitative evaluation of the roof water inrush condition. Legrand et al. [
20] proposed that the goal of preventing water inrush disasters was to control the water inrush channel and prevent a leaky mutant channel from forming when a coal seam was extracted using an aquifer. Miao et al. [
21] conducted research on the developmental law of the mining-induced water-conducting channel based on a system analysis of the hydrogeological structure of the Shendong mining area. Fan and Zhang, and Ma et al. [
22,
23] carried out studies on the dynamic developmental law of the water-conducting zone for a single key layer in a Shendong shallow coal/shallow buried seam with loose aquifers located in the overburden in northern Shanxi. Peng et al. [
24] analyzed the migration law of a bed crack after coal mining by establishing a mathematical model to predict the impact on the ground surface after mining. In relation to this, they conducted numerous scientific studies. Through investigation and analysis, Bulau et al. [
25,
26] found that the permeability of groundwater and the comprehensive effects of hydrochemistry aggravate the interaction and gathering effect of a fracture, making it easier to meet the conditions for rock failure and generate more cracks. Many countries have performed numerous unique studies on the mining of underwater bodies, and many breakthroughs have been achieved. The former Soviet Union stipulated that the height of a waterproof pillar be 20–40 times the mining height in the presence of an aquifer; otherwise, it is 20–40 times the mining height according to the proportion of different rock properties in the overlying strata. The United States stipulates that the safe mining depth is 60 times the mining height under a large surface water body [
27]. The British stipulation is that the main design factor is to limit the horizontal strain of the aquifer’s lower surface to less than 10 mm/m for the coal mining of underwater bodies. Safe mining was realized without the occurrence of water inrush disasters in a coal mine in northeast Britain [
28]. ‘Regulations on buildings, water bodies, railways, and main roadways leaving coal pillars and unexploited coal’ details the design methods for underwater coal bodies and rock pillars to ensure safety, and which are appropriate for conventional mining, fully mechanized mining, and slice mining; it stipulates an equation for the water-conducting zone [
29]:
where
H: Maximum height of the water-conducting zone, m;
M: Mining height, m;
a,
b: Coefficients, depending upon the lithology, 1.2, 2;
c: Mean square deviation, 8.9.
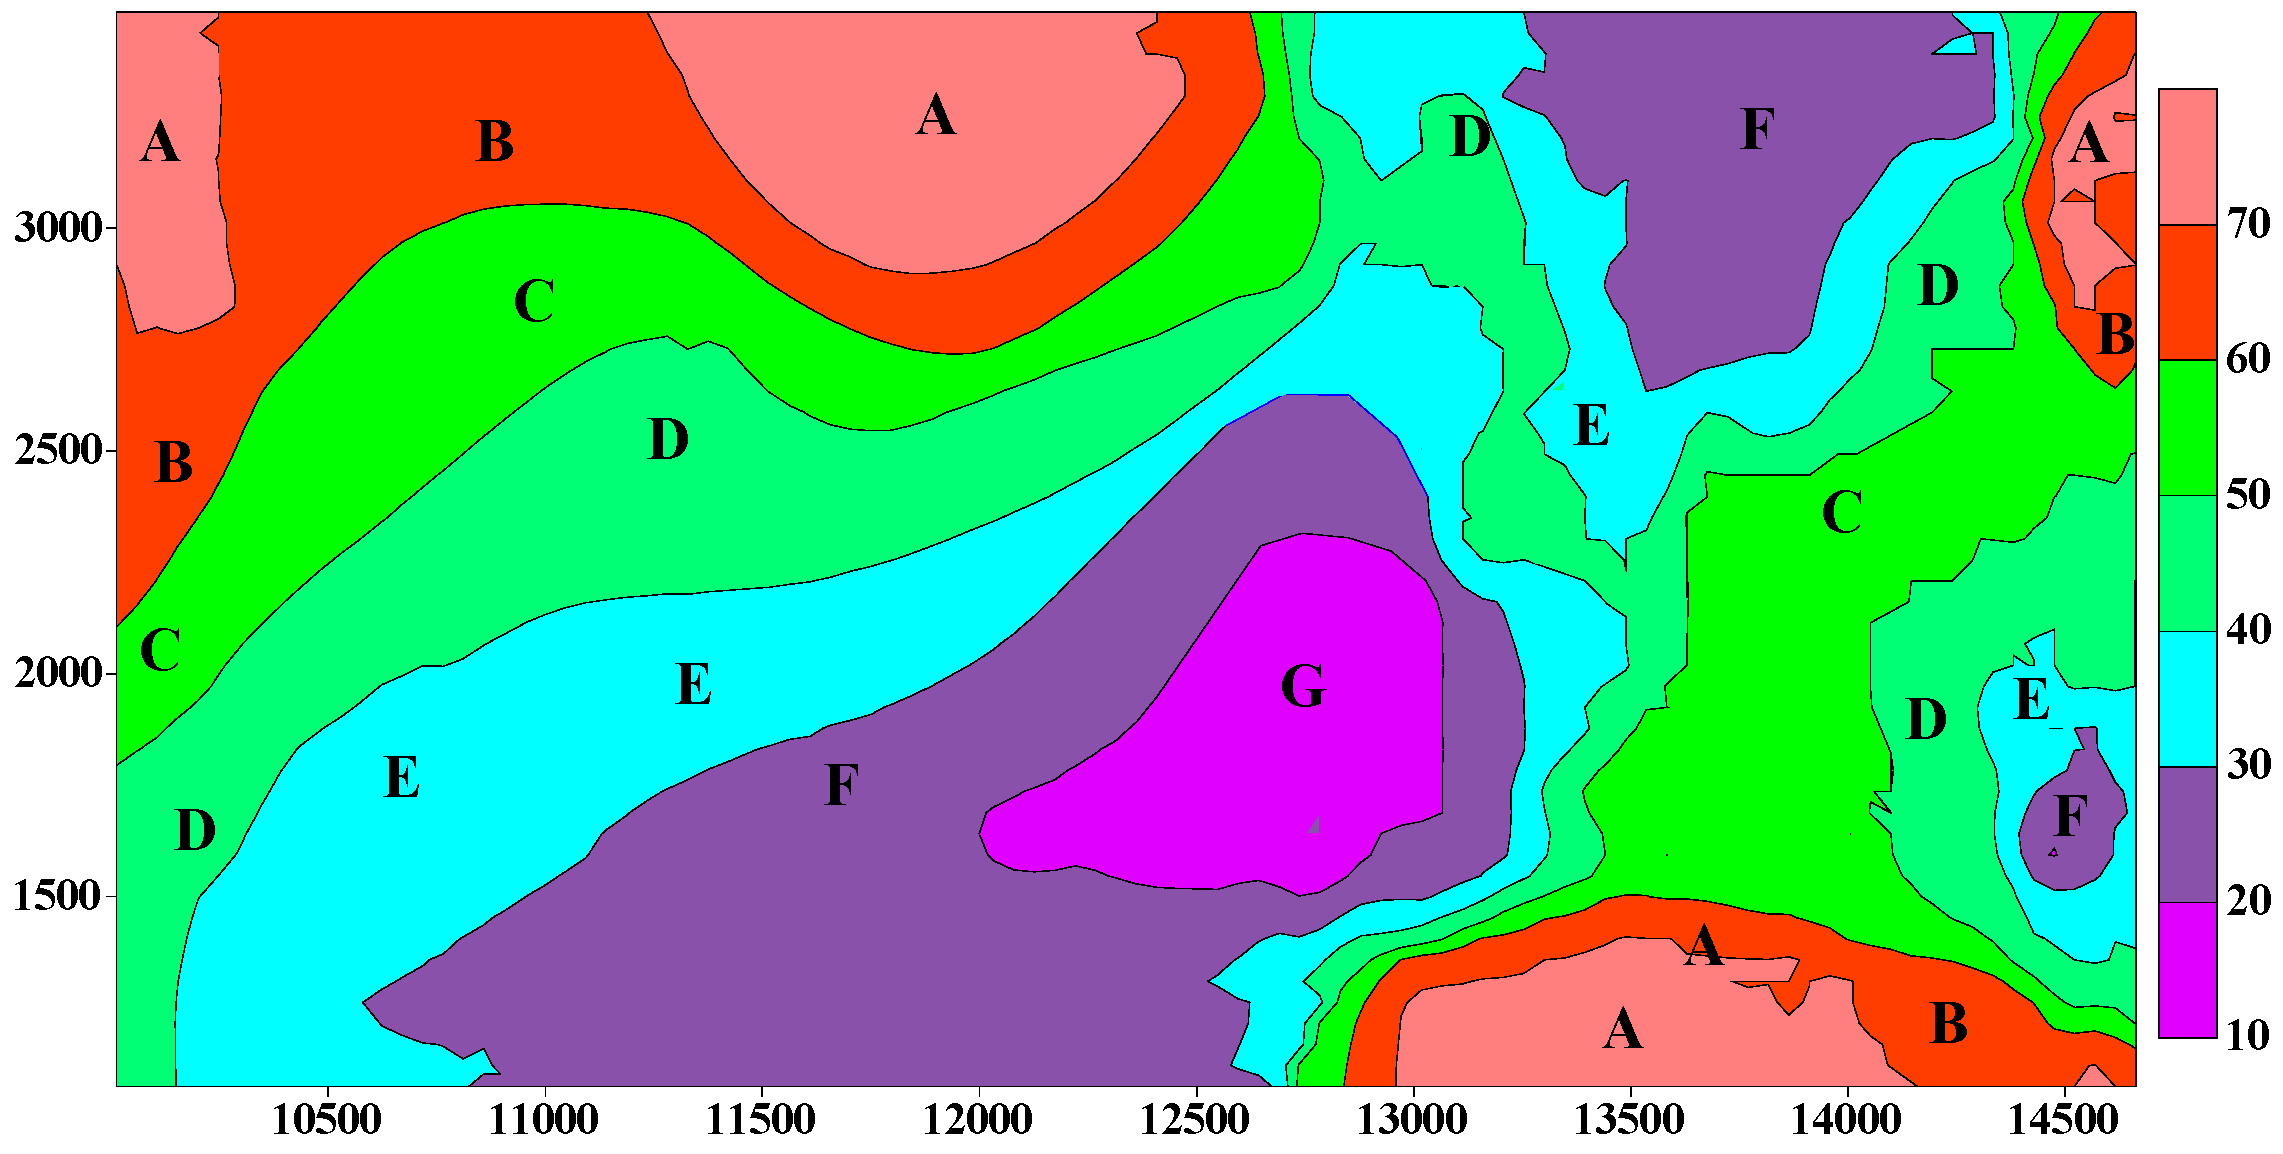
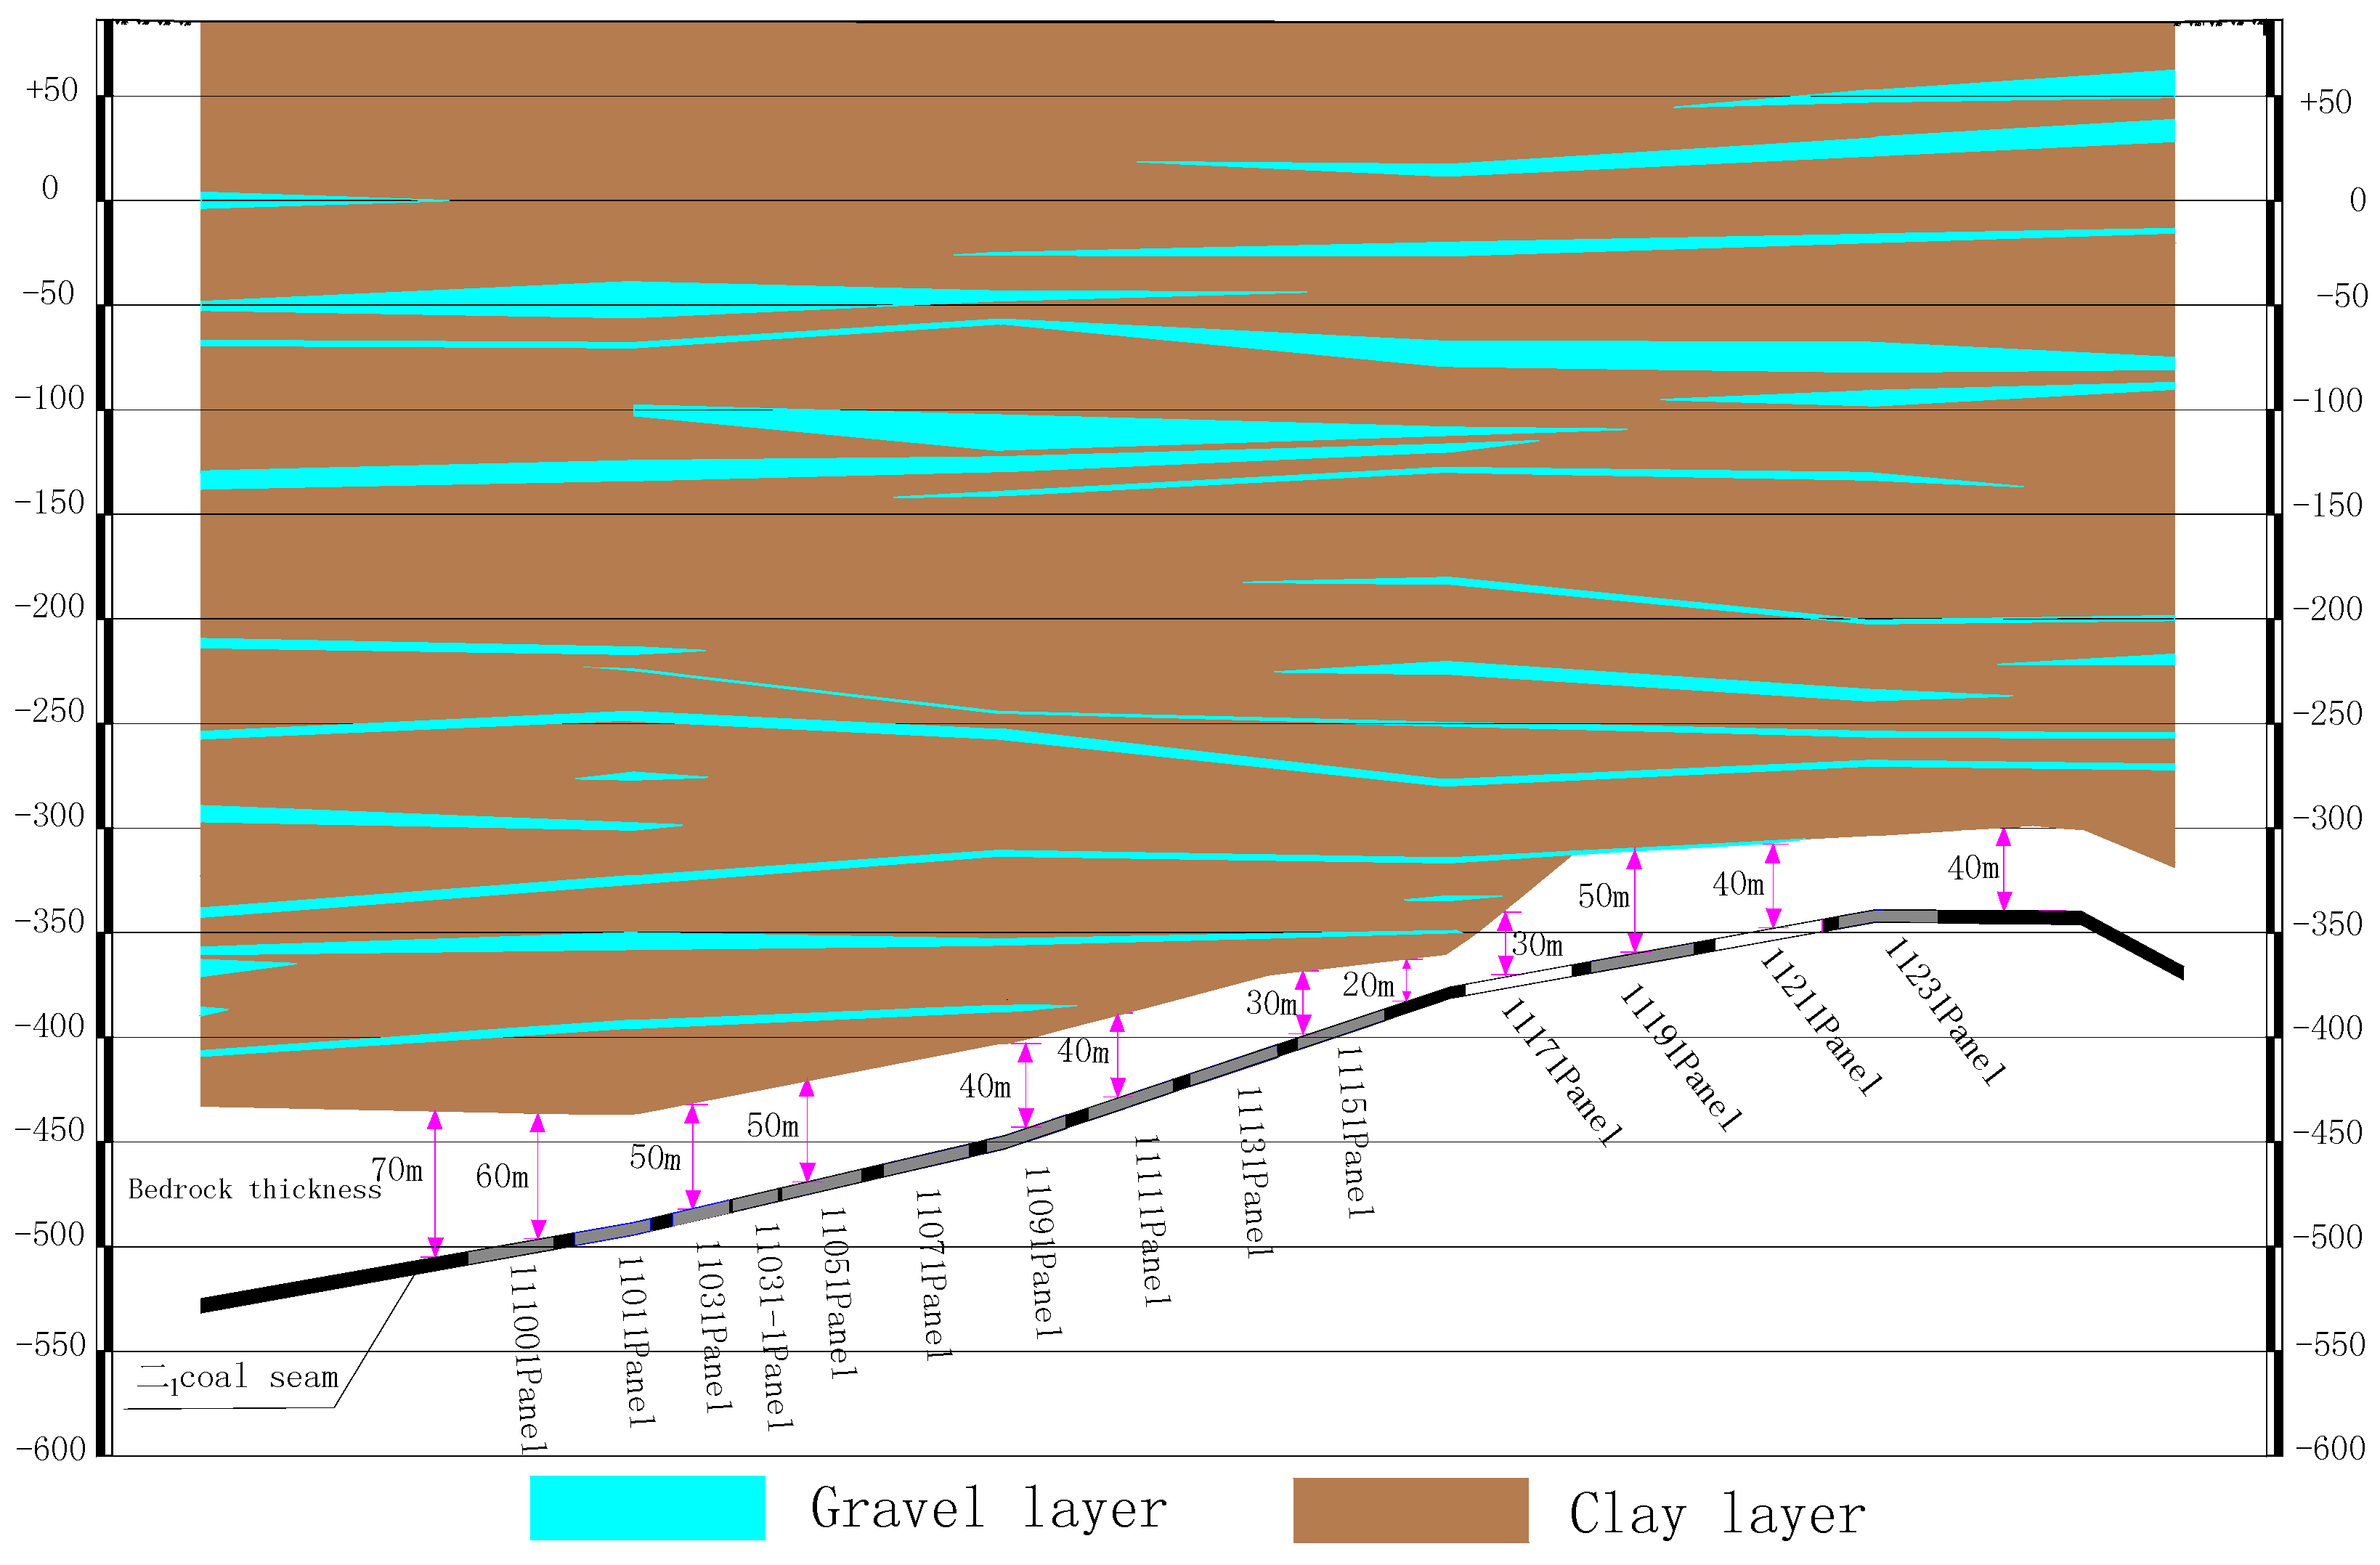
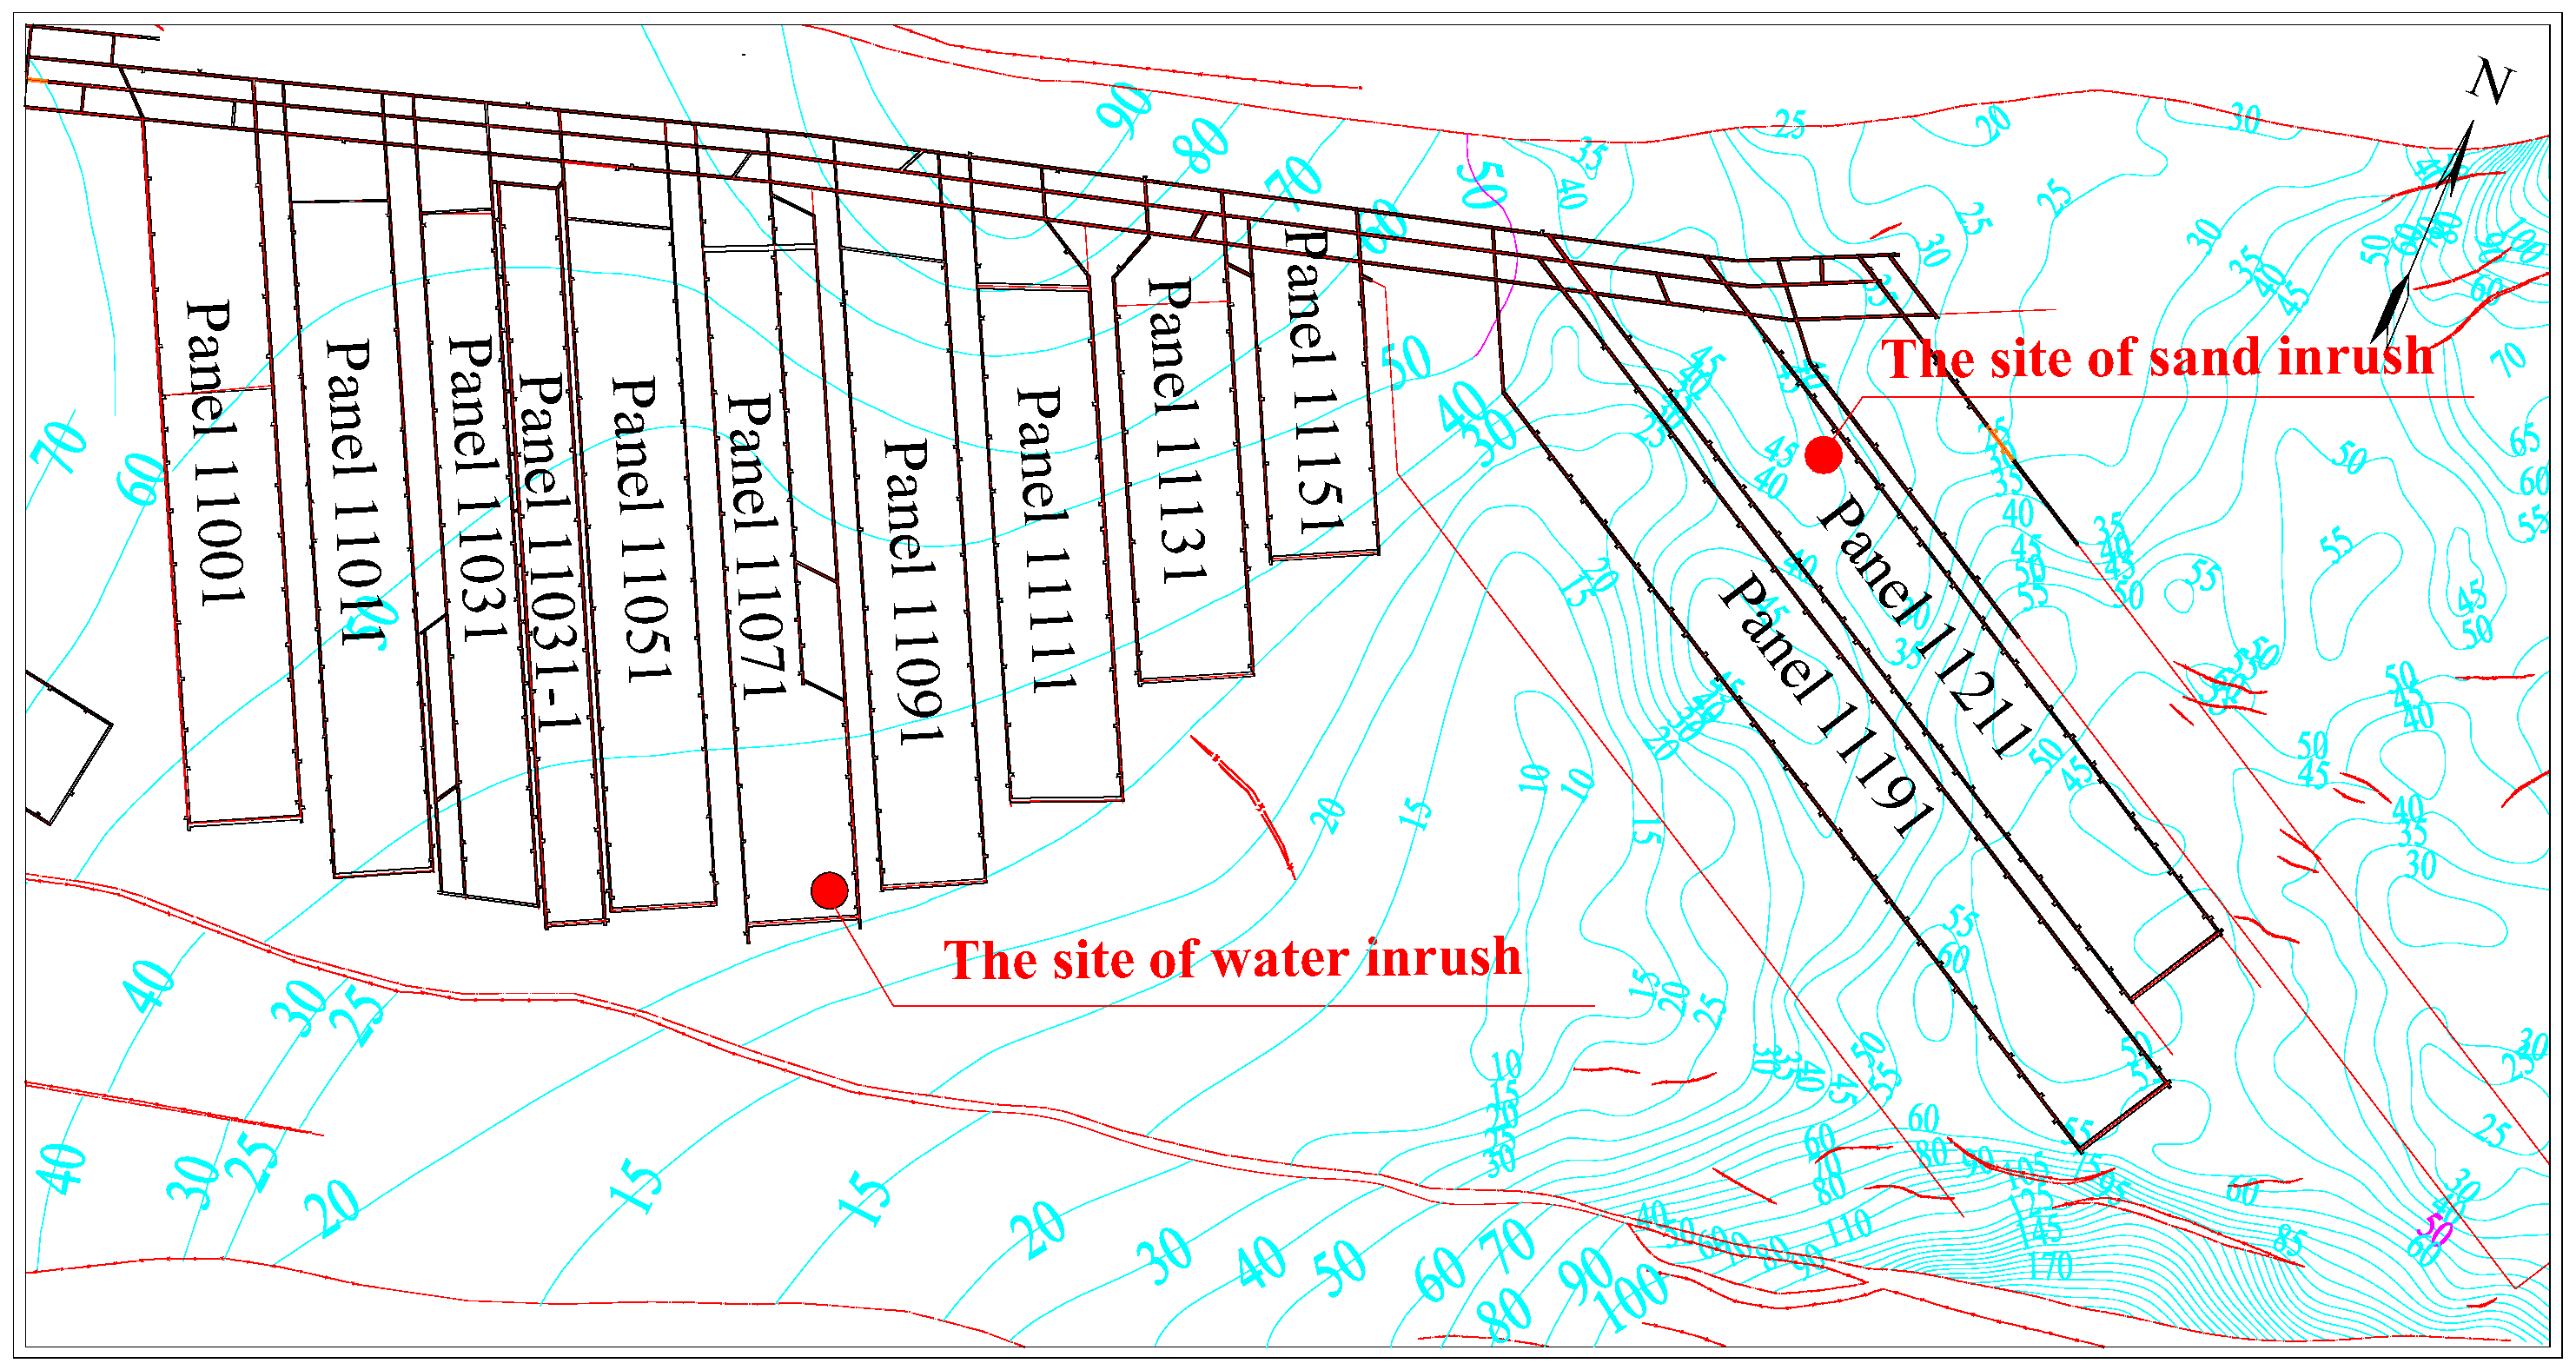
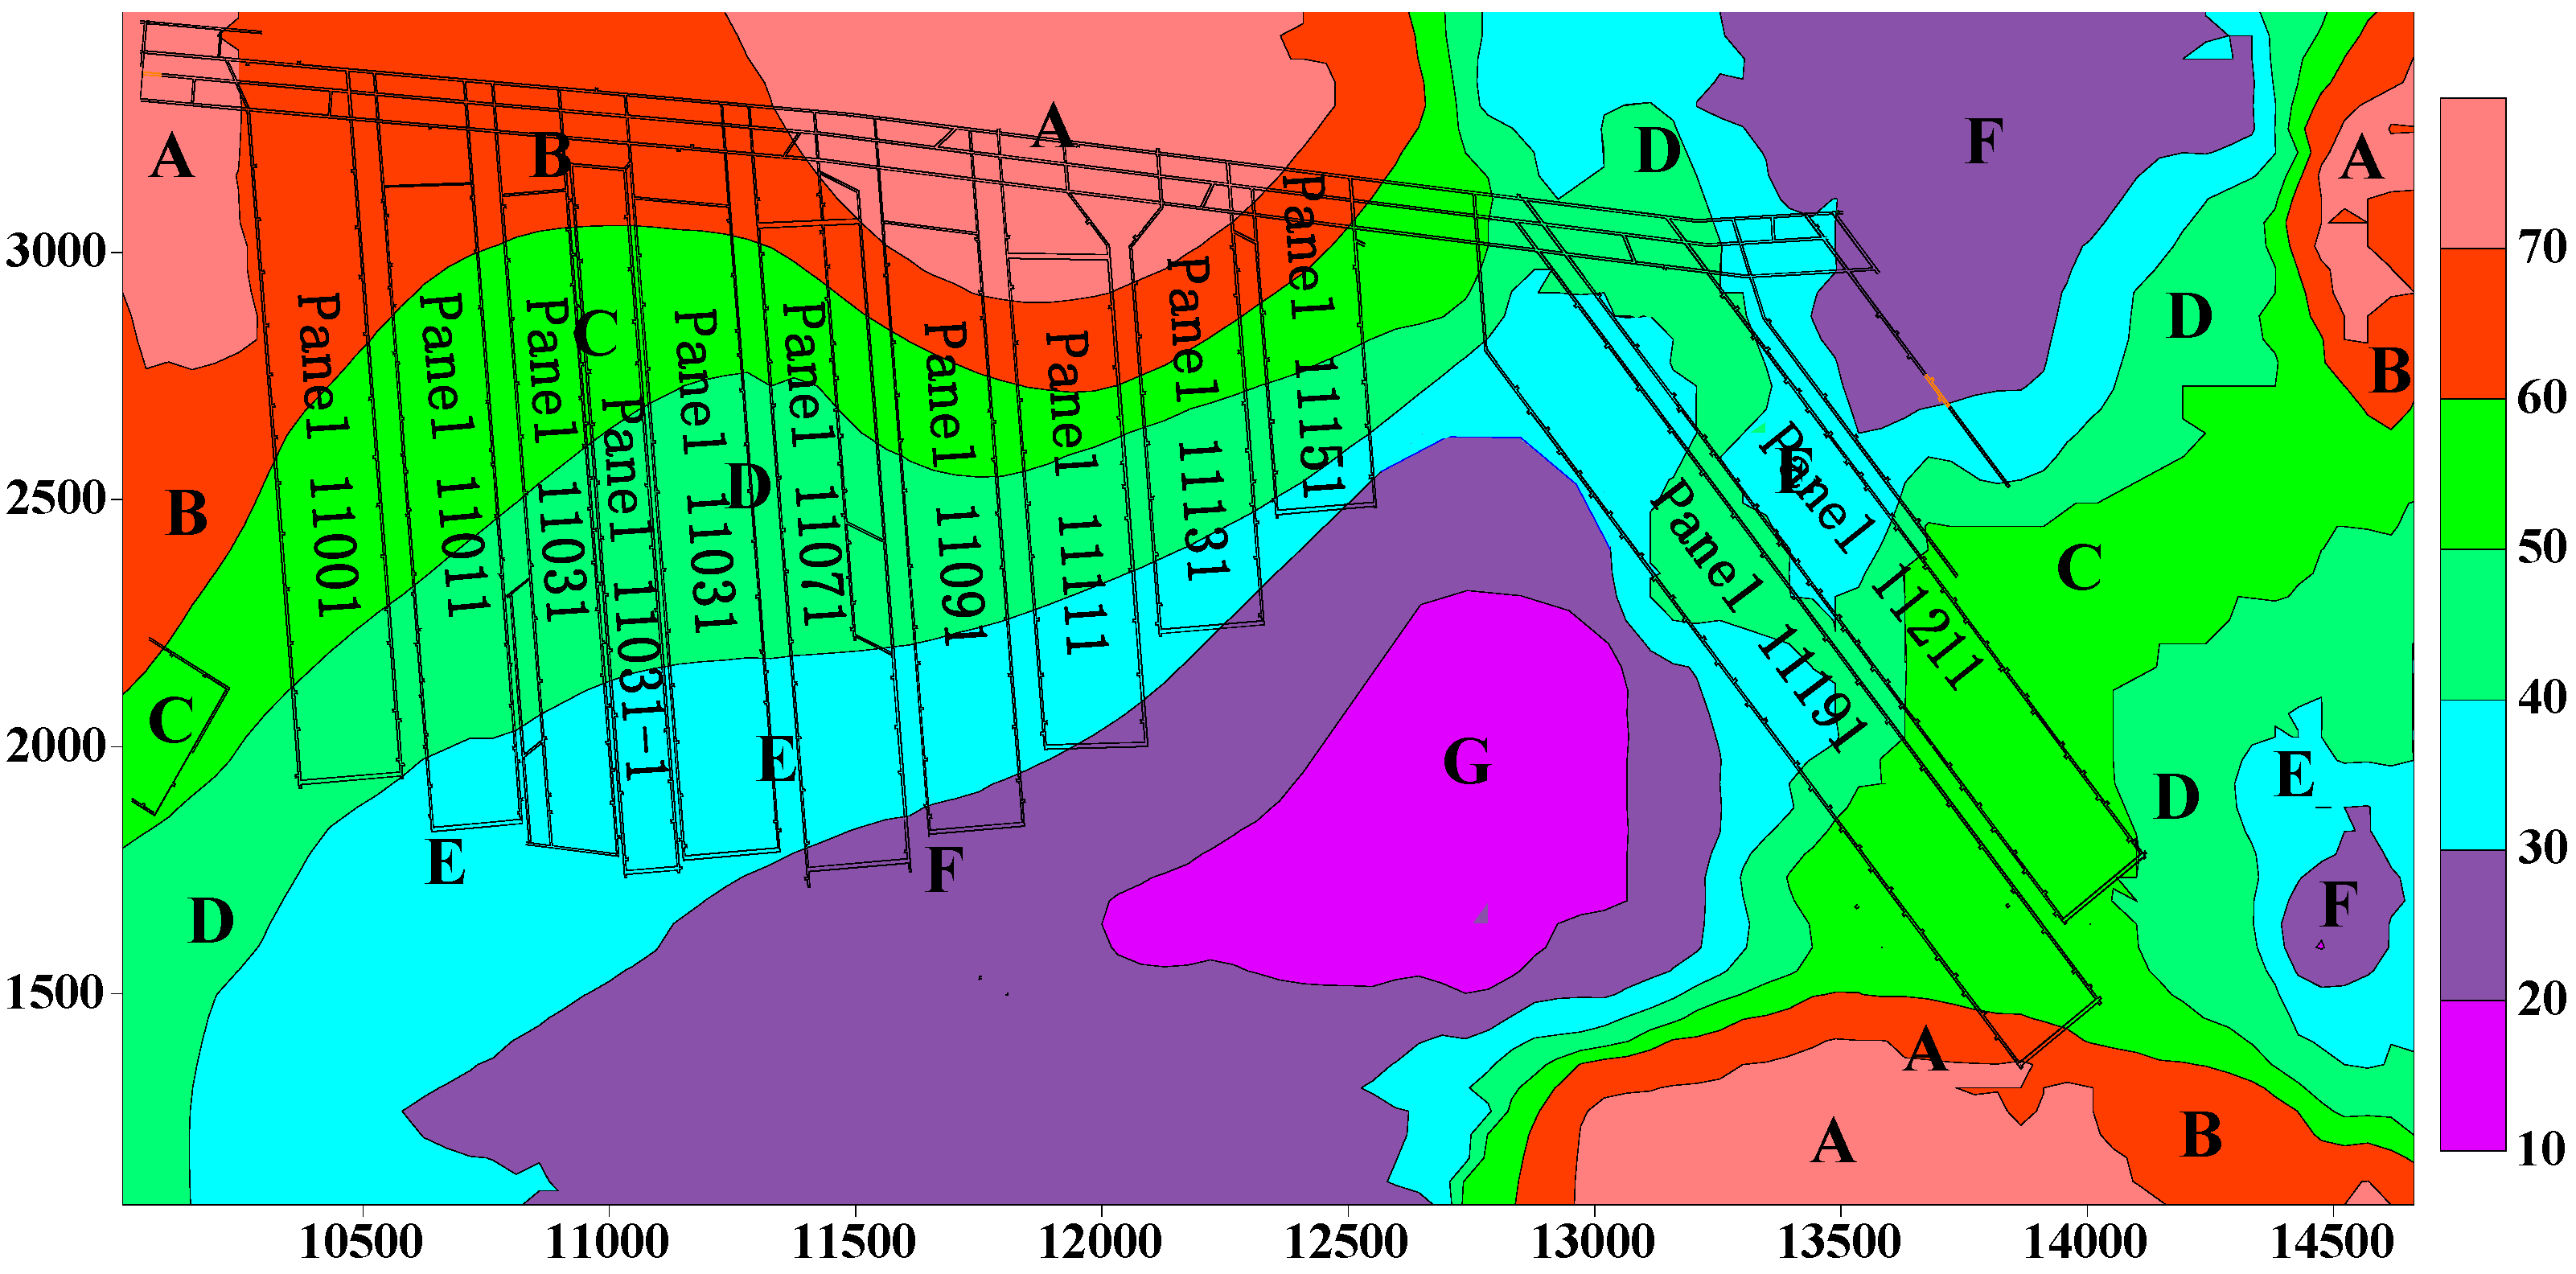
The lowest bedrock thickness in the Zhao Gu No. 1 coal mine is 13.87 m. The thickness of the unconsolidated layers is in the range of 384.25–518.85 m. The thin bedrock area of the Zhao Gu No. 1 coal seam is divided into seven areas according to the bedrock thickness, as shown in
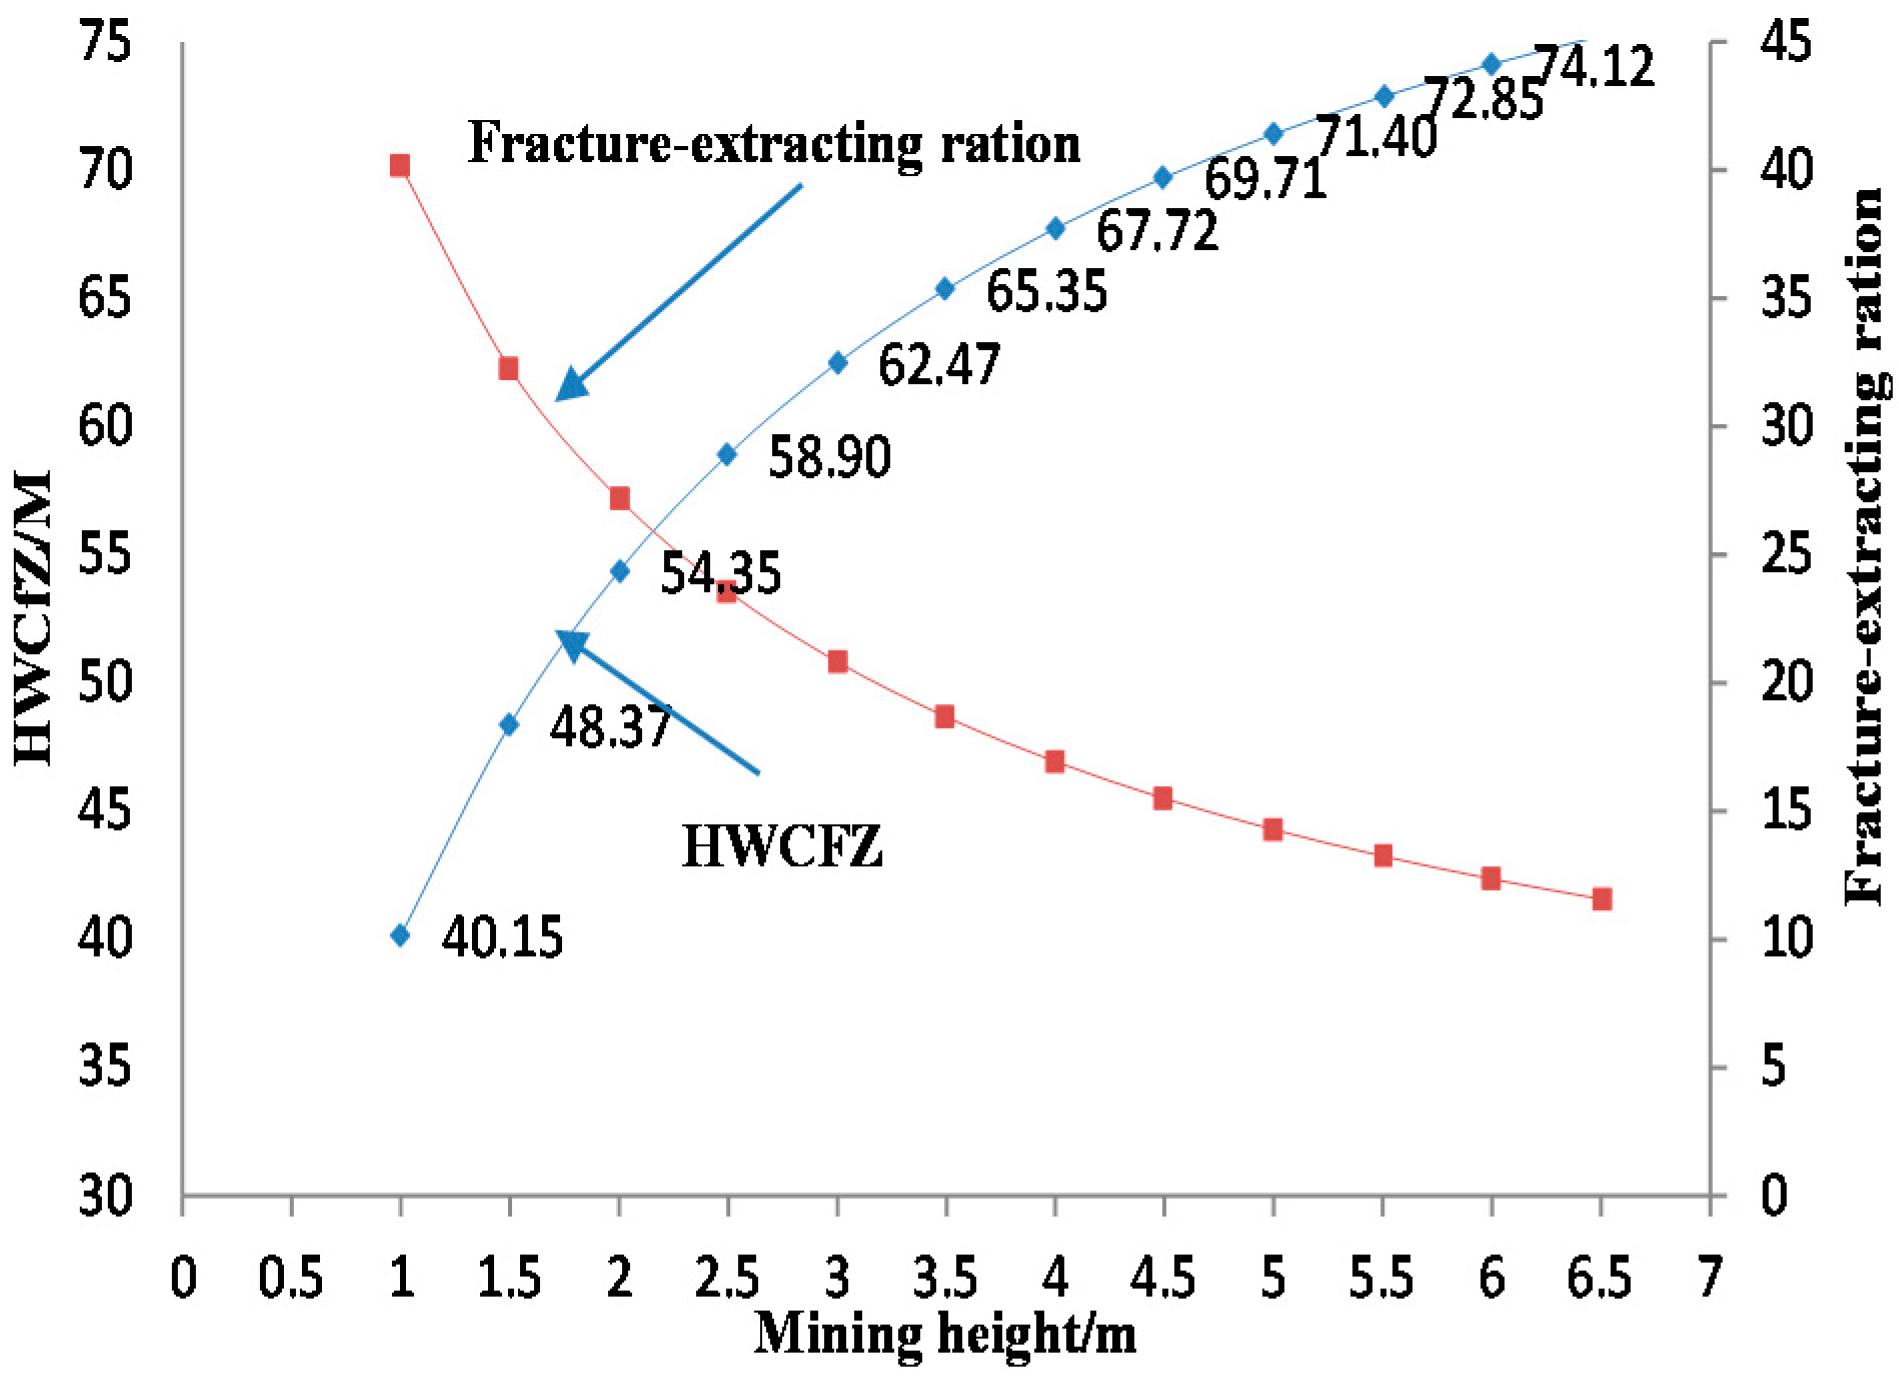
Figure 1. The developmental maximum height of the water-conducting fractured zone (HCWFZ) is calculated using Equation (1), as shown in
Figure 2. Partition limited mining is conducted in this area, with maximum mining heights of 3.5, 2, and 1.5 m for zones A, B, and C, respectively. Zones D, E, F, and G zone are forbidden mining areas. If the development maximum HCWFZ calculated using Equation (1) is adopted, valuable coal resources will be lost, and the mine service life will be significantly shortened. During the tentative extraction in this area, water and sand inrush occurred. Water seepage at the roof occurred in the no. 13 drilling field, which is approximately 10 m from the roadway of the 11,071 working face at a mining height of 3.5 m. A maximum water flow of approximately 120 m
3/h occurred, and the water contained considerable sediment (approximately 3000 m
3) accumulated in the coal mining face and roadway, resulting in a drainage system fault and a break in coal mining production. Water inrush disasters occurred in the 11,211 panel at a 3.5 m mining height with the working face advancing at 1095 m; the total water flow was approximately 120 m
3/h, which caused the mine to cease production.
Therefore, this study was conducted based on the concrete geological condition of the 二1 coal seam of the Zhao Gu No. 1 coal mine, by analyzing and studying the development of the HWCFZ at different bedrock thicknesses and mining heights for the prediction and forecast of the prevention of water and sand collapse. This provides evidence for the upper limit of mining, reforms the conventional production mode, protects the coal resources, and improves the recovery rate of the resources. The sustainable development of the mine is therefore realized.
3. Numerical Simulation of Distribution and Evolution Characteristics of Mining-Induced Fracture
UDEC is a tool that uses a problem-solving program with a display to provide effective and accurate analyses in geotechnical engineering. In particular, it is suitable for analyzing the response of the jointed rock system and collection system of a discontinuous block under static plate loading or power loading. It has been successfully used in numerous applications for studies on rock failure and the development of rock fracture. It is widely used in geotechnical-related fields.
3.1. Numerical Model Construction
To ensure the validity of the model, the numerical simulation results and in-situ measurement height of the water-conducting zone of the adjacent panel were fitted. If the numerical simulation results and measurement data were well correlated, the parameters of the numerical simulation were available. A total of 11,011 working panels were selected to observe the “two zone” height (caving zone and water-conducting fracture zone); the numerical simulation results were calibrated using the measured ‘two zone’ height. Reasonable physical and mechanical parameters for the coal and rock mass were determined in the model, and combined with the bedrock thickness contour map (
Figure 3) to determine a reasonable upper mining limit. Experimental studies were conducted regarding fracture development in overlying strata, as well as the effects of the mining height on fracture development at different bedrock thicknesses and mining heights.
3.2. Field Measurement of Adjacent Panel
Panel 11,011 was the first working face with a thin bedrock roof; the thickness was in the range of 36.8–65 m. The 二1 coal seam located at the bottom of the Shanxi formation had an average coal thickness of 6.32 m. The seam dip angle varied between 0.5 and 5°. The coal-bed structure, which was predominantly lump coal, was simple, with approximately 1 m of mylonitic and granular coal located above the coal seam. A dirt band and sandy mudstone false roof appeared in localized areas. The long wall developed by an inclined multilayer along the strike long wall through comprehensively mechanized coal mining technology was 1221.3–1250.7 m long and 72.33 m wide, with a mining height of 3.5 m. Roof control was accomplished by full caving, where the working face advanced along the roof. An effective manmade plastic mesh false roof for the working surface was established in addition to the hydraulic powered supports.
(1) Observation scheme
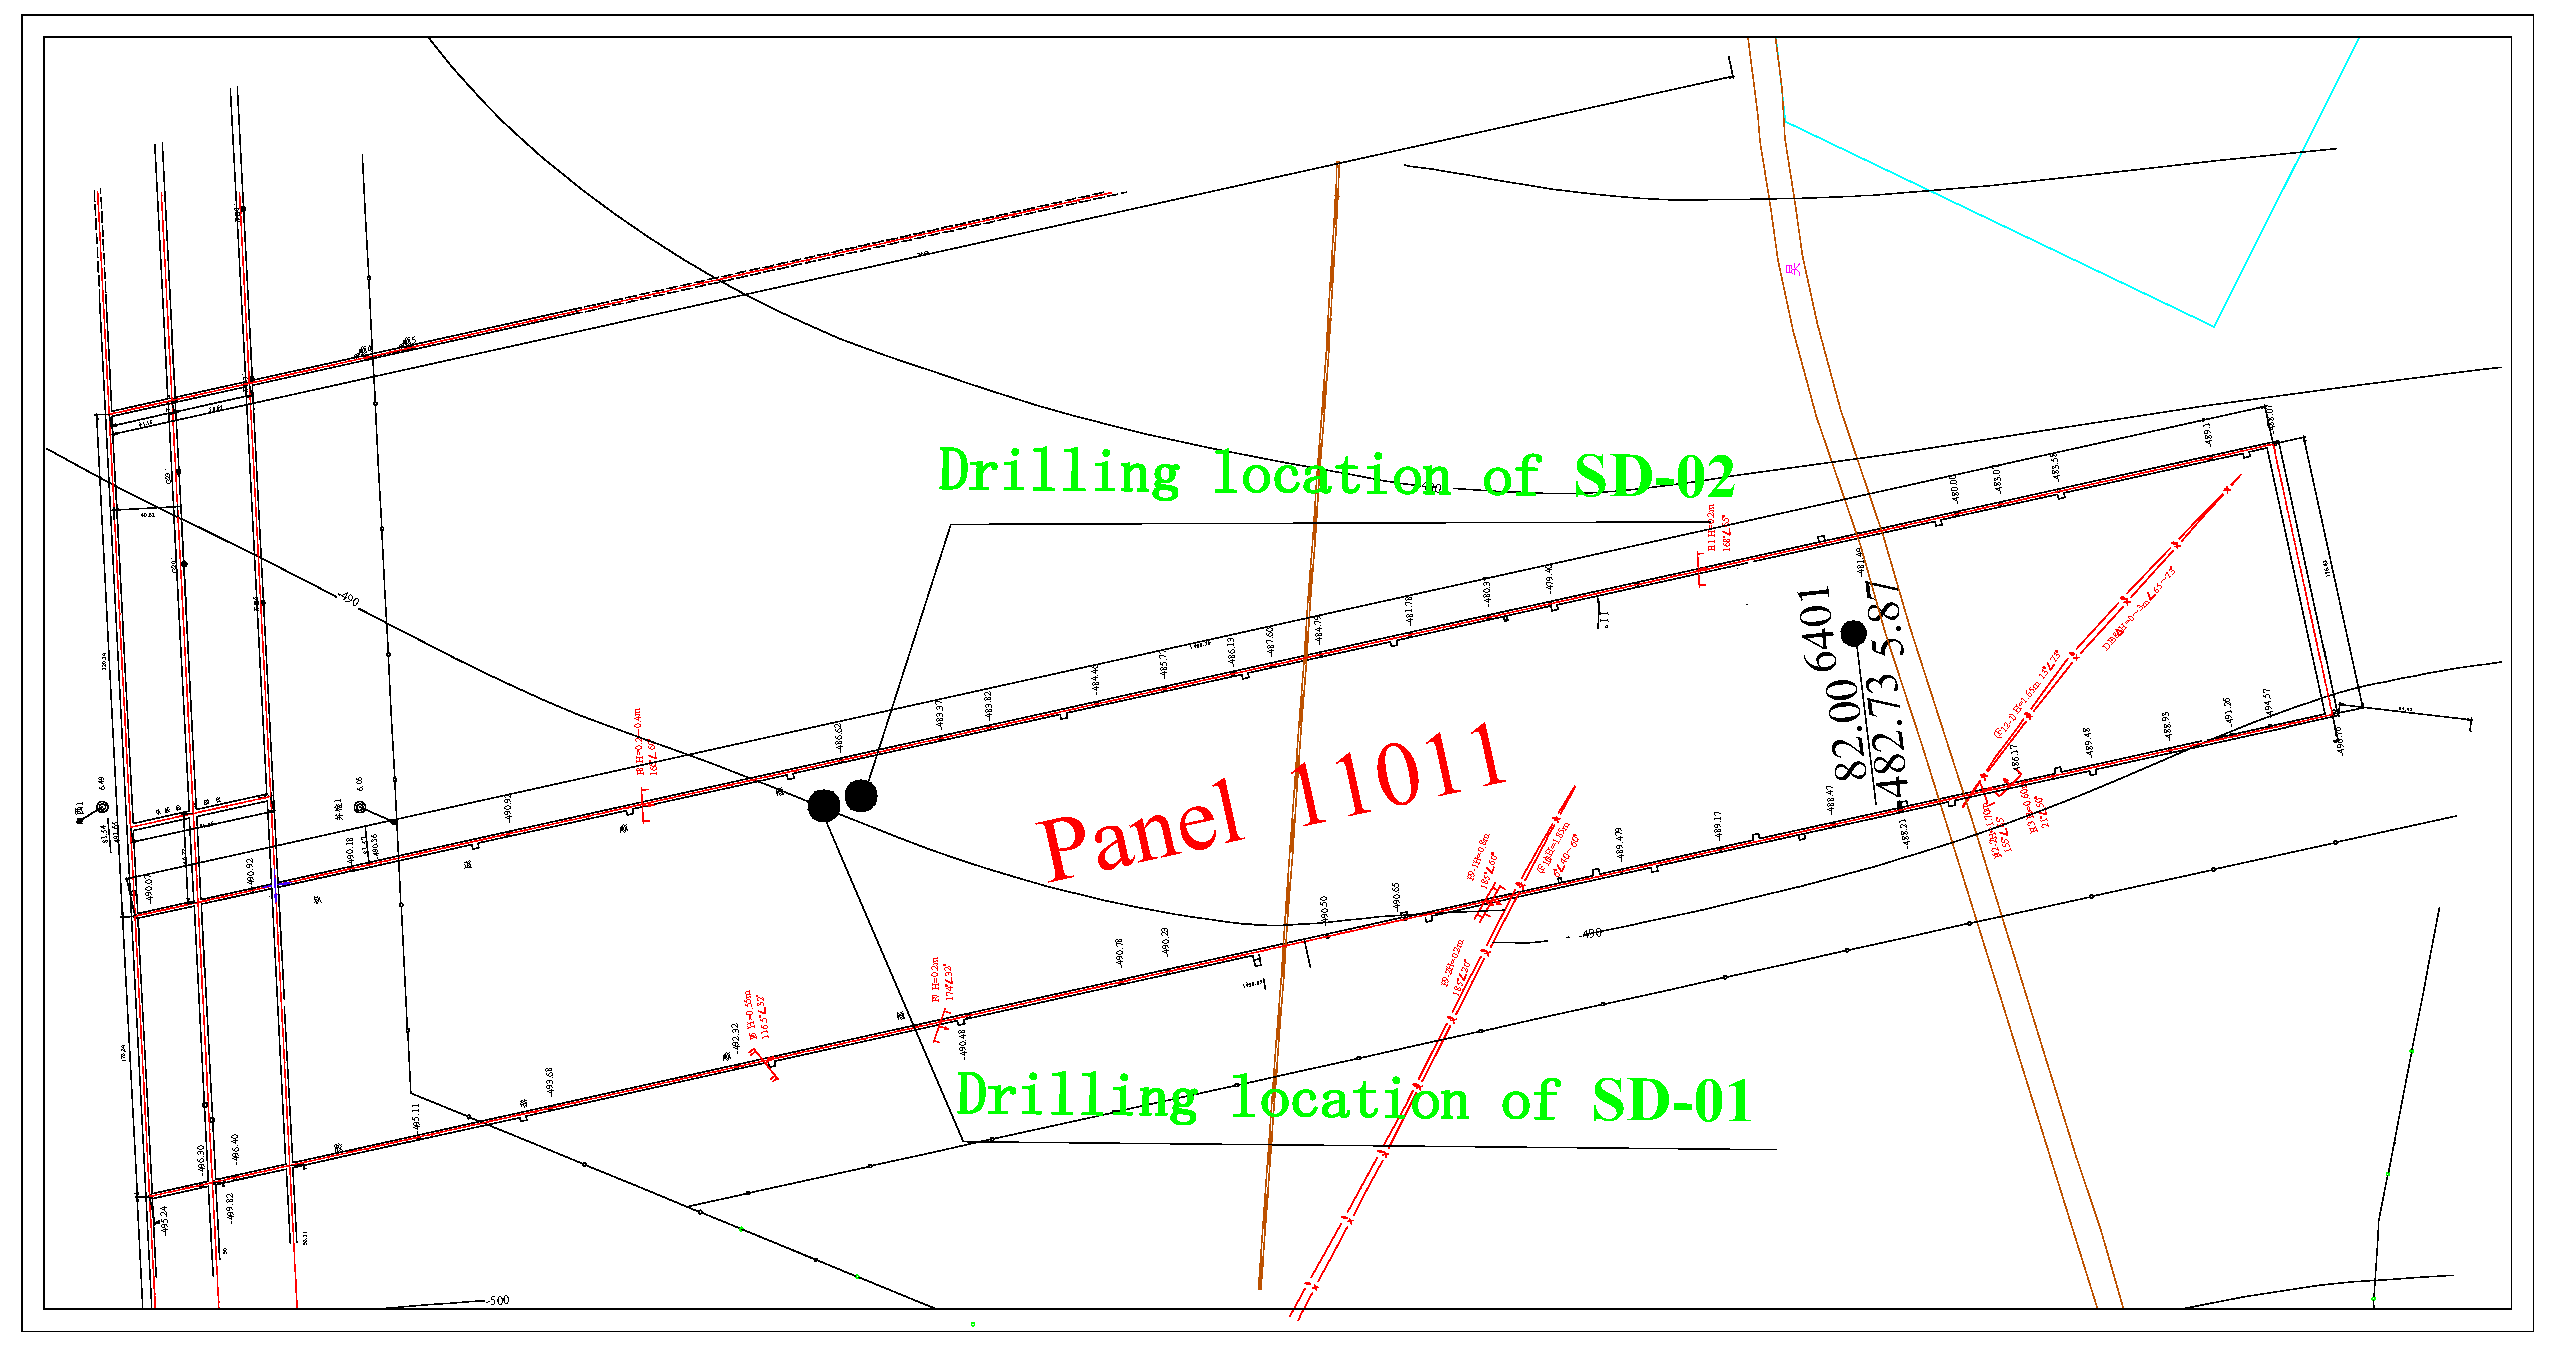
The Zhao Gu mine field has typical features, including a thick alluvium, a thin bedrock, and drilling construction at the ground surface. The ground drilling hole observation method was used to observe the height of the caving zone and fractured zone. This method can be described as follows. A drilling hole was constructed above the goaf after coal was extracted at the working face; the height of the caving zone was defined by observing unusual phenomena in the drilling rig (drill dropping and wind suction); finally, the height of the fractured zone was defined by observing the leakage of flushing fluid and water level change during drilling. Two observation drillings of the water-conducting zone were performed at the 11011 coal mining face based on existing data and field conditions. These drillings were called SD-01 and SD-02 (
Figure 4) and have the following hole structures.
- ➀
SD-01 drilling: 0–250 m with 311 mm aperture and additional φ 219 mm wall protection casing; 250–469.88 m with 215 mm aperture; 469.88–519.84 m with 190 mm aperture.
- ➁
SD-02 drilling: 0–11.99 m with 311 mm aperture and additional φ 219 mm wall protection casing; 11.99–358.71 m with 215 mm aperture; 358.71–500.20 m with 190 mm aperture and additional φ 159 mm check water casing; 500.20–547.35 m with 133 mm aperture for nude hole.
(2) Detection result and analysis
➀ Determination of caving zone height
The following phenomena occurred in the hole where the leakage of flushing fluid increased suddenly: no reverse pulp, the drill dropped, and the drill pipe became stuck. Moreover, the cores were composed of more broken sandstone when the SD-02 hole was drilled to 547 m. A lighter test was conducted at the orifice position after the drill pipe was lifted by wind suction in the drilling hole. Based on these characteristics, the apical position of the caving zone was determined to be 547 m.
Orifice ground surface elevation: 81.5 m; Coal floor elevation in drilling position: −485 m; Equation for the caving zone height:
where
HC: height of the caving zone, m;
H: vertical depth from coal floor to orifice, 485 + 81.5 = 566.5 m;
M: coal seam thickness in drilling position, 6.4 m;
hc: vertical depth from the apical position of the caving zone to orifice, 547 m;
W: compression value of the fractured zone strata, m (typically this is zero).
The height of the caving zone is determined as follows:
The average mining height was 3.50 m, and the height of the caving zone was 13.1 m. The ratio of the caving zone to mining height was 3.75.
➁ Determination of water-conducting fracture height
When the SD-02 hole was drilled to 518.5 m, the per time unit leakage of flushing fluid was 16.8 L/s and the per time unit drilling footage leakage was 56 L/(s·m). The speed of the water level drop increased suddenly; this sudden decrease proves that the connectivity of the water-conducting zone increased sharply. In addition, the leakage of flushing fluid increased rapidly as the hole was drilled further. The leakage of flushing fluid presented was complete at a final rate of 18.33 L/s when the SD-02 hole was drilled to 525 m, and the per time unit drilling footage leakage was 5.30 L/(s·m). When the SD-02 hole was drilled to 531.3 m, wind suction occurred and water disappeared into the hole; obvious vertical fractures appeared in the rock core. All of the analyses showed that the maximum height of the water-conducting zone was located in the position of 518.5 m in the 11011 coal mining face.
Equation for the fracture zone height:
where
HF: height of the fracture zone, m;
HD: vertical depth from coal floor to orifice, 485 + 81.5 − 6.4 = 560.1 m;
HS: vertical depth from the apical position of the fracture zone to orifice, 518.50 m;
The height of the water-conducting fracture is determined as follows:
The average mining height was 3.50 m, and the height of the fracture zone was 41.6 m. The ratio of the fractured zone to mining height was 11.89.
3.2.1. Construction and Calibration of Initial Model
(1) Building the Numerical Model
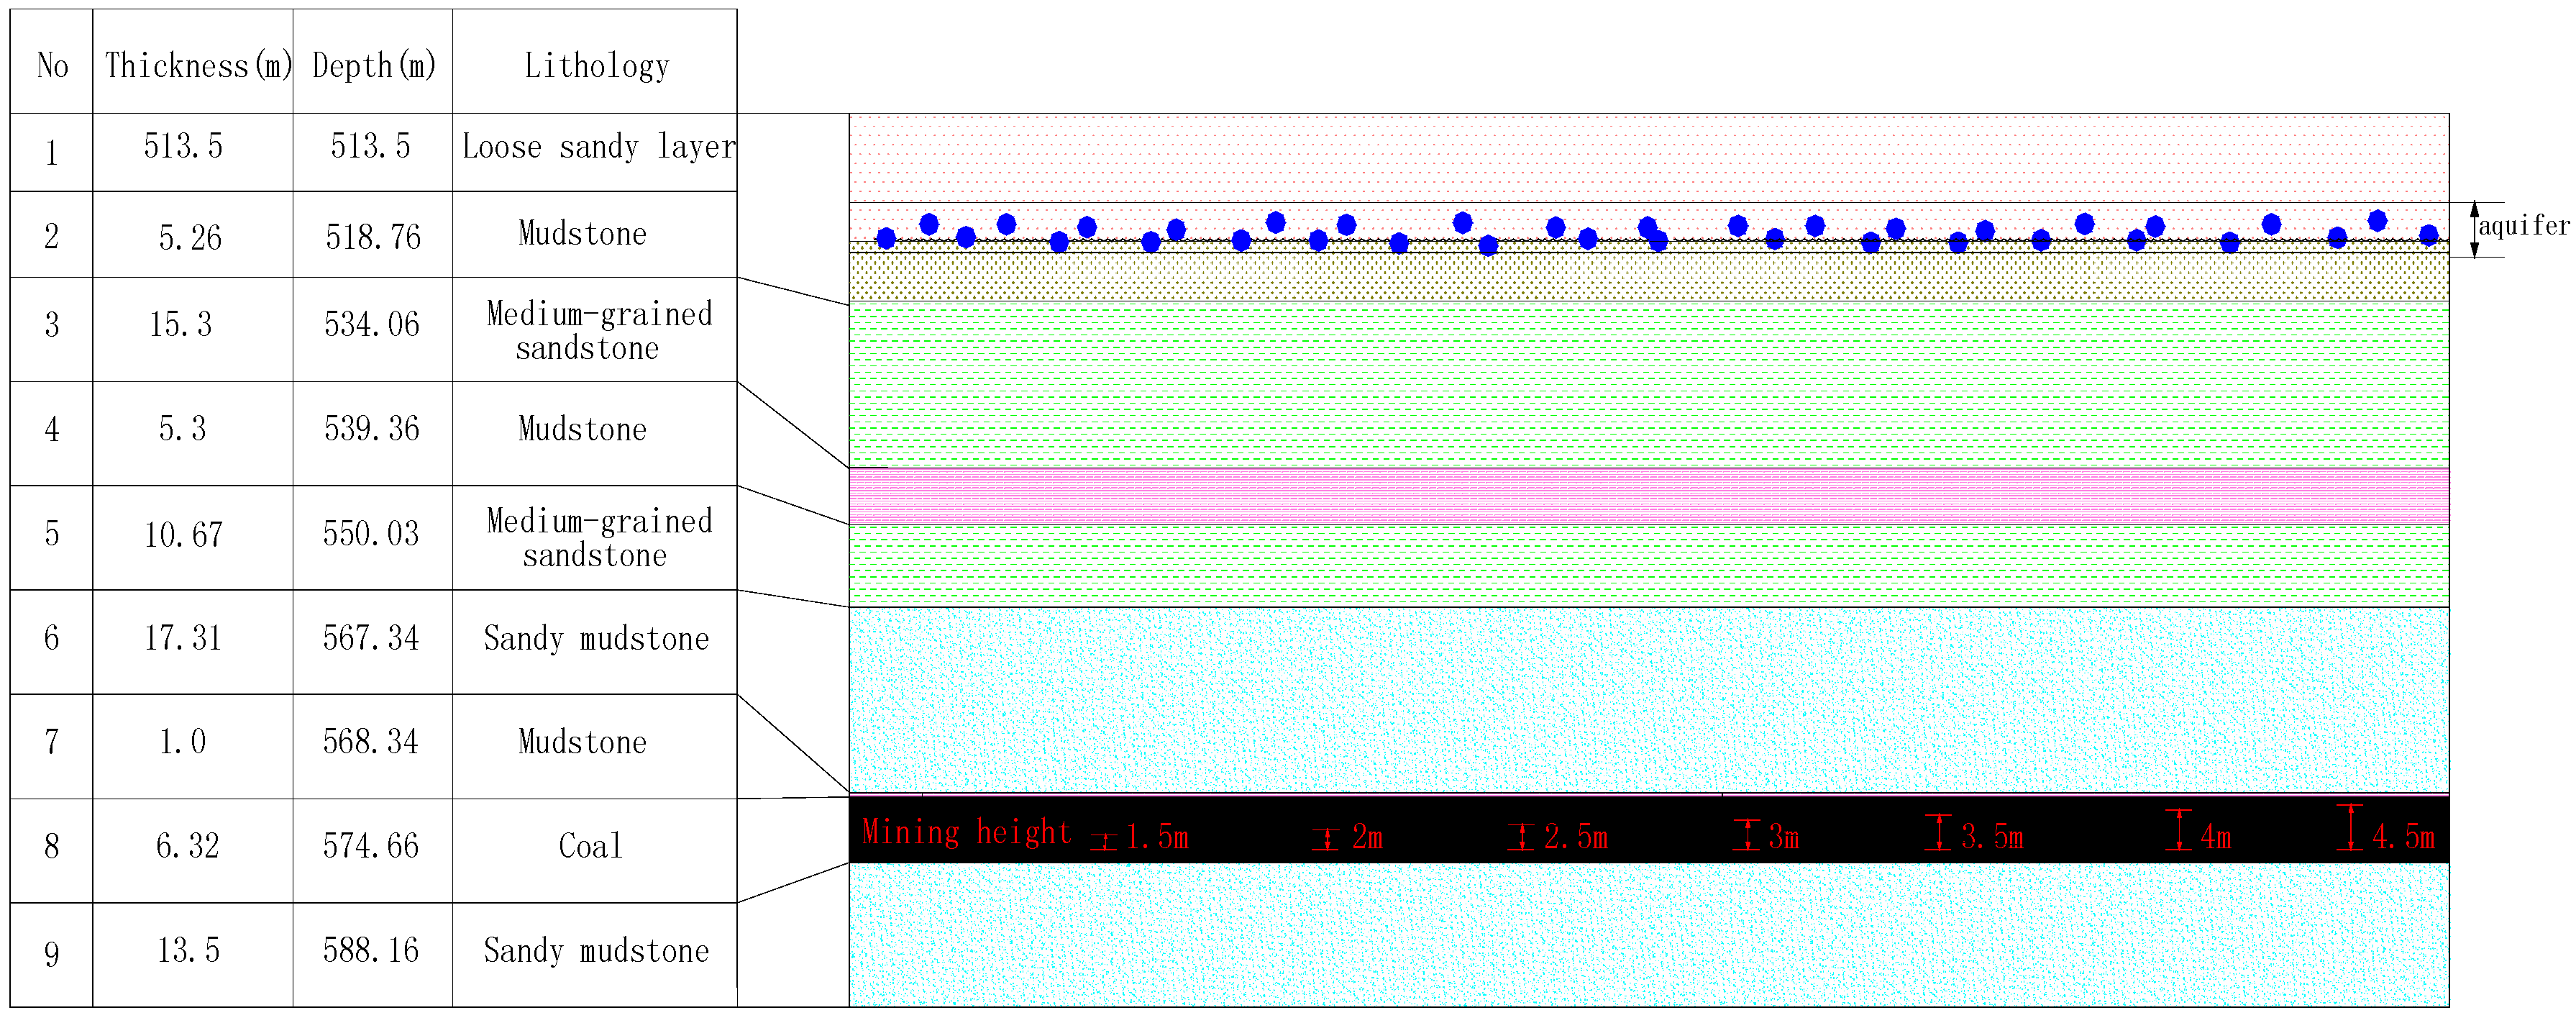
In this study, the universal distinct element code (UDEC) was used to establish a strike model according to the vertical geological column of the 11,011 coal mining face (
Figure 5). The model had dimensions of 300 × 93 m (length × height). In the model, the thickness of the bedrock above the coal seam was 47 m, the alluvium was 28 m, and the coal seam was 6 m. Considering the influence of the boundary effect, 100 m boundary pillars were used on both sides of the model.
The vertical geological column of the 11,011 coal mining face shows that the bedrock above the coal seam is predominantly composed of medium sandstone, sandy mudstone, and mudstone. The mechanical parameters of the coal-rock mass and coal-rock strata joint surface are outlined in
Table 1 and
Table 2, respectively.
Mechanical parameters of coal-rock mass.
(2) Simulation Results and Analysis
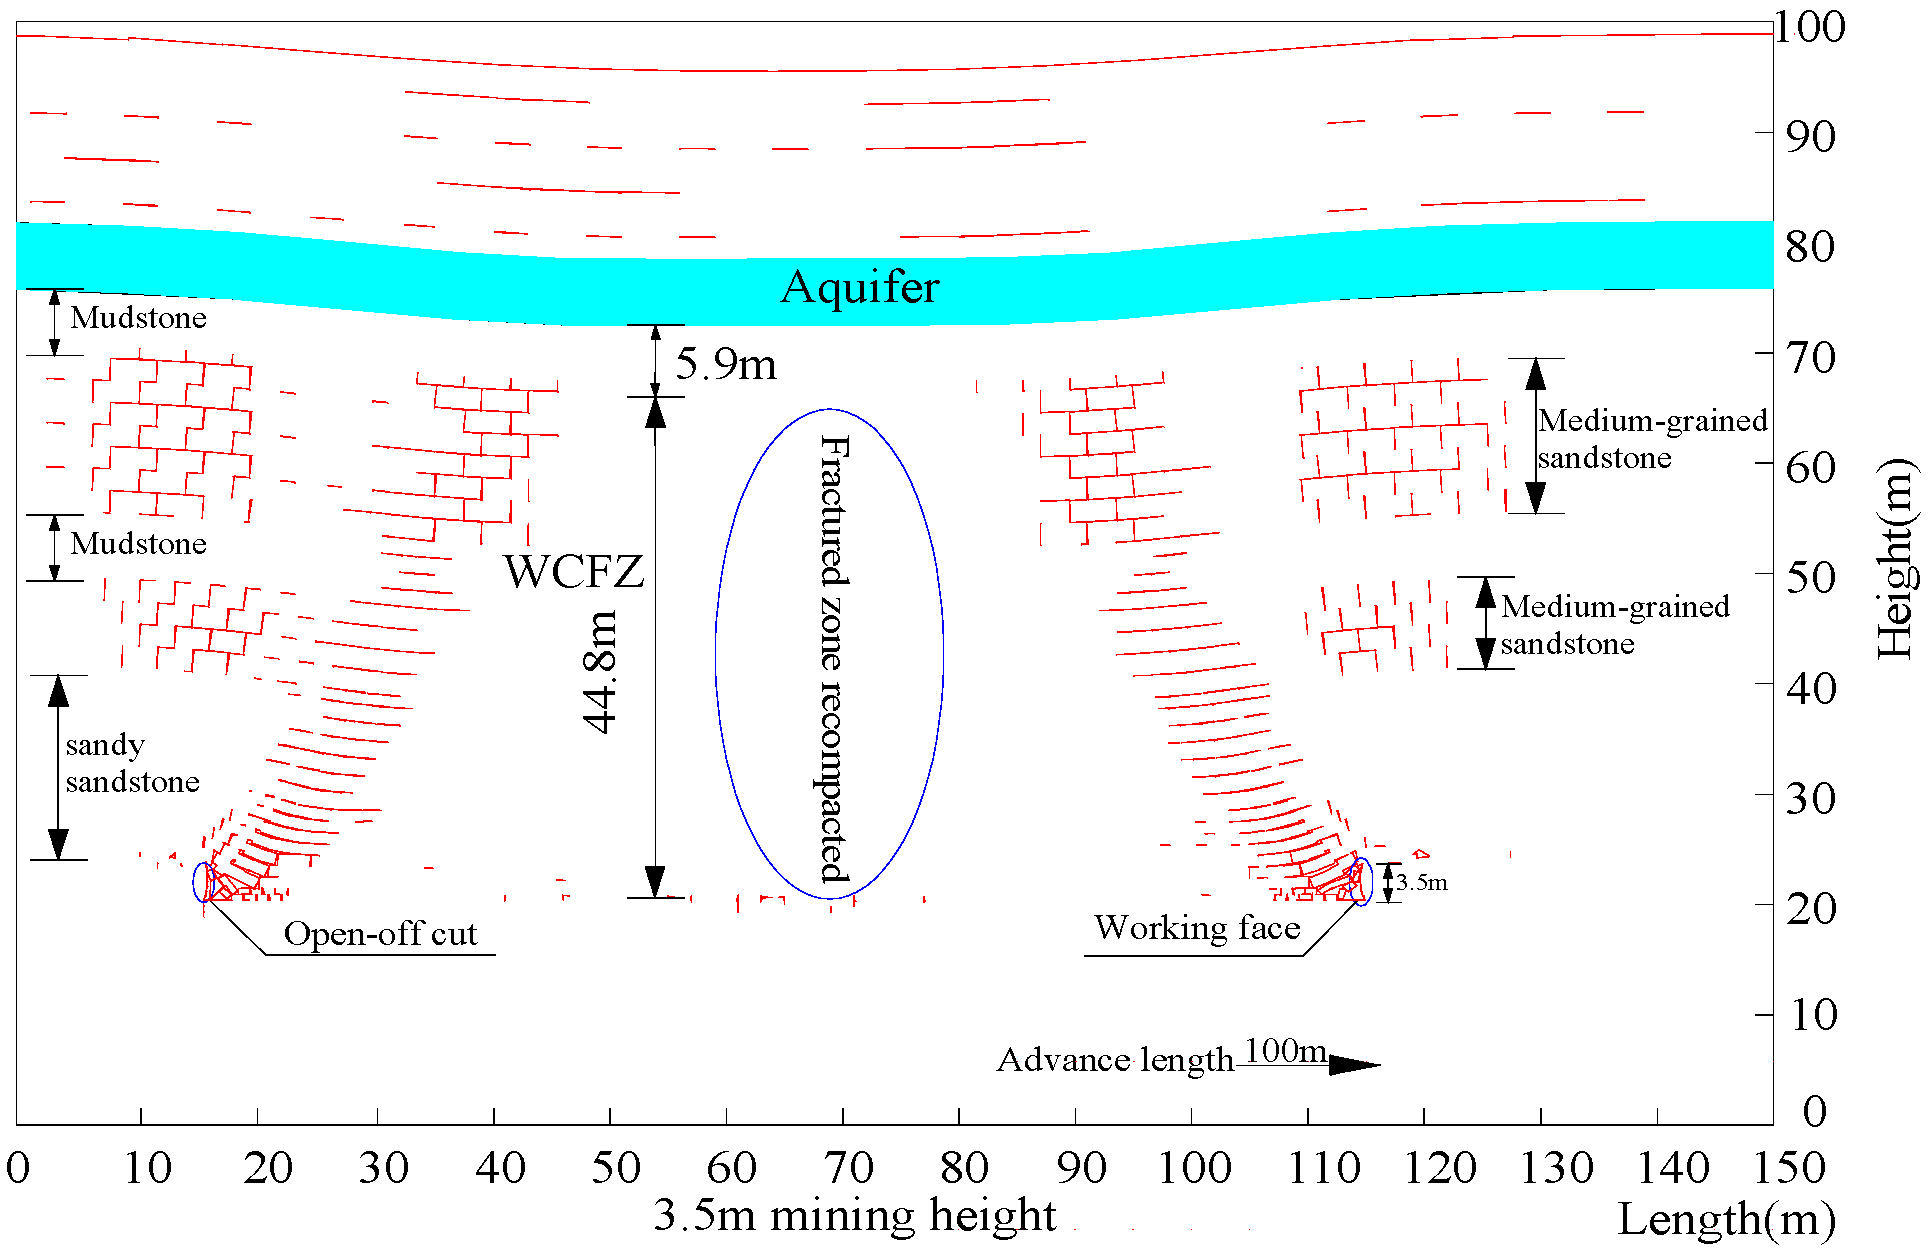
Figure 6 shows the overburden morphology when the working face advances 100 m. It shows that the most-developed and highest areas of the fracture are at the top and front of the mining face. In the face-advancing process, the roof experiences the overall process (failure, collapse, compaction, and stability), and the height of the fracture is the lowest in the goaf behind the mining face. The fracture is more developed in the hard rock of the sandstone class, whereas it is less developed in the mudstone and weathered mudstone. The simulation results indicate that the height of the caving zone is 14 m. The fracture develops upward from the immediate roof and stops expanding when the crack reaches a distance of 5.9 m from the bottom of the aquifer. The height of the water-conducting zone is 44.8 m.
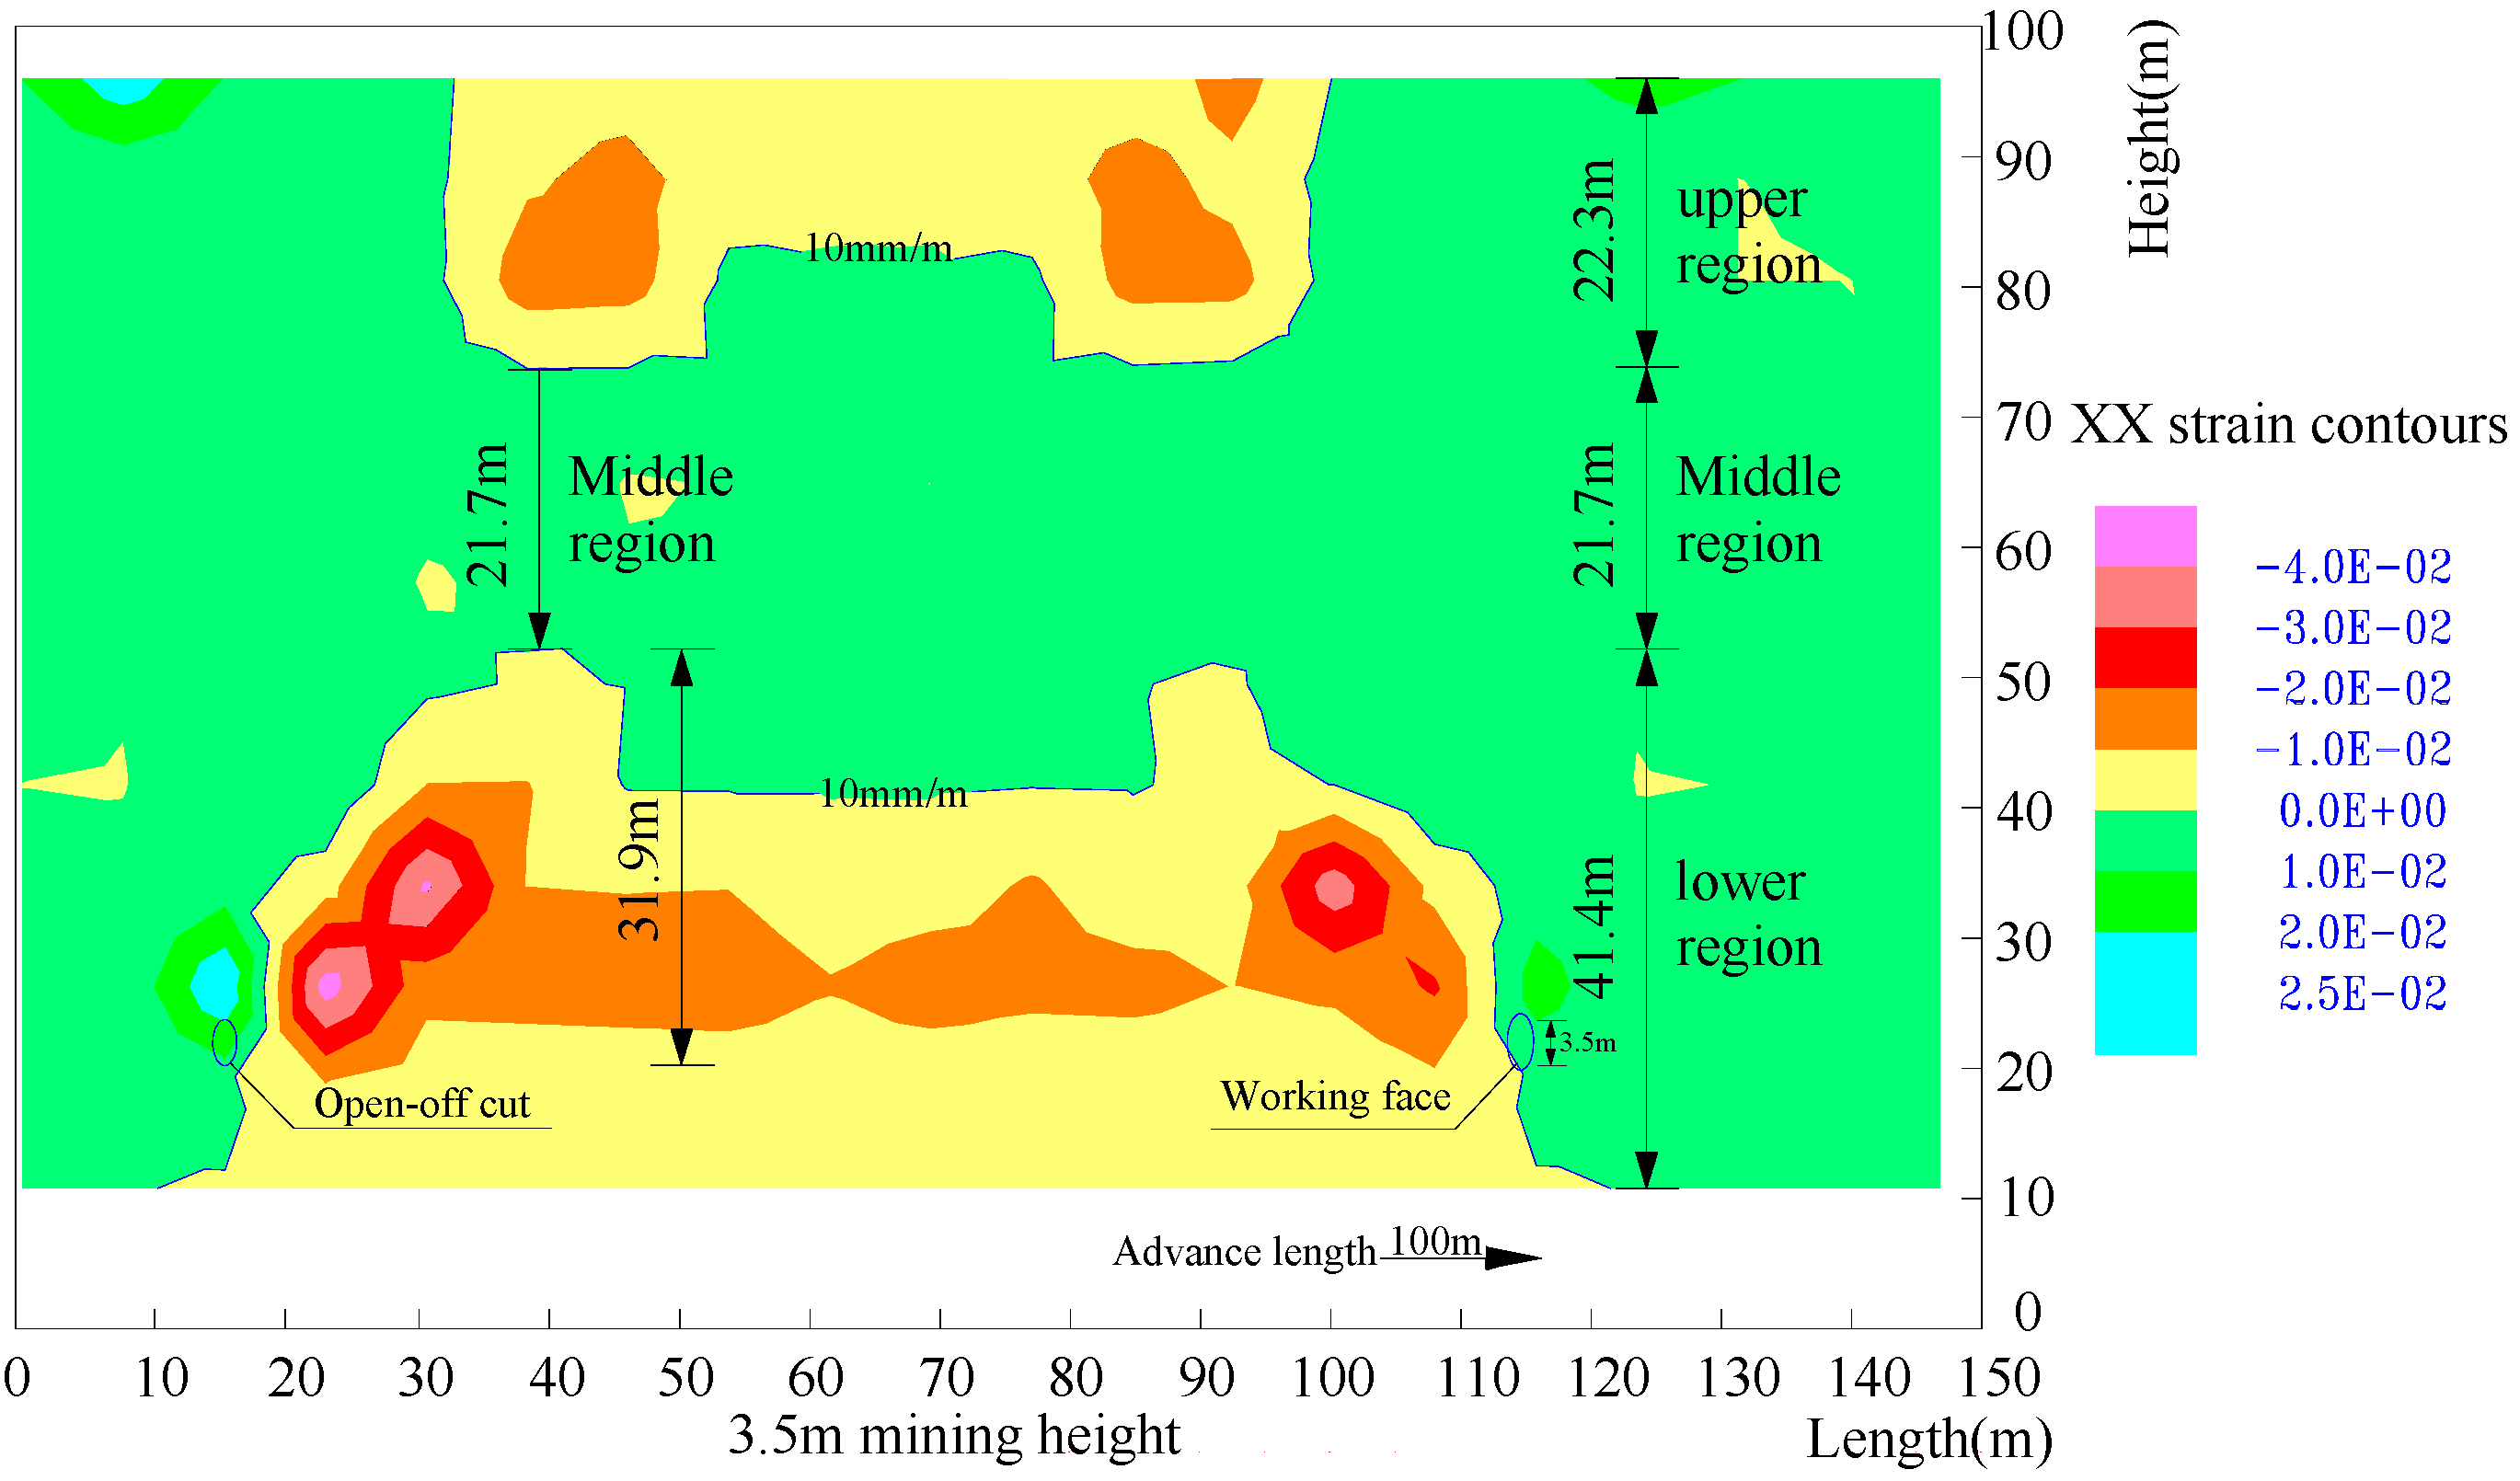
Figure 7 shows the overburden horizontal strain contours when the working face advances 100 m; different horizontal strain gradients are present. The horizontal strain is larger in the coal mining face and gradually decreases with increasing distance from the caves. The horizontal strain is 10 mm/m at a vertical distance of 42 m from the working face. In the working face advancing direction, the horizontal strain of the location near the working face and open-off cut is larger. The strata of the gob are compressed, and the maximum horizontal strain is −40 mm/m. There is tension in the rock above the working face and open-off cut, and the maximum horizontal strain is 25 mm/m. In the vertical direction, the overburden can be divided into three regions (upper, middle, lower) with 10 mm/m as the boundary. The height of the upper region is 22.3 m, and the evolution and distribution pattern of the horizontal strain is ‘reverse saddle’; the evolution and distribution pattern of the horizontal strain in the lower region is ‘saddle’, and the horizontal strain value at a vertical distance of 31.9 m from the working face is 10 mm/m. The horizontal strain values of the upper and lower regions are larger than 10 mm/m. The middle region is located in the lower part of the aquifer, with a horizontal strain value of less than 10 mm/m; the height of the middle region is 21.7 m, which is a safe thickness for the barrier layer between the aquifer and the mining field. Uner these conditions, safe production underwater can be realized [
23].
3.2.2. Research Results Comparison and Analysis
The heights of the caving zone and water-conducting zone determined by field measurement and numerical simulation of the 11,011 coal mining face were extremely well correlated. This proved that the mechanical parameters of the coal-rock mass and coal-series strata joint surface were relatively reasonable in the numerical simulation model. Thus, the discrete element model that was developed closely approximated the actual situation.
3.3. Numerical Simulation Results
The loose bed profile of the thin bedrock area (
Figure 8) obtained through an analysis of the data for the drilling and strata structure of the二
1 coal geological drilling showed that most of the bedrock thickness was in the range of 20–70 m. On the basis of this profile and the bedrock thickness contour map (
Figure 3) of the thin bedrock area, six numerical models were constructed to simulate bedrock thicknesses of 20, 30, 40, 50, 60, and 70 m and mining heights of 1.5, 2, 2.5, 3, 3.5, 4 m and 4.5 m. The fracture development characteristics of the overlying strata at different bedrock thicknesses and mining heights were determined.
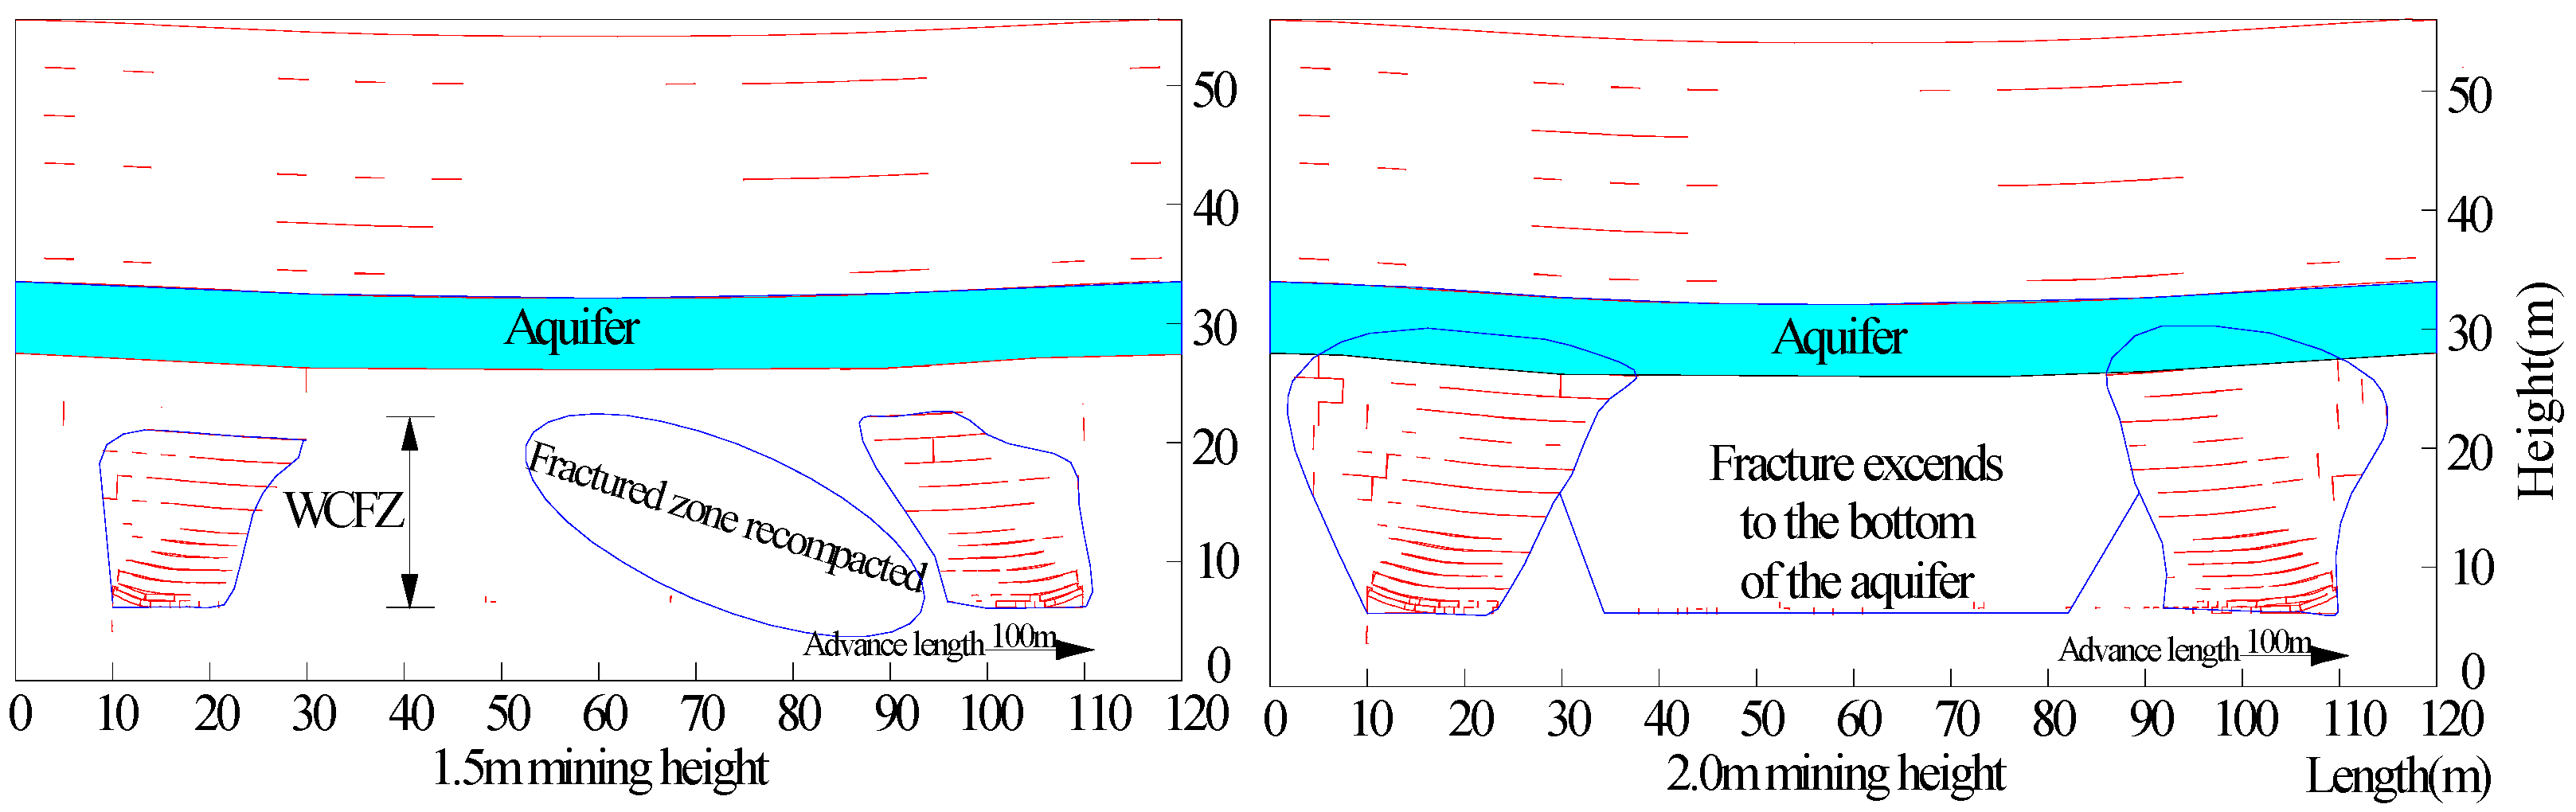
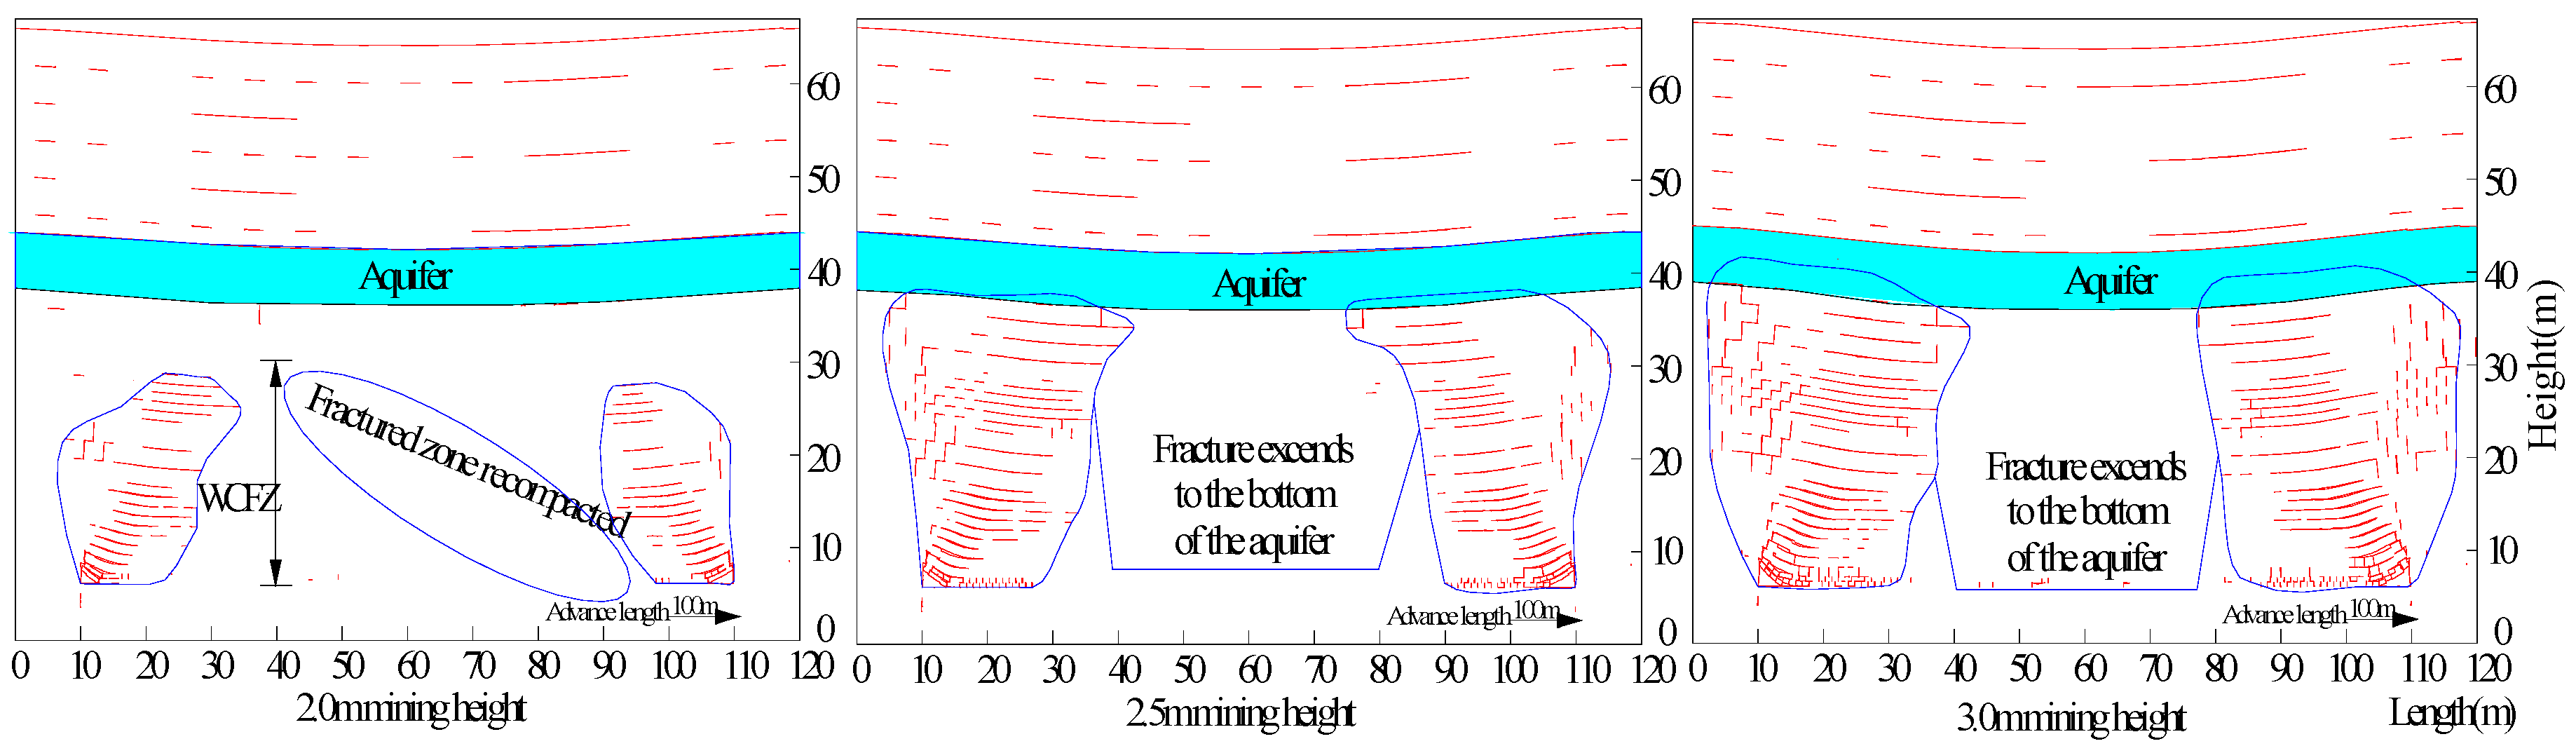
Figure 9 shows the overburden morphology for a bedrock thickness of 20 m when the working face advances 100 m at different mining heights. It shows that the most developed and highest areas of fracture are at the top and front of the mining face. In the process of advancing the face, the roof experiences the overall process (failure, collapse, compaction, and stability) and the height of the fracture is the lowest; the fracture closes gradually behind the working face. The vertical fractures at mining heights of 1.5 and 2 m develop significantly at heights of approximately 16 and 24 m, respectively, from the coal seam roof. The WCFZ passes through the aquifer at a mining height of 2 m.
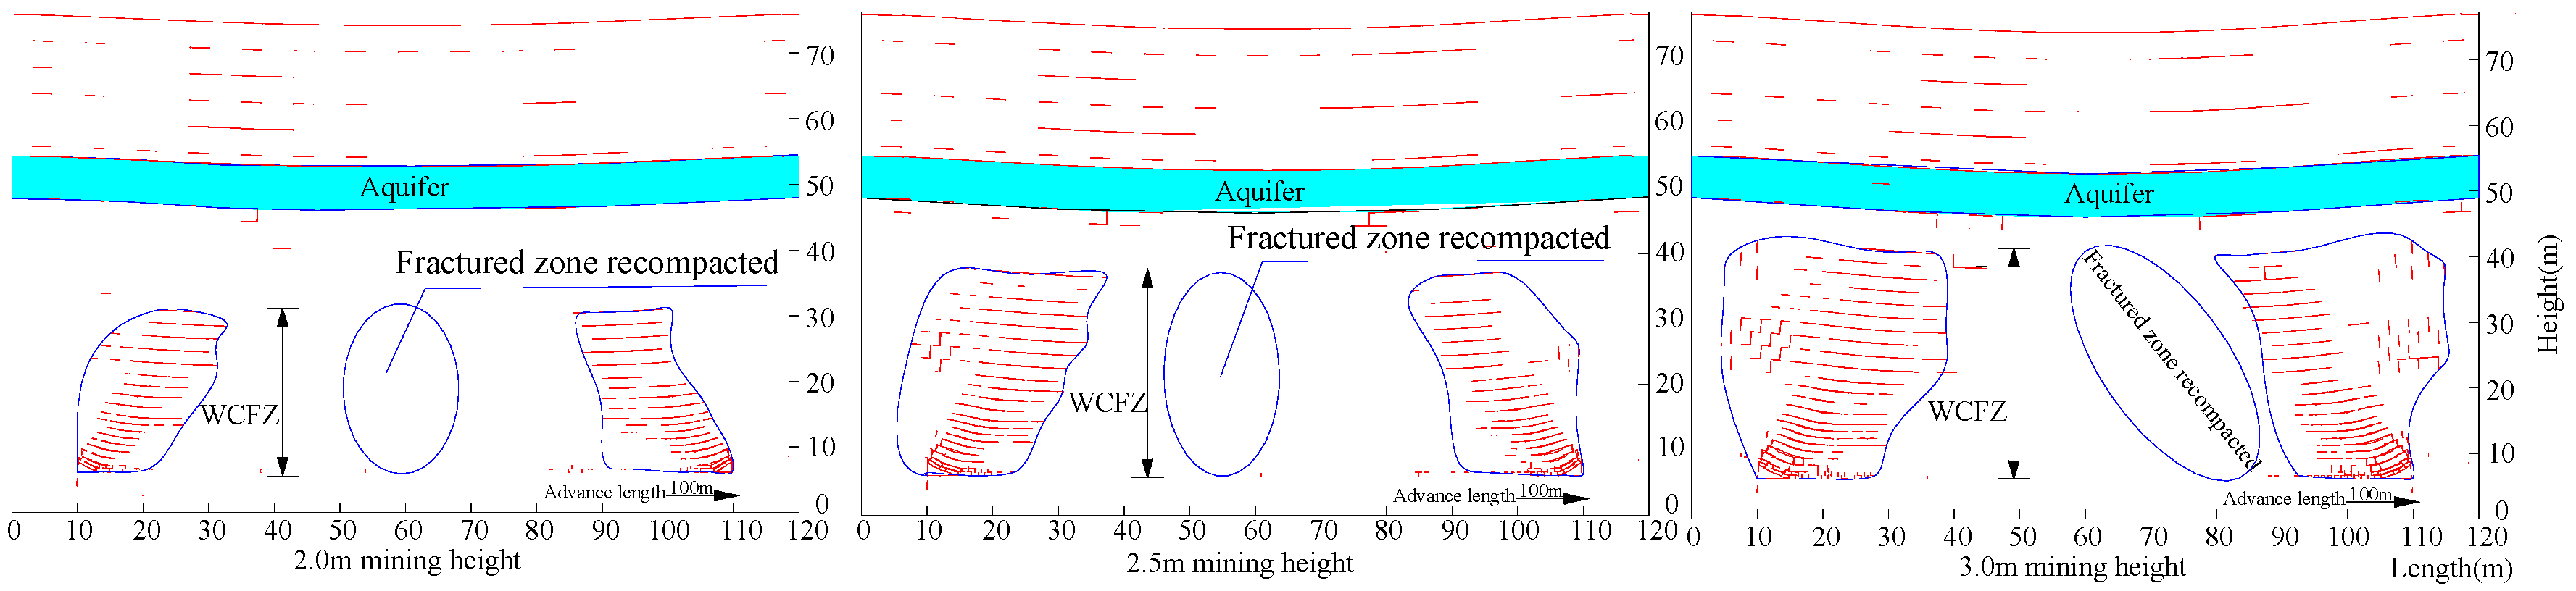
Figure 10 shows the overburden morphology for a bedrock thickness of 30 m when the working face advances 100 m at different mining heights. The vertical fractures at the 2, 2.5, and 3 m mining heights develop significantly at heights of approximately 24.3, 31.3, and 35.4 m, respectively, from the coal seam roof. The fractures extend to the bottom of the aquifer at a mining height of 2.5 m. At a mining height of 3 m, the fracture connectivity rate of the overburden improves significantly; the number of mining-induced fractures increase, and the fracture extension area amplifies.
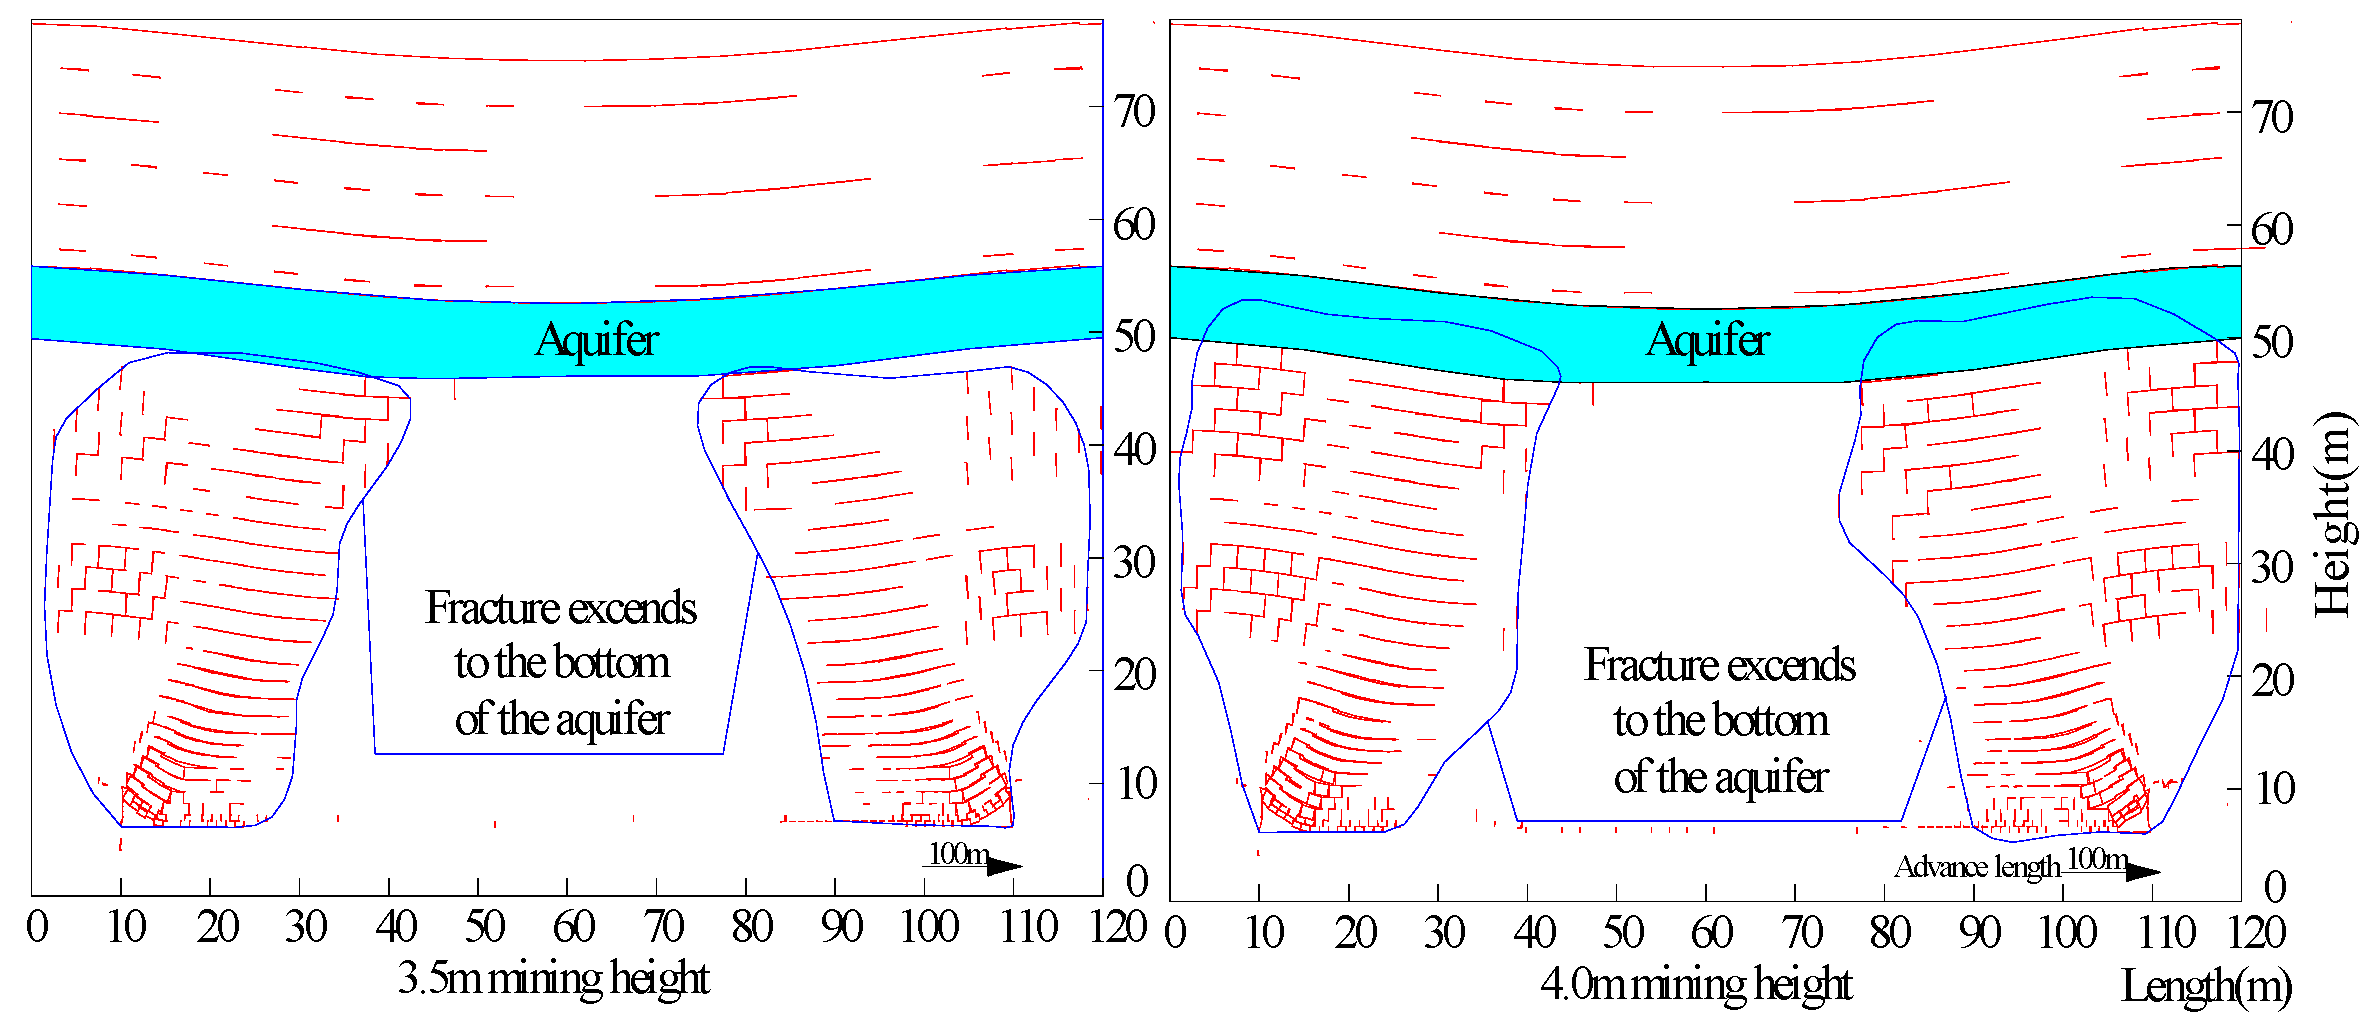
Figure 11 shows the overburden morphology for a bedrock thickness of 40 m when the working face advances 100 m at different mining heights. The vertical fractures at the 2, 2.5, 3, 3.5, and 4 m mining heights develop significantly at heights of approximately 25.6, 31.8, 35.2, 39.9, and 45.4 m, respectively, from the coal seam roof. With increasing mining height, the fracture connectivity rate of the overburden improves significantly, the number of mining-induced fractures increase, and the fracture extension area is amplified. The fractures extend to the bottom of the aquifer when the mining height is 3.5 m, and they go through the overburden when the mining height is 4 m.
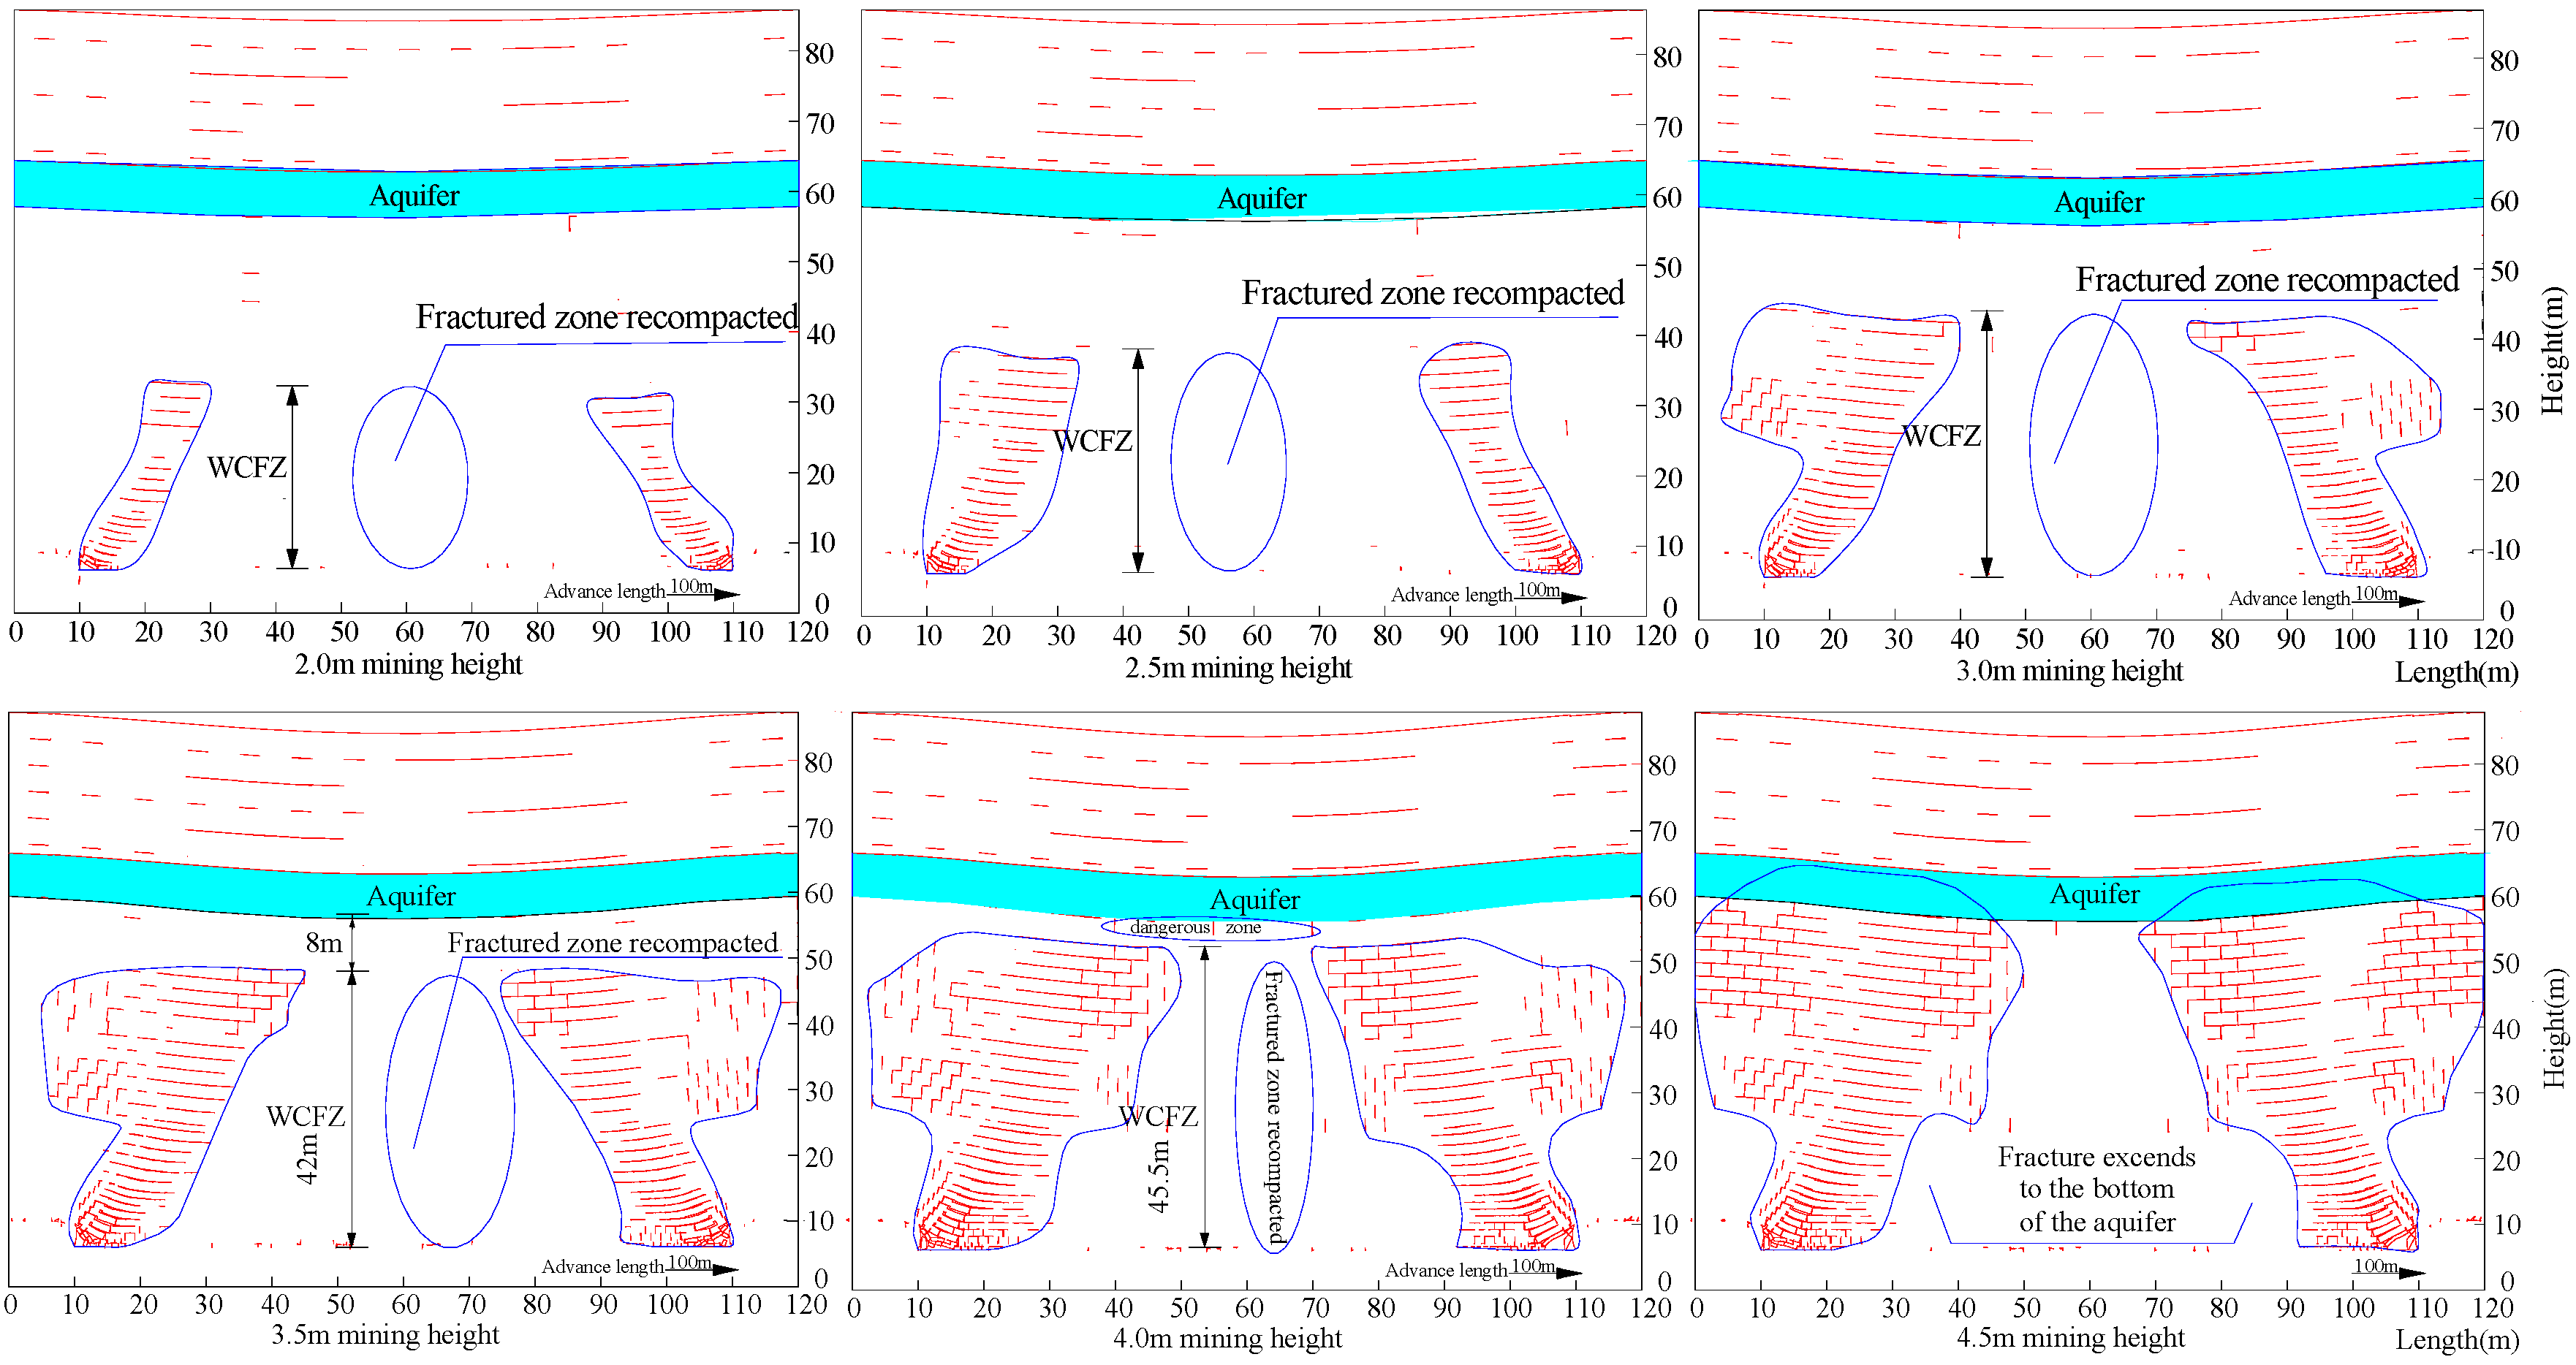
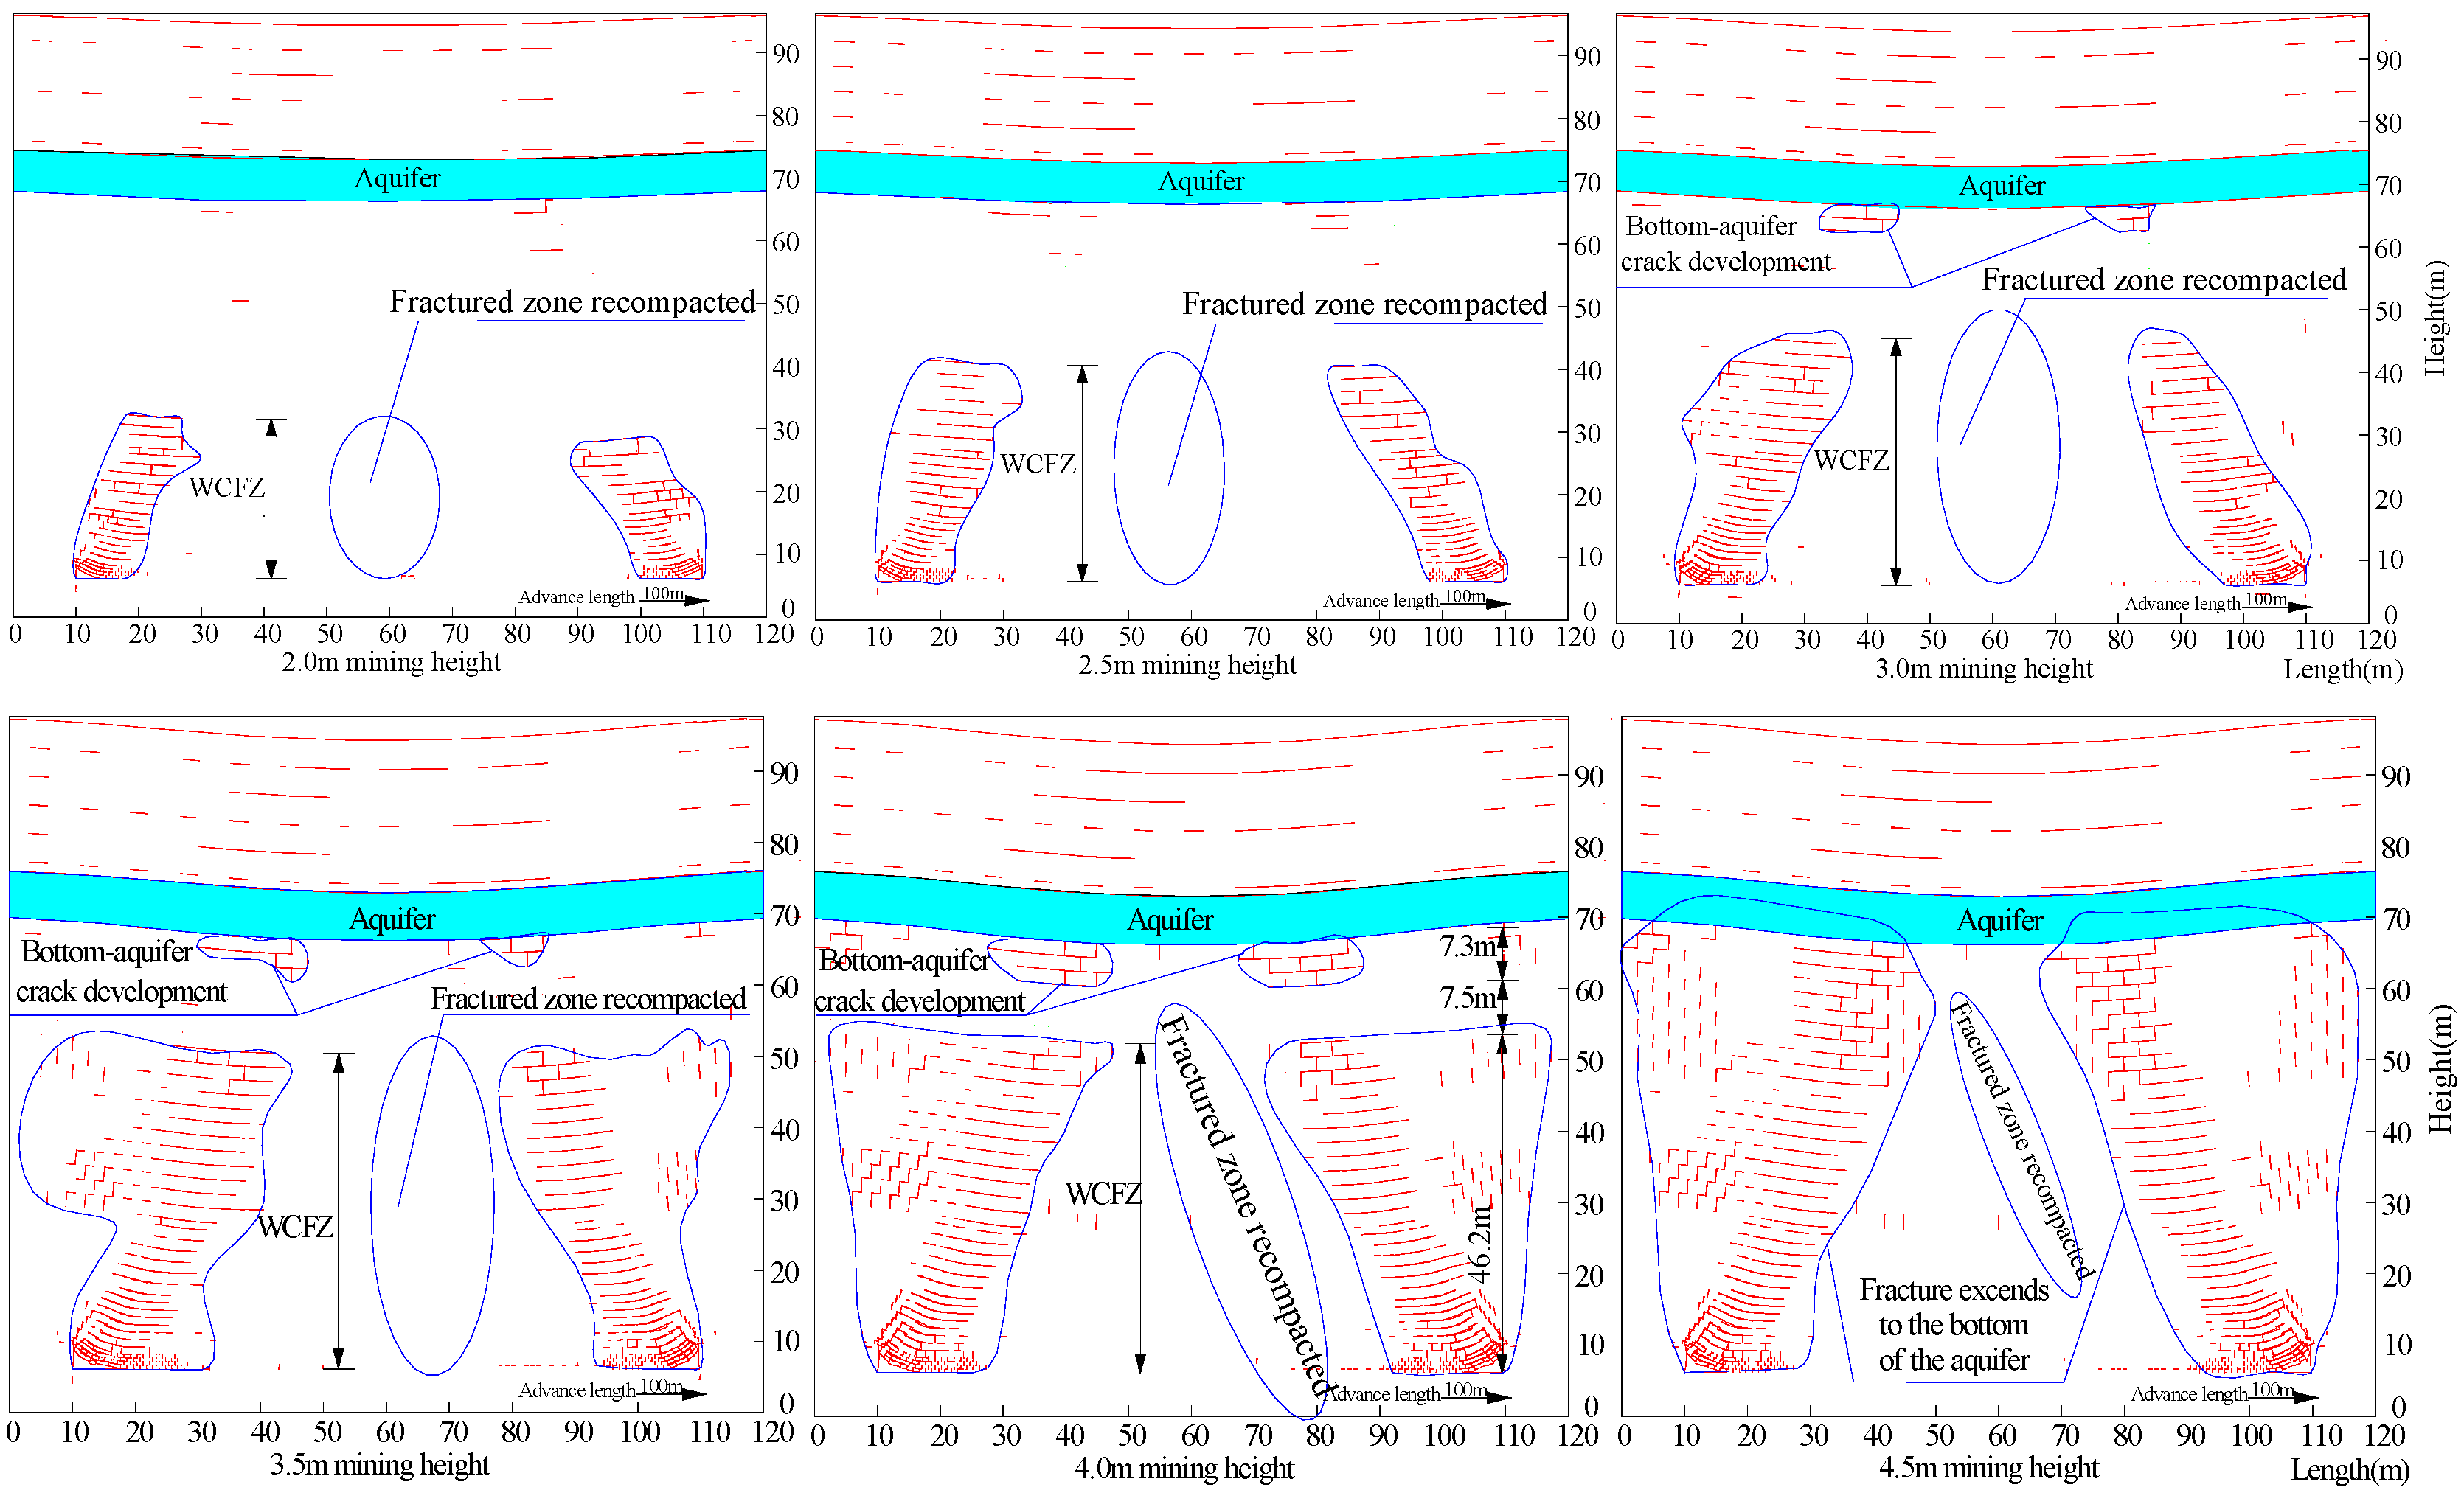
Figure 12 shows the overburden morphology for a bedrock thickness of 50 m when the working face advances 100 m at different mining heights. Vertical fractures at the 2, 2.5, 3, 3.5, and 4 m mining heights develop significantly at heights of approximately 26, 31.8, 37.9, 42.5, and 45.7 m, respectively, from the coal seam roof. At a mining height of 3.5 m, the distance from the WCFZ to the aquifer is 8 m. At a mining height of 4 m, the HWCFZ is 45.7; simultaneously, fractures develop at the bottom of the aquifer when the distance from the WCFZ to the aquifer is less than 3 m. These fractures extend to the bottom of the aquifer at a mining height of 4.5 m.
Figure 13 shows the overburden morphology for a bedrock thickness of 60 m when the working face advances 100 m at different mining heights. Vertical fractures at the 2, 2.5, 3, 3.5, and 4 m mining heights develop significantly at heights of approximately 25.4, 34.5, 38.3, 44.2, and 46.2 m, respectively, from the coal seam roof. When the mining height reaches 3 m, it is obvious that fractures develop at the bottom of the aquifer. At a mining height of 3 m, the fractures at the bottom of the aquifer develop to a depth of 7.3 m; the distance from the WCFZ to these fractures is less than 7.5 m. The fractures extend to the bottom of the aquifer at a mining height of 4.5 m.
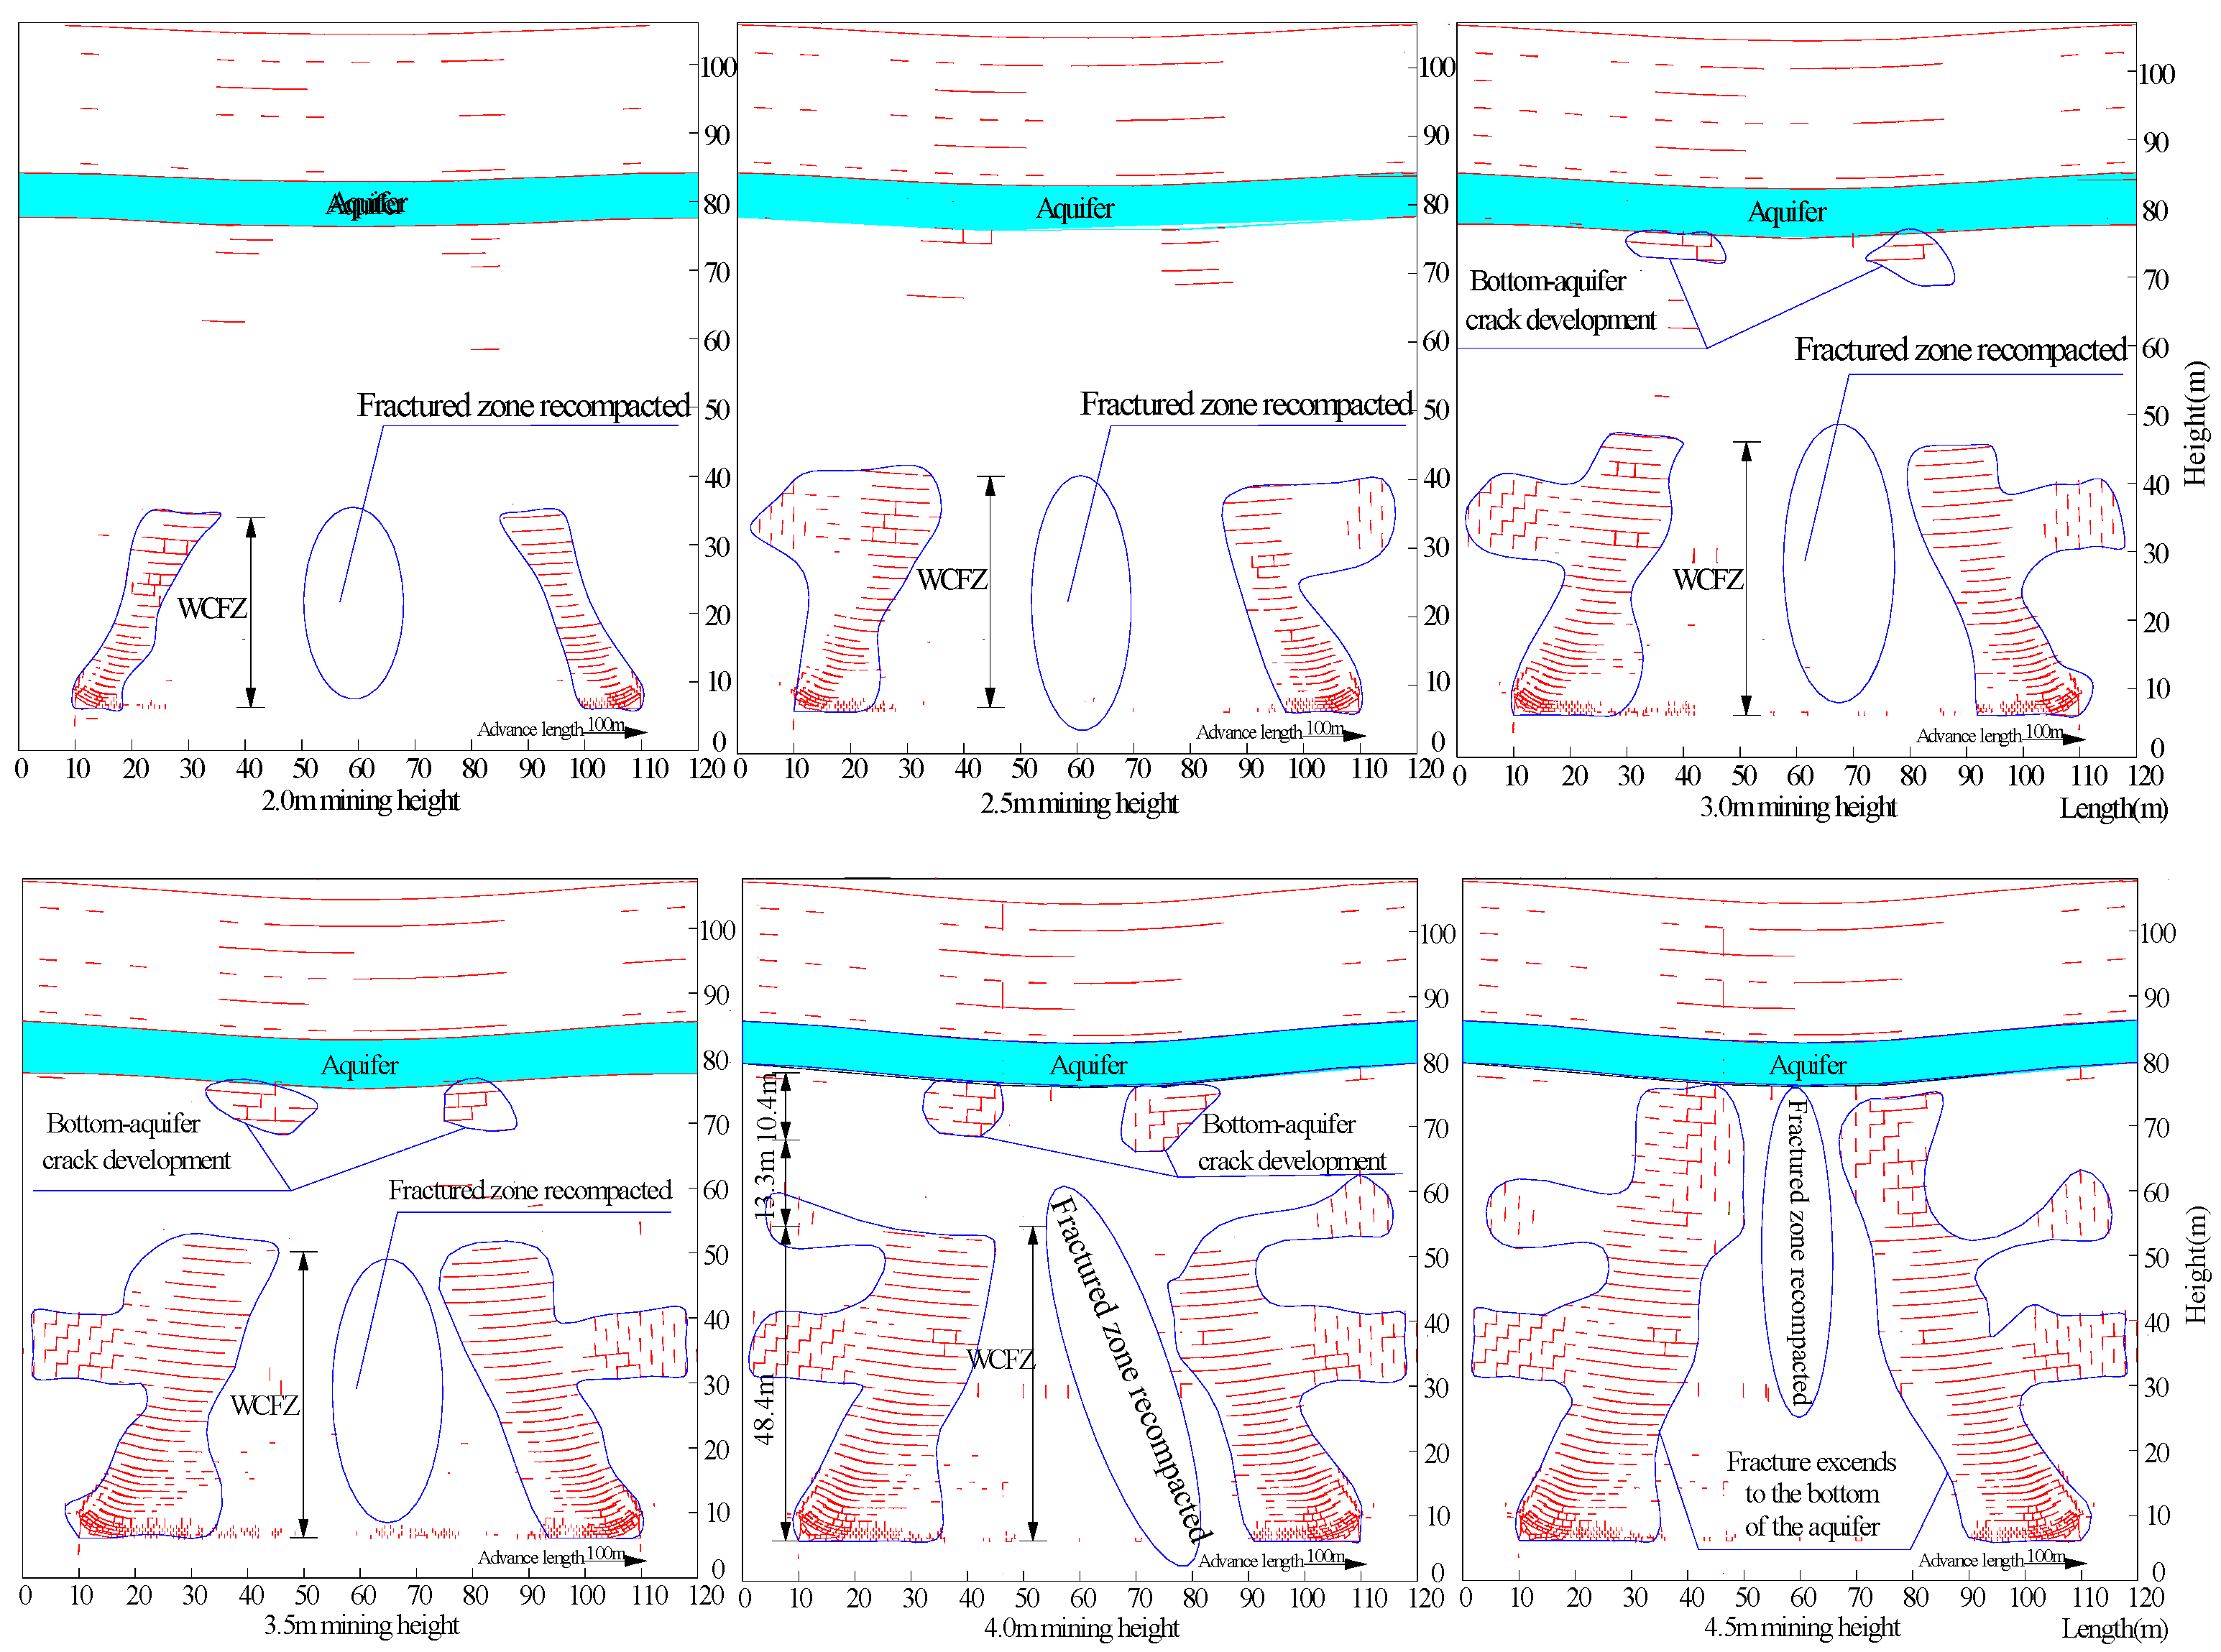
Figure 14 shows the overburden morphology for a bedrock thickness of 70 m when the working face advances 100 m at different mining heights. Vertical fractures at the 2, 2.5, 3, 3.5, and 4 m mining heights develop significantly at heights of approximately 27.6, 33.6, 39.8, 44, and 48.5 m, respectively, from the coal seam roof. When the mining height reaches 3 m, it is obvious that fractures develop at the bottom of the aquifer. At a mining height of 3 m, the fractures at the bottom of the aquifer develop to a depth of 10.4 m; the distance from the WCFZ to these fractures is less than 13.3 m. The fractures extend to the bottom of the aquifer at a mining height of 4.5 m.
The numerical simulation results indicate that the evolution law for mining-induced fracture and the distribution patterns at different bedrock thicknesses and mining heights are similar. With increasing mining height, the HWCFZ increases constantly, the fracture connectivity rate of overburden improves significantly, the number of mining-induced fractures increases, and the developmental range of the fracture is amplified.
4. Relationship between Developmental HWCFZ and Bedrock Thickness/Mining Height
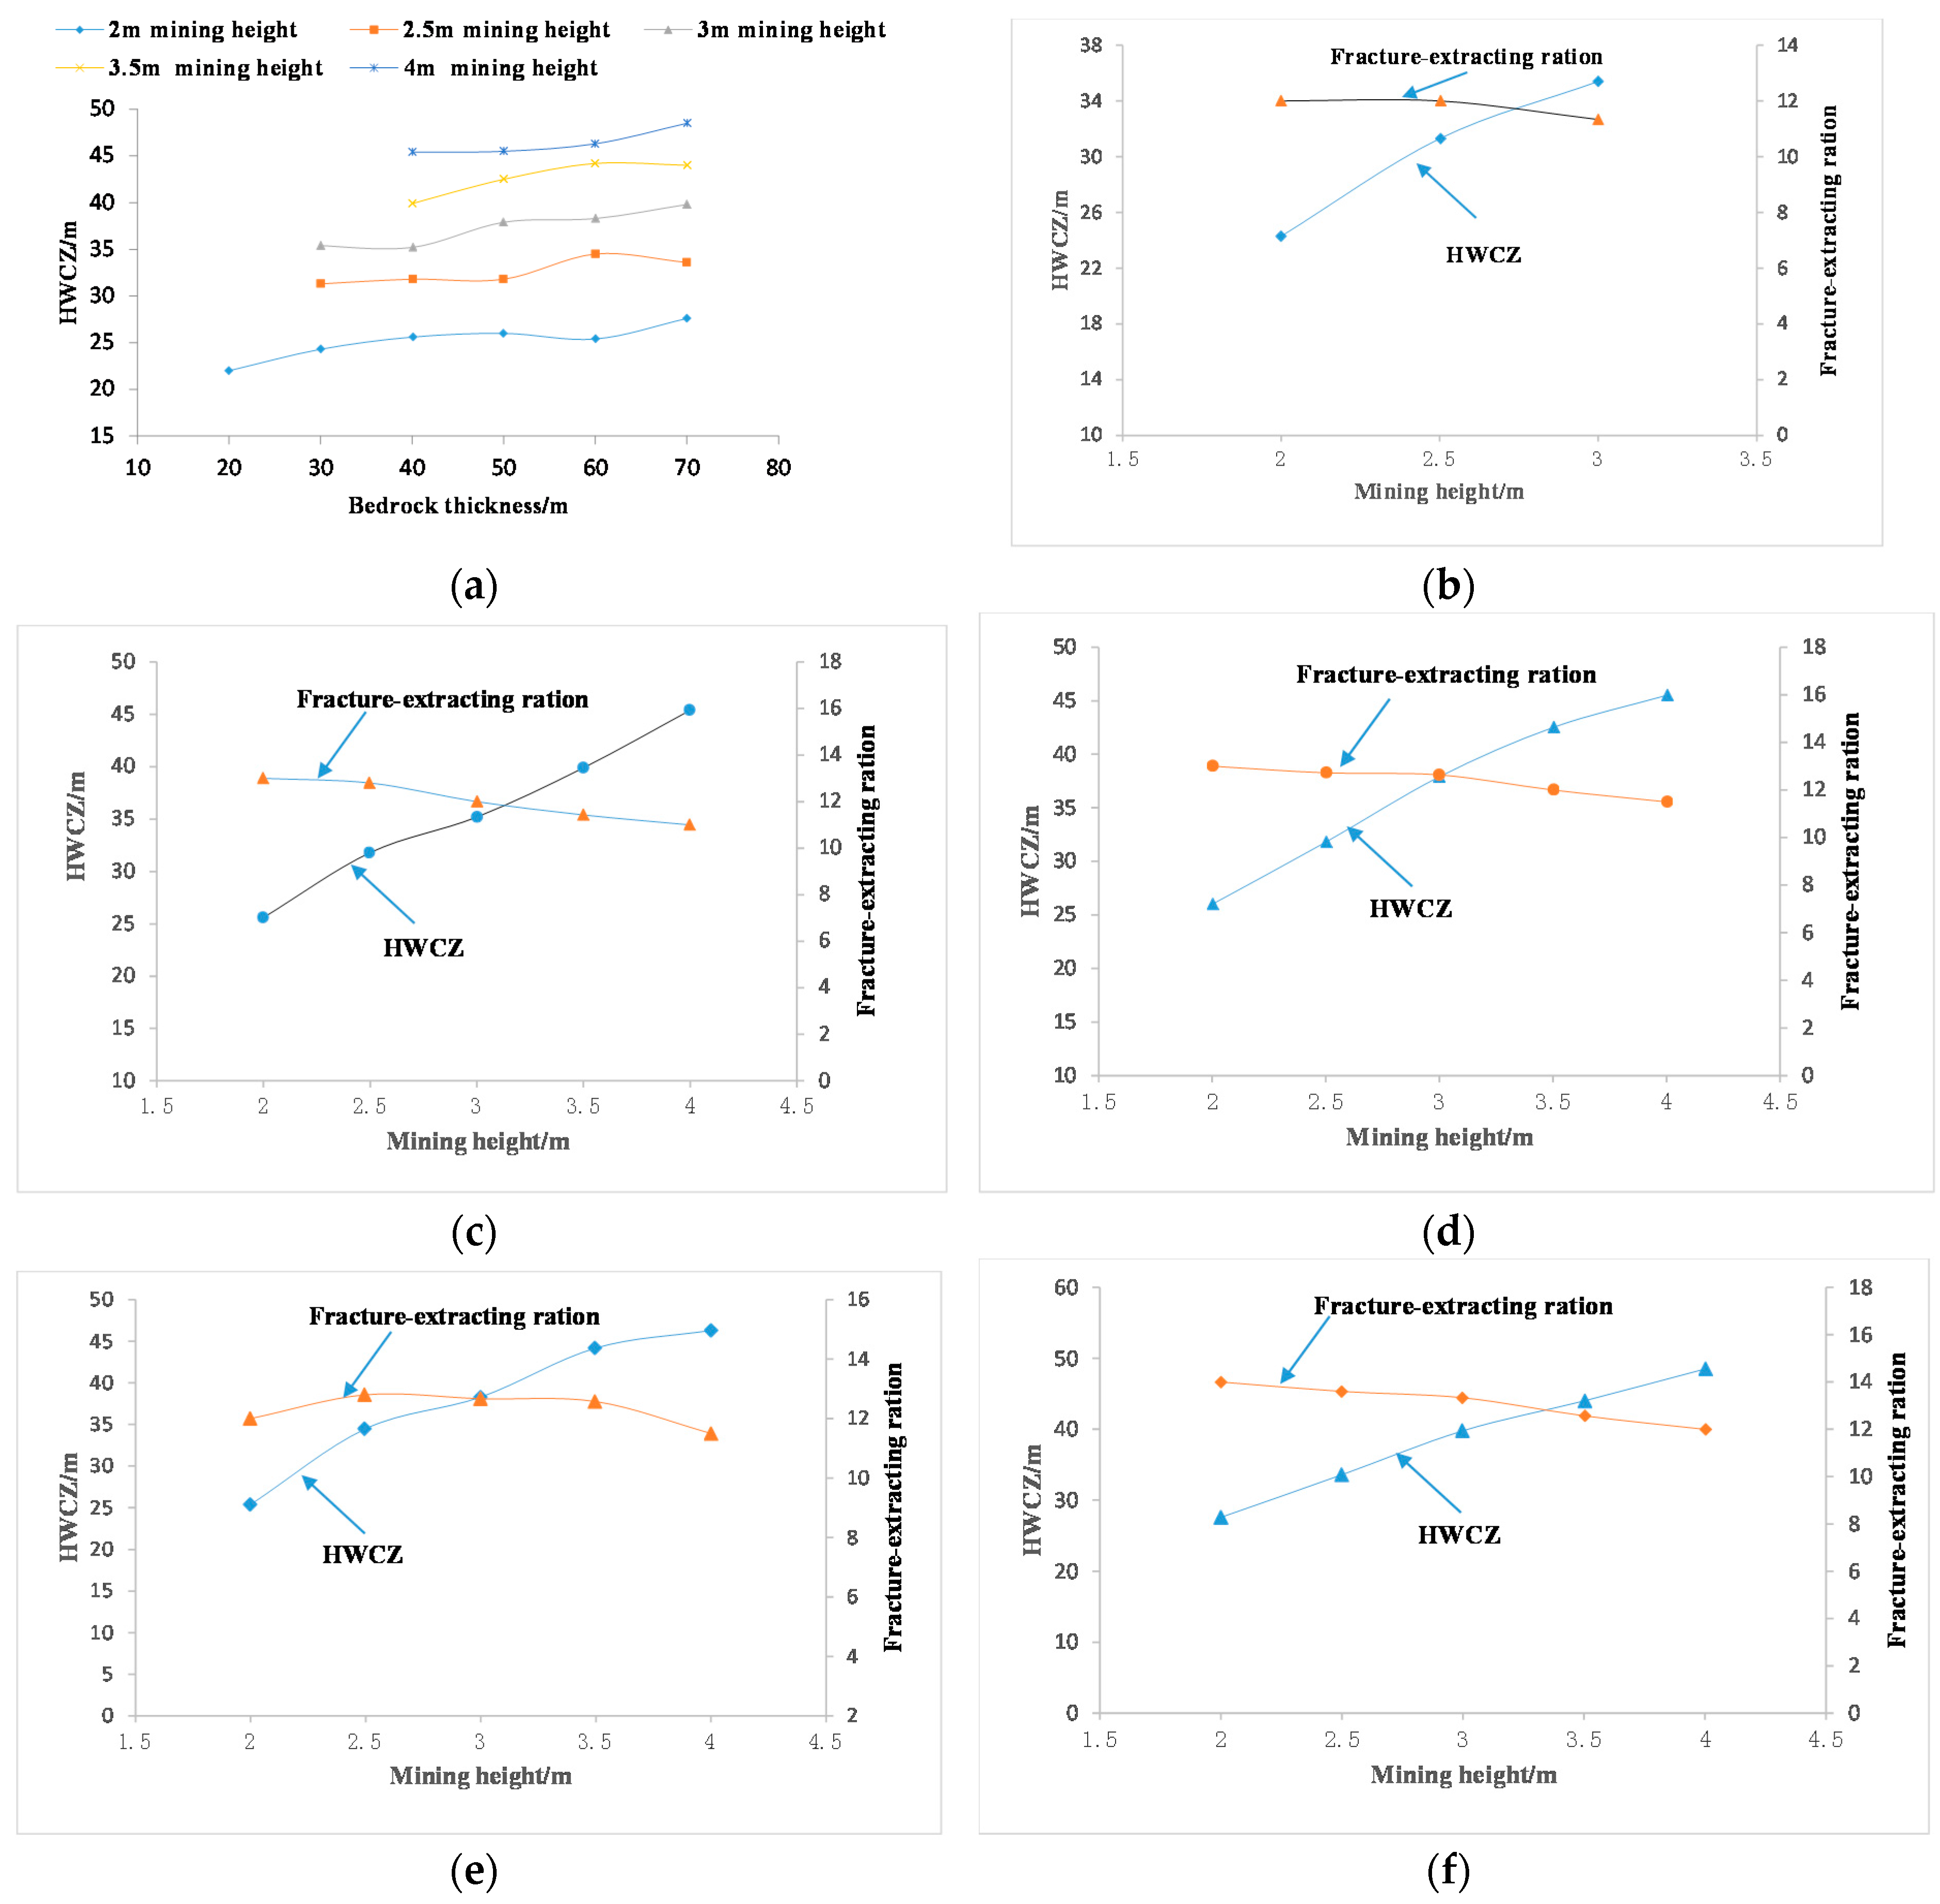
The development of the water-conducting zone at different bedrock thicknesses and mining heights is not synchronous with strata movement; the development of a fracture from low to high areas is not uniform. The heights of the water-conducting zone and relationships between the mining height and the developmental height of the water-conducting zone for different bedrock thicknesses and mining heights are displayed in
Figure 15.
The bedrock thickness ranges from 20 to 70 m, and the mining heights are 1.5, 2, 2.5, 3, 3.5, and 4 m. The vertical fracture develops significantly at heights of approximately 16, 24.3–27.6, 31.3–34.5, 35.2–39.8, 39.9–44.2, and 45.4–48.5 from the coal seam roof. The experiment indicated that the developmental height of the water-conducting zone increased; however, the increasing amplitude gradually decreased with increasing mining height. The developmental height of the water-conducting zone increases rapidly with increasing mining height from 2 to 3 m; the developmental height of the water-conducting zone increases gradually with increasing mining height from 3 to 4 m. The ratio of the fractured zone to the mining height decreases gradually with increasing mining height.
Field measurements and numerical simulations were used to analyze the evolution law of the water-conducting zone for different bedrock thicknesses and mining heights. The safe mining upper limit of bedrock thickness was obtained. The relationship between the developmental HWCFZ and bedrock thickness/mining height was determined. Ultimately, the area was divided into six regions (A, B, C, D, E, F) (
Figure 16 and
Figure 17) in the Zhao Gu No. 1 coal seam. The maximum mining heights of zones A, B, C, D, and E are 4, 3.5, 3, 2, and 1.5 m, respectively; zone F is a forbidden mining area.
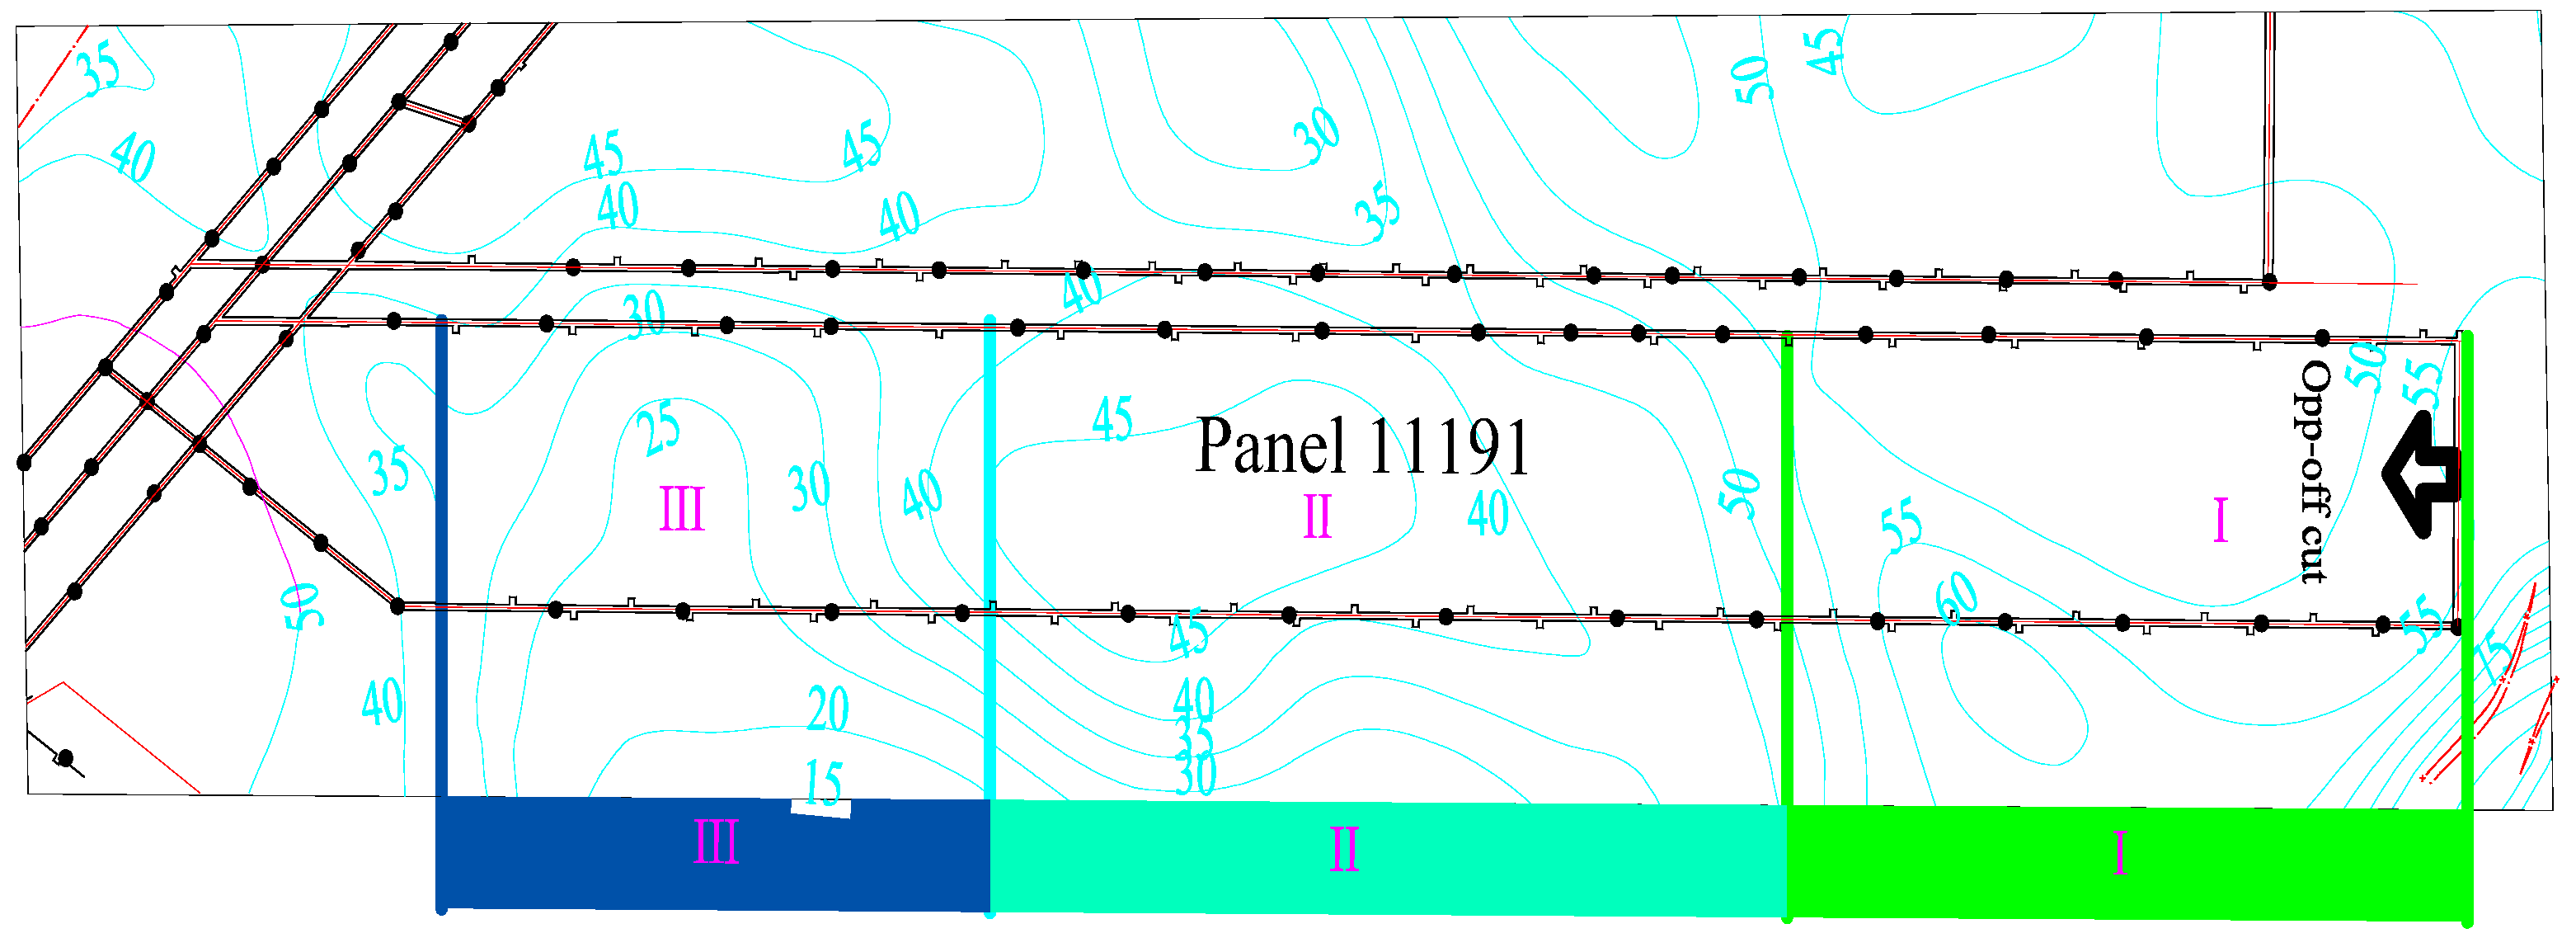
5. Industrial Experiment and Surface Subsidence Field Monitoring
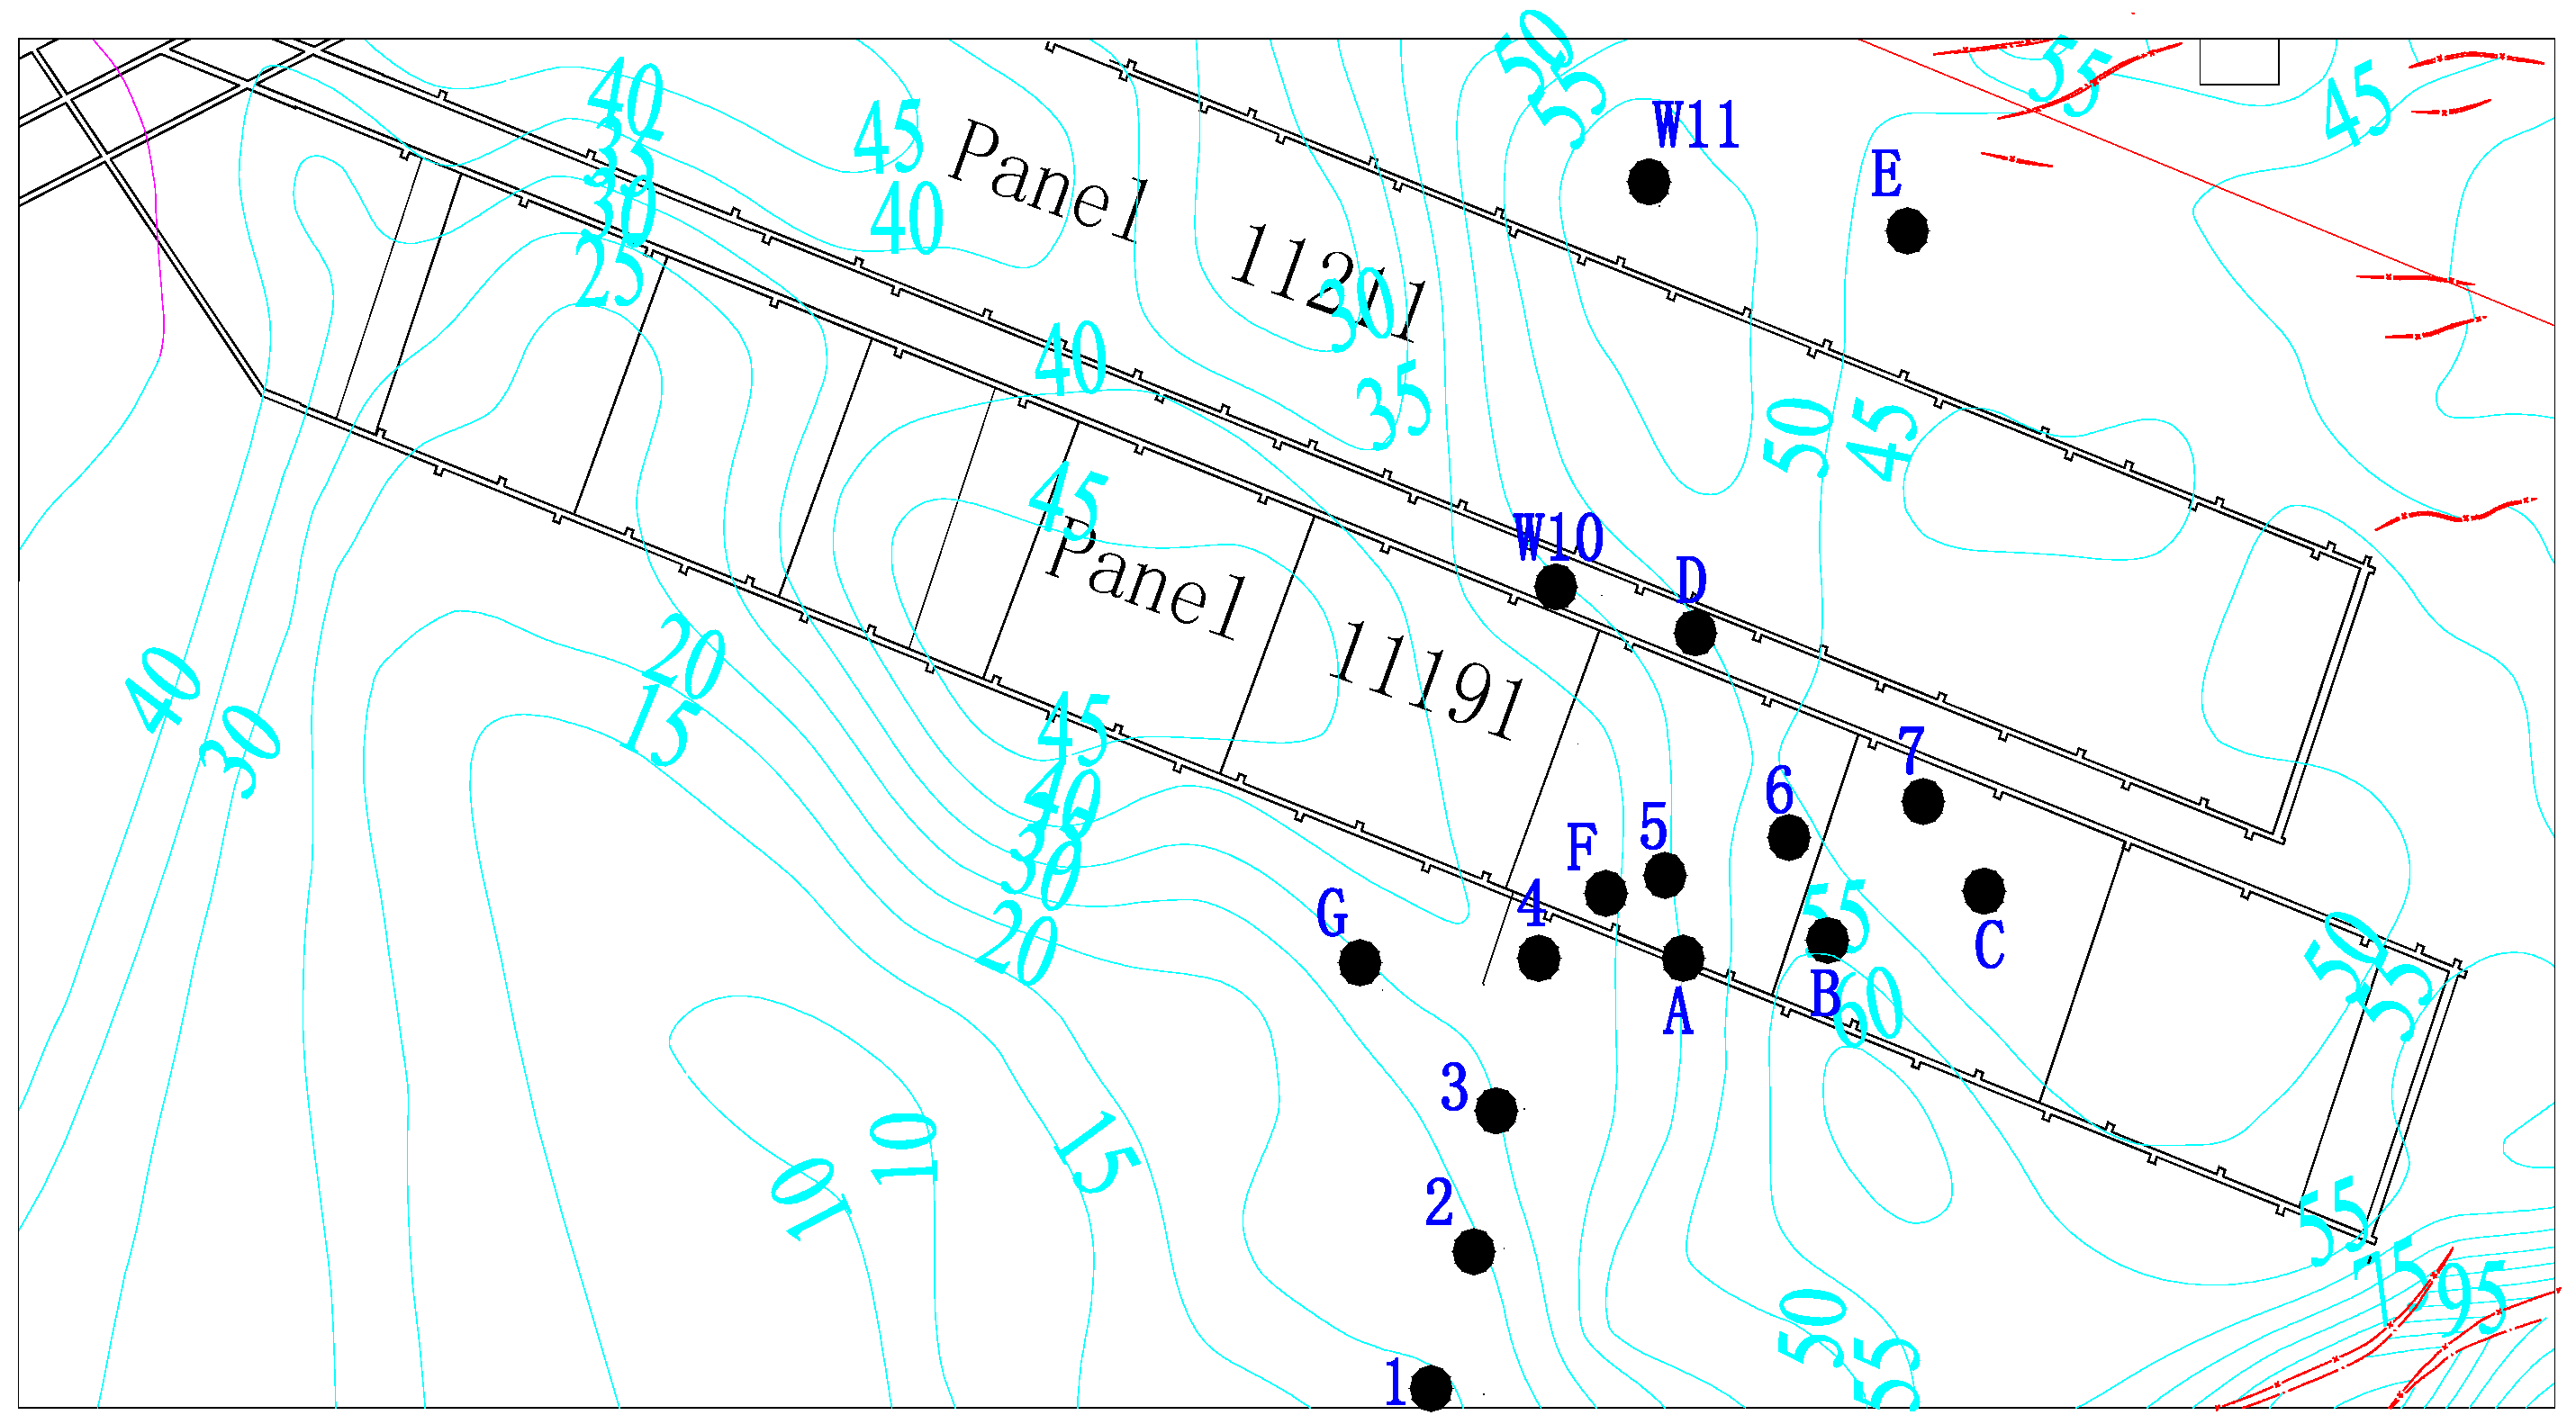
The 11,191 panel is 1650.5 m long and 192.5 m wide, the layout of the working panel is along the strike, the thickness of the unconsolidated layers is in the range of 404–428 m, and the bedrock is thin (21.1 to 47 m). The research objectives were applied to the 11,191 panel, which was divided into three regions (I, II and III) to control the mining height. The maximum mining heights of zones I, II, and III were 3.5, 3, and 2 m, respectively, as shown in
Figure 18. To investigate the site application effect, surface subsidence observations were implemented during the extraction of 11,191 working face. The measuring points were arranged on the surface as shown in
Figure 19. The settlement changes at each measuring point with the 11,191 panel advance are shown in
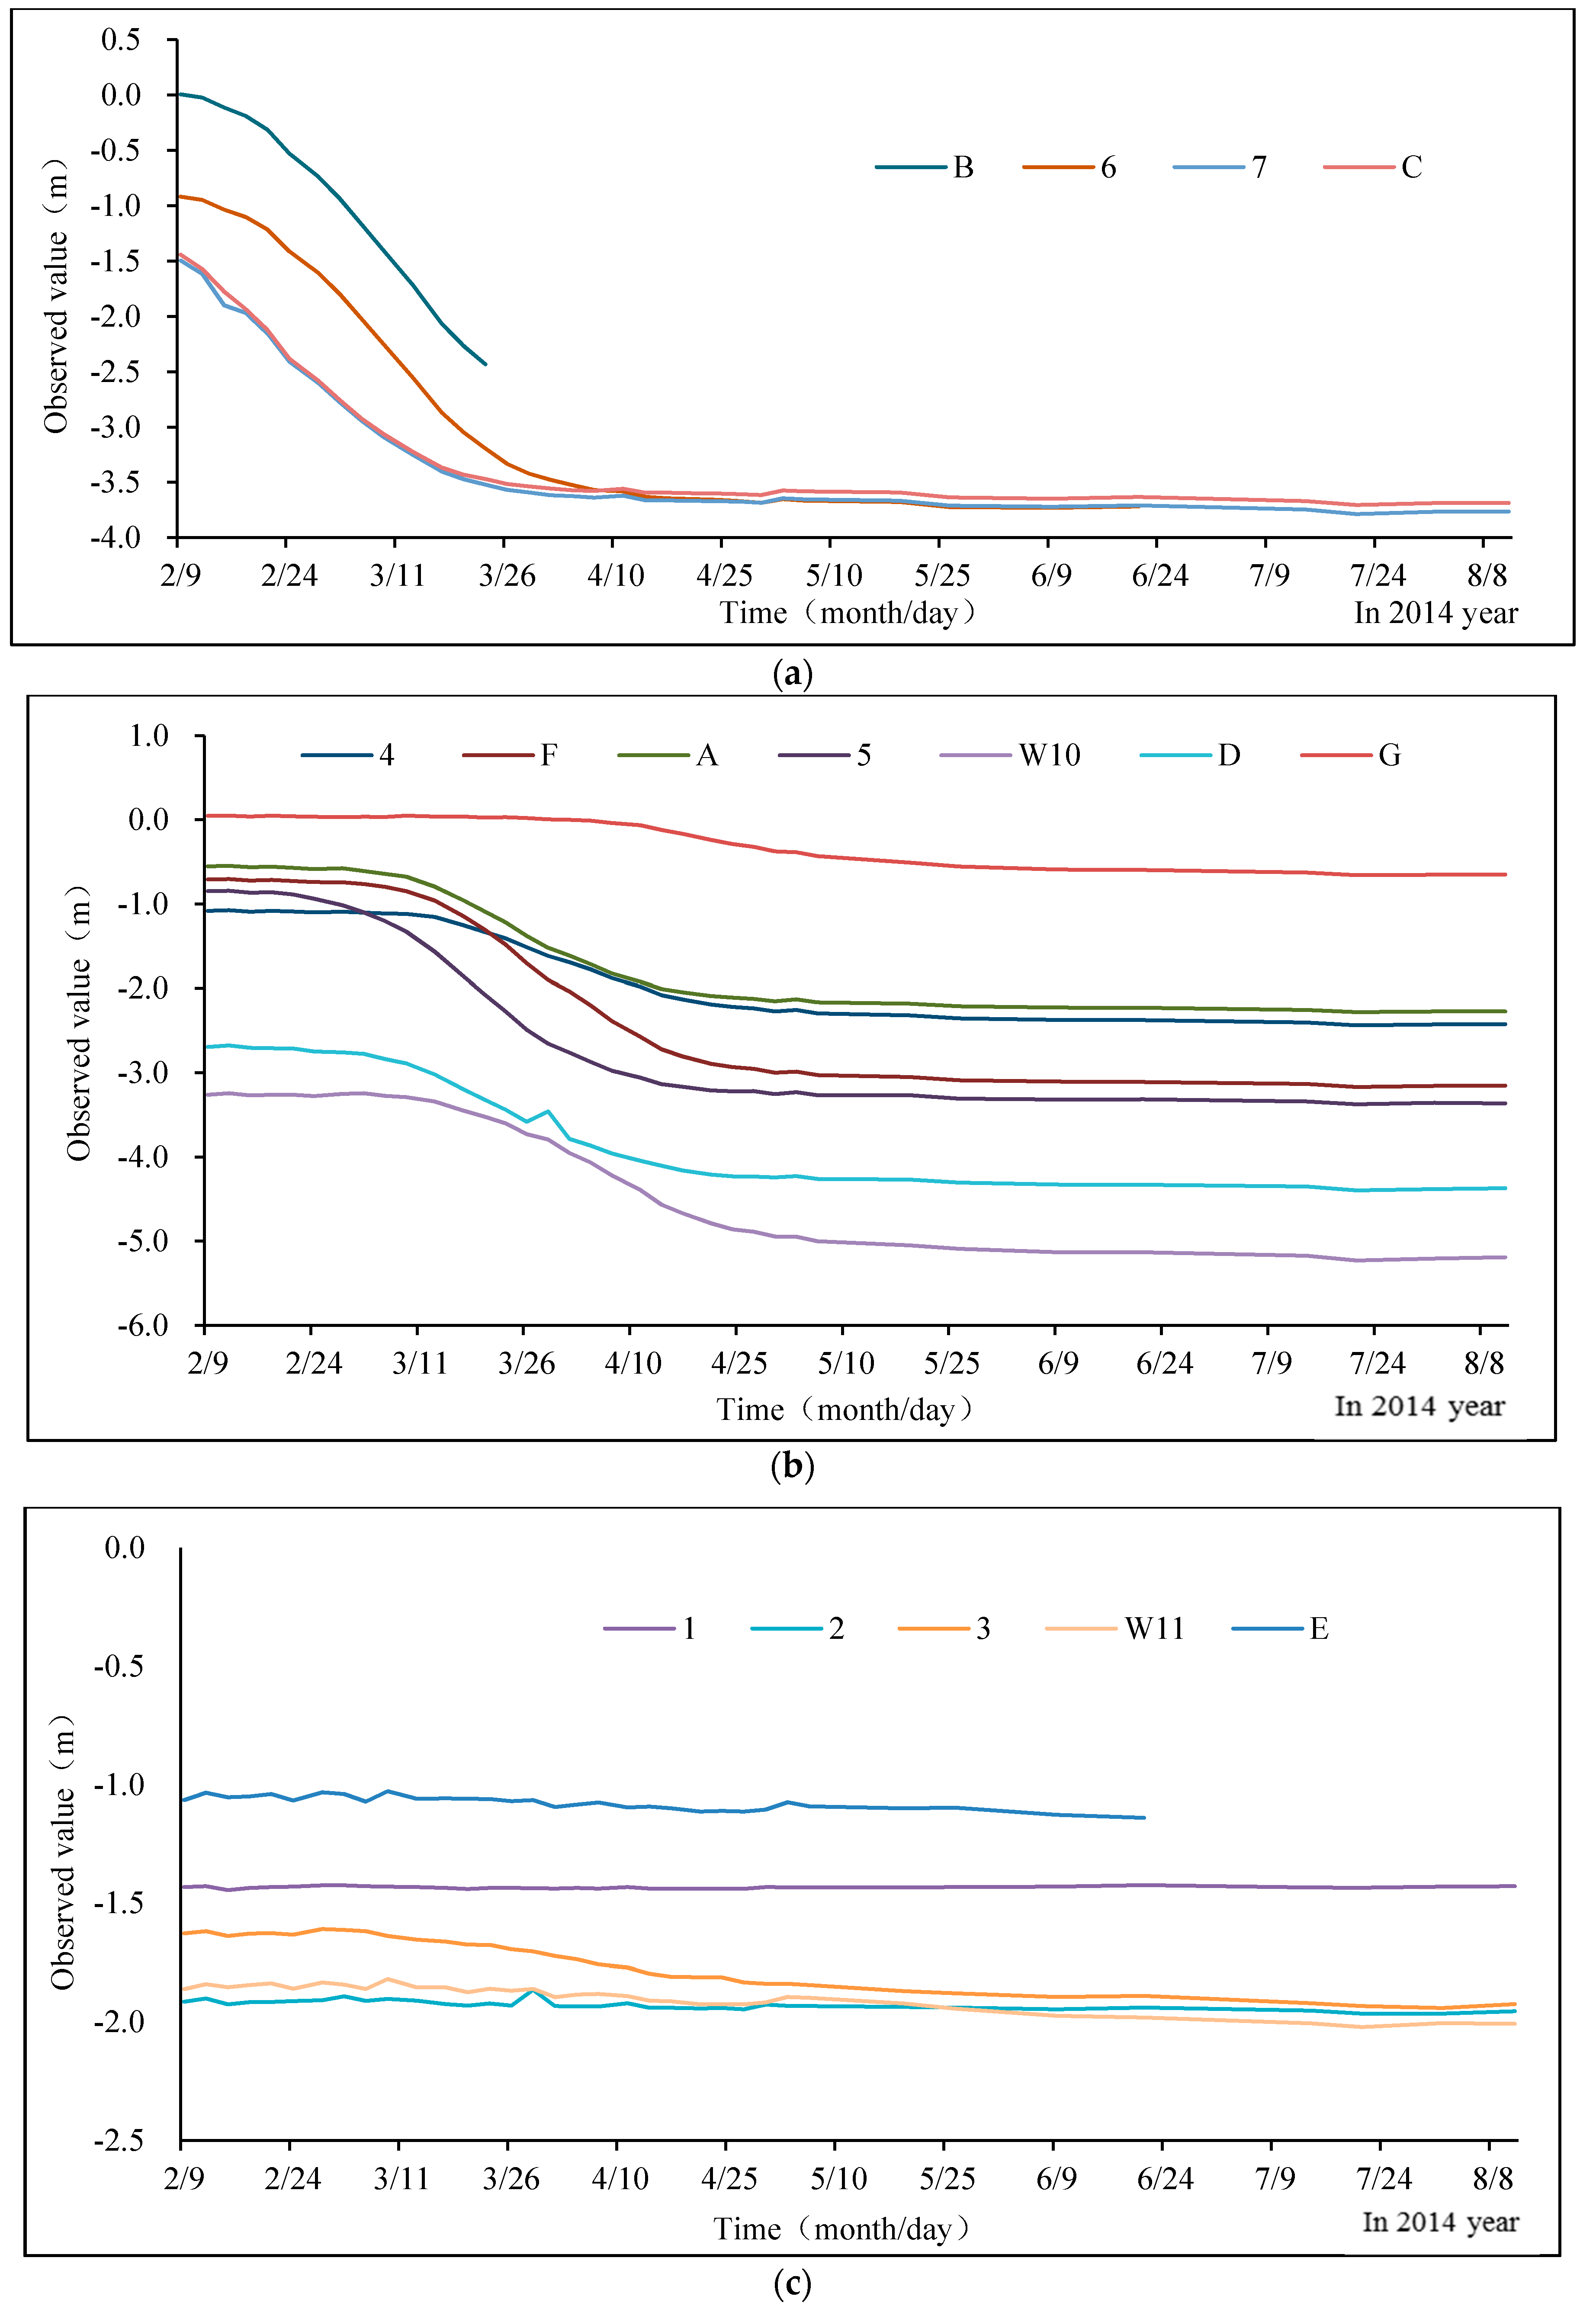
Figure 20.
Figure 20a reveals that measuring points 6, 7, B, and C settled earlier because they were the closest to the advancing working face. With the coal mining face advancing, the overlying strata continuously reached a steady state when the panel passed the measuring points; the ground settlement also reached a steady state without changes.
Figure 20b shows that measuring points 4, F, A, 5, W10, D, and G were initially in a stable state. As the mining face advanced, roof fracture and roof collapse resulted in the settlement of the ground surface above the increasing working face.
Figure 20c shows that measuring points 1, 2, W11, and E did not change significantly, indicating that mining did not influence regions relatively far from the 11,191 panel. All of the analysis results showed that the ground surface subsided uniformly without significant hopper-type and step-type subsidence, and water and sand inrush disasters did not occur in the process of the mining face advance. The safe mining of the 11,191 panel was realized.
6. Discussion and Results
In this paper, UDEC models were employed to investigate the development of HWCFZ at different bedrock thicknesses and mining heights for the both prediction and forecast and prevention of water and sand collapse. With reference to the field measurement of the adjacent panel, a corresponding model was established and calibrated with the measurement data. Then, the calculation models of different bedrock thicknesses were built to analyze the evolution law of the water-conducting fractured zone at different bedrock thicknesses and mining heights. The HWCZ of different bedrock thicknesses and mining heights (
Figure 15a), and the relationship of HWCZ and mining height for 30, 40, 50, 60, and 70 m bedrock thicknesses (
Figure 15b–f) were obtained. The upper limit of bedrock thickness for safe mining was determined (
Figure 17).The maximum mining heights of zones A, B, C, D, and E are 4, 3.5, 3, 2, and 1.5 m, respectively; zone F is a forbidden mining area.
Compared with previous research results, the results of this article were able to release more coal resources. Equation (2) was used to calculate the reserves of coal resources and the release amount of coal resources for each region; the results are listed in
Table 3. The release amount of coal resources was calculated using empirical Equation (1); based on this, the research results are compared and analyzed. If the development maximum HCWFZ calculated using Equation (1) were to be adopted, approximately 10,248,484.3 t of coal resources would be successfully released. Based on the results of this study, approximately 40,199,336.3 t of coal resources could be successfully released; the released amount of coal resources may be increased by up to 29,950,852 t and the resource recovery rate increased by 30.12%. The designed production capacity of the Zhao Gu No. 1 coal seam is 2,400,000 t, annually, so the service life of the mine would be extended by 12 y. This study provides technical support for the sustainable development of Zhao Gu No. 1 coal seam.
where
: Reserves of coal resources, t;
: Horizontal area of each region, m
2;
: Average thickness of mining height, m;
: Bulk density of coal, 1.46 t/m
3;
: Coal average angle of each region, 0°.
7. Conclusions
Field measurements and numerical simulations were used to analyze the evolution law of the water-conducting zone at different bedrock thicknesses and mining heights. The safe mining upper limits of the different bedrock thicknesses were obtained. The relationship between the developmental HWCFZ and bedrock thickness/mining height was determined. On the basis of a loose bed profile and the bedrock thickness contour map of the thin bedrock area, six numerical models were constructed to simulate the evolution law and distribution pattern of mining-induced WCFZ at different bedrock thicknesses and mining heights. The simulation results indicated that, with bedrock thickness ranging from 20 to 70 m, and mining heights of 1.5, 2, 2.5, 3, 3.5, and 4 m in the Zhao Gu No. 1 coal mine, significant vertical fractures would develop at heights from the coal seam roof of approximately 16, 24.3–27.6, 1.3–34.5, 35.2–39.8, 39.9–44.2, and 45.4–48.5 m, respectively. The developmental height of the WCFZ increased with increasing mining height; the developmental HWCFZ increased gradually when the mining height reached a certain value. The reasonable safe mining upper limits were determined to be bedrock thicknesses of 1.5, 2, 3, 3.5, 4, and 4 m for maximum mining heights of 20, 30, 40, 50, 60, and 70 m, respectively. The thin bedrock area in the Zhao Gu No. 1 coal seam was divided into zones A, B, C, D, E, and F. The maximum mining heights of zones A, B, C, D, and E were 4, 3.5, 3, 2, and 1.5 m, respectively; zone F was a forbidden mining area. The research objectives were applied to the 11191 coal mining face; the thickness of the unconsolidated layers was in the range of 404–428 m; and the bedrock was thin (24.1–55 m). The safe mining of the 11191 panel was realized.


