
Vulnerability Assessment in African Villages under Conditions of Land Use and Climate Change: Case Studies from Mkomazi and Keiskamma

 ,
,
Abstract
:1. Introduction
2. Conceptual Framework
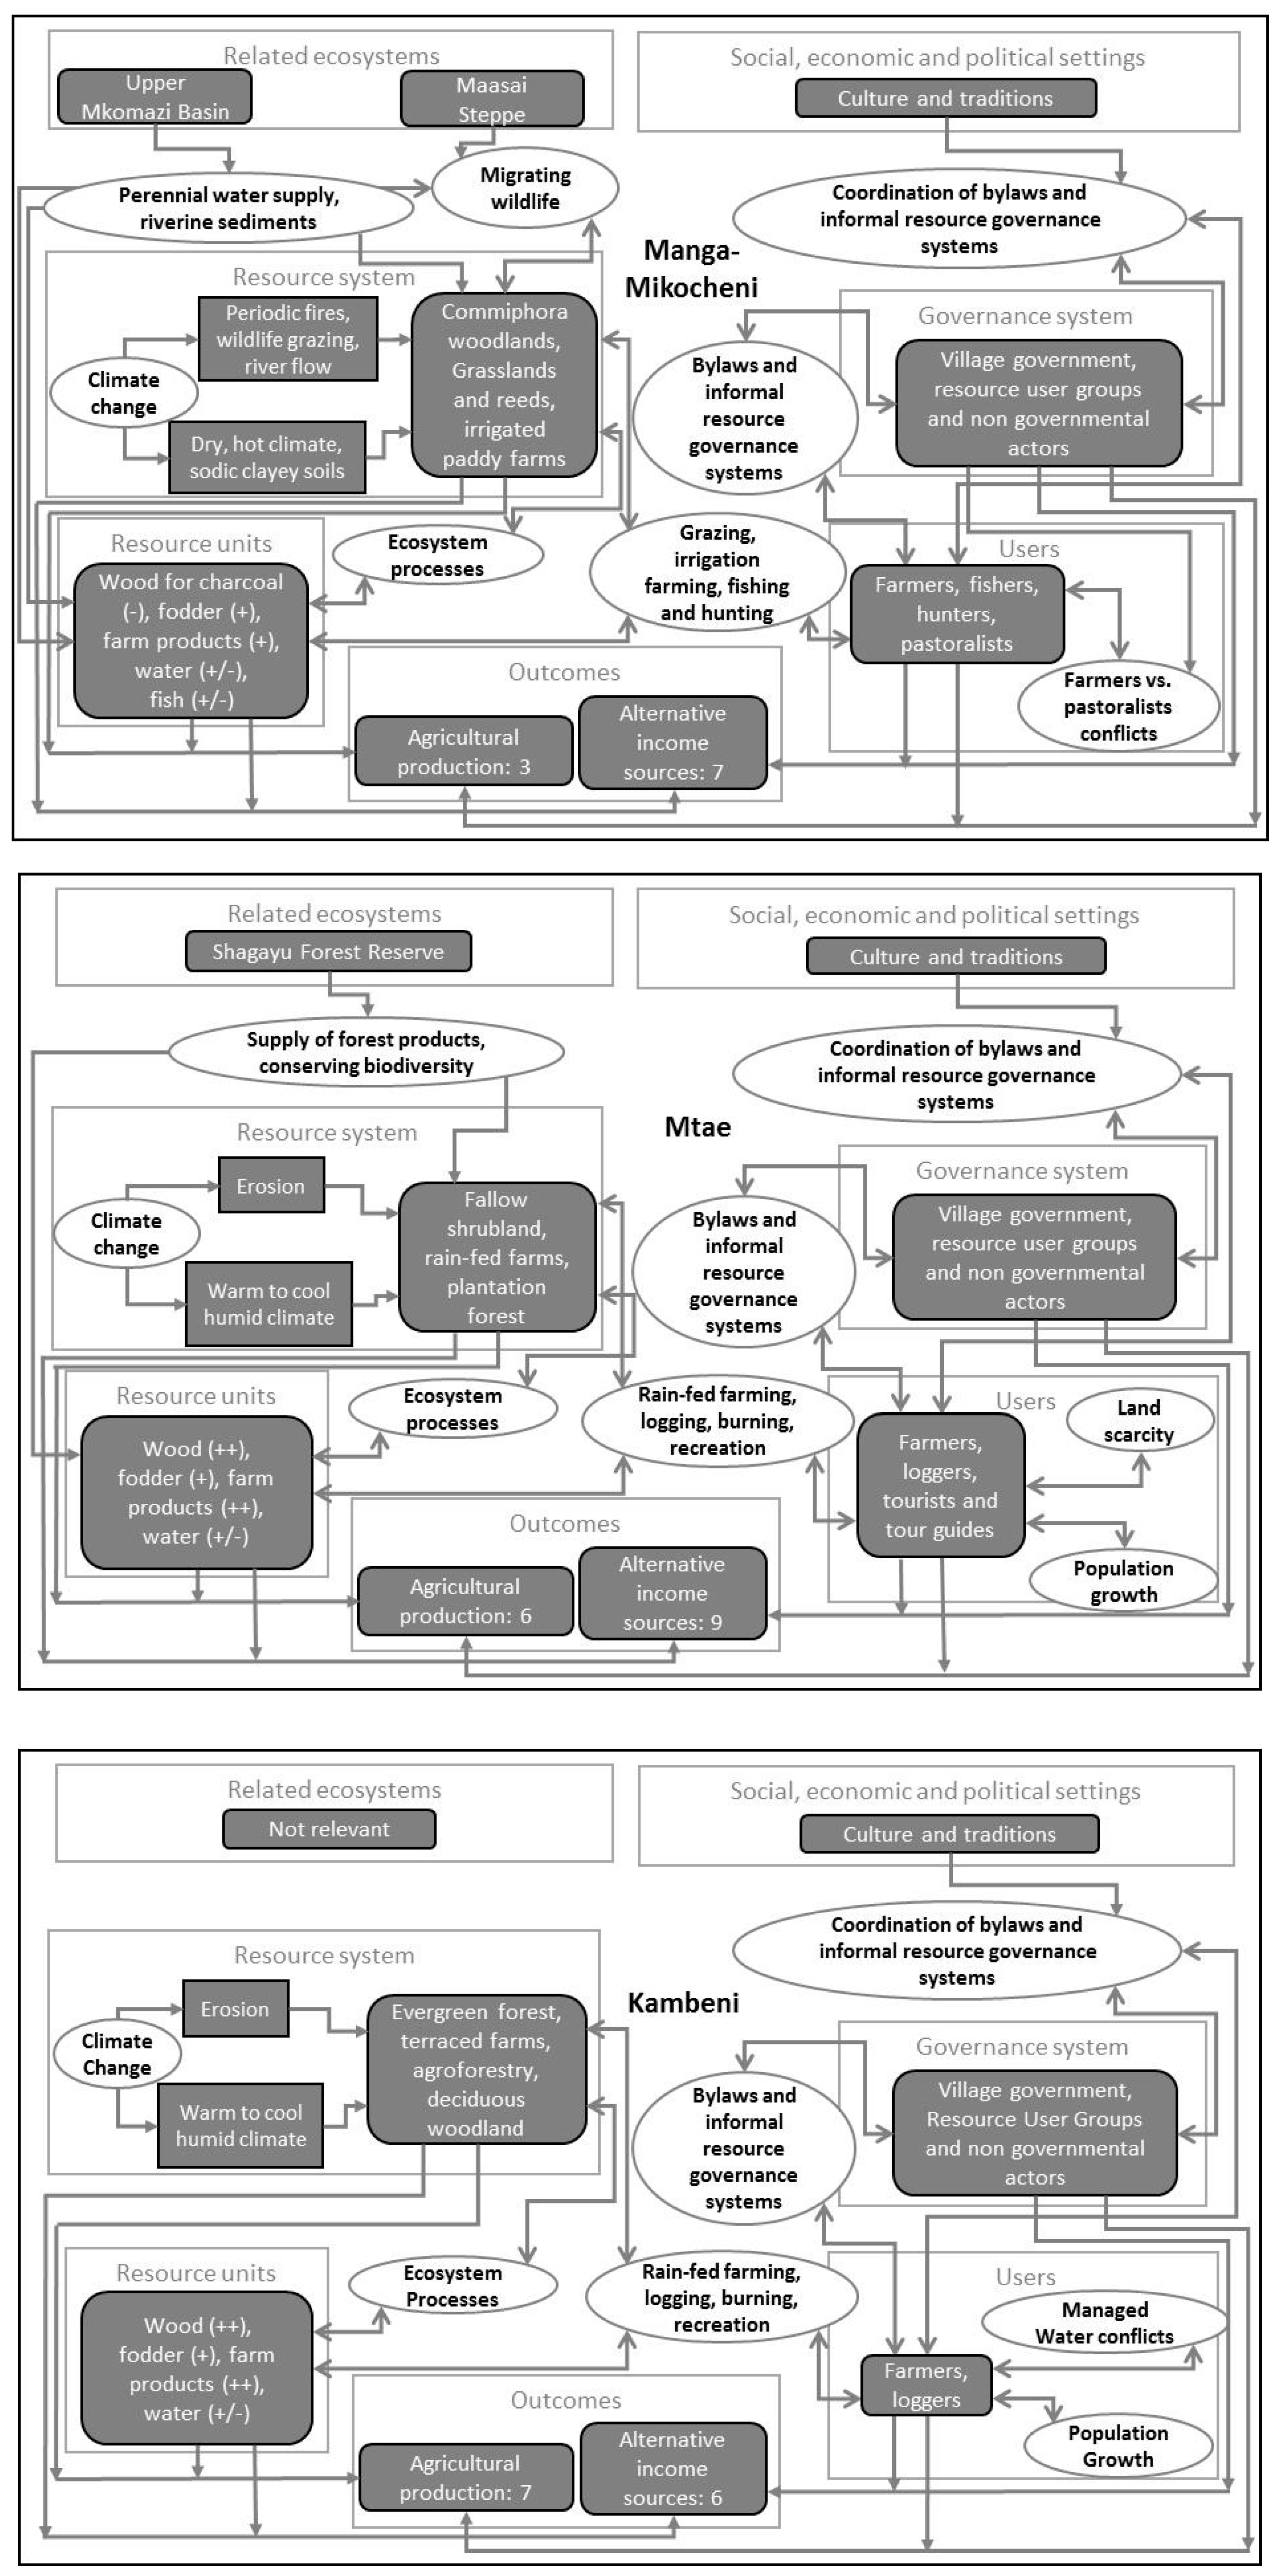
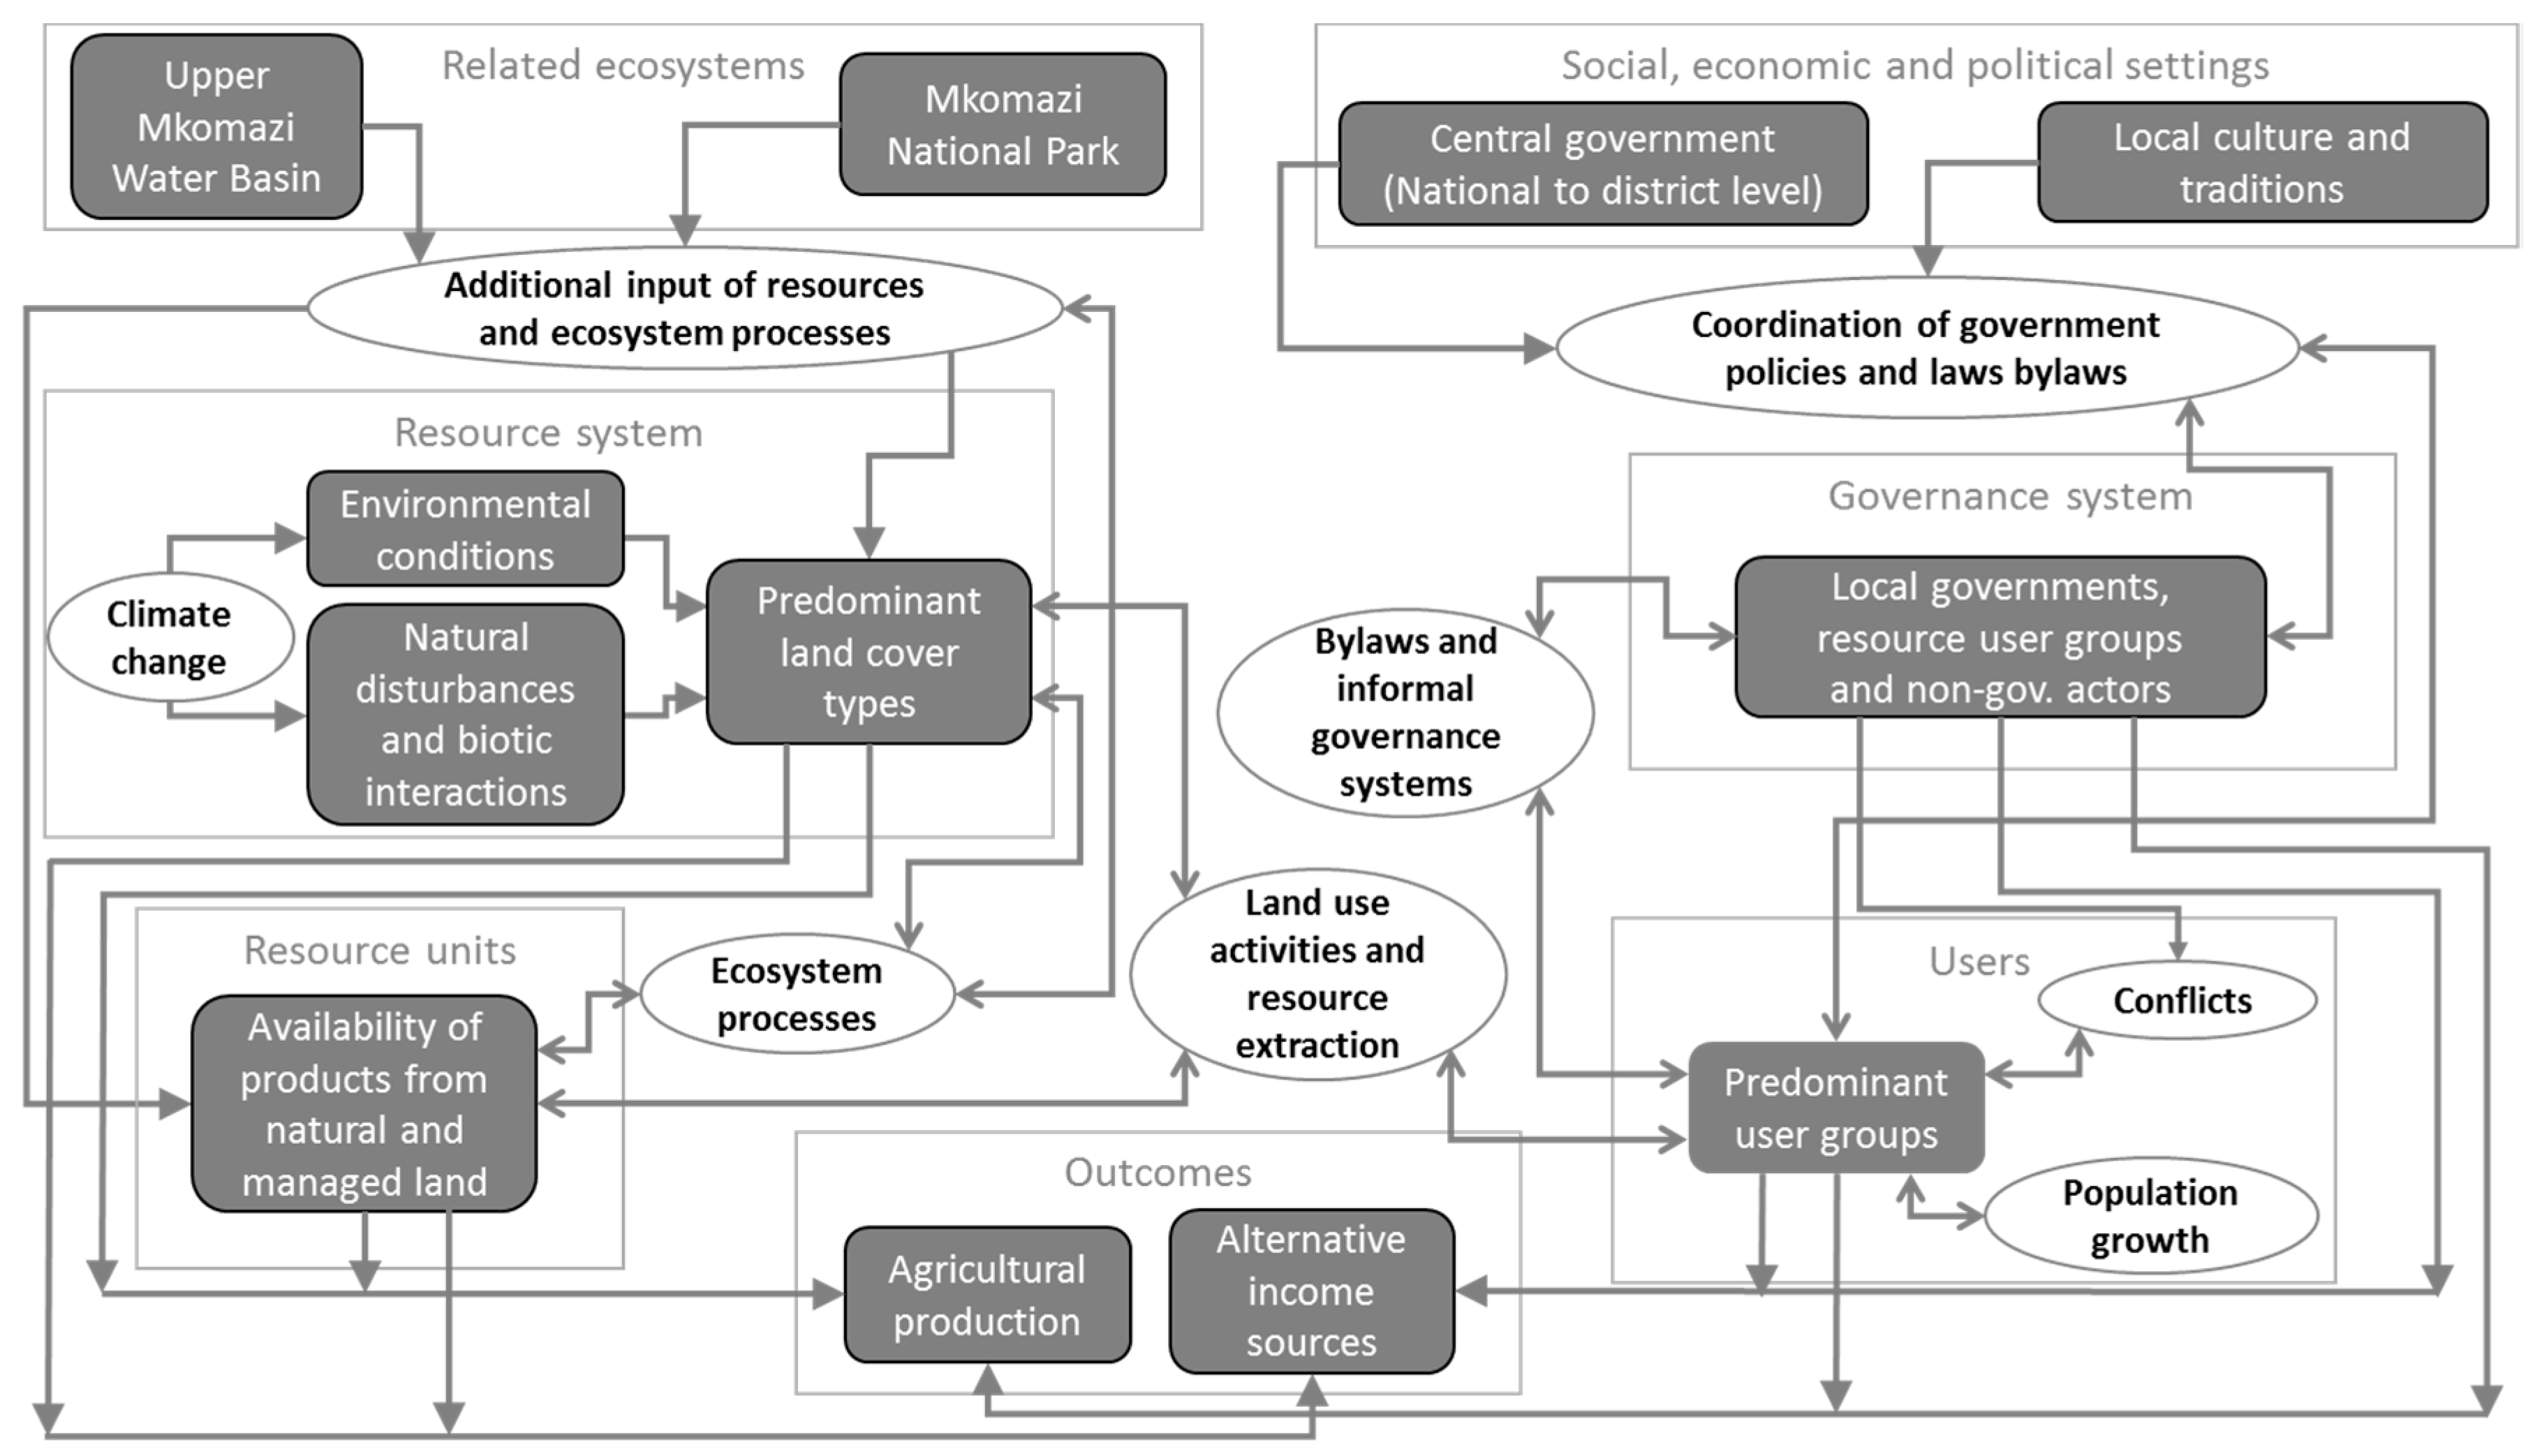
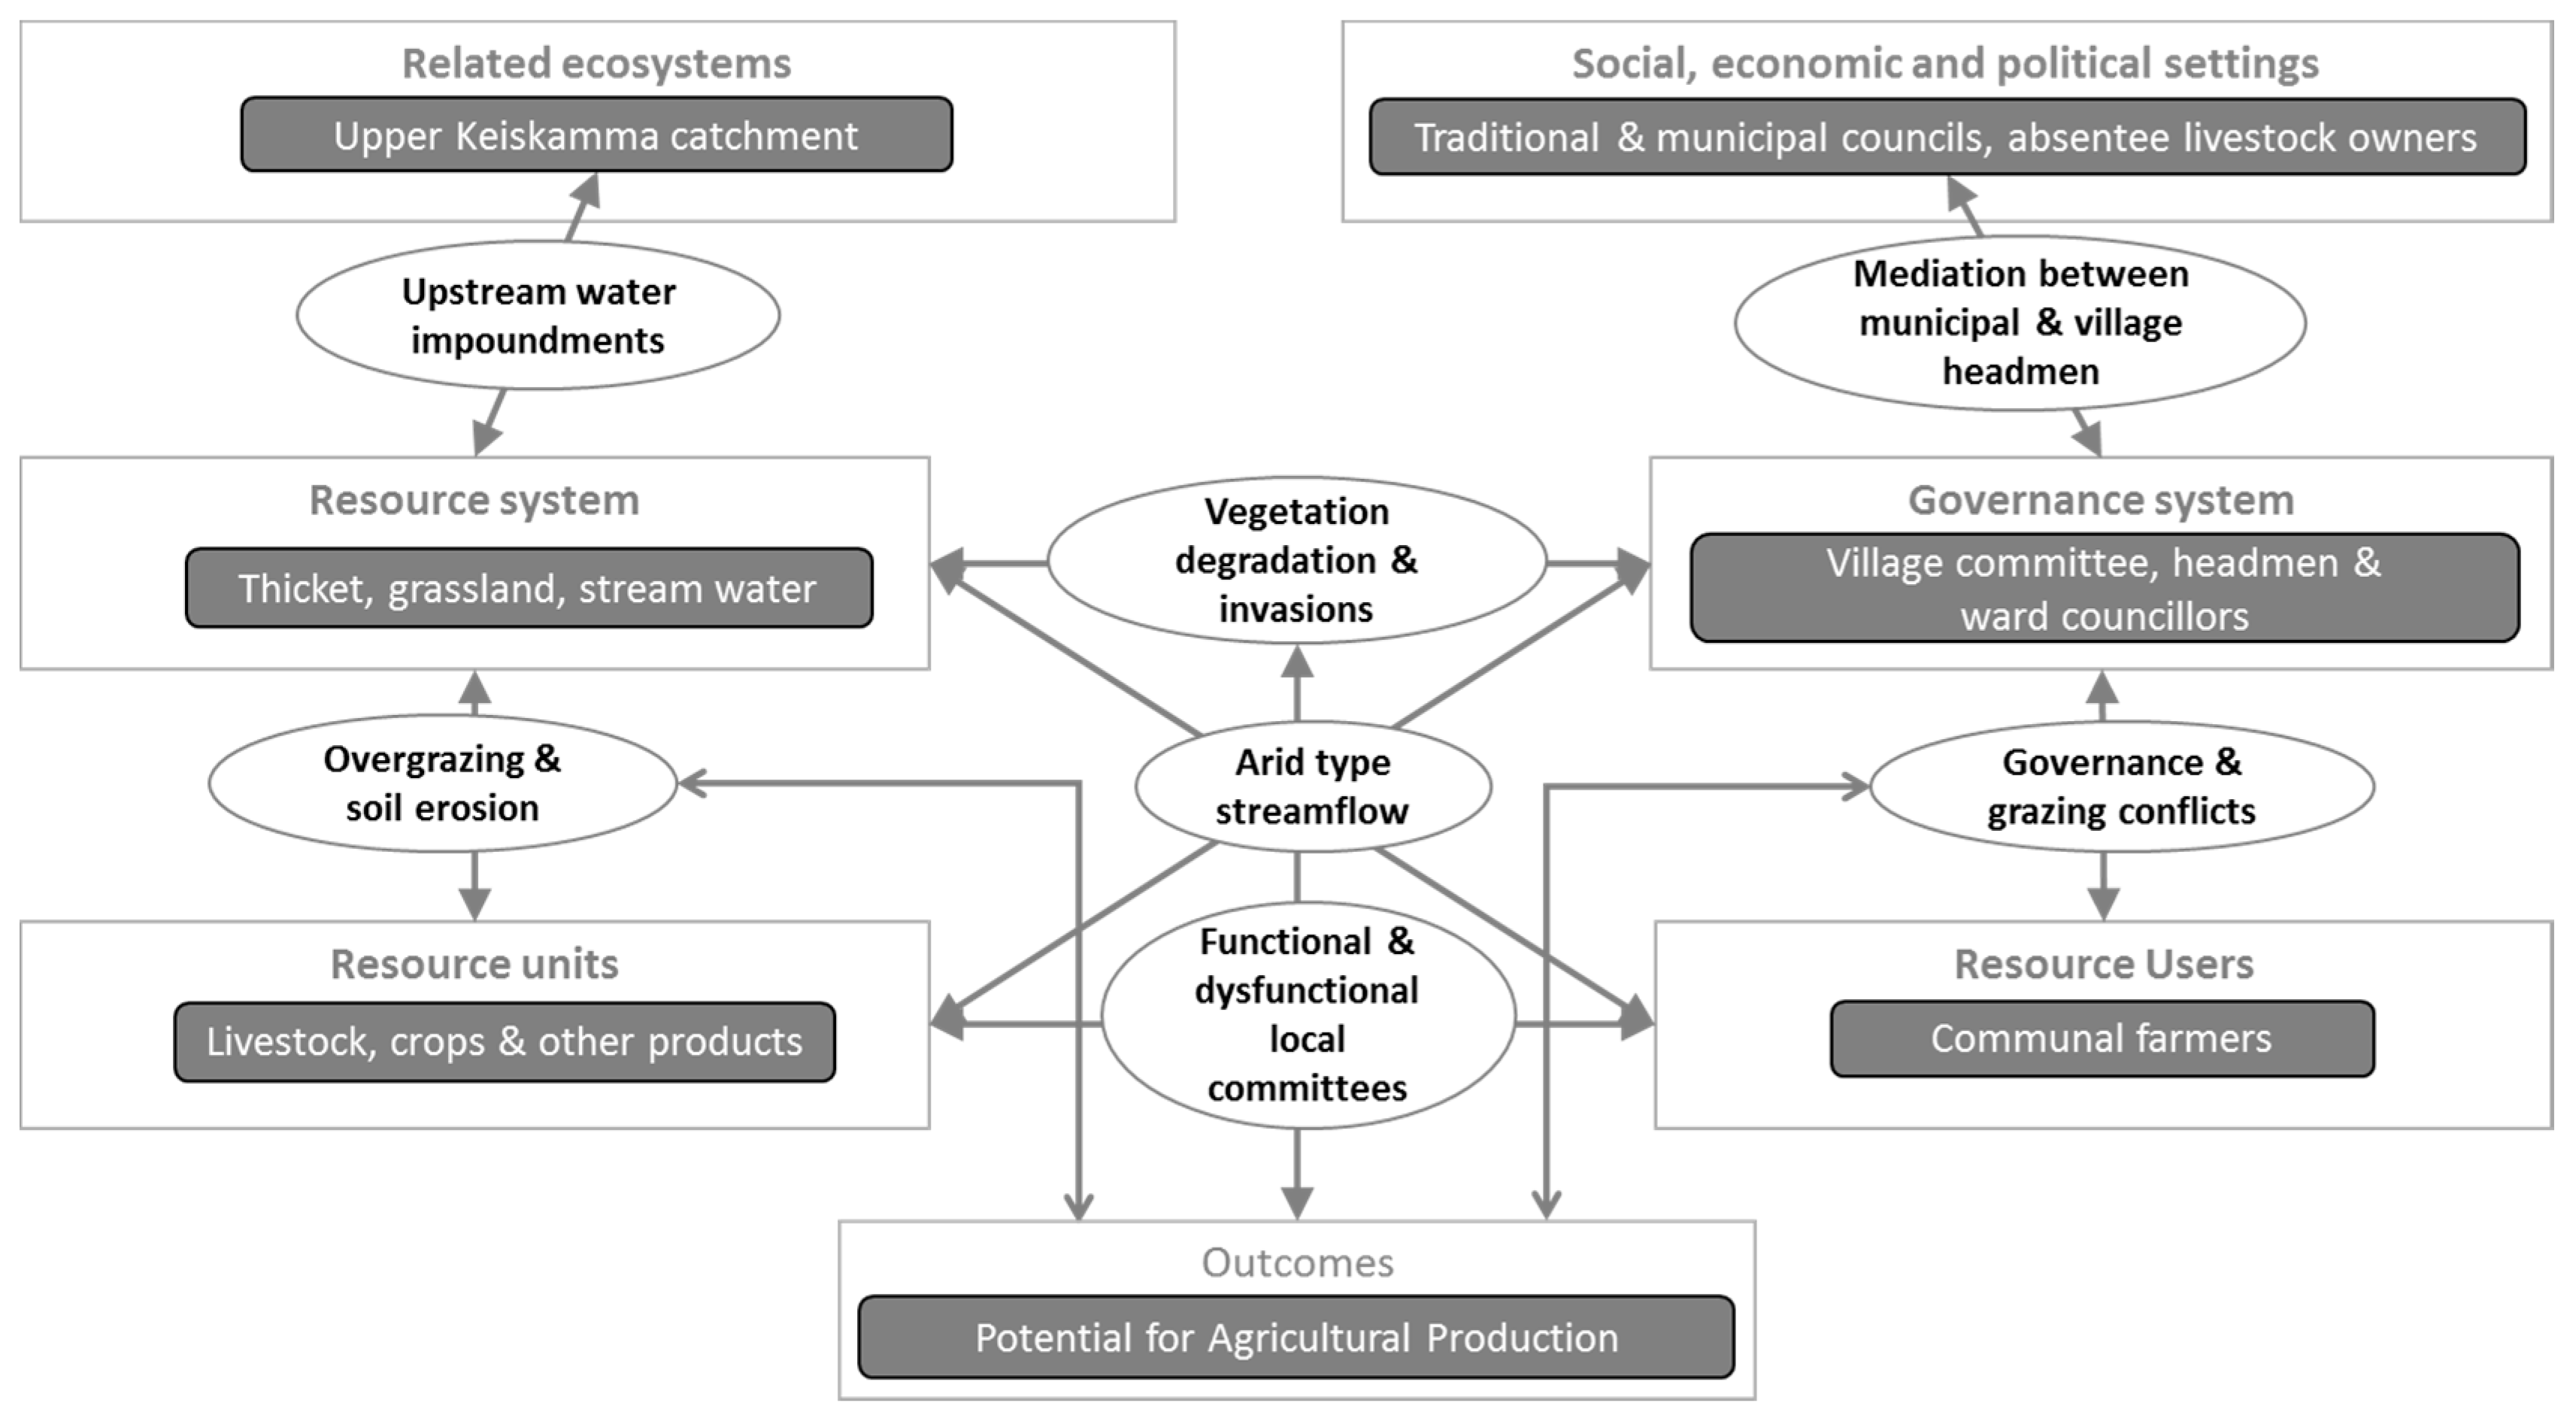
- Semi-quantitative assessments of village vulnerabilities as measures of possible harm for the villages mainly in terms of (potential for) agricultural production allowed comparisons of vulnerability levels between villages within each analysed water basin and gives regional decision makers useful information in which villages measures of vulnerability reduction are mostly needed. As described before, due to the differences between the social-ecological systems in Mkomazi (Tanzania) and Keiskamma (South Africa) and different data availabilities case specific methods for assessing village vulnerability had to be applied in the two case study regions. Therefore, the vulnerability indexes are not comparable between the two case study regions. This is not a major disadvantage since most decisions for vulnerability reduction are taken at national or subnational levels so that most decision makers have no need for international vulnerability comparisons. As noted before, within the regions, the vulnerability indexes are comparable and very useful for focusing policy interventions on the most vulnerable villages. In the SES framework, assessments of village vulnerability can be seen as indicators of outcome (O, see Figure 1).
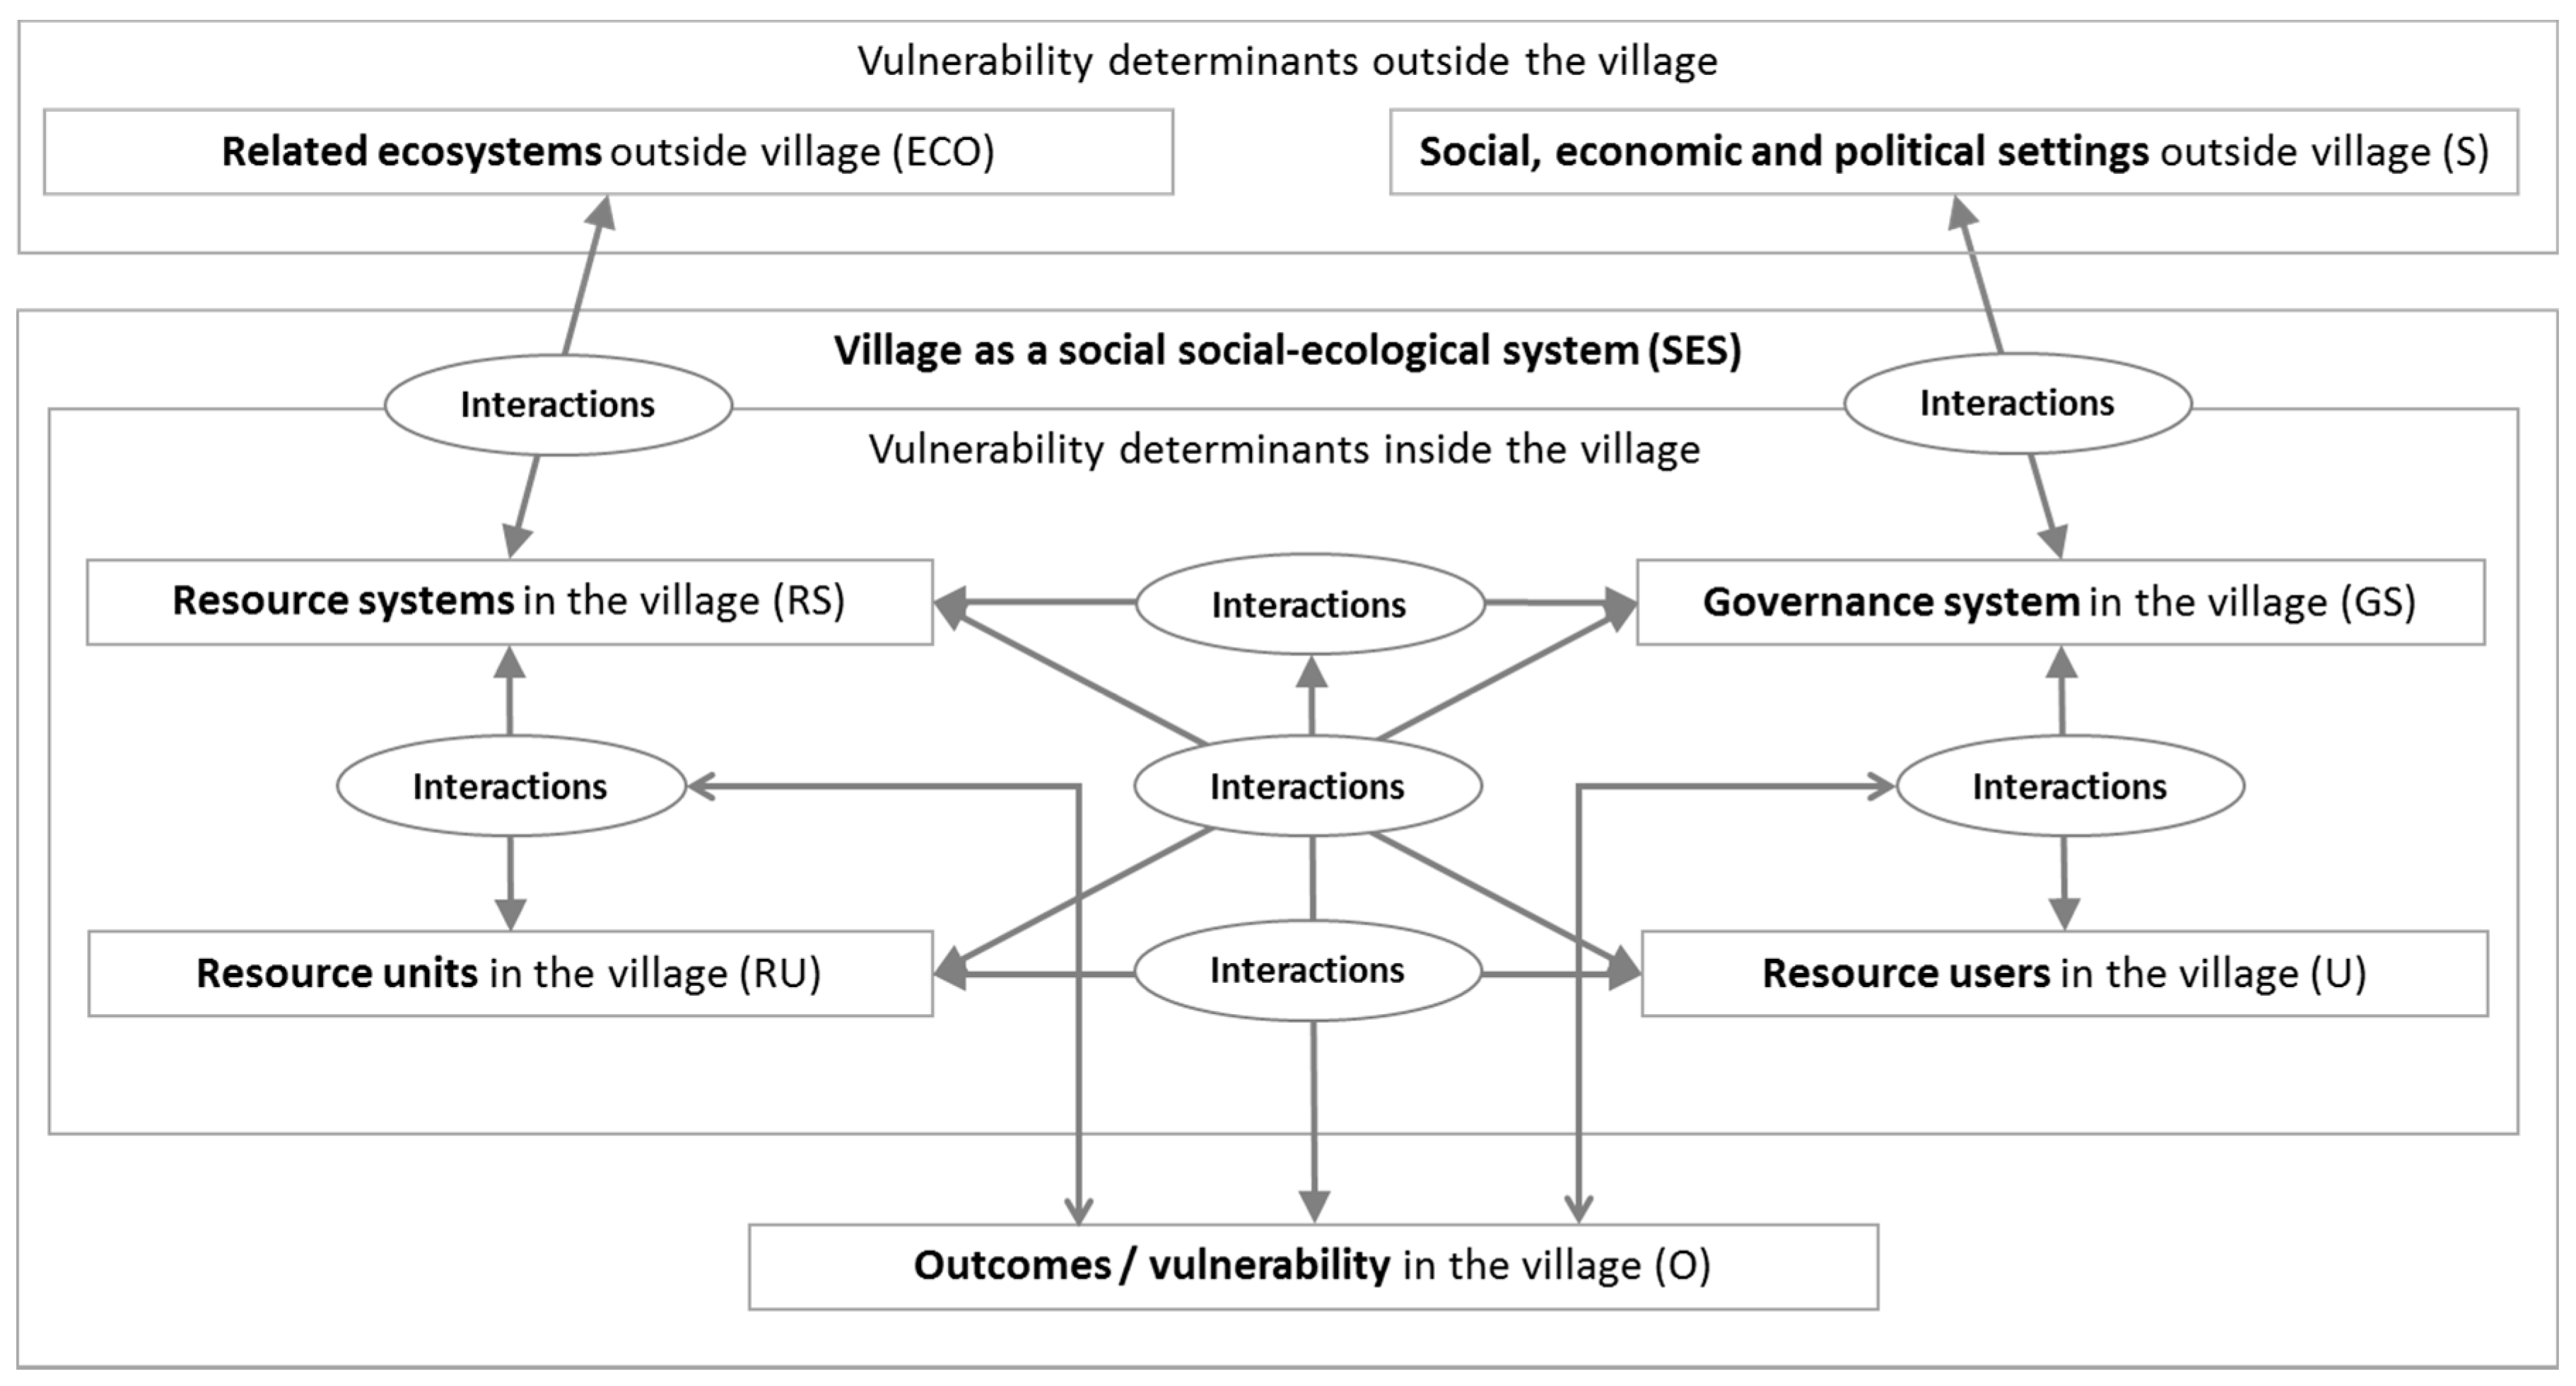
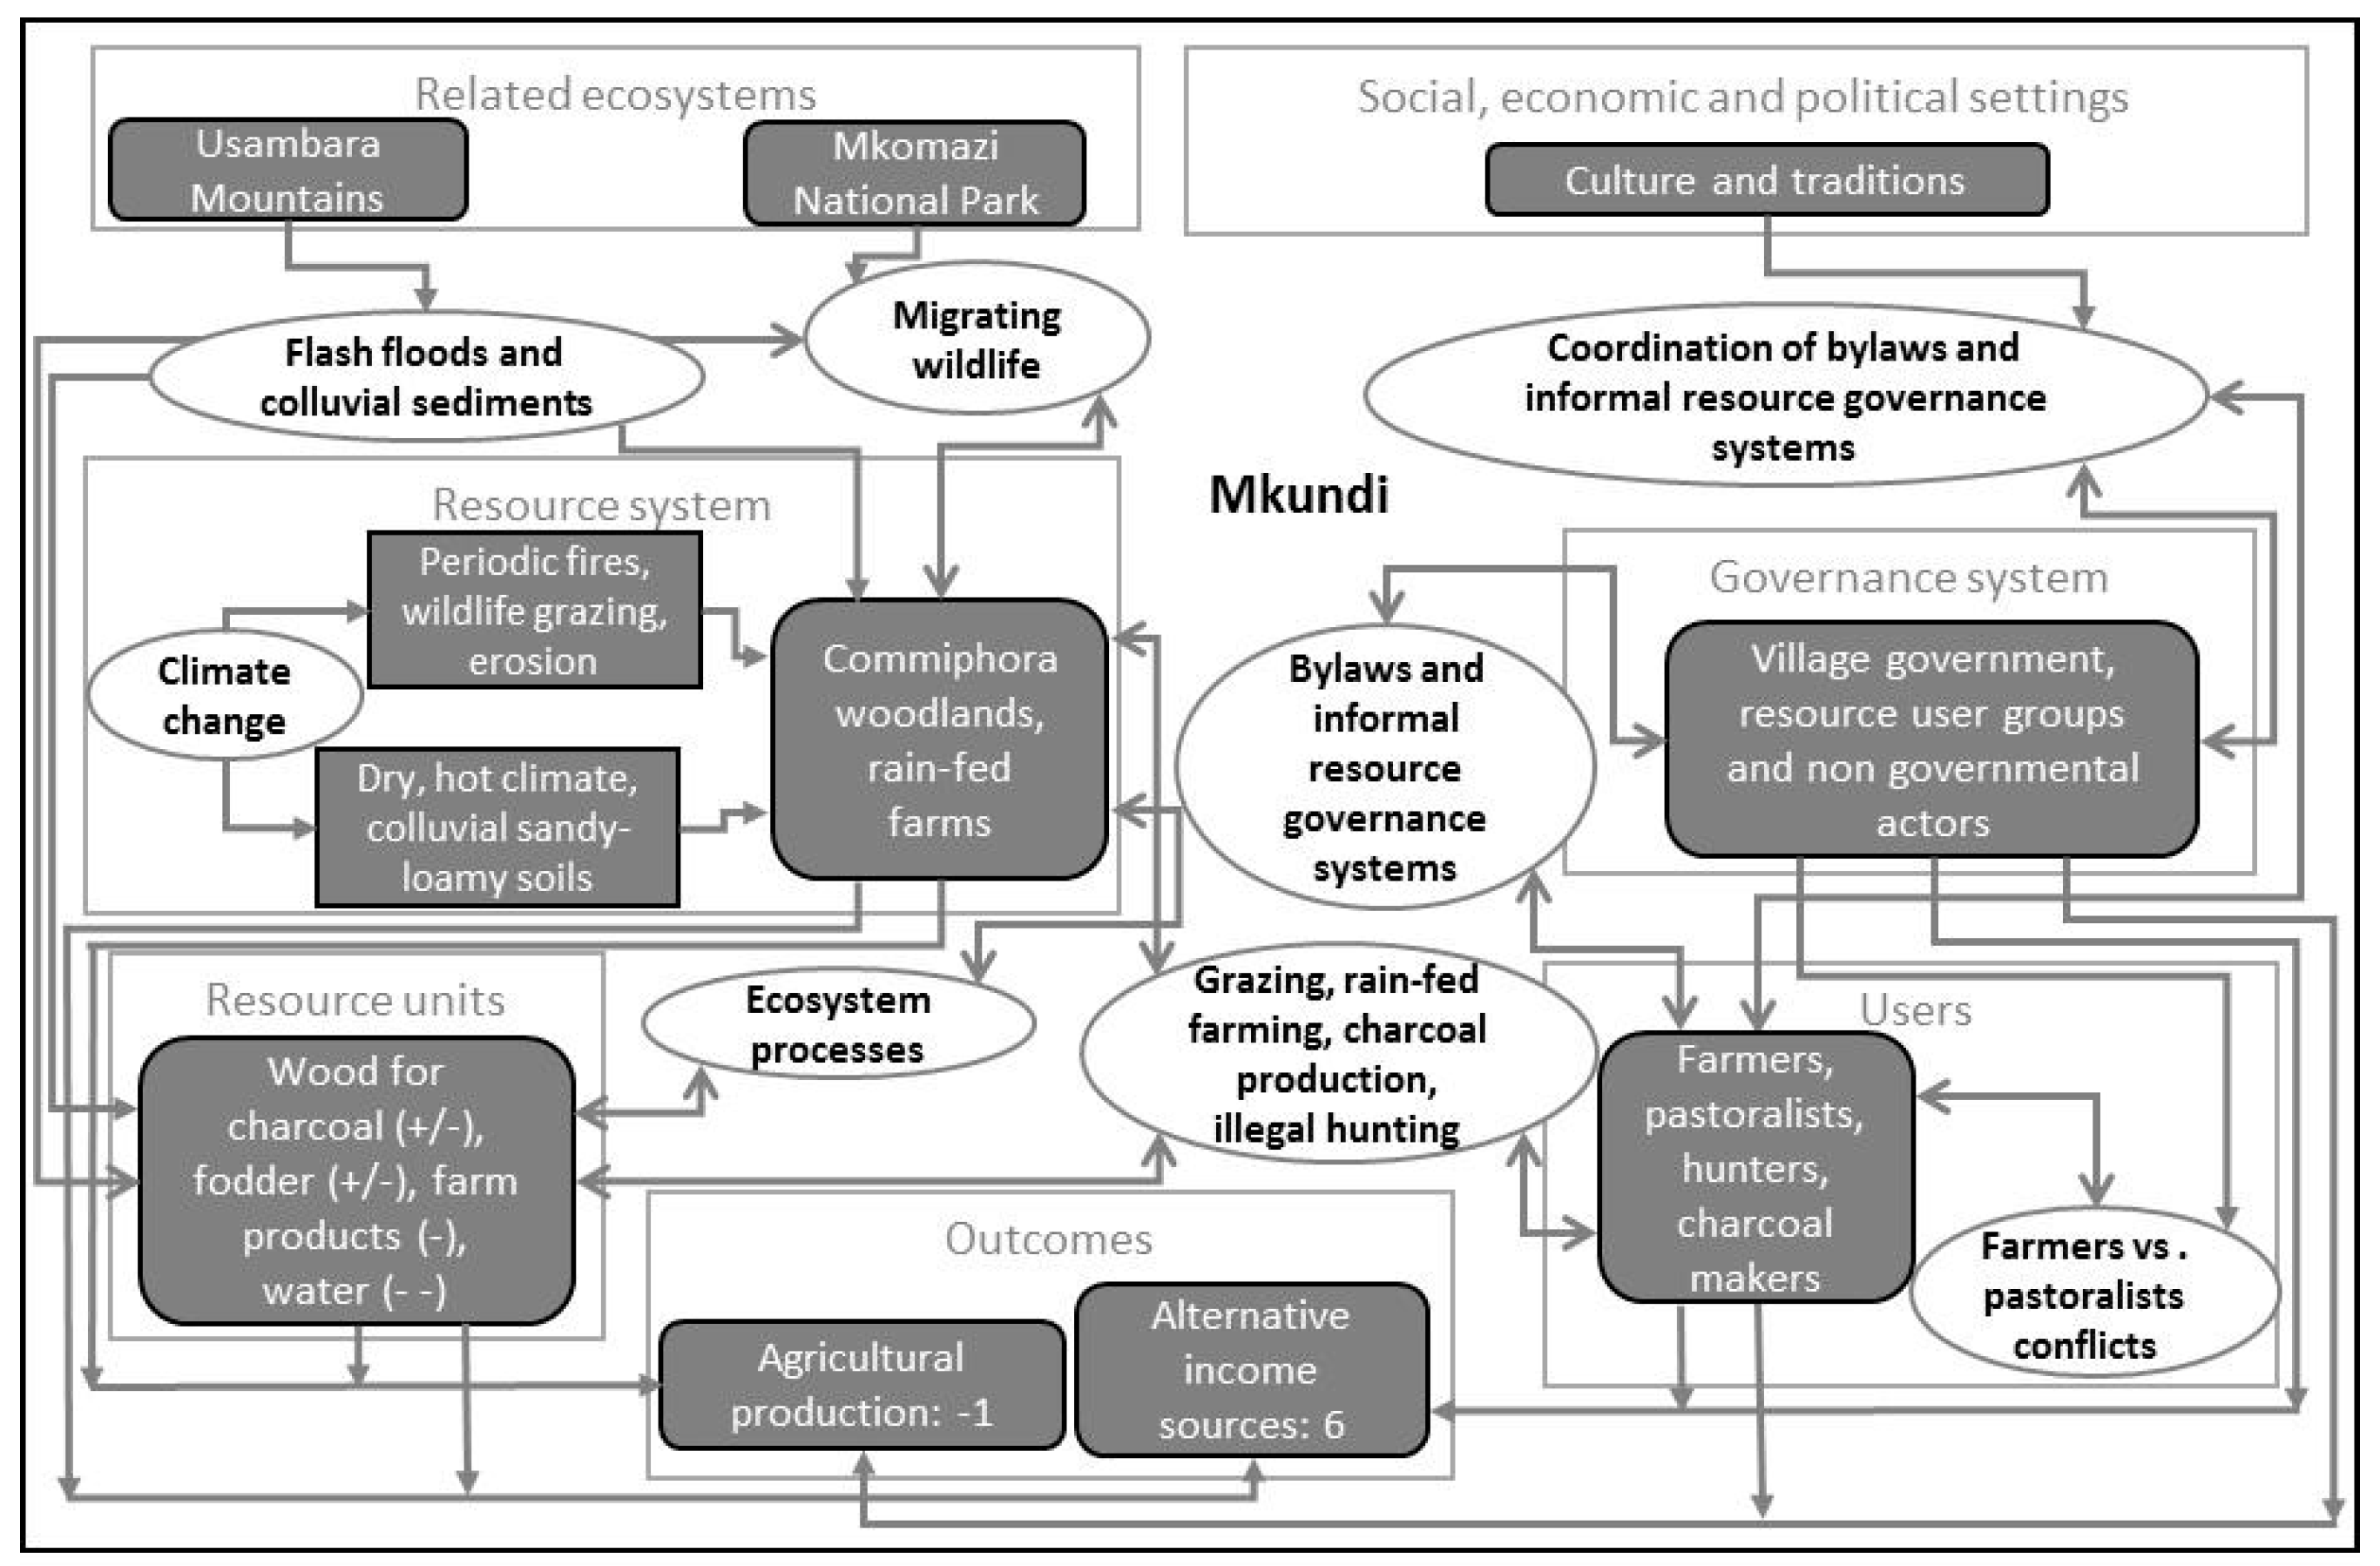
- Analyses of relevant social and ecological vulnerability determinants explain the differences in vulnerability measures and give decision makers useful information how to reduce vulnerability. The aim was to find the most relevant determinants for vulnerability in the local contexts. In the SES framework, these potential vulnerability determinants are to be found in the resource system (RS), resource units (RU), the governance system within the village (GS), the users of the resources in the village (U), the social, economic and political setting (S), the related ecosystems (ECO), and the interactions between these factors (Figure 1). Several of these factors proved difficult to quantify so that we focused on qualitative analyses of these determinants.
3. Mkomazi—Assessing and Understanding Village Vulnerability in Tanzania
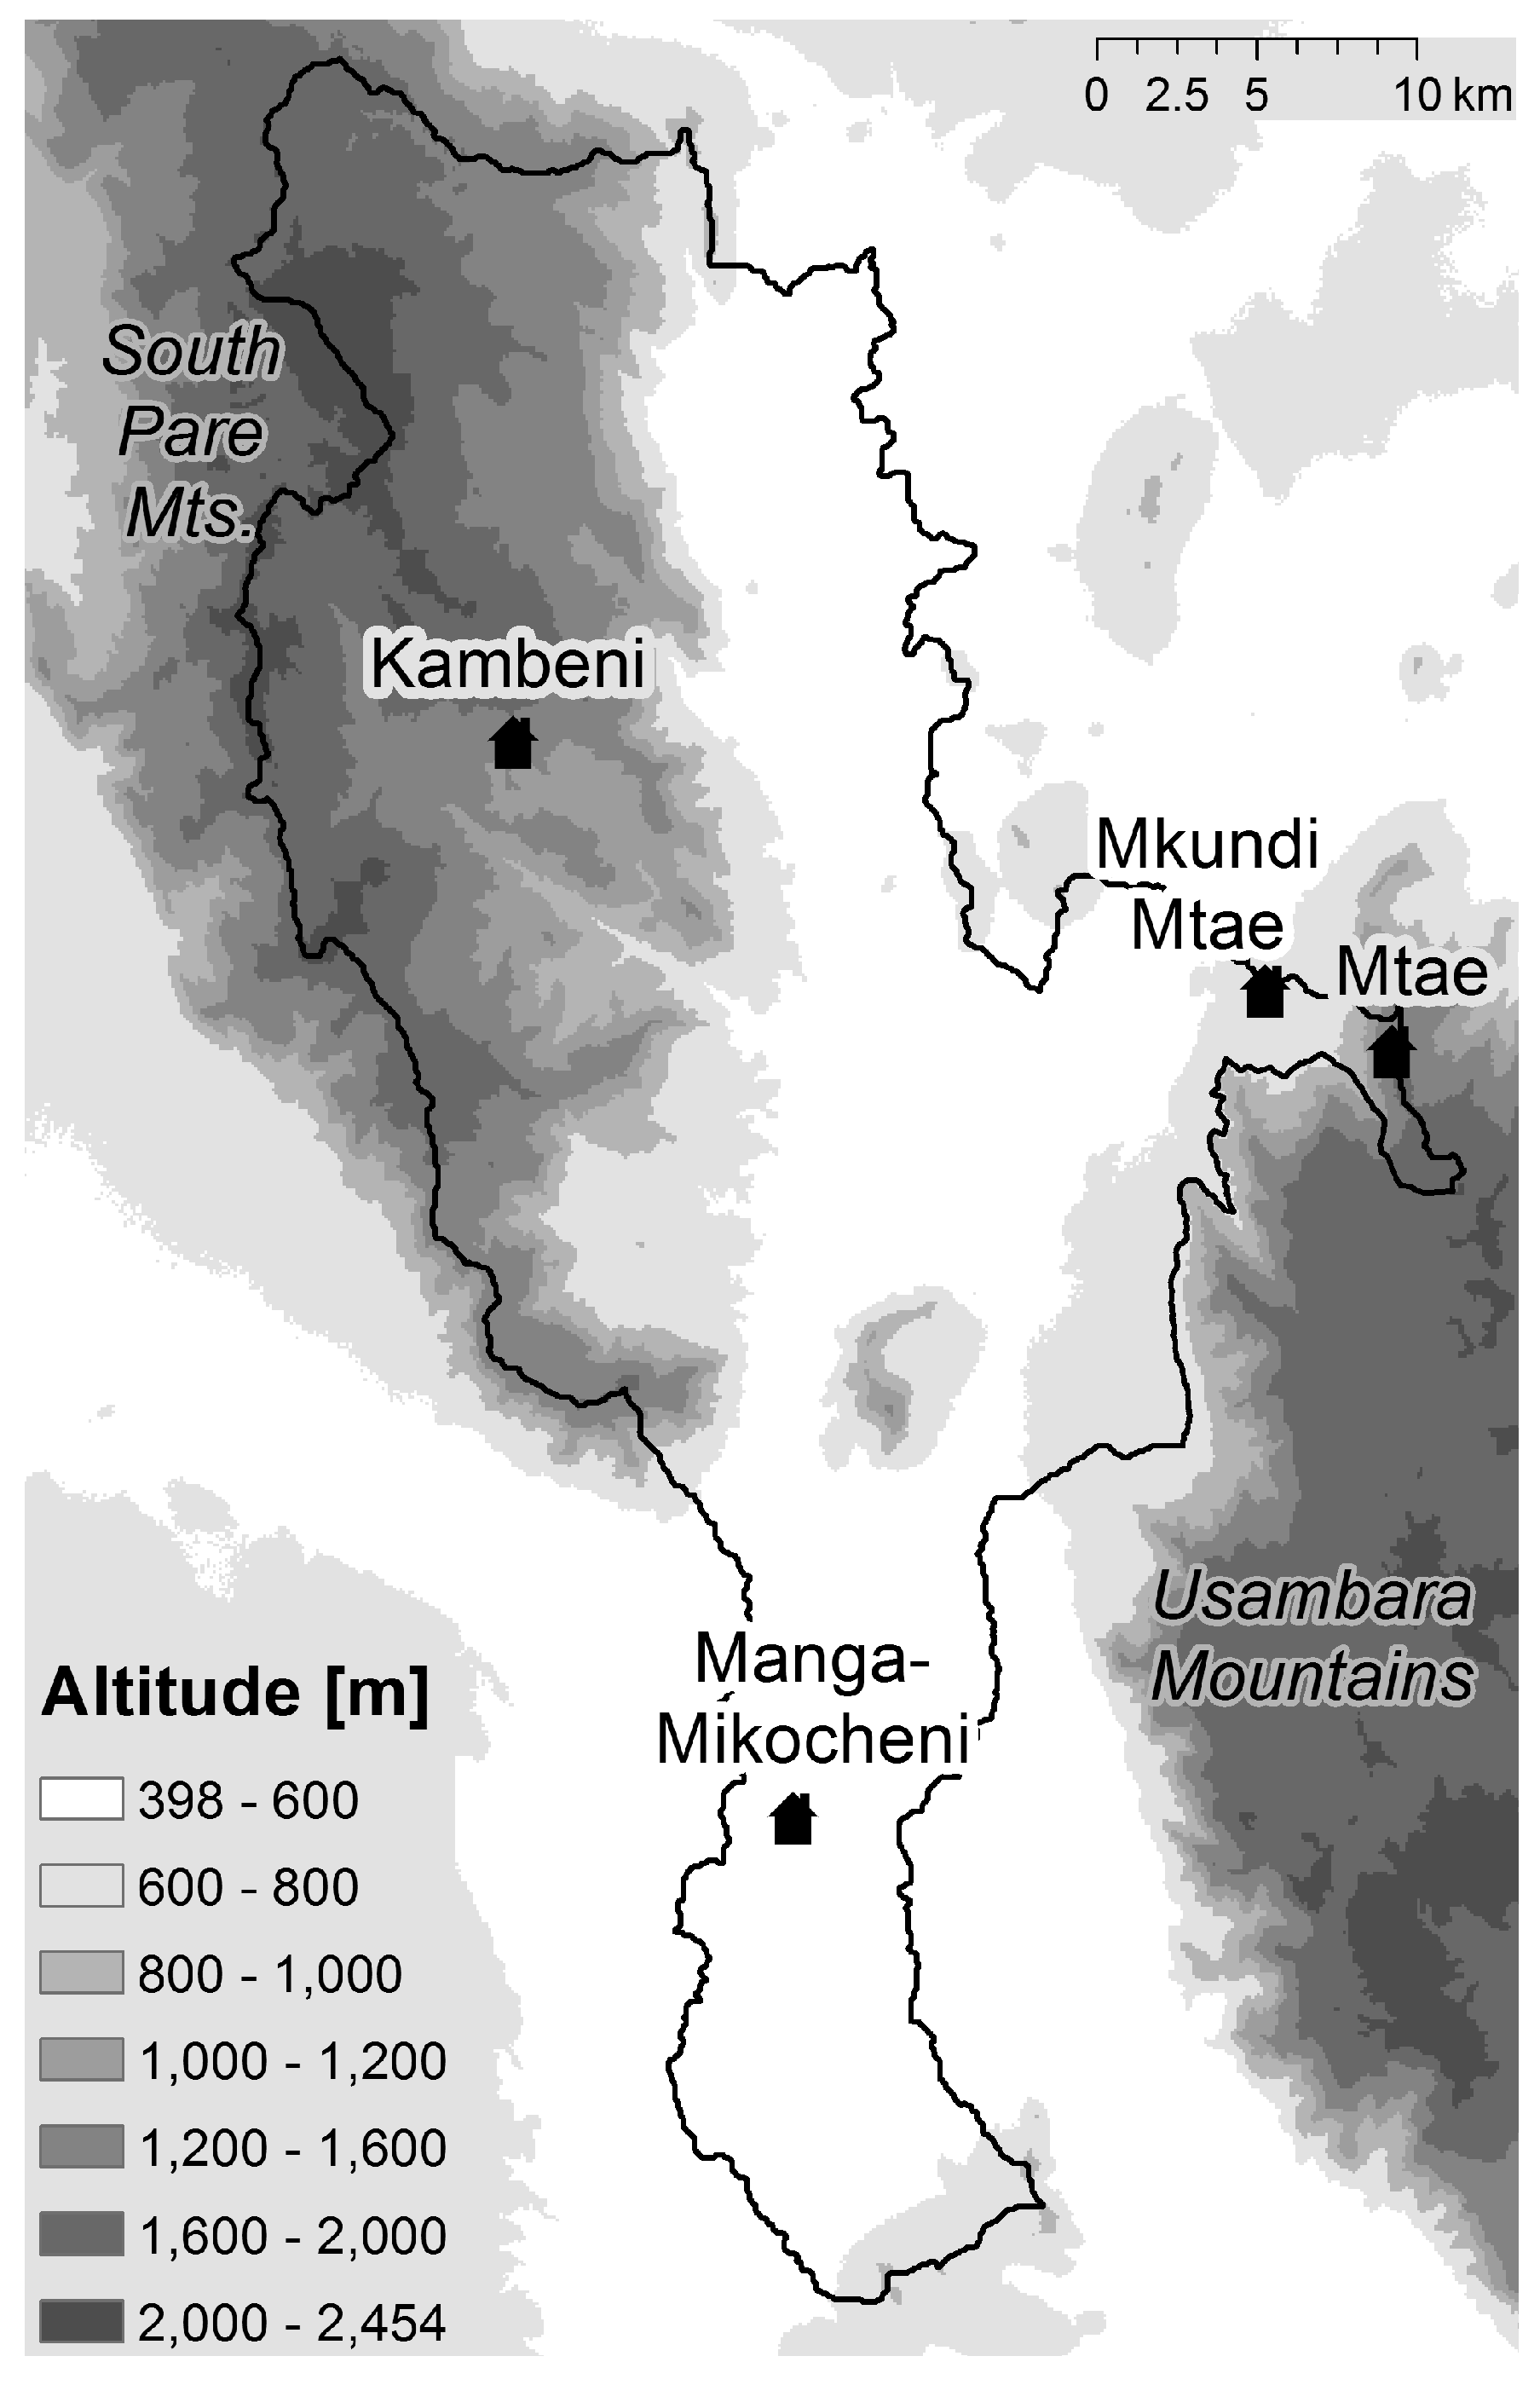
3.1. Research Area
3.2. Materials and Methods
3.2.1. Study Structure and Selection of Sample Villages
- -
- be covered by the ecological study [31];
- -
- differ in water accessibility in order to identify the impact of water accessibility on vulnerability;
- -
- differ in climatic conditions in order to identify the impacts of climatic conditions on agricultural production and how climatic differences relate to changes in the farming practices by the smallholder farmers;
- -
- represent different ecological zones (e.g., highlands vs. lowlands); and
- -
- be accessible to make sure that data collection was possible.
3.2.2. Assessment of Vulnerability
3.2.3. Identification of Vulnerability Determinants
3.3. Results
3.3.1. Levels of Vulnerability
3.3.2. Vulnerability Determinants
4. Keiskamma—Assessing and Understanding Village Vulnerability in South Africa
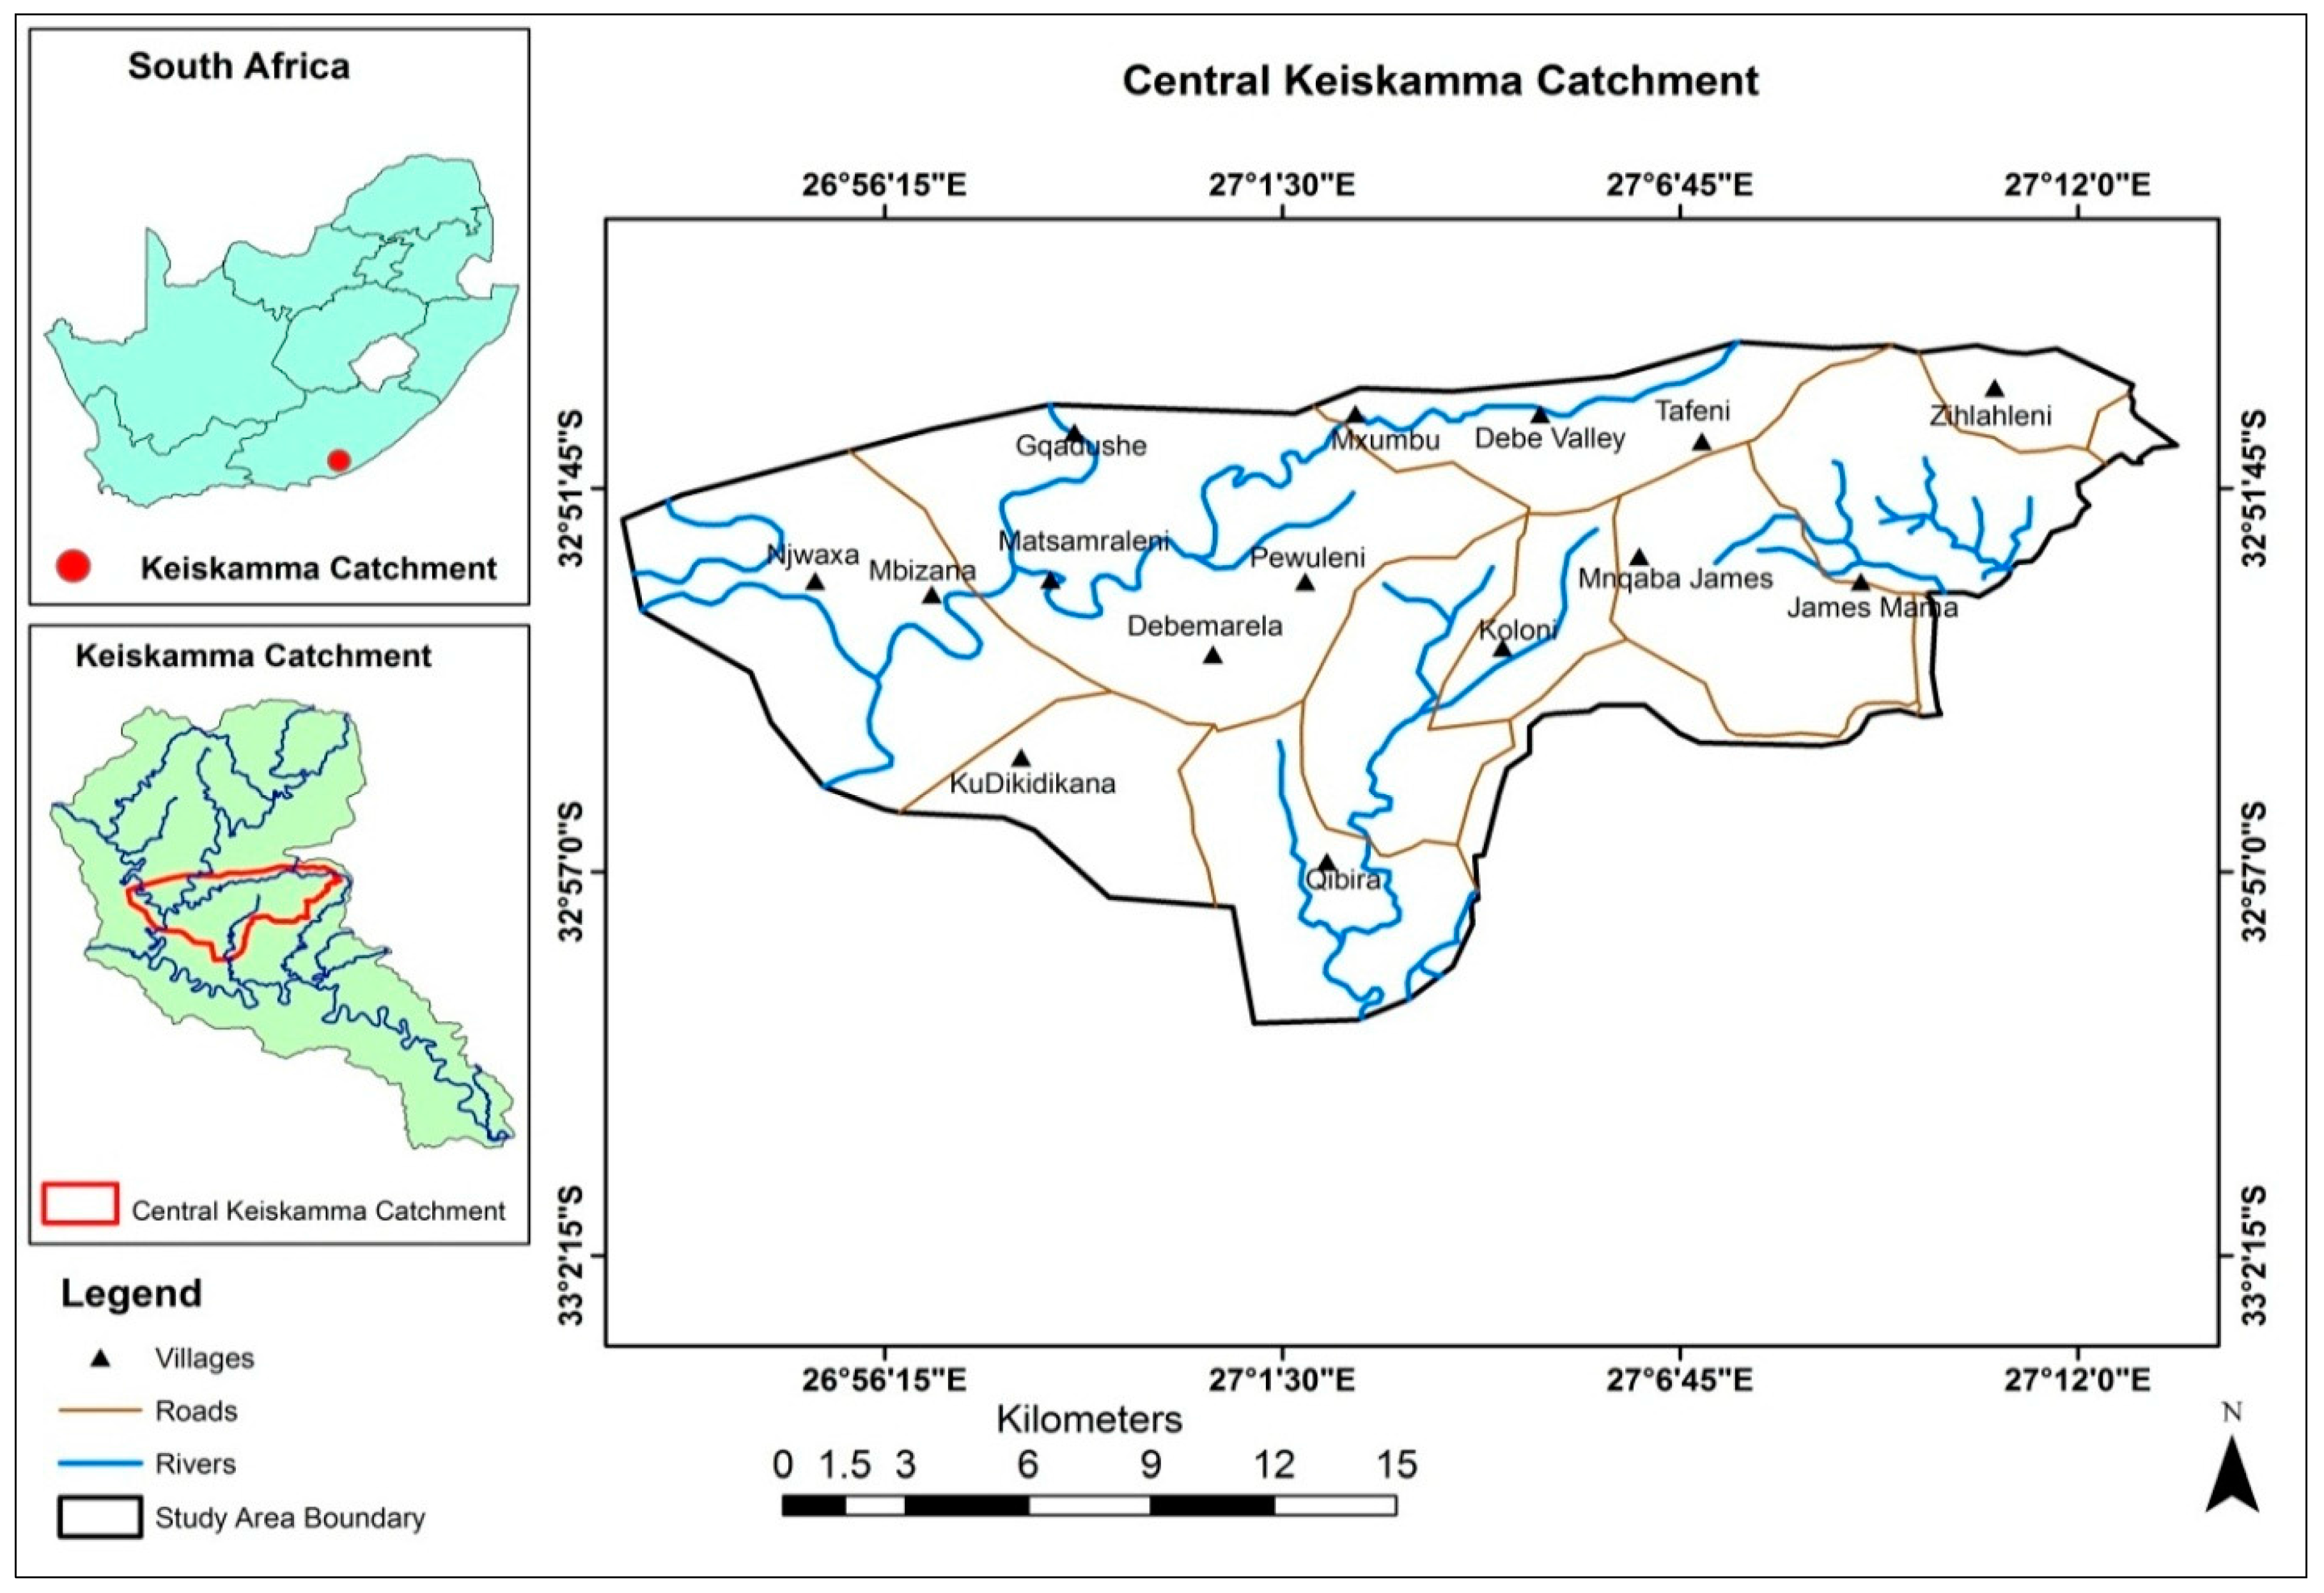
4.1. Research Area
4.2. Materials and Methods
4.2.1. Study Structure, Selection of Sample Villages and Data Collection
4.2.2. Assessment of Vulnerability
4.2.3. Identification of Vulnerability Determinants
4.3. Results
4.3.1. Levels of Vulnerability
4.3.2. Vulnerability Determinants
5. Comparative Discussion
6. Conclusions
Acknowledgments
Author Contributions
Conflicts of Interest
Appendix A

| Input Data | Mkundi | Manga-Mikocheni | Mtae | Kambeni |
|---|---|---|---|---|
| Number of regularly cultivated crops *,† | 3 (maize, cassava, lablab) | 6 (maize, beans, tomatoes, rice, okra, green vegetables) | 8 (maize, beans, cassava, potatoes, cabbage, green vegetables, onions, tomatoes) | 9 (maize, beans, cassava, ginger, banana, tannia, onions, tomatoes, sugar cane) |
| Mean number of harvests per year † | 0.67 | 1.5 | 2.5 | 3 |
| Mean livestock number per household * | 1 | 5 | 2 | 3 |
| Number of times food aid was supplied during the last 5 years * | 5 | 2 | 0 | 0 |
| Input Data | Mkundi | Manga-Mikocheni | Mtae | Kambeni |
|---|---|---|---|---|
| Number of AIS *,† | 3 (Charcoal, selling labour, hunting) | 4 (Selling labour, fishing, remittance, hunting) | 4 (Tourism, small business, remittance, timber and firewood) | 3 (Small business, remittance, timber and firewood) |
| Contribution of AIS to village income [%] * | 40 | 30 | 35 | 35 |


Appendix B. Research Instruments for the Socio-Economic Study
Appendix B.1. Research Instrument 1: Households/Farmers Questionnaire
- 1.
- Demographic and Socio-economic Characteristics of Respondents
| Village/District: | Ward: |
| Region: | Name (optional): |
- 1.1.
- Do you own the following? (Tick the appropriate answer)
- □ Yes
- □ No
- □ Yes
- □ No
- 2.
- Respondent’s agricultural activities details
- 2.1.
- Land holding details (Please fill in the boxes indicating the amount of land in acres)
Land Area Owned Cultivated Area in Past 20 Years Grazing Land Cultivated Land This Year Land under Irrigation Cultivated Leased Land - 2.2.
- Land use intensity details (please fill in the boxes the amount of land in acres)
Area Cropped Once in a Year Area Cropped Twice in a Year Area Cropped Three Times in a Year - 2.3.
- Crops intensity details (Please list the types of crops in the boxes)
Crops Cultivated Once in a Year Crops Cultivated Twice in a Year Crops Cultivated Three Times in a Year - 2.4.
- Can you please categorize the amount of production of your farm per acre per year per crop for the good and bad years?
Crop Amount of Land Cultivated Production per Year (Bugs) Good year Good year - 2.5.
- Do you mainly produce for cash or subsistence?□ Subsistence □ Cash
- 2.6.
- If you produce various crops for both cash and for food, please list down the crops you produce for cash and those ones you produce for food.
Crop Name Subsistence or Food (tick) Cash (tick) - 3.
- Perception of changes in the climate variables
- 3.1.
- How do you perceive climate change and variability through? (Tick as appropriate)
Code Perceptions Tick A Change in amount of rainfall during main rain season B Increasing rainfall in amount during main rain season C Decreasing rainfall in amount during main rain seasons D Shift in the timing of the onset of rain in the main season E Rain starting later than normal F Rain starting earlier than normal G Short rains than normal H Long rains than normal I Planting date change applying to most crops J Temperature of the area decreasing K Temperature of the area increasing L Rainfall increasing M Rainfall decreasing N Rainfall fluctuating O Increase in recurrences of floods P Decrease in recurrence of floods Q Increase in intensity of floods R Increase in recurrence of droughts S Increase in intensity of droughts - 4.
- What has been the trend of rainfall for the past 20 years to date according to your memory? (Please tick as appropriate)
- □ Increasing
- □ Decreasing
- □ Fluctuating
- □ Constant
- □ unpredictable
- □ Don’t know
- 5.
- What has been the trend of temperature for the past 20 years to date according to your memory? (Please tick the appropriate answer)
- □ Increasing
- □ Decreasing
- □ Fluctuating
- □ Constant
- □ Don’t know
- 6.
- Information on existing adaptation strategies and motivating factors
- 6.1.
- Please tick in the appropriate box matching the factors that motivated you to change farming practices (listed in the first row) against the changes that you have made in response to changing climate (listed in the first column).
Adaptation Strategies Possible Factors Negative CC Effects Financial Capital Income Good Markets High Living Costs Others Influence Household Size Shift to higher yielding crop varieties Introduce new crop varieties Shift to shorter cycle crop varieties Stop cultivating some crop varieties Shift to crops that command good market prices Shift to drought resistant crop varieties Intensify irrigation Diversify household income sources - 6.2.
- In the third column, please provide more details including examples regarding the adaptation strategies you have been using
Code Adaptation Strategy Details on the Responses (e.g., the New Crop Varieties, Other Economic Activities Opted for etc.) A Shift to higher yielding crop varieties B Introduce new crop varieties C Shift to shorter cycle crop varieties D Stop cultivating some crop varieties E Shift to crops that command good market prices F Shift to drought resistant crop varieties G Intensify irrigation H Diversify household income sources - 7.
- Socio-economic implications of the impacts of the changes farmers have made in their farming practices as adaptation options
- 7.1.
- What are the socio-economic implications of the changes you have made (as your adaptation to the changes in the local climate that you have been experiencing) at your household as well as at the community level? Please fill in the two blank columns as appropriate.
Code Implications Details on the Implications Level (H = Household or C = Community) A Average annual income has increased B Average annual income has decreased C Awareness on climate change has risen D Water shortage for domestic and other uses E Human health threats have increased F Food insecurity threats have increased G Quality of life deteriorated H Migrations increased I Social cohesion threatened J Social conflicts over diminishing resources increased K Family conflicts increased - 7.2.
- What do you think you can do in the future to be able to adapt to the changes if they persist?
Code Future adaptation options Tick A Abandon agriculture at the expense of other economic activities B Abandon the current farms and move to wetter areas like river banks C Emigrate from your village to other areas with better conditions D Continue changing agricultural practices in line with the changes in the local climate E Ask for food aid F Ask for government support like introduction of new and modern adaptation options G Seek to obtain more information, knowledge and education on adaptation to climate change H Promote irrigation using underground water I Promote conservation practices further - 8.
- Policy and strategic interventions for long term resilience
- 8.1.
- What do you propose to be done by policy makers and other relevant stakeholders to help you to adapt to the changes in the long term? (Please tick as appropriate)
Code Intervention Yes A Enhance your capacity through education and training B Improve institutional capacity and efficiency C Improve access to credits D Enhance awareness and information provision E More research and dissemination of research results to farmers F Respect and disseminate local experience and knowledge G Develop and introduce new crop varieties to increase the tolerance and suitability of plants to temperature, moisture and other relevant climatic conditions H Introduce crop insurance I Support to adopt improved crop varieties, modern irrigation and agricultural related better technologies J Provide the needed infrastructure in the rural areas, post-harvest support and support for agro industries K Develop and/or strengthen early warning systems that provide daily weather predictions and seasonal forecasts L Strengthen timely dissemination of weather forecasting information to farmers M Encourage participation of private sector in agriculture investment; N Undertake research to quantify the magnitude of climate change for each agro-ecological zone and advise accordingly O Develop and strengthen water management innovations to address the risk of moisture deficiencies and increasing frequency of droughts P Introduce and/or improve subsidy and incentives provisions to support farmers to adapt Q Develop and implement policies and programs to influence farm-level land and water resource use and management practices R Support diversification of agriculture as an economic activity
Appendix B.2. Research Instrument 2: Governance Interview Guide
| Interview Questions | |||
| Information Required | General Question | Possible Guiding Questions | Interviewees |
| The long term trend of changes in the key elements of climate (rainfall and temperature) at the local level with a minimum of the past 20 years | Are there any past, present and future changes in the local climate and how are they perceived and explained by the local communities? | Are there any changes in the state of the climate e.g., rainfall, temperature for the past 20–30 years? | PBWB, DALDOs-WAEO, VCPs, Ward Councillors and Village Elders |
| Why do you perceive the changes? | PBWB, DALDOs-WAEO, VCPs, Ward Councillors and Village Elders | ||
| What are the reasons for the changes? | PBWB, DALDOs-WAEO, VCPs, Ward Councillors and Village Elders | ||
| Changes in the farming practices as a result of climate change and variability and sustainability of such changes | Are there any changes in farming practices that have been or are being made in the area within past 20–30 years ago? Are these changes sustainable? | Have there been changes in the farming practices as an adaptation response to climate change and variability? | PBWB, DALDOs, WAEO, VCPs, Councillors, Village Elders |
| Motivating factors for decision to change farming practices | What are the motivating factors for the local communities to make decisions in certain times to change from one farming/land use practice to another? | Does availability of good market price particular crops and crop varieties play a role in the changes? | PBWB, WAEO, DALDOs, VCPs, Councillors, Village Elders |
| How does the available infrastructures and communication system motivate changes farming? | PBWB, WAEO, DALDOs, VCPs, Councillors, Village Elders | ||
| Did perceived changes in the local climate motivate changes in the farming practices? | PBWB, WAEO, DALDOs, VCPs, Councillors, Village Elders | ||
| Does the availability of extension and other services motivate changes in the farming practices in the area? | WAEO, VCPs, Councillors, Village Elders | ||
| Could the availability and access to agricultural and weather information services have played a role in the changes in the farming practices? | WAEO, VCPs, Councillors, Village Elders | ||
| Any other possible factors which motivated changes in the farming practices in the area? | WAEO, VCPs, Councillors, Village Elders | ||
| The socio economic implications of the changes to the household and community | What are the socio-economic implications of the changes at community level in the study area? | What socio-economic changes do you experience at the household as well as community level as a result of changes in the local climate? | PBWB, DACO, WAEO, VCPs, Councillors, Village Elders |
| Policy and strategic interventions appropriate to support smallholder farmers in the area to adapt and enhance resilience to climate change | What are the appropriate policy and strategic interventions that can support smallholder farmers to adapt to the changes they perceive and why? | What can you propose as appropriate interventions to help you to adapt sustainably and enhance your resilience to climate change and variability? | PBWB, DALDOs, WAEO, VCPs, Councillors, Village Elders |
Appendix B.3. Research Instrument 3: Focus Group Discussions with Smallholder Farmers
- (a)
- The state of the local climate in the past 30 years to-date
- (b)
- Any changes so far (good/bad ones)
- (c)
- Why those changes (if any)?
- (d)
- The state of the climate to change further in the future? Good or bad?
- (a)
- What are these changes (specifically) e.g., type and characteristics of crops, soil management techniques, water harvesting and storage etc.
- (b)
- Timing of the changes
- (c)
- Alternative income sources and whether they are sustainable
- (a)
- Climatic conditions
- (b)
- Economic factors
- (c)
- Policy changes
- (d)
- Any other
- Incomes
- Water availability
- Food production and security
- Social conflicts
- Health status
- Household conflicts etc.
References
- McCarthy, J.J.; Canziani, O.F.; Leary, N.A.; Dokken, D.J.; White, K.S. Climate Change 2001: Impacts, Adaptation, and Vulnerability: Contribution of Working Group II to the Third Assessment Report of the Intergovernmental Panel on Climate Change; Cambridge University Press: Cambridge, UK, 2001. [Google Scholar]
- Adger, W.N. Vulnerability. Glob. Environ. Chang. 2006, 16, 268–281. [Google Scholar] [CrossRef]
- Smit, B.; Wandel, J. Adaptation, adaptive capacity, and vulnerability. Glob. Environ. Chang. 2006, 16, 282–292. [Google Scholar] [CrossRef]
- O’Brien, K.; Eriksen, S.; Nygaard, L.P.; Schjolden, A. Why different interpretations of vulnerability matter in climate change discourses. Clim. Policy 2007, 7, 73–88. [Google Scholar] [CrossRef]
- Hinkel, J. Indicators of vulnerability and adaptive capacity: Towards a clarification of the science–policy interface. Glob. Environ. Chang. 2011, 21, 198–208. [Google Scholar] [CrossRef]
- Reed, M.S.; Podesta, G.; Fazey, I.; Geeson, N.; Hessel, R.; Hubacek, K.; Letson, D.; Nainggolan, D.; Prell, C.; Rickenbach, M.G. Combining analytical frameworks to assess livelihood vulnerability to climate change and analyse adaptation options. Ecol. Econ. 2013, 94, 66–77. [Google Scholar] [CrossRef] [PubMed]
- Varadan, R.J.; Kumar, P. Mapping agricultural vulnerability of Tamil Nadu, India to climate change: A dynamic approach to take forward the vulnerability assessment methodology. Clim. Chang. 2015, 129, 159–181. [Google Scholar] [CrossRef]
- Füssel, H.M.; Klein, R.T. Climate Change Vulnerability Assessments: An Evolution of Conceptual Thinking. Clim. Chang. 2006, 75, 301–329. [Google Scholar] [CrossRef]
- Thornton, P.K.; Ericksen, P.J.; Herrero, M.; Challinor, A.J. Climate variability and vulnerability to climate change: A review. Glob. Chang. Biol. 2014, 20, 3313–3328. [Google Scholar] [CrossRef] [PubMed]
- Jones, R.N.; Patwardhan, A.; Cohen, S.J.; Dessai, S.; Lammel, A.; Lempert, R.J.; Mirza, M.M.Q.; von Storch, H. Foundations for decision making. In Climate Change 2014: Impacts, Adaptation, and Vulnerability. Part A: Global and Sectoral Aspects. Contribution of Working Group II to the Fifth Assessment Report of the Intergovernmental Panel on Climate Change; Field, C.B., Barros, V.R., Dokken, D.J., Mach, K.J., Mastrandrea, M.D., Bilir, T.E., Chatterjee, M., Ebi, K.L., Estrada, Y.O., Genova, R.C., et al., Eds.; Cambridge University Press: Cambridge, UK, 2014; pp. 195–228. [Google Scholar]
- Grothmann, T.; Grecksch, K.; Winges, M.; Siebenhüner, B. Assessing institutional capacities to adapt to climate change—Integrating psychological dimensions in the Adaptive Capacity Wheel. Nat. Hazards Earth Syst. Sci. 2013, 13, 3369–3384. [Google Scholar] [CrossRef]
- Niang, I.; Ruppel, O.C.; Abdrabo, M.A.; Essel, A.; Lennard, C.; Padgham, J.; Urquhart, P. Africa. In Climate Change 2014: Impacts, Adaptation, and Vulnerability. Part B: Regional Aspects. Contribution of Working Group II to the Fifth Assessment Report of the Intergovernmental Panel on Climate Change; Field, C.B., Barros, V.R., Dokken, D.J., Mastrandrea, M.D., Mach, K.J., Bilir, T.E., Chatterjee, M., Ebi, K.L., Estrada, Y.O., Genova, R.C., et al., Eds.; Cambridge University Press: Cambridge, UK, 2014; pp. 1199–1265. [Google Scholar]
- Challinor, A.; Wheeler, T.; Garforth, C.; Craufurd, P.; Kassam, A. Assessing the vulnerability of food crop systems in Africa to climate change. Clim. Chang. 2007, 83, 381–399. [Google Scholar] [CrossRef]
- Ford, J.D. Vulnerability of Inuit food systems to food insecurity as a consequence of climate change: A case study from Igloolik, Nunavut. Reg. Environ. Chang. 2009, 9, 83–100. [Google Scholar] [CrossRef]
- Gabrielsson, S.; Brogaard, S.; Jerneck, A. Living without buffers: Illustrating climate vulnerability in the Lake Victoria basin. Sustain. Sci. 2013, 8, 143–157. [Google Scholar] [CrossRef]
- Shah, K.U.; Dulal, H.B.; Johnson, C.; Baptiste, A. Understanding livelihood vulnerability to climate change: Applying the livelihood vulnerability index in Trinidad and Tobago. Geoforum 2013, 47, 125–137. [Google Scholar] [CrossRef]
- Porter, J.R.; Xie, L.; Challinor, A.J.; Cochrane, K.; Howden, S.M.; Iqbal, M.M.; Travasso, M.I. Food security and food production systems. In Climate Change 2014: Impacts, Adaptation, and Vulnerability. Part A: Global and Sectoral Aspects. Contribution of Working Group II to the Fifth Assessment Report of the Intergovernmental Panel on Climate Change; Field, C.B., Barros, V.R., Dokken, D.J., Mach, K.J., Mastrandrea, M.D., Bilir, T.E., Chatterjee, M., Ebi, K.L., Estrada, Y.O., Genova, R.C., et al., Eds.; Cambridge University Press: Cambridge, UK, 2014; pp. 485–533. [Google Scholar]
- Olsson, L.; Opondo, M.; Tschakert, P.; Agrawal, A.; Eriksen, S.H.; Ma, S.; Perch, L.N.; Zakieldeen, S.A. Livelihoods and poverty. In Climate Change 2014: Impacts, Adaptation, and Vulnerability. Part A: Global and Sectoral Aspects. Contribution of Working Group II to the Fifth Assessment Report of the Intergovernmental Panel on Climate Change; Field, C.B., Barros, V.R., Dokken, D.J., Mach, K.J., Mastrandrea, M.D., Bilir, T.E., Chatterjee, M., Ebi, K.L., Estrada, Y.O., Genova, R.C., et al., Eds.; Cambridge University Press: Cambridge, UK, 2014; pp. 793–832. [Google Scholar]
- Sachs, J.D. The End of Poverty: Economic Possibilities for Our Time; Penguin: London, UK, 2010. [Google Scholar]
- Collier, P. The Bottom Billion: Why the Poorest Countries Are Failing and What Can Be Done about It; Oxford University Press: Oxford, UK, 2008. [Google Scholar]
- Eakin, H.C.; Wehbe, M.B. Linking local vulnerability to system sustainability in a resilience framework: Two cases from Latin America. Clim. Chang. 2009, 93, 355–377. [Google Scholar] [CrossRef]
- Paavola, J. Livelihoods, vulnerability and adaptation to climate change in Morogoro, Tanzania. Environ. Sci. Policy 2008, 11, 642–654. [Google Scholar] [CrossRef]
- Ribot, J. Vulnerability does not fall from the sky: Toward multiscale, pro-poor climate policy. In Social Dimensions of Climate Change: Equity and Vulnerability in a Warming World; Mearns, R., Norton, A., Eds.; The International Bank for Reconstruction and Development/The World Bank: Washington, DC, USA, 2010; pp. 47–74. [Google Scholar]
- Turner, B.L.; Kasperson, R.E.; Matson, P.; McCarthy, J.J.; Corell, R.W.; Christensen, L.; Eckley, N.; Kasperson, J.X.; Luers, A.; Martello, M.L.; et al. A framework for vulnerability analysis in sustainability science. Proc. Natl. Acad. Sci. USA 2003, 100, 8074–8079. [Google Scholar] [CrossRef] [PubMed]
- Luers, A.L. The surface of vulnerability: An analytical framework for examining environmental change. Glob. Environ. Chang. 2005, 15, 214–223. [Google Scholar] [CrossRef]
- Gallopin, G.C. Human dimensions of global change: Linking the global and the local processes. Int. Soc. Sci. J. 1991, 43, 707–718. [Google Scholar]
- Ostrom, E. A general framework for analyzing sustainability of social-ecological systems. Science 2009, 325, 419–422. [Google Scholar] [CrossRef] [PubMed]
- Eakin, H.; Luers, A.L. Assessing the vulnerability of social-environmental systems. Annu. Rev. Environ. Resour. 2006, 31, 365–394. [Google Scholar] [CrossRef]
- Binder, C.R.; Hinkel, J.; Bots, P.W.G.; Pahl-Wostl, C. Comparison of frameworks for analyzing social-ecological systems. Ecol. Soc. 2013, 18, 26. [Google Scholar] [CrossRef]
- JICA. Feasibility Study of the Mkomazi Valley Area Irrigation Development Project; Japan International Cooperation Agency (JICA): Tokyo, Japan, 1984. [Google Scholar]
- Petzold, M. Land Cover versus Functional Diversity Based Assessments of Ecosystem Properties in a Heterogeneous Landscape. Ph.D. Thesis, Carl von Ossietzky Universität Oldenburg, Oldenburg, Germany, 2017. [Google Scholar]
- Ndaki, P.M. Climate Change Adaptation for Smallholder Farmers in Rural Communities: The Case of Mkomazi Sub-Catchment, Tanzania. Ph.D. Thesis, Carl von Ossietzky Universität Oldenburg, Oldenburg, Germany, 2014. [Google Scholar]
- Notter, B. Water-Related Ecosystem Services and Options for Their Sustainable Use in the Pangani Basin, East Africa. Ph.D. Thesis, University of Bern, Bern, Switzerland, 2010. [Google Scholar]
- Tanzania 2012. National Sample Census of Agriculture—2007/2008 Smallholder Agriculture. Regional Report—Kilimanjaro Region (Volume Vc). Dar es Salaam and Zanzibar. Available online: http://www.nbs.go.tz/nbstz/index.php/english/statistics-by-subject/agriculture-statistics/269-the-regional-report-s-for-2007-2008-agriculture-sample-census (accessed on 24 March 2017).
- Gordon, L.J.; Enfors, E.I. Land Degradation, Ecosystem Services and Resilience of Smallholder Farmers in Makanya Catchment, Tanzania. In Conserving Land, Protecting Water; Bossio, D., Geheb, K., Eds.; Centre for Agricultural Bioscience International: Wallingford, UK, 2008; pp. 33–50. [Google Scholar]
- Christensen, L.R. Concepts and Measurement of Agricultural Productivity. Am. J. Agric. Econ. 1975, 57, 910–915. [Google Scholar] [CrossRef]
- Ball, V.E.; Bureau, J.; Nehring, R.; Somwaru, A. Agricultural Productivity Revisited. Am. J. Agric. Econ. 1997, 79, 1045–1063. [Google Scholar] [CrossRef]
- Dharmasiri, L.M. Measuring Agricultural Productivity Using the Average Productivity Index (API). Sri Lanka J. Adv. Soc. Stud. 2012, 1, 25–44. [Google Scholar] [CrossRef]
- Kakembo, V. Trends in Vegetation Degradation in Relation to Land Tenure, Rainfall, and Population Changes in Peddie District, Eastern Cape, South Africa. Environ. Manag. 2001, 28, 39–46. [Google Scholar] [CrossRef]
- Mhangara, P.; Kakembo, V.; Lim, K.J. Soil erosion risk assessment of the Keiskamma catchment, South Africa using GIS and remote sensing. Environ. Earth Sci. 2011, 65, 2087–2102. [Google Scholar] [CrossRef]
- Rowntree, K.M.; Dollar, E.S.J. Morphological Response to Altered Channel Flow: The Effect of Impoundment on the Keiskamma River. Proceedings of the IGU Commission on the Geomorphic Response to Environmental Change in Conjunction with SAAG; University of Natal: Pietermaritzburg, South Africa, 1994. [Google Scholar]
- Biggs, R.; Rhode, C.; Archibald, S.; Kunene, L.M.; Mutanga, S.S.; Nkuna, N.; Ocholla, P.O.; Phadima, L.J. Strategies for managing complex social-ecological systems in the face of uncertainty: Examples from South Africa and beyond. Ecol. Soc. 2015, 20, 52. [Google Scholar] [CrossRef]
- Bizikova, L.; Echeverría, D.; Hammill, A. Systematic Review Approach to Identifying Key Trends in Adaptation Governance at the Supranational Level; Working Paper No. 93; CGIAR Research Program on Climate Change, Agriculture and Food Security (CCAFS): Copenhagen, Denmark, 2014; Available online: https://cgspace.cgiar.org/bitstream/handle/10568/51831/CCAFS_WP93.pdf (accessed on 4 April 2017).
- Cox, M.; Arnold, G.; Villamayor Tomás, S. A review of design principles for community-based natural resource management. Ecol. Soc. 2010, 15, 38. [Google Scholar] [CrossRef]
- Baggio, J.; Barnett, A.; Perez-Ibarra, I.; Brady, U.; Ratajczyk, E.; Rollins, N.; Rubiños, C.; Shin, H.; Yu, D.; Aggarwal, R.; et al. Explaining Success and Failure in the Commons: The Configural Nature of Ostrom’s Institutional Design Principles. Int. J. Commons 2016, 10, 417–439. [Google Scholar] [CrossRef]
- Ostrom, E. Governing the Commons: The Evolution of Institutions for Collective Action; Cambridge University Press: Cambridge, UK, 1990. [Google Scholar]
- FAO. The State of Food Insecurity in the World: Addressing Food Insecurity in Protracted Crises; Food and Agricultural Organization of the United Nations (FAO): Rome, Italy, 2010. [Google Scholar]
- Adano, W.R.; Dietz, T.; Witsenburg, K.; Zaal, F. Climate change, violent conflict and local institutions in Kenya’s drylands. J. Peace Res. 2012, 49, 65–80. [Google Scholar] [CrossRef]
- Devitt, C.; Tol, R.S.J. Civil war, climate change, and development: A scenario study for sub-Saharan Africa. J. Peace Res. 2012, 49, 129–145. [Google Scholar] [CrossRef]
- O’Brien, K.; Leichenko, R.; Kelkar, U.; Venema, H.; Aandahl, G.; Tompkins, H.; Javed, A.; Bhadwal, S.; Barg, S.; Nygaard, L.; et al. Mapping vulnerability to multiple stressors: Climate change and globalization in India. Glob. Environ. Chang. 2004, 14, 303–313. [Google Scholar] [CrossRef]
- Isaac, M.; Erickson, B.; Quashie-Sam, S.; Timmer, V. Transfer of knowledge on agroforestry management practices: The structure of farmer advice networks. Ecol. Soc. 2007, 12, 32. [Google Scholar] [CrossRef]
- Ban, N.C.; Mills, M.; Tam, J.; Hicks, C.C.; Klain, S.; Stoeckl, N.; Bottrill, M.C.; Levine, J.; Pressey, R.L.; Satterfield, T.; et al. A social-ecological approach to conservation planning: Embedding social considerations. Front. Ecol. Environ. 2012, 11, 194–202. [Google Scholar] [CrossRef]
- Cabello, V.; Willaarts, B.; Aguilar, M.; del Moral, L. River basins as social-ecological systems: Linking levels of societal and ecosystem water metabolism in a semiarid watershed. Ecol. Soc. 2015, 20, 20. [Google Scholar] [CrossRef]
- Tobey, J.; Meena, H.; Lugenja, M.; Mahenge, J.; Mkama, W.; Robadue, D. Village Vulnerability Assessment and Adaptation Planning: Mlingotini and Kitonga, Bagamoyo District, Tanzania; Coastal Resources Center, University of Rhode Island: Narragansett, RI, USA, 2011. [Google Scholar]


| Village | Location | No. of Households | Inhabitants |
|---|---|---|---|
| Mkundi | Foothills of West Usambara Mountains | 348 | 1753 |
| Manga-Mikocheni | Southern part of the central Mkomazi valley near Lake Manga | 540 | 2694 |
| Mtae | North-western ridge of Usambara Mountains | 768 | 2552 |
| Kambeni | Central South Pare Mountains | 765 | 3827 |
| Indicator | Input Data | Valuation Points | ||||||
|---|---|---|---|---|---|---|---|---|
| −2 | −1 | 0 | 1 | 2 | 3 | 4 | ||
| Crop diversity | Number of regularly cultivated crops | - | - | 1 to 2 | 3 to 4 | 5 to 6 | >6 | - |
| Harvest frequency | Mean number of harvests per year | - | - | <1 | 1 to <2 | 2 to <3 | 3 and more | - |
| Livestock | Mean livestock number per household | - | - | <2 | 2 to 4 | 5 to 9 | 10 to 14 | 15 and more |
| Food aid | Number of times that food aid was received during the last 5 years | >1 | 1 | 0 | - | - | - | - |
| Indicator | Input Data | Valuation Points | |||||
|---|---|---|---|---|---|---|---|
| 0 | 1 | 2 | 3 | 4 | 5 | ||
| Diversity | Number of AIS | 0 | 1 | 2 to 3 | 4 to 5 | 6 to 7 | >7 |
| Contribution | Contribution of AIS to village income [%] | 0 to 5 | >5 to 10 | >10 to 20 | >20 to 35 | >35 to 50 | >50 |
| Indicator | Village | |||
|---|---|---|---|---|
| Mkundi | Manga-Mikocheni | Mtae | Kambeni | |
| Crop diversity | 1 | 2 | 3 | 3 |
| Harvest frequency | 0 | 1 | 2 | 3 |
| Livestock | 0 | 2 | 1 | 1 |
| Food aid | −2 | −2 | 0 | 0 |
| AP index | −1 | 3 | 6 | 7 |
| AIS diversity | 2 | 3 | 3 | 2 |
| AIS contribution | 4 | 3 | 3 | 3 |
| AIS index | 6 | 6 | 6 | 5 |
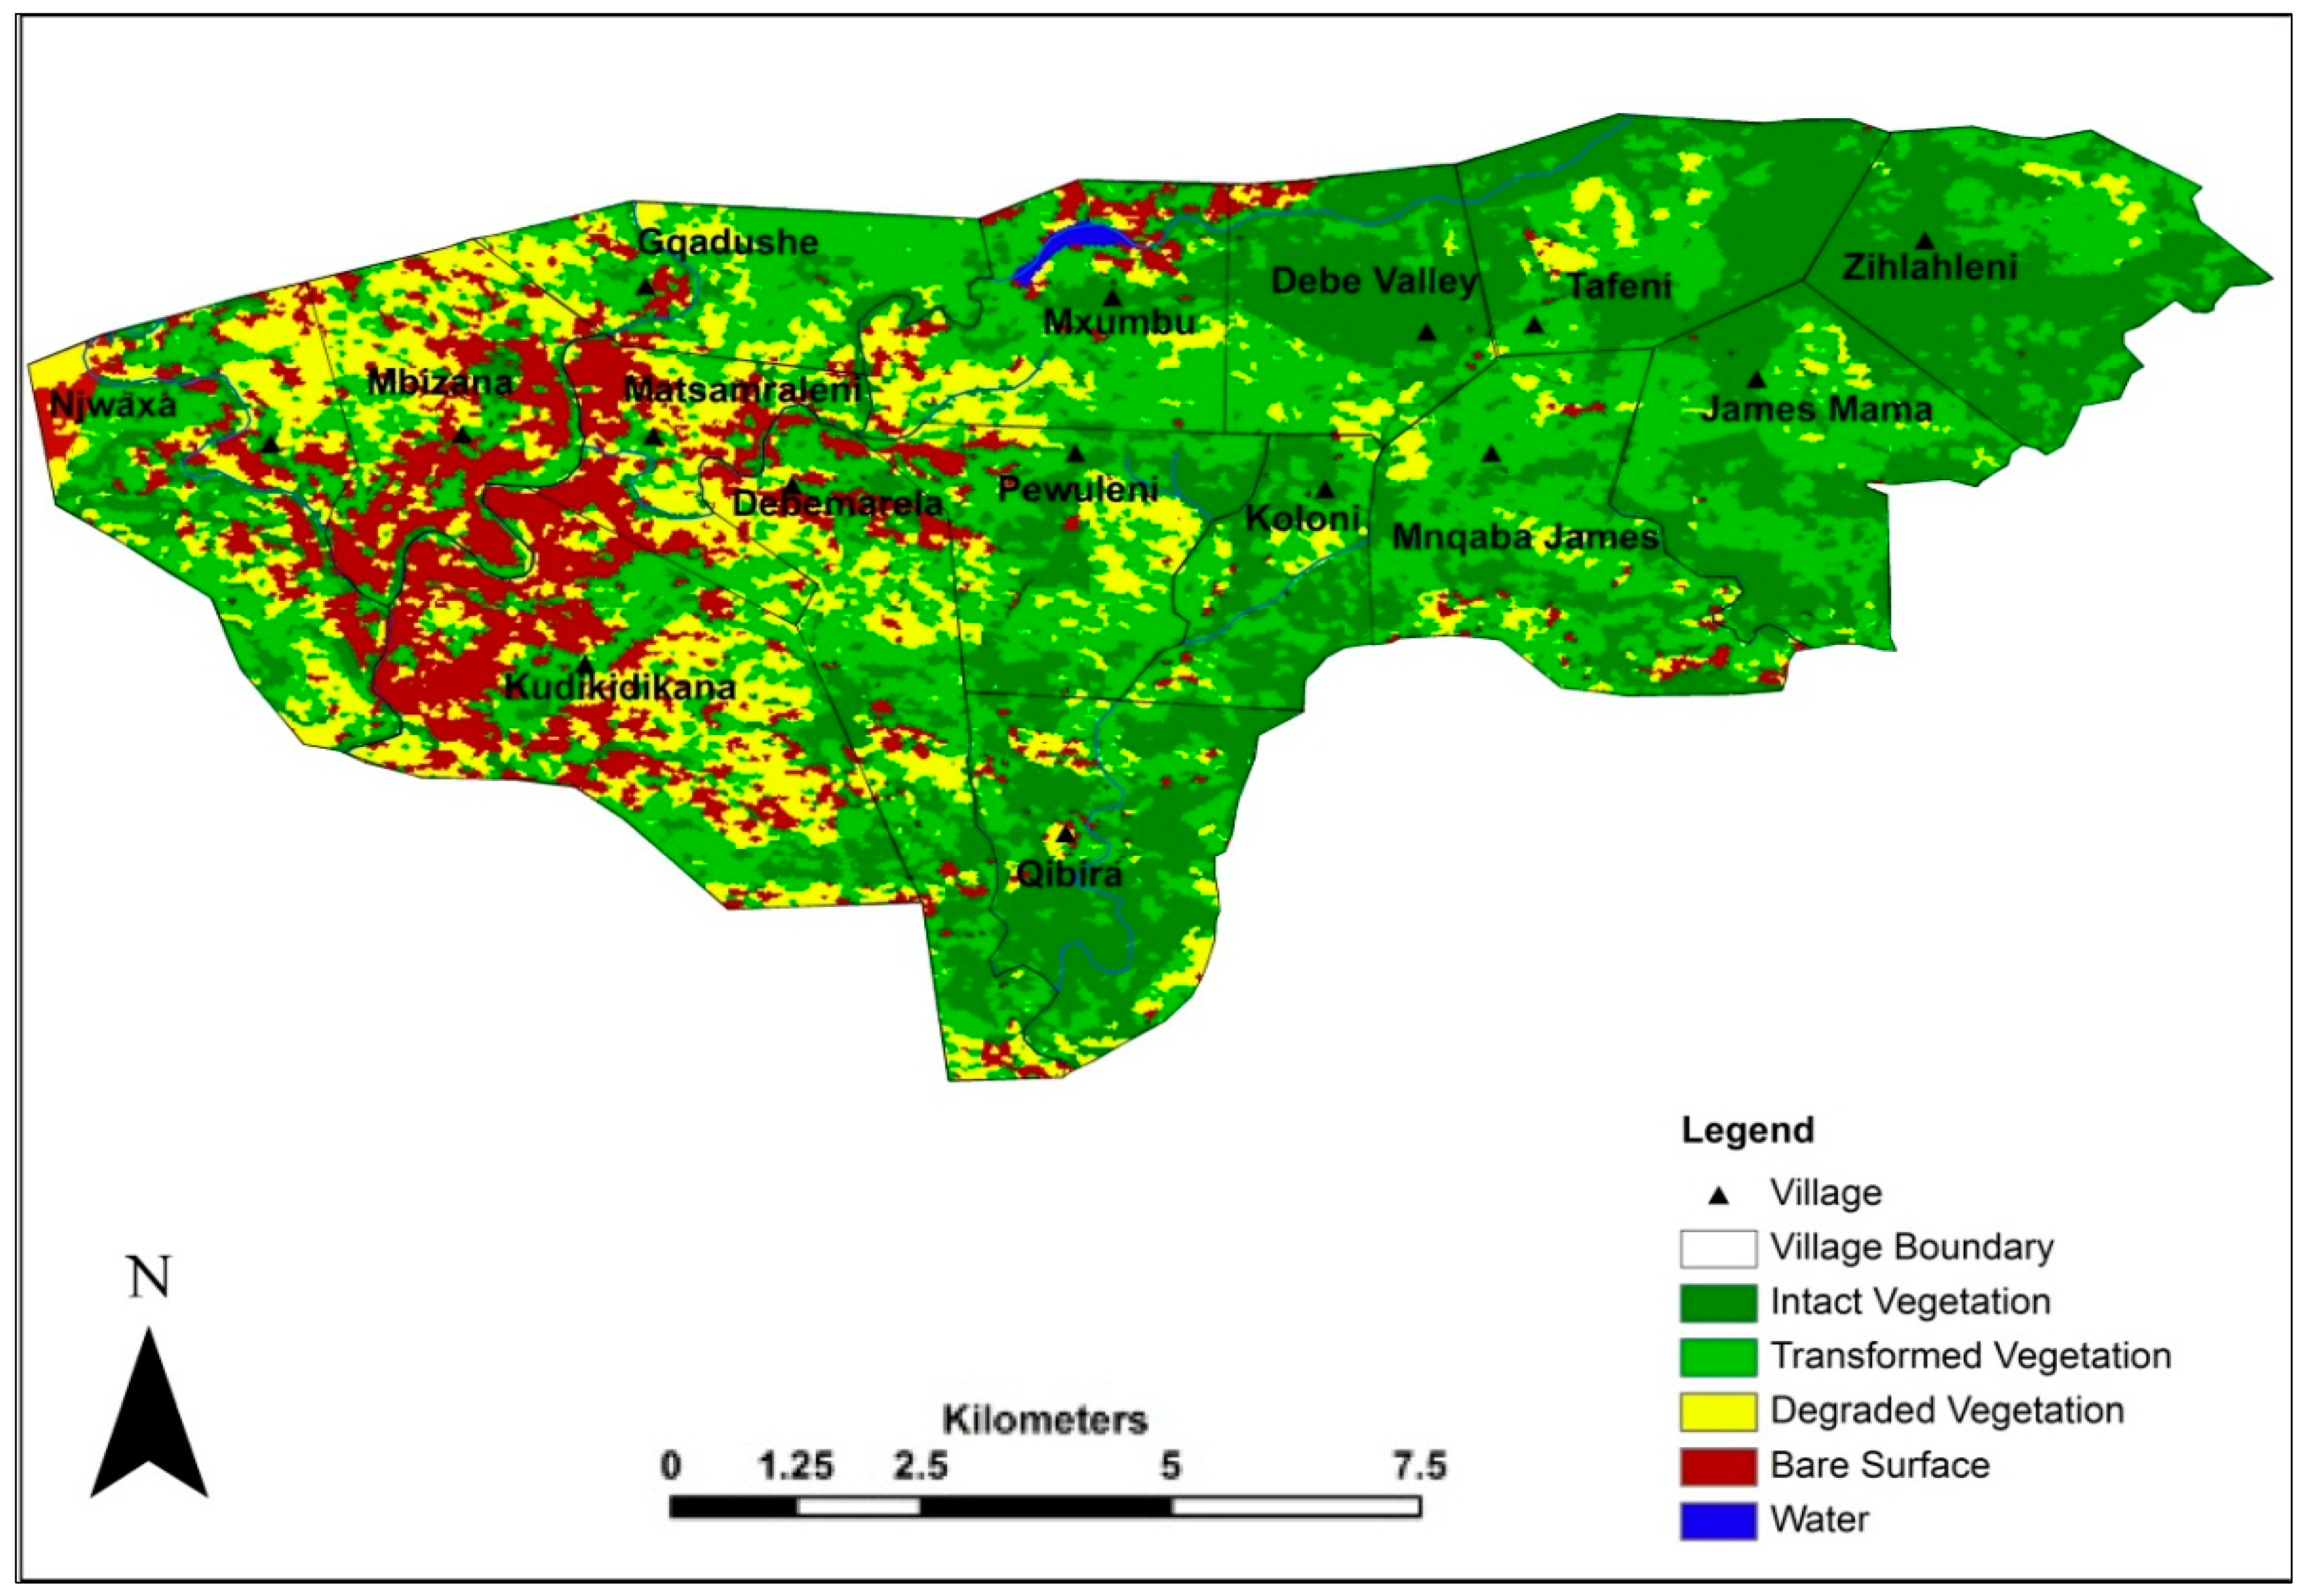
| Indicators | Villages * | |||||||||||||||
|---|---|---|---|---|---|---|---|---|---|---|---|---|---|---|---|---|
| JM | KL | TN | QR | DV | ZH | MB | NX | MX | MZ | KD | MN | GD | PW | DM | ||
| Ecological status | Original vegetation | 1 | 1 | 1 | 0 | 0 | 1 | 1 | 0 | 0 | 0 | 0 | 0 | 0 | 0 | 0 |
| Undegraded land | 1 | 1 | 1 | 0 | 0 | 1 | 0 | 0 | 0 | 0 | 0 | 0 | 0 | 0 | 0 | |
| Grazing governance practices | Effective fencing | 1 | 0 | 0 | 0 | 1 | 1 | 0 | 0 | 0 | 0 | 0 | 0 | 0 | 0 | 0 |
| Rotational grazing | 0 | 0 | 1 | 0 | 1 | 1 | 0 | 0 | 1 | 0 | 0 | 0 | 0 | 0 | 0 | |
| Farmer training | 1 | 1 | 1 | 1 | 1 | 1 | 1 | 0 | 1 | 0 | 0 | 0 | 1 | 1 | 0 | |
| Current agricultural activities | Crop cultivation | 1 | 1 | 1 | 1 | 1 | 1 | 1 | 0 | 0 | 0 | 0 | 0 | 0 | 0 | 0 |
| Livestock herding | 0 | 1 | 1 | 1 | 1 | 1 | 1 | 0 | 1 | 0 | 0 | 0 | 1 | 1 | 0 | |
| Livestock kraaling | 1 | 1 | 1 | 1 | 1 | 1 | 1 | 0 | 1 | 0 | 0 | 0 | 1 | 1 | 0 | |
| PAP index | 6 | 6 | 7 | 4 | 6 | 8 | 5 | 0 | 4 | 0 | 0 | 0 | 3 | 3 | 0 | |
| Villages with Functional Local Committees | Villages without Functional Local Committees |
|---|---|
| James Mama | Njwaxa |
| Koloni | Mxumbu |
| Tafeni | Mbizana |
| Qibira | Kudikidikana |
| Debe Valley | Matsamraleni |
| Zihlahleni | Gqadushe |
| Mnqaba James | Pewuleni |
| Debemarela |
© 2017 by the authors. Licensee MDPI, Basel, Switzerland. This article is an open access article distributed under the terms and conditions of the Creative Commons Attribution (CC BY) license (http://creativecommons.org/licenses/by/4.0/).
Share and Cite
Grothmann, T.; Petzold, M.; Ndaki, P.; Kakembo, V.; Siebenhüner, B.; Kleyer, M.; Yanda, P.; Ndou, N. Vulnerability Assessment in African Villages under Conditions of Land Use and Climate Change: Case Studies from Mkomazi and Keiskamma. Sustainability 2017, 9, 976. https://doi.org/10.3390/su9060976
Grothmann T, Petzold M, Ndaki P, Kakembo V, Siebenhüner B, Kleyer M, Yanda P, Ndou N. Vulnerability Assessment in African Villages under Conditions of Land Use and Climate Change: Case Studies from Mkomazi and Keiskamma. Sustainability. 2017; 9(6):976. https://doi.org/10.3390/su9060976
Chicago/Turabian StyleGrothmann, Torsten, Maximilian Petzold, Patrick Ndaki, Vincent Kakembo, Bernd Siebenhüner, Michael Kleyer, Pius Yanda, and Naledzani Ndou. 2017. "Vulnerability Assessment in African Villages under Conditions of Land Use and Climate Change: Case Studies from Mkomazi and Keiskamma" Sustainability 9, no. 6: 976. https://doi.org/10.3390/su9060976
APA StyleGrothmann, T., Petzold, M., Ndaki, P., Kakembo, V., Siebenhüner, B., Kleyer, M., Yanda, P., & Ndou, N. (2017). Vulnerability Assessment in African Villages under Conditions of Land Use and Climate Change: Case Studies from Mkomazi and Keiskamma. Sustainability, 9(6), 976. https://doi.org/10.3390/su9060976