Article

Addressing Large-Scale Energy Retrofit of a Building Stock via Representative Building Samples: Public and Private Perspectives

by
Fabrizio Ascione
1,
Nicola Bianco
1,
Claudio De Stasio
1,
Gerardo Maria Mauro
1,* and
Giuseppe Peter Vanoli
2
1
Department of Industrial Engineering, Università degli studi di Napoli Federico II, Piazzale Tecchio 80, 80125 Naples, Italy
2
Department of Medicine, Università degli studi del Molise, Via Cesare Gazzani 47, 86100 Campobasso, Italy
*
Author to whom correspondence should be addressed.
Sustainability 2017, 9(6), 940; https://doi.org/10.3390/su9060940
Submission received: 8 May 2017 / Revised: 26 May 2017 / Accepted: 28 May 2017 / Published: 2 June 2017

Abstract

:
Scientific literature about energy retrofit focuses on single buildings, but the investigation of whole building stocks is particularly worthy because it can yield substantial energy, environmental and economic benefits. Hence, how to address large-scale energy retrofit of existing building stocks? The paper handles this issue by employing a methodology that provides a robust energy analysis of building categories. This is denoted as SLABE, “Simulation-based Large-scale uncertainty/sensitivity Analysis of Building Energy performance”. It was presented by the same authors and is here enhanced to investigate a whole and heterogeneous building stock that includes various categories. Each category is represented via a Representative Building Sample (RBS), which is defined through Latin hypercube sampling and uncertainty analysis. Hence, optimal retrofit packages are found in function of building location, intended use and construction type. Two families of optimal solutions are achieved. The first one collects the most energy-efficient (and thus sustainable) solutions, among the ones that produce global cost savings, thereby addressing the public perspective. The second one collects cost-optimal solutions thereby addressing the private perspective. EnergyPlus is employed as a simulation tool and coupled with MATLAB® for data analysis and processing. The methodology is applied to a significant share of the Italian public administration building stock, which includes several building categories depending on location, use destination and construction type. The outcomes show huge potential energy and economic savings, and could support a deep energy renovation of the Italian building stock.

1. Introduction: Importance of Large-Scale Energy Retrofit of the Existing Building Stock

Several European guidelines—such as the Energy Performance of Buildings Directive (EPBD) [1], its recast version [2] and the Directive in matter of overall energy efficiency in the European Union (EU) [3]—state that a necessary lever to press, for achieving targets of low-carbon future and sustainable development, concerns the building sector and, mainly, the existing building stock. Indeed, in order to provide high-efficiency new buildings, it is enough to establish prescriptions concerning minimum energy performance. Conversely, incentives and public funding may be necessary to promote energy efficiency when not mandatory, and thus in case of energy retrofit (or refurbishment) of the existing building stock. It is clear that different stakeholders, with different aims and wills, can be identified, such as the state (i.e., the public administration) and the private citizens. The first entity represents the collectivity, and thus its scope is the overall sustainability of cities and societies as well as the achievement of targets set at international assemblies and conferences (e.g., the COP21, hosted in Paris in December 2015 [4]), such as the minimization of energy waste, the reduction of energy-related pollutions and global warming. On the other hand, even if it could seem cynical, the private (i.e., the common person) pursues the economic profitability of an investment more than sustainability goals, and thus the cost-effectiveness of energy efficiency measures is a further unavoidable issue. Such complexity is quite clear at the EU decisional levels, so that, two years after the emanation of the EPBD recast (Directive 2010/31/EU), also the Delegated Regulation (EU) No. 244/2012 [5] was enacted by taking into strong consideration the profitability of each project concerning building energy design. More in detail, this document enables the application of the Directive 2010/31/EU by introducing, explaining and underlining the concept of “cost-optimality”. A step behind is now needed. Indeed, according to the EPBD recast, all new buildings should satisfy the standard of nearly zero-energy demand starting from January 2021 and this deadline is anticipated of two years for the buildings of the public administration or hosting public services. In this regard, at the date of the Directive emanation, the investments required for new nearly zero-energy buildings were too high compared to the achievable benefits, so that this standard was introduced, but postponed along the time. Therefore, between 2010 and 2020, the concept of buildings that implement cost-optimal levels of the adopted technologies was established and set as mandatory. Most notably, according to the EU Delegated Regulation 244 [5], the cost-optimal analysis is performed by assessing the global cost along building lifespan (in general 20 years for buildings of the tertiary sector, 30 years for residential ones) for a wide set of energy design scenarios. The global cost includes initial investments, operating costs and residual value of energy measures at the end of the calculation period. All costs are discounted at the first year of operation in order to provide a calculation that considers the variability of the cash flow along the time. The cost-optimal solution is the one that minimizes the global cost, thereby producing the maximum economic profitability for the private side and, generally, significant energy savings compared to standard design approaches. Therefore, it yields a satisfying trade-off between private and public perspectives. In [5], the cost-optimal analysis is recommended for new constructions by means of the concept of reference buildings. Actually, this approach may be profitable also for designers involved in projects of building energy retrofit, so that, by means of proper simulations, they can have a right perspective of all consequences, in terms of initial expenditure and reduction of operating costs, deriving from the application of energy retrofit measures. Examples of cost-optimal analysis of energy retrofit were proposed by the Building Performance Institute Europe [6], for three European case studies, and in investigations of the same authors of this paper:
  • in [7] for what concerns the adoption of standard economic indicators to a historical building;
  • in [8] with reference to a residential case study for what concerns the building shell retrofit; and
  • in [9] in matter of overall energy refurbishment of a multi-storey building for households by taking into account the building shell and all active energy systems.
In this frame, definitely, the continuous development of new technologies allows a high number of energy retrofit solutions, each of these characterized by a different level of efficiency and initial costs. Only for instance, once established that a higher thermal insulation improves the building performance in the heating season, the choice of material, technology and thicknesses is demanded to the designer also by taking into account possible negative effects, such as the indoor overheating that can occur when, in summertime, the endogenous gains are significant [10]. The aforementioned is only one of many examples for what concerns the building thermal envelope, the active energy systems, the installation of renewable energy source (RES) systems. Definitely, the domain of design scenarios is huge and a specific feasibility study for each building requires very-qualified professionals and energy consultants. Indeed, in order to perform a proper design and, especially, a robust optimization of energy retrofit, accurate analyses are recommended by adopting transient energy codes and precise boundary conditions. Contrariwise, heat transfer algorithms based on steady state methods are not suitable. Finally, given the high complexity under the point of view of the required expertise and by taking into account the high computational time and costs of optimization studies, the same European Authorities have promoted the development of reference buildings also for what concerns the existing stock. In this way, the retrofit optimization can be performed only for buildings that represent a significant part of existing ones, so that the same energy retrofit measures can be applied for all constructions framed and represented by a reference building.
It is quite obvious that the approach of the reference building can allow some design indications, while it cannot be considered very robust. This issue was outlined in [11], which introduced the new concept of representative building sample (RBS), so that a group of buildings—and not only one—can represent a stock category. The main aim of this new approach is to cover, in a more precise way, the heterogeneity of existing buildings in our inefficient cities. Furthermore, also by considering the aims of the public administration, few reference buildings cannot be the tool for establishing proper public policies of incentives. Indeed, the same energy retrofit measures, when applied to a building not represented by the reference one, can be ineffective but promoted (and funded) by the public institutions. As is clear, this can cause a waste of public money, derived from the general taxation, at national and international levels. Presently, Italy has several funding laws and decrees for promoting energy conservation measures when not mandatory, by means of various shares of funding, from 40 to 65% of capital costs [12,13,14]. Similar laws were enacted in other European countries and, regarding this, a focus on Denmark, Sweden, Germany and France was recently proposed by Baek and Park [15], who underlined the necessity of well-calibrated energy policies for promoting effective refurbishments. In the same vein, Di Pilla et al. [16] conducted a worthy investigation concerning the present and future trends of public incentives in the design of refurbishment with reference to the Italian panorama. The authors examined the distribution of incentives in the country by proposing an optimization through linear programming models. All told, the topic of financial support is complex and requires specific investigations, also by taking into account the possible alteration of the market, the economic trends and their perspectives. In any case, energy efficiency measures have to be effective and well-designed, thereby ensuring a suitable employment of public sources.
A proper large-scale energy retrofit of existing buildings would therefore yield the following goals:
  • significant economic benefits for the private side and energy/environmental benefits for the collective side;
  • better local quality of cities and more livable outdoor and indoor conditions; and
  • opportunities to address the impacts and challenges of urban heat islands [17], as well as to achieve the targets of sustainability promoted by the countries at international levels.

Aim and Originality of the Study

As noted in the previous section, the large-scale and effective energy retrofit of the existing building stock represents a crucial challenge for our generation. However, how to address it? The proposed study aims to provide a valid response to this question, which is not trivial because the energy investigation of building stocks is much more arduous than the analysis of single constructions [11]. To this end, the scientific literature proposes different methods, which can be distinguished in top-down and bottom-up approaches, respectively [18]. Top-down approaches exploit aggregated statistical data to achieve global indicators concerning the energy performance of an existing stock as well as to predict potential energy savings [19,20]. However, it is clear that only a limited number of energy retrofit measures can be considered, based on available collected data, by performing simplified energy analyses that cannot consider the complex building dynamics. Thus, a robust assessment of optimal retrofit solutions cannot be achieved. On the other hand, bottom-up approaches investigate the energy performance of restricted representative samples of buildings in order to extrapolate the outcomes to entire stocks. When real data are not available, energy simulations are carried out to examine the building samples [11,21,22,23]. In order to extrapolate the outcomes to large stocks, statistical tools can be used, such as regression models [24,25] and meta-model techniques, e.g., artificial neural networks [26,27,28]. Notably, when bottom-up approaches are implemented, the considered sample has to be representative of the explored building stock, and therefore it should be carefully defined in terms of size and composition, depending on the characteristics of the stock [29]. In this frame, the authors of this paper proposed a bottom-up methodology to detect robust indications about cost-optimal energy retrofit solutions for a building category, which is a group of buildings with the same climatic scenario, use destination and construction type [11]. The methodology is denoted as SLABE, “Simulation-based Large-scale uncertainty/sensitivity Analysis of Building Energy performance” and is based on the coupling between EnergyPlus [30] and MATLAB® [31]. After its presentation in [11], it was used in [23] in order to assess and improve the impact of public energy policies for retrofitting the Italian office building stock. SLABE is employed also in this study, but it is enhanced in order to achieve the following new goal:
  • providing guidelines to address the energy retrofit of a large building stock—which includes several categories—by considering both public and private perspectives. Thus, two families of recommended solutions are achieved. The first one collects the most energy-efficient (and thus sustainable) solutions, among the ones that produce global cost savings, thereby addressing the public perspective. The second one collects cost-optimal solutions, thereby addressing the private perspective.
In particular, the main originality of this study compared to [11,23] is investigating the energy retrofit of a huge and heterogonous building stock—which covers different climatic locations, use destinations and construction types—by providing general guidelines for both the public administration and the private side. As shown in the following lines, the investigation is applied to a significant share of the Italian public administration building stock.

2. Addressing Large-Scale Building Energy Retrofit: Methodology and Application

The proposed methodology aims to address the large-scale energy retrofit of a wide and heterogeneous building stock in order to provide general guidelines for the two main actors that are involved in the improvement of building energy performance, namely:
  • the public administration (collective perspective), which is interested in the minimization of energy consumption and polluting emissions in order to achieve targets of energy independency and sustainability; and
  • the common building owner/occupant (private perspective), who is interested in the minimization of costs, and thus in the achievement of cost-optimal solutions.
In order to pursue this purpose, the methodology performs the following steps:
  • Step 1: the building stock is subdivided into homogenous building categories;
  • Step 2: the current energy performance of each category (“as built”) is investigated in order to assess some significant energy, environmental and economic indicators; and
  • Step 3: the energy retrofit of each category is addressed and, as concerns the whole building stock, two families of optimal solutions are found in order to accomplish the interests of public and private perspectives, respectively.
It should be noticed that the energy performance of each building category is examined by implementing the methodology SLABE, which was proposed by the same authors in [11] and implemented in [23]. The next subsections elucidate the methodology steps and show how these steps are applied to the investigated case study, i.e., Italian public administration buildings.

2.1. Step 1: Subdivision of the Building Stock into Categories

A large and heterogeneous building stock is explored. Thus, in order to achieve reliable and specific guidelines concerning the energy retrofit of clusters of similar buildings, the stock is subdivided into homogenous building categories. A category is a group of buildings (denoted as category’s members) that have similar energy performance because they share:
  • the climatic location, and thus the weather conditions, which highly affect energy demand for space conditions [32] and, to a lesser extent, for artificial lighting;
  • the use destination, and thus the building function (e.g., dwellings, residences, offices, schools, hospitals), which affects all components of energy needs; and
  • the building envelope’s construction type (e.g., light or heavy weight, prefabricated), which is linked to the construction age and, mainly, affects, energy demand for space conditioning.
By referring to the case study, the investigation of the building stock is supported by comprehensive statistical analyses performed by ENEA (Italian national agency for new technologies, energy and sustainable economic development) [33,34,35], by previous studies [11,23,27,28] and authors’ expertise. In addition, significant sets of data were provided by SIRAM Spa Company (Milano, Italy), in the context of a research agreement with the Department of Industrial Engineering of the University of Naples Federico II. The mentioned company holds the contract for the energy service for a wide share of Italian public administration buildings.
As concerns the climatic location, Italy includes six climatic zones, denoted with the letters A, B, C, D, E, and F. However, the zone A is composed of only two municipalities, and thus it is not considered in this study because the outcomes would not be representative. The remaining climatic zones are characterized in Table 1 in terms of heating degree days (HDDs). In addition, this table associates to each climatic zone a typical EnergyPlus weather data file [36], as done in [23]. These files are employed in energy simulations and refer to specific locations that are characterized by average climatic conditions compared to the respective zones. As regards zone F, the file related to the city of Bolzano (belonging to zone E) is used because representative EnergyPlus weather data files are not available for zone F, and Bolzano is one of the coldest locations in zone E.
As concerns the use destination, three building functions are considered, namely schools, offices and residences. This choice allows coverage of a wide share of Italian public administration buildings. Other building functions, such as hospitals, are not taken into account because they present unique and complex energy performance factors, thereby requiring specific investigations, as done in [37].
As concerns the building construction type, the following two popular cases are considered:
  • light-weight envelope, which is typical of a wide share of buildings (around 50% of Italian ones) built in Europe in the last 50 years. The structural frame is in reinforced concrete with walls in hollow bricks and mixed brick-reinforced concrete floors and roofs. This construction type is characterized by low thermal inertia; and
  • for a similar building stock, namelyheavy-weight envelope, which is typical of old masonry buildings, with tuff walls and mixed wood-concrete horizontal floors and roofs. This construction type is characterized by high thermal inertia.
Finally, the building stock is subdivided into 30 categories, which are the combinations of all considered climatic locations, use destinations and construction types (5 × 3 × 2 = 30). Each category is denoted with three letters (e.g., B_S_L), where the first one indicates the climatic zone (i.e., B, C, D, E or F), the second one indicates the use destination (i.e., S for schools, O for offices and R for residences) and the third one indicates the construction type (L for light-weight and H for heavy-weight). The energy performance of these categories, shown in Table 2, are explored in the next methodology steps.

2.2. Step 2: Investigation of Current Building Energy Performance

The methodology SLABE (“Simulation-based Large-scale uncertainty/sensitivity Analysis of Building Energy performance”) [11,23] is applied to assess the current energy performance of each category (“as built”) included in the stock.
First of all, n characteristic parameters (denoted as pi), affecting building energy performance, are identified, as shown in Table 3. These parameters are 27 and are divided into four groups, related to geometry, building envelope, building operation and HVAC systems, respectively. It is noted that buildings are approximated with rectangular geometries. Furthermore, the most popular primary energy systems within the stock are considered, namely a natural gas boiler (denoted as reference boiler, RB) as heating system and an electric air-cooled chiller (denoted as reference chiller, RC) as cooling system. These assumptions provide reliable results for most examined buildings [11].
For each category, large-scale uncertainty analysis is performed by assigning a range of variability and a probabilistic distribution to each characteristic parameter (see Table 4, Table 5, Table 6 and Table 7) in order to cover a significant amount of the category’s members. In particular, concerning the explored case study, the parameters’ values are set based on the mentioned statistical studies of ENEA [33,34,35], authors’ expertise [11,23,27] and the data provided by SIRAM Spa Company, which holds the contract for the energy service with several Italian public administration buildings.
The parameters related to geometry are diversified for each category; Table 4 shows the related ranges’ lower and upper values as well as the type of probabilistic distribution. On the other hand, the parameters related to the envelope definitely depend on the construction type. Moreover, they could be affected by the climatic location, too, because in colder climates buildings should be characterized by higher levels of the envelope’s thermal resistance. However, this is true if a proper energy design is performed, whereas most investigated buildings were constructed with no concerns for energy issues, energy efficiency and environmental sustainability, in a period without proper regulations that addressed energy design. Thus, an envelope’s parameters are considered functions only of the construction type, as shown in Table 5. Clearly, the parameters related to building operation are considered functions of the destination use, as reported in Table 6. Finally, the parameters related to HVAC systems (see Table 7) are considered independent of the category. In other words, their characterization in terms of range and distribution is assumed the same for all 30 categories. The explanation is that efficiency and type of HVAC systems are quite random within the stock, and therefore there is not a clear dependence on the category.
After the characterization of the parameters, Latin hypercube sampling (LHS) is applied in order to generate a representative building sample (RBS) for each category. The RBS is a group of N theoretical buildings that represent the energy performance of the category. In this regard, N is set equal to the minimum value (Nmin) that produces a representative sample. As shown in [11], Nmin is 2.2 times the number of characteristic parameters (i.e., n = 27), and thus it is equal to 60 (rounding up) for the considered categories. Hence, EnergyPlus simulations are performed in order to assess energy performance of all RBSs’ members. Therefore, 30 × 60 = 1800 simulations that are needed, implying a computational time around 1.5 days (processor Intel® CoreTM i7 at 2.00 GHz). Clearly, EnergyPlus runs are automatically launched by implementing a function written in MATLAB® environment. For each building model, primary energy consumption (PEC), polluting emissions (EM) and global cost (GC) linked to space conditioning needs are assessed. In this regard, EnergyPlus simulations provide, as output, the hourly values of thermal energy demands for space heating and cooling, respectively, which enable calculation of the values of PEC, EM and GC by means of MATLAB® post-process. Indeed, a written MATLAB® code converts the hourly values of thermal energy demand into the desired three indicators by using the dynamic performance curves of HVAC systems, primary energy conversion factors, emission conversion factors and specific energy prices. Notably, GC takes account of both operating costs and investments (when retrofit is implemented) and is evaluated over building lifecycle according to European regulations [2,5]. Finally, the energy performance of each RBS, and thus of each category, is characterized by a set of values of PEC, EM and GC. Then, building energy retrofit is addressed in the last methodology step.

2.3. Step 3: Achievement of Guidelines to Address Building Energy Retrofit

The effects of proper energy retrofit measures (ERMs) on PEC, EM and GC are assessed in order to achieve reliable guidelines to address the energy retrofit of each category included in the stock. The ERMs are chosen based on buildings’ peculiarities, best practices and previous investigations. This study considers the same ERMs that were examined in [23] for a similar building stock, namely:
  • Installation of an external thermal insulation layer of polyurethane (thermal conductivity = 0.028 W/m K) on the external vertical walls. The layer thickness (tiv) is such to determine the Uv value imposed by Italian law [14] (i.e., Ulim) to achieve financial state incentives (see Table 8). The investment is given by the relation (500–2000·tiv) € per m3 of polyurethane, deduced from quotations of suppliers;
  • Installation of an external thermal insulation layer of polyurethane on the roof. The layer thickness (tir) is such to determine the Ur value imposed to achieve public incentives (see Table 8). The investment is given by the same relation (500–2000·tir) € per m3 of polyurethane;
  • Replacement of the windows with energy-efficient ones, characterized by a Uw value equal or lower to the limits for achieving public incentives reported in Table 8. In particular, the following window types, all with PVC frames, are considered depending on the climatic zone:
    -
    Zone B: argon-filled double-glazed (Uw = 2.4 W/m2 K, SHGC = 0.76). The investment is 210 €/m2 [23];
    -
    Zones C and D: argon-filled double-glazed with low-emissive coatings (Uw = 2.0 W/m2 K, SHGC = 0.69). The investment is 250 €/m2 [23]; and
    -
    Zones E and F: argon-filled triple-glazed windows with low-emissive coatings (Uw = 1.6 W/m2 K, SHGC = 0.59). The investment is 300 €/m2 [23];
  • Replacement of the heating system with a highly energy-efficient one. The nominal thermal power (Ph [kW]) depends on the examined building and is set equal to that of the reference boiler (RB). The following systems are considered:
    -
    natural gas condensing boiler (CB) with nominal η equal to 1.05 and investment given by the relation (80·Ph + 1900) € [11];
    -
    electric air-source heat pump (AHP) with nominal COP (coefficient of performance) equal to 3.7 and investment given by the relation (150·Ph + 5000) € [11]; and
    -
    electric reversible ground-source heat pump (GHP) with COP (heating operation) equal to 4.5 and investment given by the relation (700·P + 20,000) € [23], where P is the maximum value between the nominal thermal powers in heating and cooling operations, respectively.
  • Replacement of the cooling system with a highly energy-efficient one. The nominal thermal power (Pc [kW]) depends on the examined building and is set equal to that of the reference chiller (RC). The following systems are considered:
    -
    efficient electric air-cooled chiller (ACH) with nominal EER equal to 3.2 and investment given by the relation (150·Pc + 5000) € [11]; when combined with the AHP, the installation of a single electric reversible air-source heat pump (AHP-ACH) is assumed;
    -
    electric water-cooled electric chiller (WCH), equipped with a cooling tower, with nominal EER equal to 5.5 and investment given by the relation (250·Pc + 8000) € [11]; and
    -
    the cited GHP with EER (cooling operation) is equal to 6.2.
It is noted that the examined ERMs for the building envelope and for the replacement of the heating system can receive financial incentives from the Italian government [14]. These incentives are considered in global cost assessment and consist of capital grants, accorded in ten years, for an amount equal to 65% of investments. Nevertheless, such grants cannot be higher than 60,000 € as concerns the ERMs for the building envelope, nor more than 30,000 € as concerns the proposed heating systems.
Each ERM introduces a characteristic parameter for a total of five new parameters. In particular, the thermal insulation of walls, roof and the replacement of the windows introduces three Boolean parameters, respectively, which are equal to 0 if the associated ERM is assumed not implemented, and 1 if the ERM is assumed implemented. The replacement of the heating system introduces a discrete parameter, which can be equal to 1, 2, 3 or 4 depending on the system that is assumed installed (i.e., 1 for the RB, 2 for the CB, 3 for the AHP and 4 for the reversible GHP). Likewise, the replacement of the cooling system introduces a discrete parameter, which is 1 for the RC, 2 for the ACH, 3 for the WCH and 4 for the reversible GHP.
Therefore, the retrofitted configuration of each building category is defined by n + 5 = 32 characteristic parameters. In order to investigate the energy retrofit scenarios, an exhaustive sampling is conducted, thereby assessing the energy performance of all possible combinations of the considered ERMs applied to the members of the 30 RBSs that represent the categories. In this regard, the investigation of the three kinds of ERMs for the building envelope requires further EnergyPlus simulations because such measures affect thermal energy demand. The combinations of these three ERMs are seven, and thus the number of required EnergyPlus simulations is given by the product among seven, the RBSs’ size and the number of categories, namely 7 × 60 × 30 = 12,600, thereby implying an additional computational time of around ten days. On the other hand, the ERMs for heating and cooling systems are investigated through MATLAB® post-process by implementing new systems’ performance curves. Therefore, further EnergyPlus simulations are not necessary. The written MATLAB® code allows to assess, for each member of the 30 RBSs, the new values of PEC, EM and GC that are produced by each package (i.e., combination) of ERMs. Hence, for each RBS, and thus for each represented category, the following indicators are achieved:
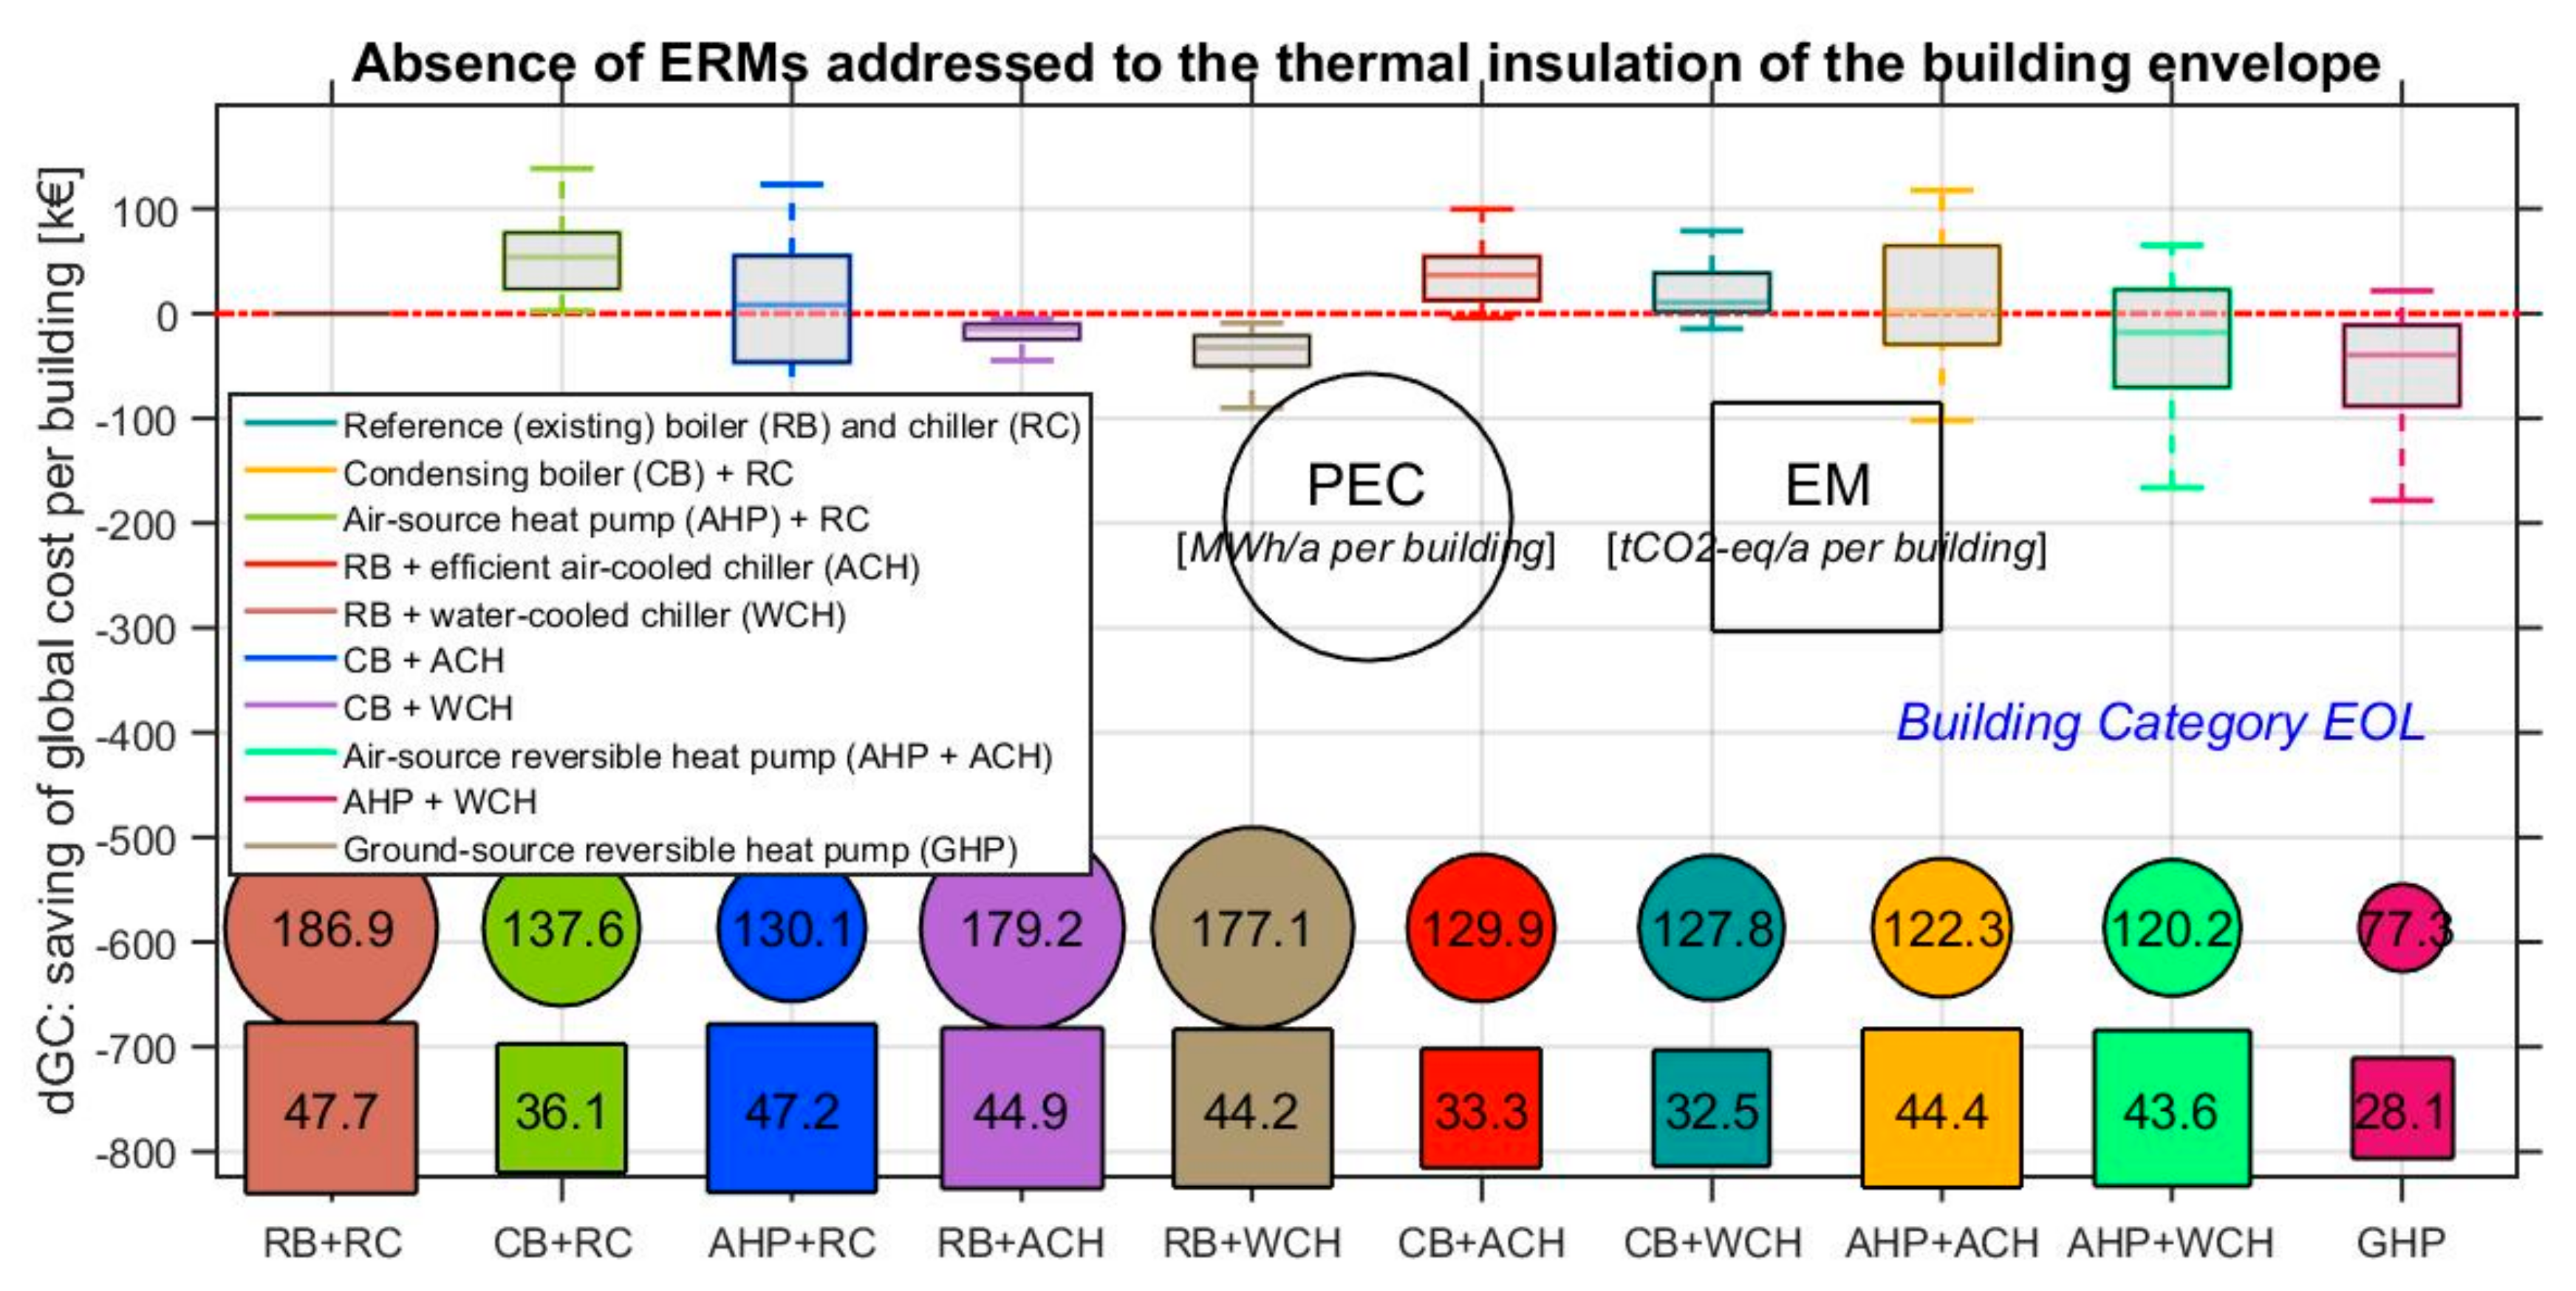
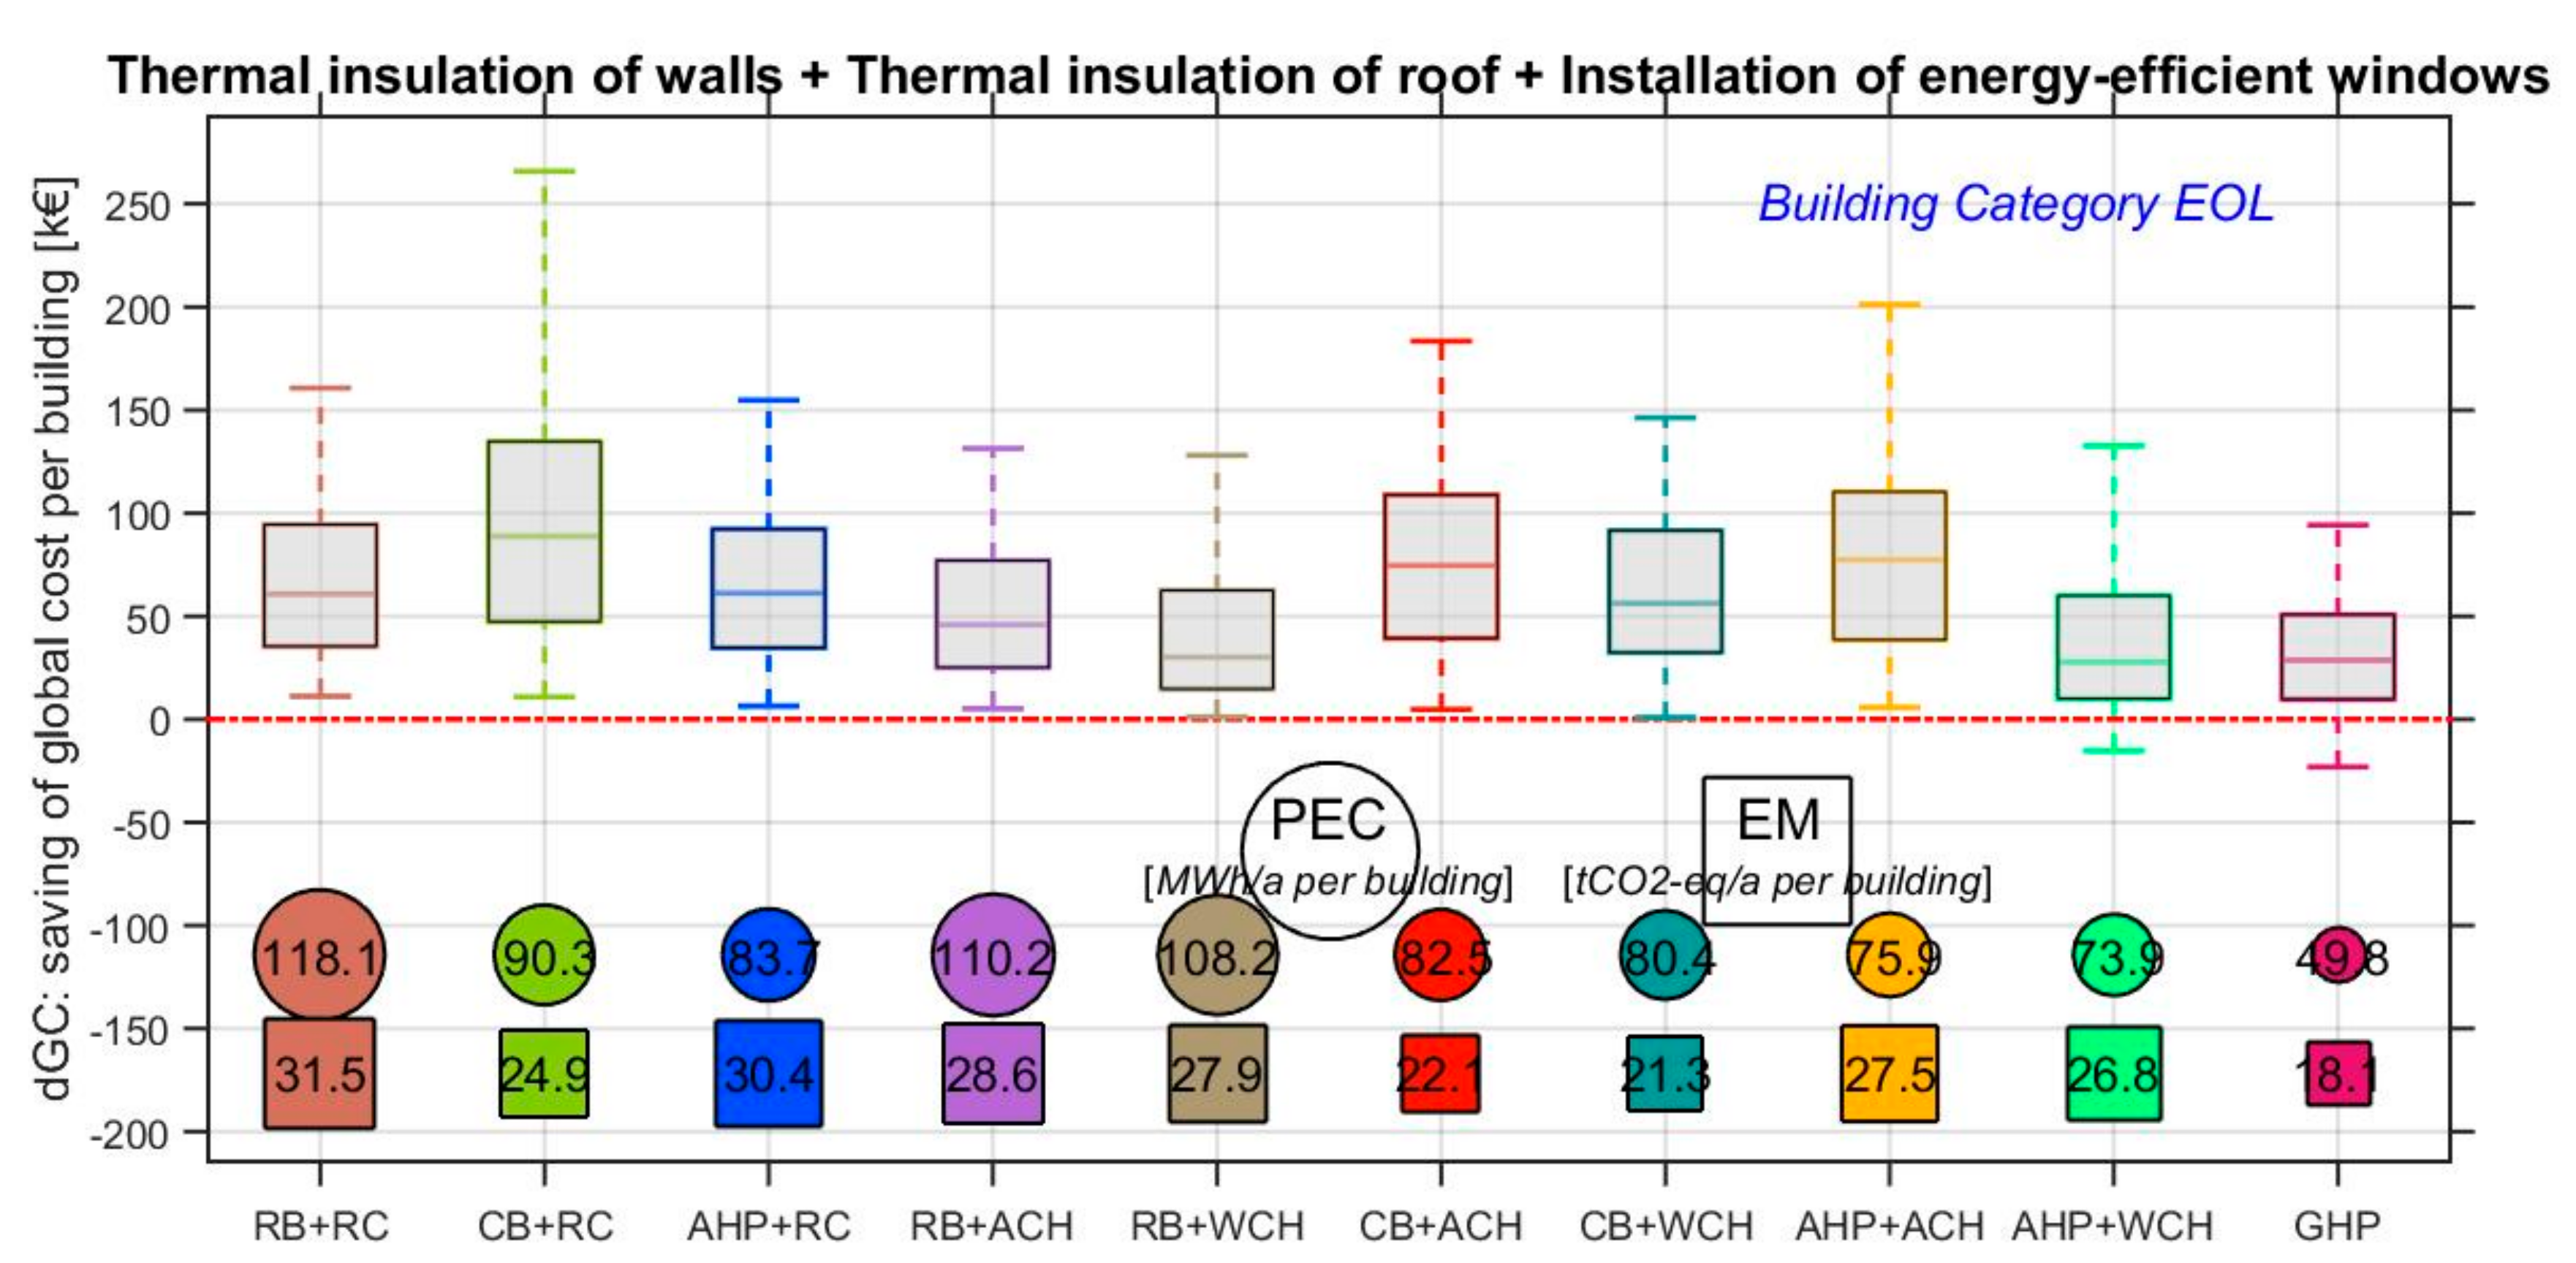
  • dPECm: average value of PEC savings per building, within the RBS, yielded by the implementation of each investigated energy retrofit package;
  • dEMm: average value of EM reductions per building, within the RBS, yielded by each retrofit package; and
  • dGCmed: median value of GC savings per building, within the RBS, yielded by each retrofit package.
The average values per building of PEC and EM reductions are assessed because, if multiplied for the number of category’s members, they provide the total reductions in each building category. Thus, they allow easy assessment of the total PEC and EM reductions in the whole stock, thereby quantifying the goals of the collective perspective (i.e., the public administration). On the other hand, the median, and not the average, is assessed for global costs because it allows to estimate the cost-effectiveness of each retrofit solution. Indeed, if the value is positive, the solution implies GC savings for more than 50% of the category’s members and therefore it is globally cost-effective. Conversely, if the median value is negative, the solution cannot be considered cost-effective. Clearly, the cost-optimal retrofit solution is the one that produces the highest value of dGCmed because it implies GC savings for the highest number of examined buildings. Thus, dGCmed enables quantification of the goal of the private perspective (i.e., common citizen), which is the maximization of the economic benefit.
The described indicators allow achievement of the methodology aim, that is, providing guidelines to address the large-scale energy retrofit of the building stock by considering both public and private perspectives. These guidelines are differentiated for the categories of the stock, and thus they are functions of climatic location, use destination and construction type. Finally, the following two families of optimal solutions are achieved:
  • the first family addresses the public perspective, since it collects the energy retrofit packages that maximize dPECm, among the solutions that produce GC savings. Since energy consumption is minimized, these solutions yield substantial EM reductions (high value of dEMm), too. Considering solutions that cause an increase of GC (i.e., negative dGCmed) is worthless, since it is very likely that these retrofit packages will not be implemented by the private concern because they are not cost-effective; and
  • the second family addresses the private perspective, since it collects the cost-optimal energy retrofit packages, which maximize dGCmed.

3. Guidelines for Energy Retrofitting Italian Public Administration Buildings: Results and Discussion

This section presents and discusses the methodology outcomes for the investigated case study. It is worthy to note that the following assumptions are adopted:
  • the primary energy conversion factor is equal to 1.95 for electricity and 1.05 for natural gas [38];
  • the energy price is equal to 0.25 €/kWhel for electricity and 0.90 €/Nm3 for natural gas [11];
  • the polluting emissions’ conversion factor is equal to 0.708 tCO2-eq/MWhel for electricity and 0.237 tCO2-eq/MWhp for natural gas [39];
  • as recommended by European guidelines [2,5], for GC assessment, the calculation period is 20 years for residential buildings and 30 years for non-residential ones, and the discount rate is equal to 3%.
All told, the achieved results are shown in the following tables:
  • Table 9 provides the first family of optimal retrofit solutions, which address the interests of the public perspective. Indeed, these solutions minimize PEC among the ones that produce GC savings; and
  • Table 10 provides the second family of optimal retrofit solutions, which address the interests of the private perspective. Indeed, these solutions minimize GC, producing the cost-optimality.
These optimal solutions are diversified for building category and characterized by reporting the mean values of PEC savings (dPECm) and EM reductions (dEMm) as well as the median value of GC savings (dGCmed). This last value allows evaluation of the global cost-effectiveness of each retrofit solution. As aforementioned, each category is denoted with three letters (e.g., B_S_L), where the first one indicates the climatic zone, the second one the use destination (i.e., S for schools, O for offices, R for residences) and the third one the construction type (L for light-weight, and H for heavy-weight).
The described indicators show that both families of optimal retrofit packages provide substantial energy and environmental benefits, which are obviously higher for the first family, as well as economic profits, which are higher for the second family. Thus, the outcomes can offer important guidelines to:
  • the public administration, in order to promote effective energy policies that provide financial support to the first family of optimal retrofit solutions, which are the most energy-efficient and sustainable (environmentally-friendly) ones (among the feasible solutions); this would imply well-thought-out public financial incentives that increase the cost-effectiveness of highly energy-efficient retrofit solutions, thereby fighting the “status quo” bias and favoring the wide diffusion of sustainable building renovations; and
  • the common citizen, building owner or occupant, in order to know which are the most profitable, i.e., cost-optimal retrofit solutions, to be implemented.
Clearly, the solutions belonging to both families of optimal retrofit packages (highlighted in Table 9 and Table 10) provide the best trade-offs between the public and private perspectives.
For demonstration, the outcomes related to a generic category, i.e., E_O_L (chosen because it includes a large amount of buildings [23]), are represented in Figure 1 and Figure 2 (and underlined in Table 9 and Table 10).
Figure 1 shows the effects of the mere replacement of HVAC systems on dGC (boxplots) as well as on the average values within the category of PEC and EM. Likewise, Figure 2 shows the effects of the replacement of HVAC systems on dGC, PEC and EM, when the cost-optimal retrofit solution for the building envelope (i.e., insulation of both external vertical walls and roof as well as installation of new energy-efficient windows) is adopted. Definitely, analysis of the figure enables more specific and detailed observations, which clearly can be achieved for each building category. For instance, concerning the considered category E_O_L, the energy retrofit of the whole building envelope (both opaque and transparent components) is very energy-efficient and cost-effective, because it produces drastic reductions of PEC and EM as well as higher potential GC savings, as clear in the comparison between Figure 1 and Figure 2. That is why the whole envelope retrofit is included in both families of optimal retrofit solutions (see Table 9 and Table 10). In this regard, as concerns HVAC systems, the most energy-efficient retrofit package (Table 9) provides the installation of a reversible ground-source heat pump (GHP), whereas the cost-optimal one (Table 10) provides the installation of a condensing boiler. This latter system implies worse energy performance that the GHP but it is more cost-effective because it requires a lower investment.
Finally, the results offer the following main observations and guidelines for the category:
  • the energy retrofit of the building envelope does not need further financial incentives and should be a “must” because it is profitable from both private and public perspectives;
  • the public administration could be interested in providing a higher financial support to the installation of GHPs, because these systems can produce substantial energy savings (up 137.1 MWh/a per building) and polluting emissions’ reductions (up to 29.6 tCO2-eq/a per building); and
  • currently, as concerns HVAC systems, the best choice for the private concern is the installation of a condensing boiler without replacing the cooling systems; this outcome is consistent because the Italian climatic zone E is characterized by a heating-dominated climate. In this regard, the condensing boiler is preferred to an electric air-source heat pump (AHP), because the rigid climatic conditions in wintertime (low values of external temperature) penalize AHP performance.

4. Conclusions

The paper investigates the large-scale energy retrofit of a significant share of Italian public administration buildings. The original aim is to provide robust guidelines to promote energy-efficient and cost-effective renovation of a wide-ranging building stock. These guidelines are addressed to both public administration, which represents the collective perspective, and building owners/occupants, who represent the private perspective. In order to achieve this aim, the methodology SLABE (“Simulation-based Large-scale uncertainty/sensitivity Analysis of Building Energy performance”) [11] is employed and enhanced. In particular, the building stock is subdivided into 30 categories, which cover five climatic locations (the main Italian climatic zones, i.e., B, C, D, E and F), three use destinations (schools, offices and residences) and two construction types (light- and heavy-weight envelope). Each category is represented by defining a representative building sample (RBS), and, then, current energy performance and numerous energy retrofit scenarios are explored by means of the coupling between EnergyPlus and MATLAB®. Finally, two families of optimal retrofit solutions are identified. The first family accomplishes the interests of the public perspective, since it collects the cost-effective solutions that minimize building energy consumption, thereby producing significant reductions of polluting emissions. In this regard, the mean values, within the categories, of achievable energy savings and emissions’ reductions are included in the ranges 8.2–165.6 MWh/a per building and 1.9–34.5 tCO2-eq/a per building, respectively. On the other hand, the second family of optimal solutions addresses the interests of the private perspective, since it collects the cost-optimal ones. Notably, the median values, within the categories, of achievable global (i.e., lifecycle) cost savings are up to 110 k€ per building. In any case, all solutions of both families produce significant energy, environmental and economic benefits. Definitely, the obtained recommended retrofit packages can offer important guidelines to both the public administration, as concerns the development of effective energy policies that provide a proper financial support to building energy retrofit, and the private entity, as concerns the implementation of the most profitable retrofit solutions. Therefore, the large-scale application of the proposed methodology could be a step towards sustainability, because it would help to fight the “status quo” bias that hampers the deep energy renovation of the existing building stock.
Finally, it is noticed that high building energy performance can be achieved through three main levers: (I) proper thermal design of the building envelope; (II) efficient HVAC and primary energy systems; and (III) exploitation of renewable energy sources (RESs). As regards existing buildings, a good strategy is postponing the third lever to the retrofit of envelope and HVAC systems, since the exploitation of RESs could hide and compensate high energy demands of the building, without solving the energy wastes caused by the poor performance of the building itself [9,11]. Conversely, after addressing the first two levers, the energy conversion from RESs can be employed for other goals, e.g., for artificial lighting or electric equipment. Therefore, the proposed study is focused on the retrofit of building envelopes and HVAC systems because these issues represent a priority of any energy refurbishment project. Clearly, the related optimization of RES systems is highly recommended because renewable energy targets are fundamental in the pursuit of the worthy goals of nearly zero-energy buildings and low-carbon building stocks and societies, as well as overall sustainable development. Thus, future studies will apply the developed methodology to address the selection of the most energy-efficient (public perspective) and cost-effective (private perspective) renewable energy source systems for a wide range of building stocks.

Acknowledgments

This study was presented at the 17th CIRIAF (the Inter-University Research Centre on Pollution and Environment “Mauro Felli”) Congress, which took place in S. Apollinare–Marsciano (Perugia, Italy) on 6–7 April 2017, and was chosen for the Special Issue of this Journal. Compared to the original version (original title: “How to address large-scale energy retrofit of a building stock? Investigation of Italian public administration buildings”), the study has been enhanced. In this regard, the authors would like to thank the committee and team of the 17th CIRIAF Congress for their support in the publication process.

Author Contributions

The research was carried out by all authors through a synergic collaboration and continuous reciprocal feedbacks during the literature review, the statistical analysis of data concerning the investigated building stock, the development of the methodology, the selection of simulation parameters and criteria, the writing of the text. Thus, all authors contributed in all phases of the work.

Conflicts of Interest

The authors declare no conflict of interest.

Abbreviation

Nomenclature
Symbols
aabsorptance to solar radiation(-)
hfloor height(m)
nnumber of buildings’ characteristic parameters(-)
pii-th buildings’ characteristic parameter(-)
raspect ratio(-)
tthickness(m)
Afloor area(m2)
COPcoefficient of performance of electric heat pumps(-)
EERenergy efficiency ratio of electric chillers(-)
EMpolluting emissions per building(CO2-eq/a)
GCglobal cost per building(€)
Nnumber of cases included in the RBS(-)
Pthermal power(kW)
PECprimary energy consumption per building(Wh/a)
SHGCsolar heat gain coefficient(-)
Ttemperature(°C)
Uthermal transmittance(W/m2 K)
ηefficiency of boilers(-)
Prefixes
dprefix that denotes a reduction (i.e., saving) compared to the baseline. For instance, dPEC indicates a primary energy saving
Subscripts
crefers to the cooling season
hrefers to the heating season
irefers to the thermal insulation
mmean value within the RBS (i.e., category)
medmedian value within the RBS (i.e., category)
rrefers to the roof
vrefers to the external vertical walls
wrefers to the windows
Acronyms
ACHefficient electric air-cooled chiller
AHPelectric air-source heat pump
CBnatural gas condensing boiler
ERMenergy retrofit measure
GHPelectric ground-source reversible heat pump
HVACheating, ventilating and air conditioning
RBreference natural gas boiler
RBSrepresentative building sample
RCreference electric air-cooled chiller
WCHelectric water-cooled chiller

References

  1. EU Commission and Parliament. Directive 2002/91/EC of the European Parliament and of the Council of 16 December 2002 on the Energy Performance of Buildings; European Union: Strasbourg, French, 2002. [Google Scholar]
  2. EU Commission and Parliament. Directive 2010/31/EU of the European Parliament and of the Council of 19 May 2010 on the Energy Performance of Buildings (EPBD Recast); European Union: Strasbourg, French, 2010. [Google Scholar]
  3. EU Commission and Parliament. Directive 2012/27/EU of the European Parliament and of the Council of 25 October 2012 on Energy Efficiency, Amending Directives 2009/125/EC and 2010/30/EU and Repealing Directives 2004/8/EC and 2006/32/EC; European Union: Strasbourg, French, 2012. [Google Scholar]
  4. The 2015 United Nations Climate Change Conference. Available online: http://unfccc.int/2860.php (accessed on 2 February 2017).
  5. EU Commission. Commission Delegated Regulation (EU) No 244/2012 of 16 January 2012 Supplementing Directive 2010/31/EU of the European Parliament and of the Council on the Energy Performance of Buildings; European Union: Strasbourg, French, 2010. [Google Scholar]
  6. Buildings Performance Institute Europe. Implementing the Cost-Optimal Methodology in EU Countries, Published in March 2013 by the Buildings Performance Institute Europe (BPIE). 2013. Available online: http://bpie.eu/cost_optimal_methodology.html#.UxS0s_l5OCk (accessed on 6 February 2016).
  7. Ascione, F.; Bianco, N.; De Stasio, C.; Mauro, G.M.; Vanoli, G.P. Building Envelope, HVAC Systems and RESs for the Energy Retrofit of a Conference Hall on Naples Promenade. Energy Procedia 2015, 75, 1261–1268. [Google Scholar] [CrossRef]
  8. Ascione, F.; Bianco, N.; De Masi, R.F.; Mauro, G.M.; Vanoli, G.P. Design of the building envelope: A novel multi-objective approach for the optimization of energy performance and thermal comfort. Sustainability 2015, 7, 10809–10836. [Google Scholar] [CrossRef]
  9. Ascione, F.; Bianco, N.; De Stasio, C.; Mauro, G.M.; Vanoli, G.P. A new methodology for cost-optimal analysis by means of the multi-objective optimization of building energy performance. Energy Build. 2015, 88, 78–90. [Google Scholar] [CrossRef]
  10. Ascione, F.; Böttcher, O.; Kaltenbrunner, R.; Vanoli, G.P. Methodology of the cost-optimality for improving the indoor thermal environment during the warm season. Presentation of the method and application to a new multi-storey building in Berlin. Appl. Energy 2017, 185, 1529–1541. [Google Scholar] [CrossRef]
  11. Mauro, G.M.; Hamdy, M.; Vanoli, G.P.; Bianco, N.; Hensen, J.L.M. A new methodology for investigating the cost-optimality of energy retrofitting a building category. Energy Build. 2015, 107, 456–478. [Google Scholar] [CrossRef]
  12. Italian Government. Ministerial Decree 26 October 2007; Italian Government: Roma, Italy, 2007. (In Italian)
  13. Italian Parliament. Law 28/12/2015, n. 208; Italian Parliament: Roma, Italy, 2015. (In Italian)
  14. Italian Parliament. Italian Parliament Stability Law 7 December 2017; Italian Parliament: Roma, Italy, 2017. (In Italian)
  15. Baek, C.H.; Park, S.H. Changes in renovation policies in the era of sustainability. Energy Build. 2012, 47, 485–496. [Google Scholar] [CrossRef]
  16. Di Pilla, L.; Desogus, G.; Mura, S.; Ricciu, R.; Di Francesco, M. Optimizing the distribution of Italian building energy retrofit incentives with Linear Programming. Energy Build. 2016, 112, 21–27. [Google Scholar] [CrossRef]
  17. Morini, E.; Touchaei, A.G.; Castellani, B.; Rossi, F.; Cotana, F. The Impact of Albedo Increase to Mitigate the Urban Heat Island in Terni (Italy) Using the WRF Model. Sustainability 2016, 8, 999. [Google Scholar] [CrossRef]
  18. Swan, L.G.; Ugursal, V.I. Modeling of end-use energy consumption in the residential sector: A review of modeling techniques. Renew. Sustain. Energy Rev. 2009, 13, 1819–1835. [Google Scholar] [CrossRef]
  19. Balaras, C.A.; Gaglia, A.G.; Georgopoulou, E.; Mirasgedis, S.; Sarafidis, Y.; Lalas, D.P. European residential buildings and empirical assessment of the Hellenic building stock, energy consumption, emissions and potential energy savings. Build. Environ. 2007, 42, 1298–1314. [Google Scholar] [CrossRef]
  20. Fracastoro, G.V.; Serraino, M. A methodology for assessing the energy performance of large scale building stocks and possible applications. Energy Build. 2011, 43, 844–852. [Google Scholar] [CrossRef]
  21. Mata, É.; Kalagasidis, A.S.; Johnsson, F. A modelling strategy for energy, carbon, and cost assessments of building stocks. Energy Build. 2013, 56, 100–108. [Google Scholar] [CrossRef]
  22. Nik, V.M.; Kalagasidis, A.S. Impact study of the climate change on the energy performance of the building stock in Stockholm considering four climate uncertainties. Build. Environ. 2013, 60, 291–304. [Google Scholar] [CrossRef]
  23. Ascione, F.; Bianco, N.; De Stasio, C.; Mauro, G.M.; Vanoli, G.P. A Methodology to Assess and Improve the Impact of Public Energy Policies for Retrofitting the Building Stock: Application to Italian Office Buildings. Int. J. Heat Technol. 2016, 34, S277–S286. [Google Scholar] [CrossRef]
  24. Caldera, M.; Corgnati, S.P.; Filippi, M. Energy demand for space heating through a statistical approach: Application to residential buildings. Energy Build. 2008, 40, 1972–1983. [Google Scholar] [CrossRef]
  25. Al-Ghandoor, A.; Jaber, J.O.; Al-Hinti, I.; Mansour, I.M. Residential past and future energy consumption: Potential savings and environmental impact. Renew. Sustain. Energy Rev. 2009, 13, 1262–1274. [Google Scholar] [CrossRef]
  26. Melo, A.P.; Cóstola, D.; Lamberts, R.; Hensen, J.L.M. Development of surrogate models using artificial neural network for building shell energy labeling. Energy Policy 2014, 69, 457–466. [Google Scholar] [CrossRef]
  27. Ascione, F.; Bianco, N.; De Stasio, C.; Mauro, G.M.; Vanoli, G.P. Artificial neural networks to predict energy performance and retrofit scenarios for any member of a building category: A novel approach. Energy 2017, 118, 999–1017. [Google Scholar] [CrossRef]
  28. Ascione, F.; Bianco, N.; De Stasio, C.; Mauro, G.M.; Vanoli, G.P. CASA, cost-optimal analysis by multi-objective optimisation and artificial neural networks: A new framework for the robust assessment of cost-optimal energy retrofit, feasible for any building. Energy Build. 2017, in press. [Google Scholar] [CrossRef]
  29. Liang, Z.; Shen, H.G. Determining sample size for building energy consumption surveys using statistical theory. Energy Build. 2012, 47, 533–539. [Google Scholar] [CrossRef]
  30. US Department of Energy. Energy Efficiency and Renewable Energy Office, Building Technology Program (2013). EnergyPlus 8.0.0. Available online: http://apps1.eere.energy.gov/buildings/energyplus/ (accessed on 22 December 2016).
  31. MATLAB®—MATrix LABoratory—7.10.0. User’s Guide, MathWorks; MATrix LABoratory: Dubai, UAE, 2010. [Google Scholar]
  32. Pisello, A.L.; Pignatta, G.; Castaldo, V.L.; Cotana, F. The impact of local microclimate boundary conditions on building energy performance. Sustainability 2015, 7, 9207–9230. [Google Scholar] [CrossRef]
  33. Citterio, M. Analisi Statistica sul Parco Edilizio non Residenziale e Sviluppo di Modelli di Calcolo Semplificati; Report RSE; ENEA: Roma, Italy, 2009. (In Italian) [Google Scholar]
  34. Margiotta, F.; Puglisi, G. Caratterizzazione del Parco Edilizio Nazionale Determinazione Dell’edificio Tipo per uso Ufficio; Report RSE/2009/164; ENEA: Roma, Italy, 2009. (In Italian) [Google Scholar]
  35. Centro Ricerche ENEA. Determinazione dei Fabbisogni e dei Consumi Energetici dei Sistemi Edificio-Impianto. Caratterizzazione del Parco Immobiliare ad uso Residenziale; ENEA: Roma, Italy, 2012. (In Italian) [Google Scholar]
  36. EnergyPlus-Weather Data. Available online: https://energyplus.net/weather (accessed on 22 December 2016).
  37. Ascione, F.; Bianco, N.; De Stasio, C.; Mauro, G.M.; Vanoli, G.P. Multi-stage and multi-objective optimization for energy retrofitting a developed hospital reference building: A new approach to assess cost-optimality. Appl. Energy 2016, 174, 37–68. [Google Scholar] [CrossRef]
  38. Italian Government. Ministerial Decree 26 June 2015; Italian Government: Roma, Italy, 2015. (In Italian)
  39. Technical Annex to the SEAP Template Instructions Document: THE EMISSION FACTORS. Available online: https://www.eumayors.eu/index_en.html (accessed on 22 December 2016).
Figure 1. Category E_O_L: effects of the replacement of HVAC systems on dGC, PEC and EM.
Sustainability 09 00940 g001
Figure 2. Category E_O_L: effects of the replacement of HVAC systems on dGC, PEC and EM, when also the cost-optimal retrofit solution for the building envelope is adopted.
Sustainability 09 00940 g002
Table 1. Characterization of the main Italian climatic zones. This table is partially taken from [23].
Climatic ZoneHeating Degree DaysWeather Data File [36]
BHDDs ∈ [601, 900]Palermo, 751 HDDs
CHDDs ∈ [901, 1400]Napoli, 1034 HDDs
DHDDs ∈ [1401, 2100]Firenze, 1821 HDDs
EHDDs ∈ [2101, 3000]Milano, 2404 HDDs
FHDDs ∈ [3001, +∞]Bolzano *, 2791 HDDs
* No representative EnergyPlus weather data files are available for climatic zone F.
Table 2. Categories in which the building stock is subdivided.
CategoryClimatic ZoneUse DestinationConstruction TypeCategoryClimatic ZoneUse DestinationConstruction Type
B_S_L *BSchoolsLight-weightE_S_LESchoolsLight-weight
B_S_HHeavy-weightE_S_HHeavy-weight
B_O_LOfficesLight-weightE_O_LOfficesLight-weight
B_O_HHeavy-weightE_O_HHeavy-weight
B_R_LResidencesLight-weightE_R_LResidencesLight-weight
B_R_HHeavy-weightE_R_HHeavy-weight
C_S_LCSchoolsLight-weightF_S_LFSchoolsLight-weight
C_S_HHeavy-weightF_S_HHeavy-weight
C_O_LOfficesLight-weightF_O_LOfficesLight-weight
C_O_HHeavy-weightF_O_HHeavy-weight
C_R_LResidencesLight-weightF_R_LResidencesLight-weight
C_R_HHeavy-weightF_R_HHeavy-weight
D_S_LDSchoolsLight-weight
D_S_HHeavy-weight
D_O_LOfficesLight-weight
D_O_HHeavy-weight
D_R_LResidencesLight-weight
D_R_HHeavy-weight
* The first letter indicates the climatic zone (B, C, D, E, F), the second one the use destination (S for schools, O for offices, R for residences), the third one the construction type (L for light, H for heavy).
Table 3. Characteristic parameters (pi) affecting building energy performance.
Parameters Related to Geometry
(p1)Orientation (angle between North axis and building North) (°)
(p2)Area of each floor, A (m2)
(p3)Aspect ratio, r (-)
(p4)Floor height, h (m)
(p5)Window to wall ratio: South, WWRS (-)
(p6)Window to wall ratio: East, WWRE (-)
(p7)Window to wall ratio: North, WWRN (-)
(p8)Window to wall ratio: West, WWRW (-)
(p9)Number of floors (-)
Parameters related to Building Envelope
(p10)Thickness of external vertical walls, tv (m)
(p11)Thermal transmittance of external vertical walls, Uv (W/m2 K)
(p12)Solar absorptance of external vertical walls, av (-)
(p13)Thickness of the roof, tr (m)
(p14)Thermal transmittance of the roof, Ur (W/m2 K)
(p15)Solar absorptance of the roof, ar (-)
(p16)Type of windows’ glasses (-)
(p17)Type of windows’ frames (-)
(p18)Infiltration rate, ACH (h−1)
Parameters related to Building Operation
(p19)People density (people/m2)
(p20)Light load (W/m2)
(p21)Equipment load (W/m2)
(p22)Heating set point temperature, Th (°C)
(p23)Cooling set point temperature, Tc (°C)
(p24)Time of people occupancy (hours/day)
Parameters related to HVAC Systems
(p25)Heating terminals: fan coils (FC)/hot water Radiators (Rad) (-)
(p26)Nominal efficiency of the heating system, η (-)
(p27)Nominal energy efficiency ratio of the cooling system, EER (-)
Table 4. Characterization of parameters related to Geometry (p1–p9).
Geometry ParameterRangeDistribution
(p1) Orientation (°)0; ±30; ±60; 90uniform
(p2) A (m2)100 ÷ 1800uniform
(p3) r (-)1.00 ÷ 10.0uniform
(p4) h (m)2.70 ÷ 4.20uniform
(p5) WWRS (-)0.10 ÷ 0.60uniform
(p6) WWRE (-)0.10 ÷ 0.60uniform
(p7) WWRN (-)0.10 ÷ 0.60uniform
(p8) WWRW (-)0.10 ÷ 0.60uniform
(p9) Floors (-)1 ÷ 10uniform
Table 5. Characterization of parameters related to Building Envelope (p10–p18), differentiated for construction type.
Envelope ParameterRangeDistribution
Light-Weight EnvelopeHeavy-Weight Envelope
(p10) tv (m)0.15 ÷ 0.400.20 ÷ 0.60normal *
(p11) Uv (W/m2 K)0.80 ÷ 1.600.70 ÷ 1.50normal *
(p12) av (-)0.10 ÷ 0.900.10 ÷ 0.90normal *
(p13) tr (m)0.15 ÷ 0.350.15 ÷ 0.35normal *
(p14) Ur (W/m2 K)1.00 ÷ 1.800.90 ÷ 1.70normal *
(p15) ar (-)0.10 ÷ 0.900.10 ÷ 0.90normal *
(p16) windows’ glassessingle; doublesingle; doubleuniform
(p17) windows’ framesaluminum; woodaluminum; wooduniform
(p18) ACH (h−1)0.50 ÷ 1.000.50 ÷ 1.00normal *
* Mean value = range average; standard deviation = (range length)/4; confidence interval = 95% [11].
Table 6. Characterization of parameters related to Building Operation (p19–p24), differentiated for use destination.
Operation ParameterRangeDistribution
SchoolsOfficeResidences
(p19) (people/m2)0.20 ÷ 0.400.10 ÷ 0.200.06 ÷ 0.14normal *
(p20) Lights (W/m2)10 ÷ 2010 ÷ 205 ÷ 10normal *
(p21) Equipment (W/m2)10 ÷ 2010 ÷ 205 ÷ 10normal *
(p22) Th (°C)202020uniform
(p23) Tc (°C)262626uniform
(p24) Occupancy (hours/day)61014uniform
* Mean value = range average; standard deviation = (range length)/4; confidence interval = 95% [11].
Table 7. Characterization of parameters related to HVAC systems (p25–p27).
HVAVC ParameterRangeDistribution
(p25) Terminals (-)Fc; Raduniform
(p26) η (-)0.65 ÷ 0.90normal *
(p27) EER (-)2.00 ÷ 2.80normal *
* Mean value = range average; standard deviation = (range length)/4; confidence interval = 95% [11].
Table 8. Values of thermal transmittance (Ulim [W/m2 K]) required to achieve public financial incentives [14] in case of building energy retrofit.
Climatic ZoneWalls (Uvlim) [W/m2 K]Roof (Urlim) [W/m2 K]Windows (Uwlim) [W/m2 K]
B0.410.322.4
C0.340.322.1
D0.290.262.0
E0.270.241.8
F0.260.231.6
Table 9. Optimal energy retrofit solutions (first family) from the public perspective.
Public Perspective: Achievement of Sustainable Solutions
CategoryEnergy Retrofit Package that Minimizes Primary Energy Consumption and Implies Global Cost SavingsdPECm [MWh/a]dEMm [tCO2-eq/a]dGCmed [k€]
B_S_LRoof Insulation; Installation of a CB11.83.61.47
B_S_HRoof Insulation; Installation of a CB12.23.82.41
B_O_LWalls’ and Roof Insulation; Installation of a reversible AHP27.78.35.2
B_O_HWalls’ and Roof Insulation; Installation of a reversible AHP26.88.14.7
B_R_LWalls’ and Roof Insulation; Installation of a reversible GHP19.86.20.36
B_R_HWalls’ and Roof Insulation; Installation of a reversible GHP18.85.90.38
C_S_LRoof Insulation; New windows; Installation of an AHP43.76.72.3
C_S_HRoof Insulation; New windows; Installation of a reversible AHP50.29.14.1
C_O_LWalls’ and Roof Insulation; New windows;
Installation of a reversible AHP
45.410.213.2
C_O_HWalls’ and Roof Insulation; New windows;
Installation of a reversible AHP
45.210.013.6
C_R_LNew windows; Installation of a reversible GHP26.86.014.6
C_R_HNew windows; Installation of a reversible GHP26.15.915.1
D_S_LWalls’ and Roof Insulation; New windows;
Installation of a reversible AHP
108.218.030.1
D_S_HWalls’ and Roof Insulation; New windows;
Installation of a reversible AHP
109.318.438.0
D_O_LWalls’ and Roof Insulation; New windows;
Installation of a reversible GHP
101.222.58.0
D_O_HWalls’ and Roof Insulation; New windows;
Installation of a reversible GHP
97.921.78.9
D_R_LWalls’ and Roof Insulation; New windows;
Installation of a reversible GHP
59.213.460.6
D_R_HWalls’ and Roof Insulation; New windows;
Installation of a reversible GHP
57.213.061.5
E_S_LWalls’ and Roof Insulation; New windows;
Installation of a reversible AHP
109.519.132.1
E_S_HWalls’ and Roof Insulation; New windows;
Installation of a reversible AHP
111.019.138.9
E_O_L *Walls’ and Roof Insulation; New windows;
Installation of a reversible GHP
137.129.628.6
E_O_HWalls‘ and Roof Insulation; New windows;
Installation of a reversible GHP
134.629.134.1
E_R_LWalls’ and Roof Insulation; New windows;
Installation of a reversible GHP
81.417.991.0
E_R_HWalls’ and Roof Insulation; New windows;
Installation of a reversible GHP
78.817.592.9
F_S_LWalls’ and Roof Insulation; New windows;
Installation of a reversible GHP
158.031.510.1
F_S_HWalls’ and Roof Insulation; New windows;
Installation of a reversible GHP
159.632.110.3
F_O_LWalls’ and Roof Insulation; New windows;
Installation of a reversible GHP
165.634.549.0
F_O_HWalls’ and Roof Insulation; New windows;
Installation of a reversible GHP
161.833.954.8
F_R_LWalls’ and Roof Insulation; New windows;
Installation of a reversible GHP
94.920.4106.0
F_R_HWalls’ and Roof Insulation; New windows;
Installation of a reversible GHP
93.020.2110.0
* This category is underlined because it is investigated more in detail below for example purposes.
Table 10. Optimal energy retrofit solutions (second family) from the private perspective.
Private Perspective: ACHIEVEMENT of Cost-Optimality
CategoryEnergy Retrofit Package that Minimizes Global CostdPECm [MWh/a]dEMm [tCO2-eq/a]dGCmed [k€]
B_S_LInstallation of a CB8.21.91.72
B_S_HRoof Insulation; Installation of a CB12.23.82.41
B_O_LInstallation of a reversible AHP22.96.58.59
B_O_HRoof Insulation; Installation of an reversible AHP25.17.514.4
B_R_LInstallation of a reversible GHP17.45.411.7
B_R_HInstallation of a reversible GHP16.85.111.3
C_S_LNew windows; Installation of a CB24.35.918.0
C_S_HNew windows; Installation of a CB24.05.815.4
C_O_LRoof Insulation; New windows; Installation of a CB24.26.116.4
C_O_HRoof Insulation; New windows; Installation of a CB23.15.716.7
C_R_LNew windows; Installation of a CB12.93.216.5
C_R_HNew windows; Installation of a reversible GHP26.15.919.1
D_S_LRoof Insulation; New windows; Installation of a CB76.416.066.5
D_S_HRoof Insulation; New windows; Installation of a CB76.718.166.6
D_O_LWalls’ and Roof Insulation; New windows; Installation of a CB65.115.041.5
D_O_HWalls’ and Roof Insulation; New windows; Installation of a CB62.414.340.6
D_R_LWalls’ and Roof Insulation; New windows;
Installation of a reversible GHP
59.213.460.6
D_R_HWalls’ and Roof Insulation; New windows;
Installation of a reversible GHP
57.213.061.5
E_S_LWalls’ and Roof Insulation; New windows; Installation of a CB77.216.868.5
E_S_HWalls’ and Roof Insulation; New windows; Installation of a CB77.918.470.6
E_O_L *Walls’ and Roof Insulation; New windows; Installation of a CB96.622.888.8
E_O_HWalls’ and Roof Insulation; New windows; Installation of a CB93.622.189.9
E_R_LWalls’ and Roof Insulation; New windows;
Installation of a reversible GHP
81.417.991.0
E_R_HWalls’ and Roof Insulation; New windows;
Installation of a reversible GHP
78.817.592.9
F_S_LWalls’ and Roof Insulation; New windows; Installation of a CB111.624.3106.8
F_S_HWalls’ and Roof Insulation; New windows; Installation of a CB113.626.1107.2
F_O_LWalls’ and Roof Insulation; New windows; Installation of a CB118.127.8108.9
F_O_HWalls’ and Roof Insulation; New windows;
Installation of a reversible GHP
114.827.1109.0
F_R_LWalls’ and Roof Insulation; New windows;
Installation of a reversible GHP
94.920.4106.0
F_R_HWalls’ and Roof Insulation; New windows;
Installation of a reversible GHP
93.020.2110.0
* This category is underlined because it is investigated more in detail below for example purposes.

