Article

PV, Wind and Storage Integration on Small Islands for the Fulfilment of the 50-50 Renewable Electricity Generation Target

by
Javier Mendoza-Vizcaino
,
Andreas Sumper
* and
Samuel Galceran-Arellano
Centre d’Innovaciò Tecnològica en Convertidors Estàtics i Accionaments (CITCEA-UPC), Departament d’Enginyeria Elèctrica, ETS d’Enginyeria Industrial de Barcelona, Universitat Politècnica de Catalunya, Av. Diagonal 647, 08028 Barcelona, Spain
*
Author to whom correspondence should be addressed.
Sustainability 2017, 9(6), 905; https://doi.org/10.3390/su9060905
Submission received: 1 April 2017 / Revised: 18 May 2017 / Accepted: 20 May 2017 / Published: 27 May 2017
(This article belongs to the Section Energy Sustainability)

Abstract

:
Decarbonisation in the generation of electricity is necessary to reduce fossil fuel consumption, the pollution emitted and to meet the Energy Technology Perspectives 2 ° C Scenario (2DS) targets. Small islands are not exempt from this target, so this study’s emphasis is placed on a 50-50 target: to reduce the fossil fuel consumption through electricity generation from Renewable Energy Sources (RES) to cover 50% of all electric demand by 2050 on small islands. Using Cozumel Island, Mexico, as a case study, this analysis will be based on three factors: economical, technical, and land-use possibilities of integrating Renewable Energy Technologies (RETs) into the existing electrical grid. This analysis is made through long-term statistical models. A deterministic methodology is used to perform time-series simulations. The selection of the best system was made on the basis of a Dimensional Statistical Variable (DSV) through primary and secondary category rankings. The presented methodology determines the best systems for capturing the initial capital cost and competitiveness of this new proposal compared with the current system of electricity generation on the Island, and can be applied to small islands as well. According to the results, all systems proposed are able to completely satisfy the renewable electricity needed by 2050 in all scenarios. From the 12 system proposals that were compared, two systems, System 2 and System 7, were chosen as eligible systems to be installed. The Levelized Cost of Energy (LCOE) result for System 2 was 0.2518 US$/kWh and for System 7 was 0.2265 US$/kWh by 2018 in the Base Scenario. Meanwhile, the Internal Rate of Return (IRR) value fluctuated from 17.2% for System 2 to 31% for System 7.

1. Introduction

Renewable Energy (RE) plays an important role in the goal of reducing emissions in electricity generation. In the Small Island Developing States (SIDS), most power grids must rely on diesel generators. Even if small islands are not part of the SIDS, those that are not interconnected to large electrical systems have high operating costs, due to the dependence on expensive fuel imports [1]. Studies on the integration of Renewable Energy Technologies (RETs) into electric grids have been developed. For instance, the contribution made by Bertin and Frangi [2] that shows the potential of RETs integration into the electrical system on Guadeloupe Island. The methodology and the results shown in this document help to determine the viable potential combinations of RETs to achieve it, based on Photovoltaic (PV), Wind and flow battery technologies. Also, the data and results obtained by Meschede et al. [3] can be used as a baseline to implement the methodology shown and integrate the RETs on the islands with higher Gross Domestic Product (GDP) located in the Caribbean and South Japan, as well as in the Mariana Archipelago and Polynesia.
A similar analysis on small islands was developed, including the existing diesel generation. Some studies included the natural resource potential analysis through Geographic Information System (GIS) [4,5]. The size of a small island was determined by Blechinger et al. [4], where the GIS analysis identified approximately 1800 small islands below 100,000 inhabitants with significant renewable energy potential. Meanwhile, other studies included the analysis of the electricity excess generated after covering the electric demand [6] as a flexible load that produces desalinized water as well as drinking water. There are also studies that include an analysis of the use of pumping water—used for energy storage—as a stability solution in a hybrid renewable system for islands [7,8,9,10]. Other cases use batteries for energy storage on islands [11]. Others do not use energy storage [12] at all.
Decarbonisation in the generation of electricity is imperative in order to meet the Energy Technology Perspectives 2 ° C Scenario (2DS) targets [13]. Among energy end uses, heating and cooling systems offer substantial potential for decarbonisation that so far has been largely untapped. Broad application of energy efficiency and switching to low-carbon final energy carriers (including decarbonised electricity) can push the fossil share to below 50% by 2050 with renewable energy (including renewable electricity) covering more than 40% of heating and cooling needs [14]. Every country is required to cover its electricity generation with a higher share of clean and renewable energy [15]. Table 1 shows a summary of the Paris Agreement 2015 for the emissions reductions. The first 17 countries combined emitted 77% of Greenhouse Gases (GHG) emissions in 2012, and more than 1% of the GHG emissions individually. In the table, Niue Island (country No. 141) and those listed below it contributed 0.00% of the GHG emissions individually in 2012; even so, they are committed to reducing their nearly inexistent GHG emissions and taking a path toward a net zero GHG emissions. Also, Table 1 shows the Paris Agreement signature, acceptance and ratification dates of those commitments [15,16].
For instance, one of the main objectives in the electricity system in Mexico, as well as in other countries, such as Kazakhstan [17], United Arab Emirates [18], and in Equatorial Guinea [19], is to reduce fossil fuel consumption in its electricity production and to achieve a 50% target in the generation of renewable electricity by 2050. Mexican Islands are not exempt from this target, so this study’s emphasis is placed on a 50-50 target: to reduce the fossil fuel consumption through electricity production from Renewable Energy Sources (RES) to cover 50% of all electricity consumption by 2050 on small islands based on PV, Wind and flow battery technologies. According to the tropical small islands characteristics and using Cozumel Island, Mexico, localized on the Occidental Caribbean Sea, as a case study, this work will analyze the RETs integration into the existing electrical grid. Results will determine the best system for capturing the initial capital cost and competitiveness of this new proposal compared with the current system of electrical production on the Island. Remote or small island communities are particularly vulnerable to climate change impacts, and such regions are often highly dependent on imported fossil fuels to meet their electricity needs [20], so it is necessary that the results obtained through this study help those islands to install the right equipment combination to achieve sustainable solutions.
In Section 3.1 of this study, Organization of Economic Co-operation and Development (OECD) and Mexico’s energy supply situation will be analysed, including the Mexican energy and electricity sector and the Peninsular Area electricity sector, which is one of the seven electric control regions in the National Interconnected System (SIN is its Spanish acronym) in Mexico. In Section 2, the methodology used to integrate the RETs into the electric grid on an island is detailed. As Cozumel Island is used as the case study, the electrical system, the RE resources and sources and the proposed systems will be investigated in Section 3.4. Also, the scenarios showing the growth in electricity and/or energy demand and predictions will be determined taking into consideration the electrical system on the island according to the main objective pointed out at the beginning of this document. This analysis will be made through long-term statistical models.
Works published by [21,22] were made on the basis of the SWITCH model. This is a multi-period stochastic linear programming model to minimize the present value of the cost of power plants, transmission capacity, fuel, and a per-ton carbon dioxide adder, over the course of several multi-year investment periods. The integration of renewable technology on Cozumel Island’s existing electric grid, the operation and the financial cost analysed in this document were made on the basis of the HOMER simulation model [23]. This is a tool that uses two-dimensional linear interpolation through a probabilistic logic strategy using the complete enumeration method. Through this process, the software determines the optimal values of variables that the system designer controls, such as the mix of components that make up the system and the size or quantity of each variable. The optimal system or the best system configuration is the one that satisfies the user-specified constraints at the lowest total net present cost. As in the case of the SWITCH model, the HOMER simulation model uses multi-year analysis based on a time-domain simulation run at the energy-flow level with discrete time-steps of 1 h to determine the Net Present Value for a chosen configuration over a specified project lifetime [24]. More information about the HOMER model formulation is available at [25,26].
For many types of micropower systems, in particular those involving intermittent renewable power sources, a minimum one-hour time step is necessary to model the operational behavior of the system with acceptable accuracy. In a wind–diesel–battery system, for example, it is not accurate enough to know the monthly average (or even daily average) wind power output, since the timing and the variability of that power output are as important as its average quantity. To predict accurately the diesel fuel consumption, diesel operating hours, the flow of energy through the battery, and the amount of surplus electrical production, it is necessary to know how closely the wind power output correlates to the electric load. HOMER’s one-hour time step is sufficient to capture the most important statistical aspects of the load and the intermittent renewable resources for the energy management of the system suitable for optimization, while dynamics and control are not analysed [27].
Other planning tools simulate power system dynamics, and optimize the capacity of renewable and fossil fuel generation technologies, storage technologies, and the transmission system, while accounting for the hourly variability of intermittent renewable generation and electricity loads. Watson et al. [28], in collaboration with the Alternative Energy Research Group, of the University of the West Indians (UWI) Mona, have developed the free Linear Optimization software, Photurgen [29], to design and analyze hybrid solar–wind systems within the Caribbean region. In this model, the historic climatological resources and instantaneous load consumption data, as shown in the daily analysis of measured load consumption, was in hourly resolution. An hourly system operation was analysed by Gils and Simon [30], considering the flexibility options and the sector linkage in a pathway to a 100% renewable energy supply for the Canary Islands. In this work, based on a back-casting approach linking the bottom-up accounting framework Mesap-PlaNet model and the high resolution power system model REMix, the authors assess the least-cost composition of generation, grid, and storage capacities in high spatial resolution, and provide an evaluation of the hourly system dispatch.
Section 4 will display the results of the arrangements proposed. A deterministic methodology is used to perform time-series simulations [6]. The selection of the best proposed hybrid system will be determined based on the Dimensional Statistical Variable (DSV) model and a linear regression analysis model, through primary and secondary category rankings [31]. Similar studies were developed using this statistical model. For instance, to predict the financial and technical performance in an off-grid renewable energy system, a linear regression analysis on the basis of this model was used [32]. On the basis of this model, in Fiji Islands, a linear regression model to estimate grid-electricity demand was considered [33]. For the energy supply on Wang-An Island, similar rank points were given for identifying the optimal integrated electricity production from RES [34]. The reduction of the CO 2 emission factor will then be indicated at the end of this Section 4. Conclusions and discussions are addressed in Section 5.

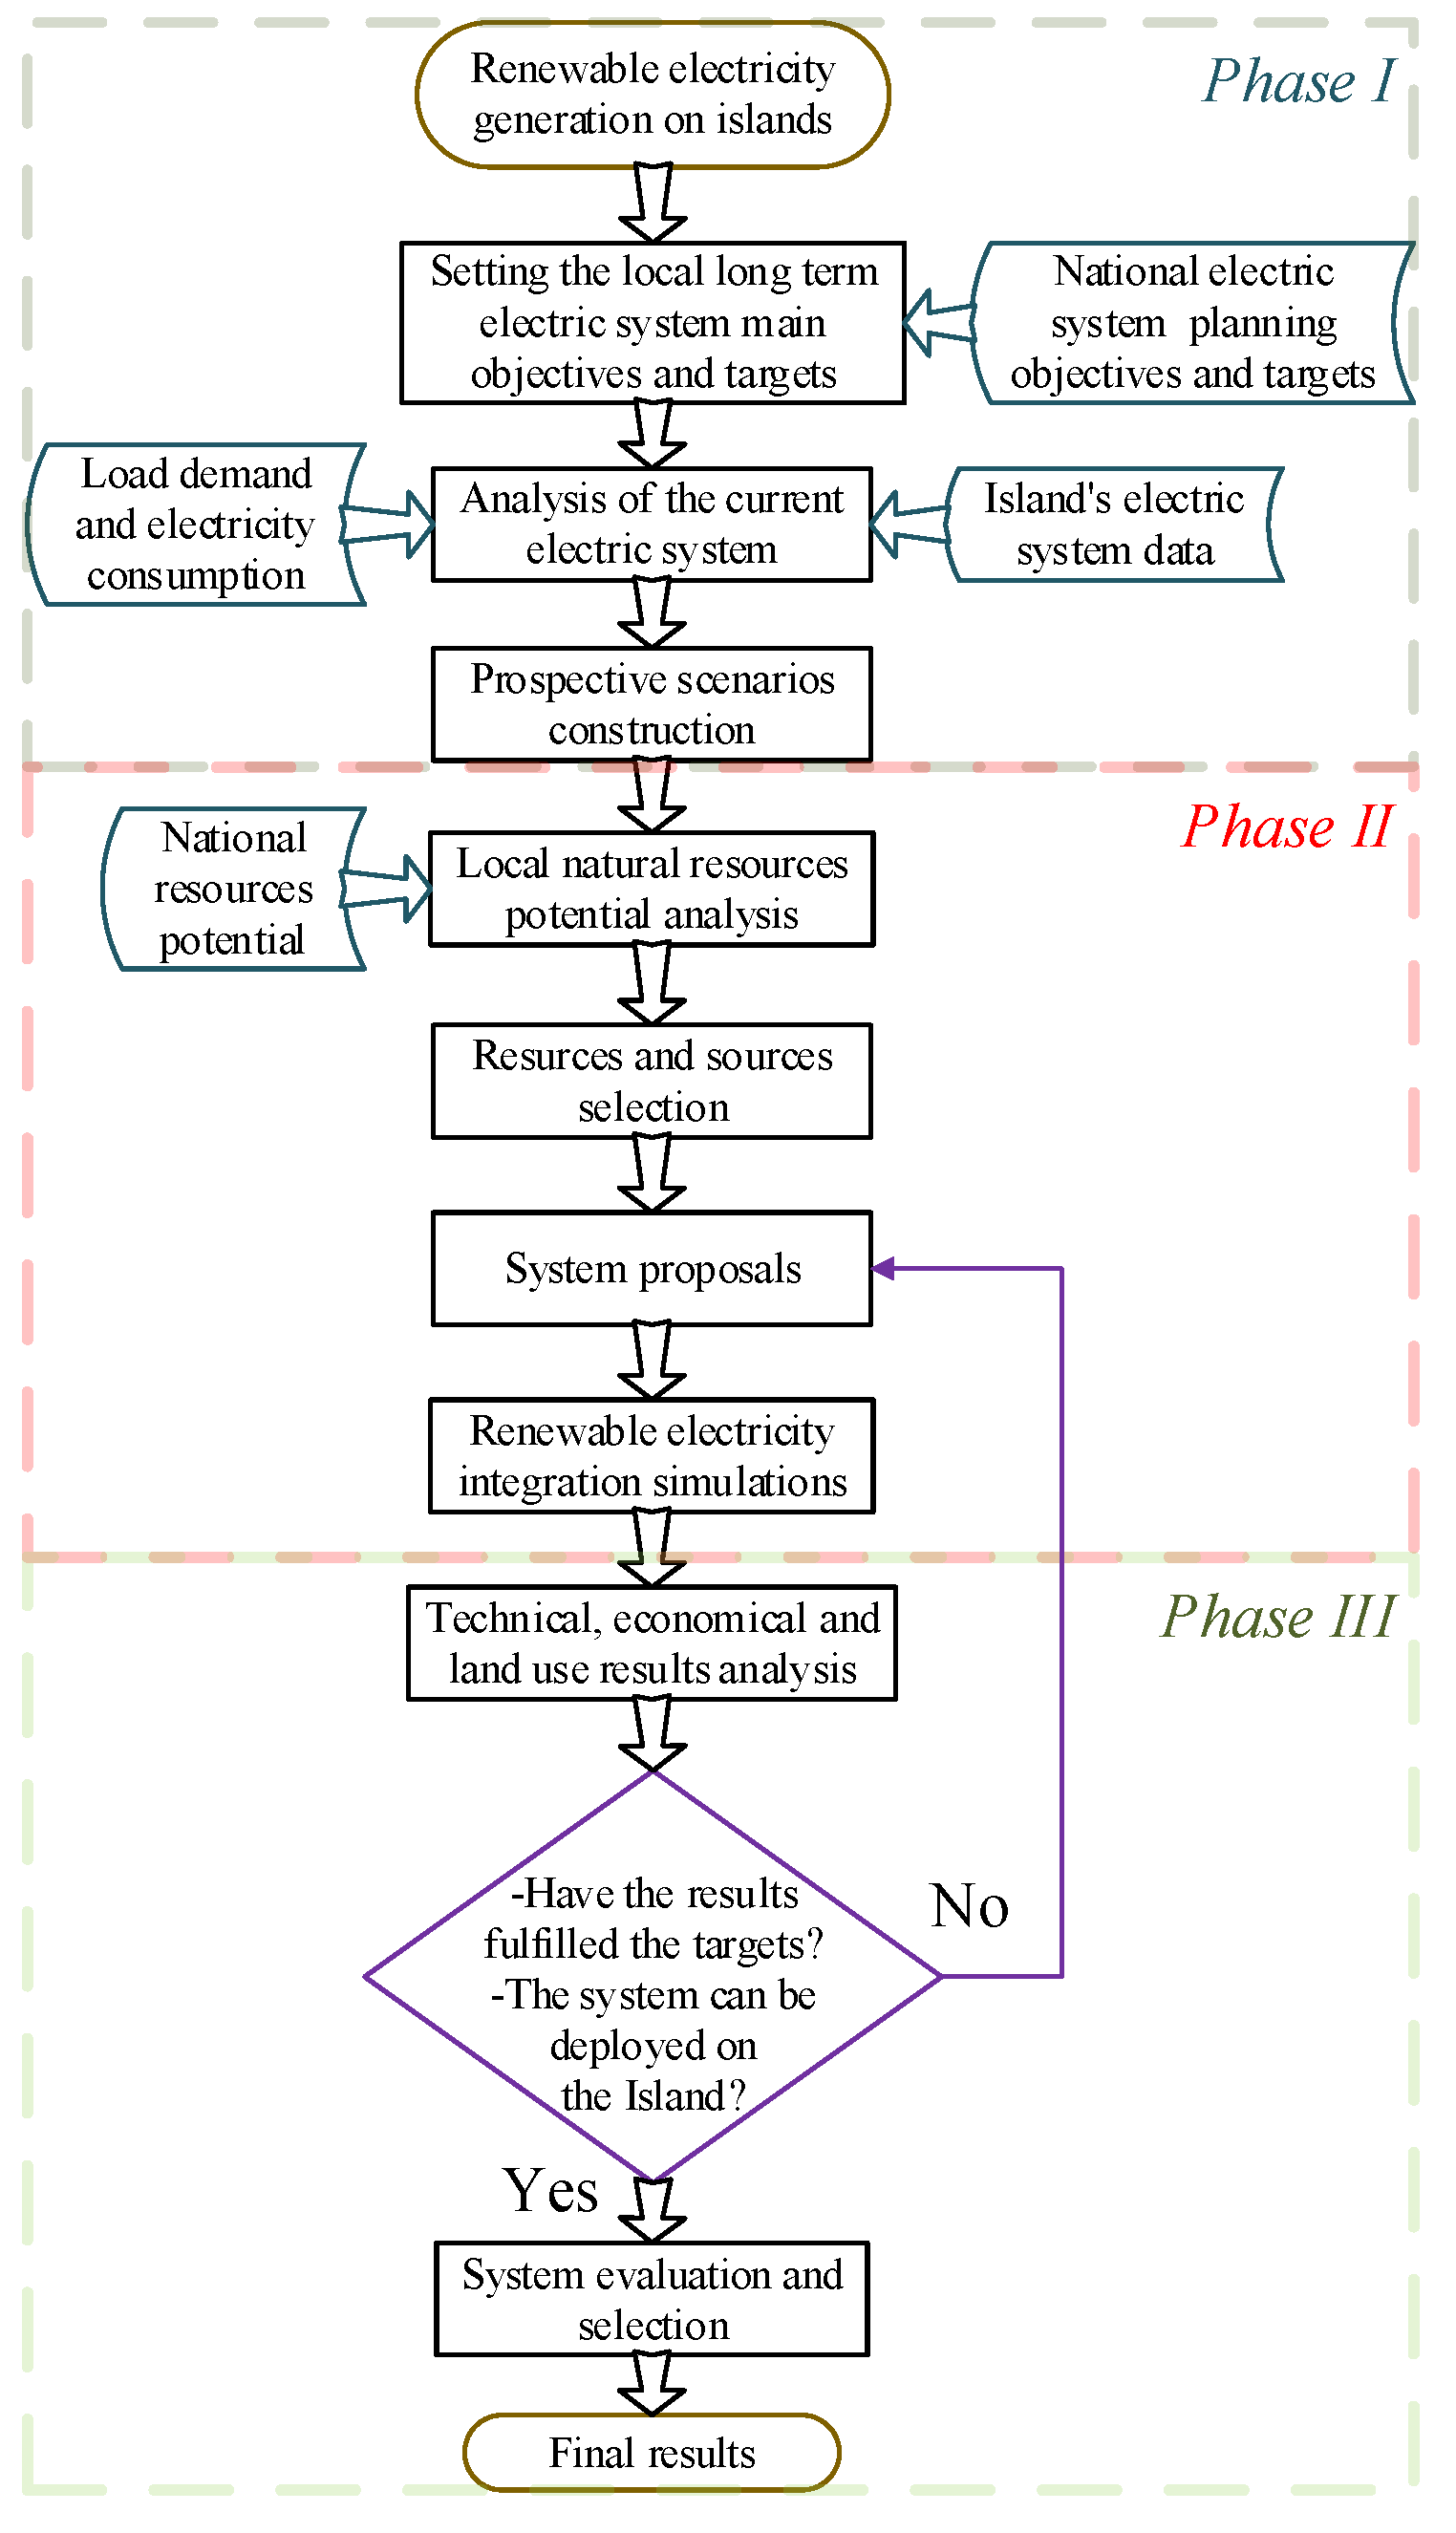
2. Methodology Plan for the Integration of Renewable Electricity Generation on Small Islands

The methodology used in this study is divided into three phases, as shown in Figure 1:

Phase I

A deterministic methodology is used to set up the long-term electrical system target to be achieved. Phase I is divided into:
  • Targets are set on the basis of national, regional or local energy planning objectives.
  • Development of the analysis of the island’s electrical system data.
  • The results from the electrical system data analysis are used to build the prospective scenarios.

Phase II

Time-series simulations using a deterministic methodology software tool and long-term statistical models are done. In order to compare different solutions, a number of system combinations of plants based on fossil fuel and renewable resources are analysed. Phase II is divided into:
  • Local resource potential is determined according to the natural resource potential analysis.
  • The renewable energy technologies are selected and proposed.
  • Selection of the proposed hybrid energy systems.
  • Integration of the hybrid system into the island’s electric grid is simulated through a deterministic methodology with a time-series simulation software tool.

Phase III

DSV and linear regression analysis models are used to determine the best hybrid system proposed on the basis of three factors: economical, technical and land-use. Phase III is divided into:
  • The results of the electrical system’s operation obtained from the optimization and simulation software tool are analysed through a decision support system.
  • DSV and linear regression models are used to evaluate and validate systems that fulfil the targets and can be deployed on the island.
  • The best resultant system is chosen to be installed.

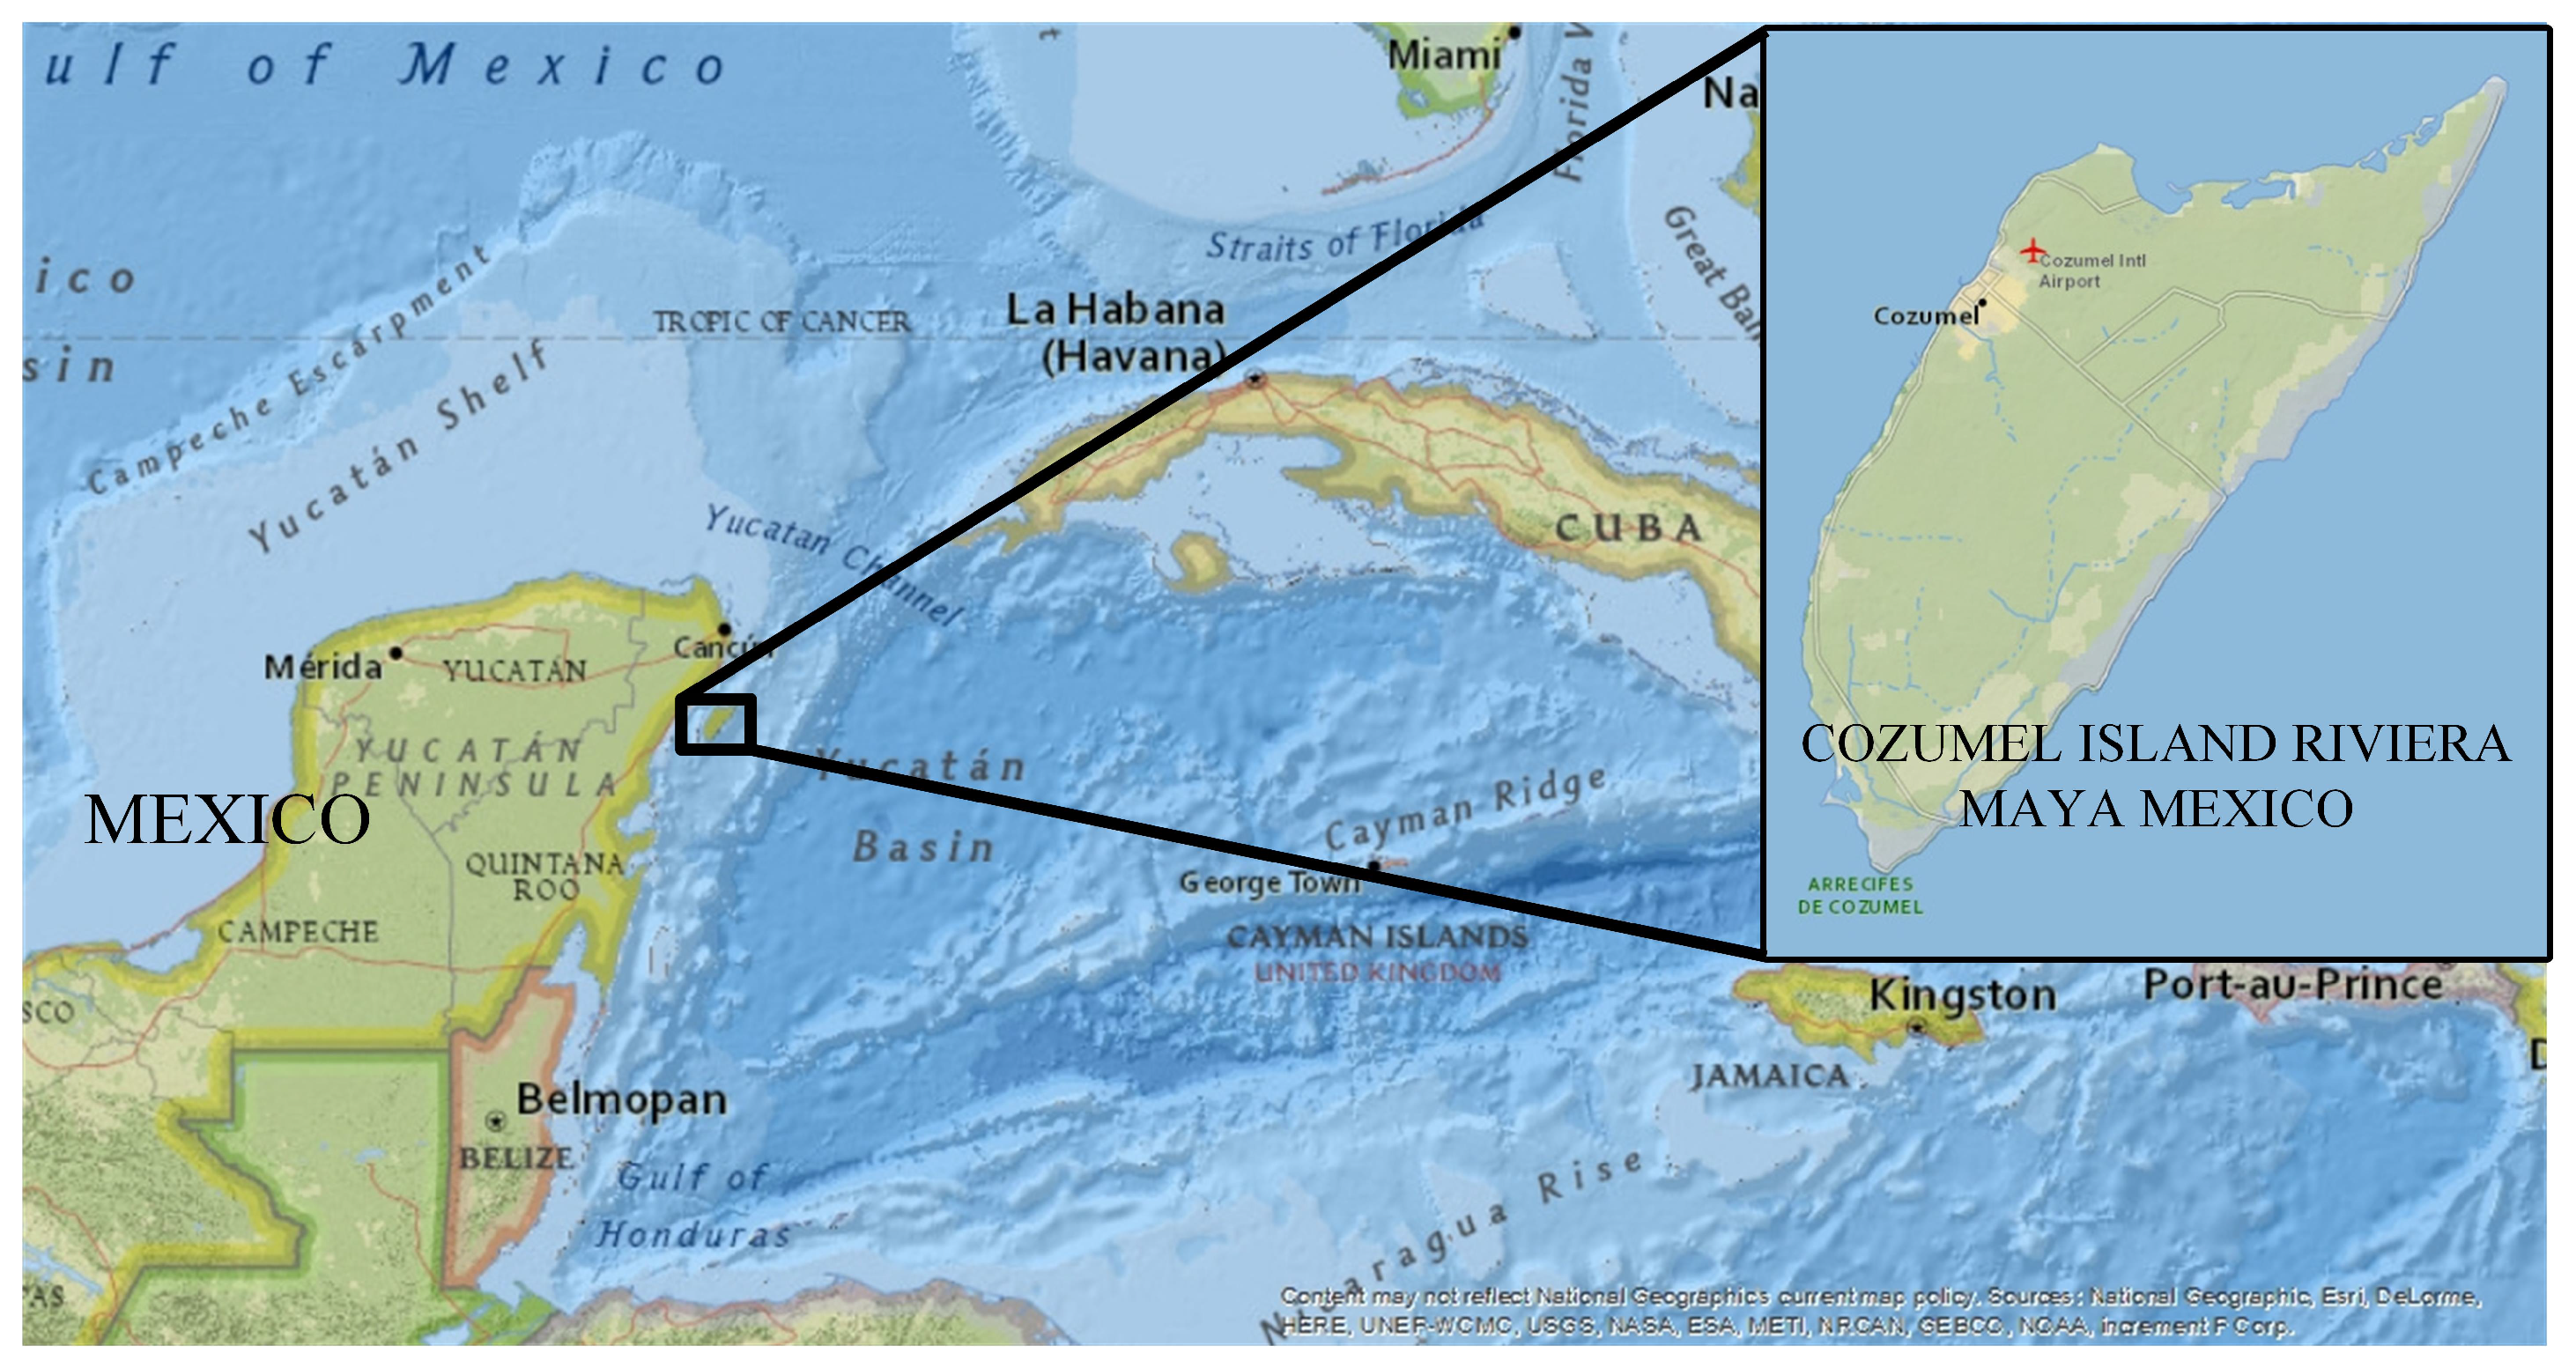
3. Study Case: Cozumel Island, Mexico

3.1. Mexico Energy and Electric Sector Status

The Total Primary Energy Supply (TPES) in 2014 was 13,699 Mtoe (million tonnes of oil equivalent), while the Global fuel consumption in 2014 was 9425 Mtoe; in the OECD, this fuel consumption was 3629 Mtoe in 2014, representing 38.5% of the total amount. The America’s OECD represented 51.8% of the OECD total consumption [35]. The America’s OECD was nearly 100% energy self-sufficient in 2014 [14]. The TPES is the energy production plus energy imports, minus energy exports, minus international bunkers, then plus or minus stock changes. For Mexico, in 2015, this TPES was 187.3 Mtoe, 0.37% lower than in 2014 [36].
In 2015, the energy indicator (ratio of output to gross domestic supply, (PJ/PJ)) in Mexico was 0.969. This means that the energy produced was −3.1% lower than the internal energy offered to supply the consumers’ activities. This value is −5.4% in relation to 2014. The national energy intensity in 2015 was 604.45 kJ/MX$ (3.9% lower than the previous year, 2014). This is the energy needed to produce one MX$ of the GDP [37]. The Human Development Index (HDI) in Mexico is very far away from the one that countries such as USA, Australia, Sweden, Japan, among others have. This indicator includes the total primary energy demand per capita, the population and the GDP per capita of each country [38].
In Mexico, from 2014 to 2015, the electricity consumption increased by 3.1%. At the end of 2014, the National Electric System (SEN is its Spanish acronym) had an electric power capacity of 65,452 MW installed. Meanwhile, at the end of 2015, this capacity was increased to 68,044 MW. The main technology to produce electricity through fossil fuels in 2015 was the combined cycle, which represented 49.29% of the total fossil fuel power generation capacity. On the other hand, the main technology to produce electricity through clean energy sources was Hydro power, which represented 64.82% of the total clean energy power generation capacity [39].
The maximum power demand and the electricity consumption will continue increasing, so it is necessary to increase the renewable power energy participation in the electricity sector in Mexico. To fulfil this electricity demand, an additional power capacity of 59,985.6 MW will be necessary by 2029. In total, 54.3% of this additional power capacity should be from clean energy sources and the remaining 45.7% from fossil fuel sources [40].
With the energy reform approved on 20 December 2013, a big step forward was made towards a competitive electric market in Mexico. The secondary laws that ensure the correct implementation of this energy reform were published on 11 August 2014. The Electric Industry Law (LIE is its Spanish acronym) defines the new electricity sector structure and the planning and control of the SEN [41].
The Mexican Government developed three future scenarios: (a) High Scenario; (b) Base Scenario; (c) Low Scenario. These three scenarios were carried out in the Development Program of the National Electric System 2016–2030 (PRODESEN is its Spanish acronym), taking the energy planning predictions in Mexico into consideration. These scenarios were made on the basis of the General Economic Policy Criteria for the Initiative of Income Law and the Federation Expenditure Budget Project (CGPE is its Spanish acronym) 2016. The macroeconomic targets and strategies that are included in these documents are the power demand, the electricity consumption, the fuel prices and the GDP among others [39].

3.2. Renewable Energy in Mexico

Mexico participated in the global renewable energy offer of 15.2 Mtoe in 2013. On average, 9% of OECD countries’ energy sector consumption was through renewable sources [42]. The global participation of the renewable energy sources in the energy sector was 13.5% in 2013.
From the 70,000 MW of total power electricity generation capacity installed in Mexico, 19,000 MW are of non-fossil fuel technology [43]. Notwithstanding that Hydro power represented 64.82% of the total power capacity of clean sources in electricity generation, only 20.34% of the total electricity in 2015 was generated through these technologies [39]. To increase the RE participation, the Energy Transition Law (LTE is its Spanish acronym) demands a clean energy participation of 25% by 2018, 30% by 2021 and 35% by 2024 [44]. As a result of this clean energy increase, the CO 2 emission factor in 2000, of 0.604 tCO 2 /MWh, must be reduced by 30% by 2020 and 50% by 2050 [45]. In the Transition Strategy to Promote the Use of Cleaner Fuels and Technologies in 2016 (Estrategia de Transición para Promover el Uso de Tecnologías y Combustibles más Limpios), three targets are indicated for renewable electric generation: 35% by 2024, 37.7% (rounding up to 38%) by 2030 and 50% by 2050 [46]. Table 2 is a summary of these results and includes the targets of the RE objective: (a) generation of electricity; (b) power capacity installed and (c) CO 2 factor emission reduction. RE targets are the same regardless of the scenario under consideration.

3.3. Electricity in the Peninsular Area

The Peninsular area is one of the seven electric regional controls in the SIN [54]. The States of Yucatan, Campeche and Quintana Roo (where Cozumel Island is located) are in the Peninsular region control. The previously identified National programs included forward-looking targets in the electricity sector for the Peninsular Area. The annual average growth rate for the Peninsular Area from 2016 to 2030 is indicated in Table 3, showing the three scenarios [39].

3.4. Cozumel Island

Cozumel Island is located in the Quintana Roo State. It has warm tropical weather throughout the year and is part of the Occidental Caribbean Sea (see Figure 2). With a surface area of 647 km 2 , it had a population of 86,415 inhabitants in 2015 [55] with a density of 134 inhabitants per km 2 . It is part of the second largest coral reef in the world, after the great Australian coral reef. Cozumel Island and Quintana Roo State have an average annual temperature of 26 ° C. The coolest months are December, January and February with temperatures under 22 ° C. According to the Köppen–Geiger climatic classification modified by García, there are warm, sub-humid climate conditions with intermediate rainfall. A warm, humid climate with abundant rainfall in the summer is found on Cozumel Island [56].

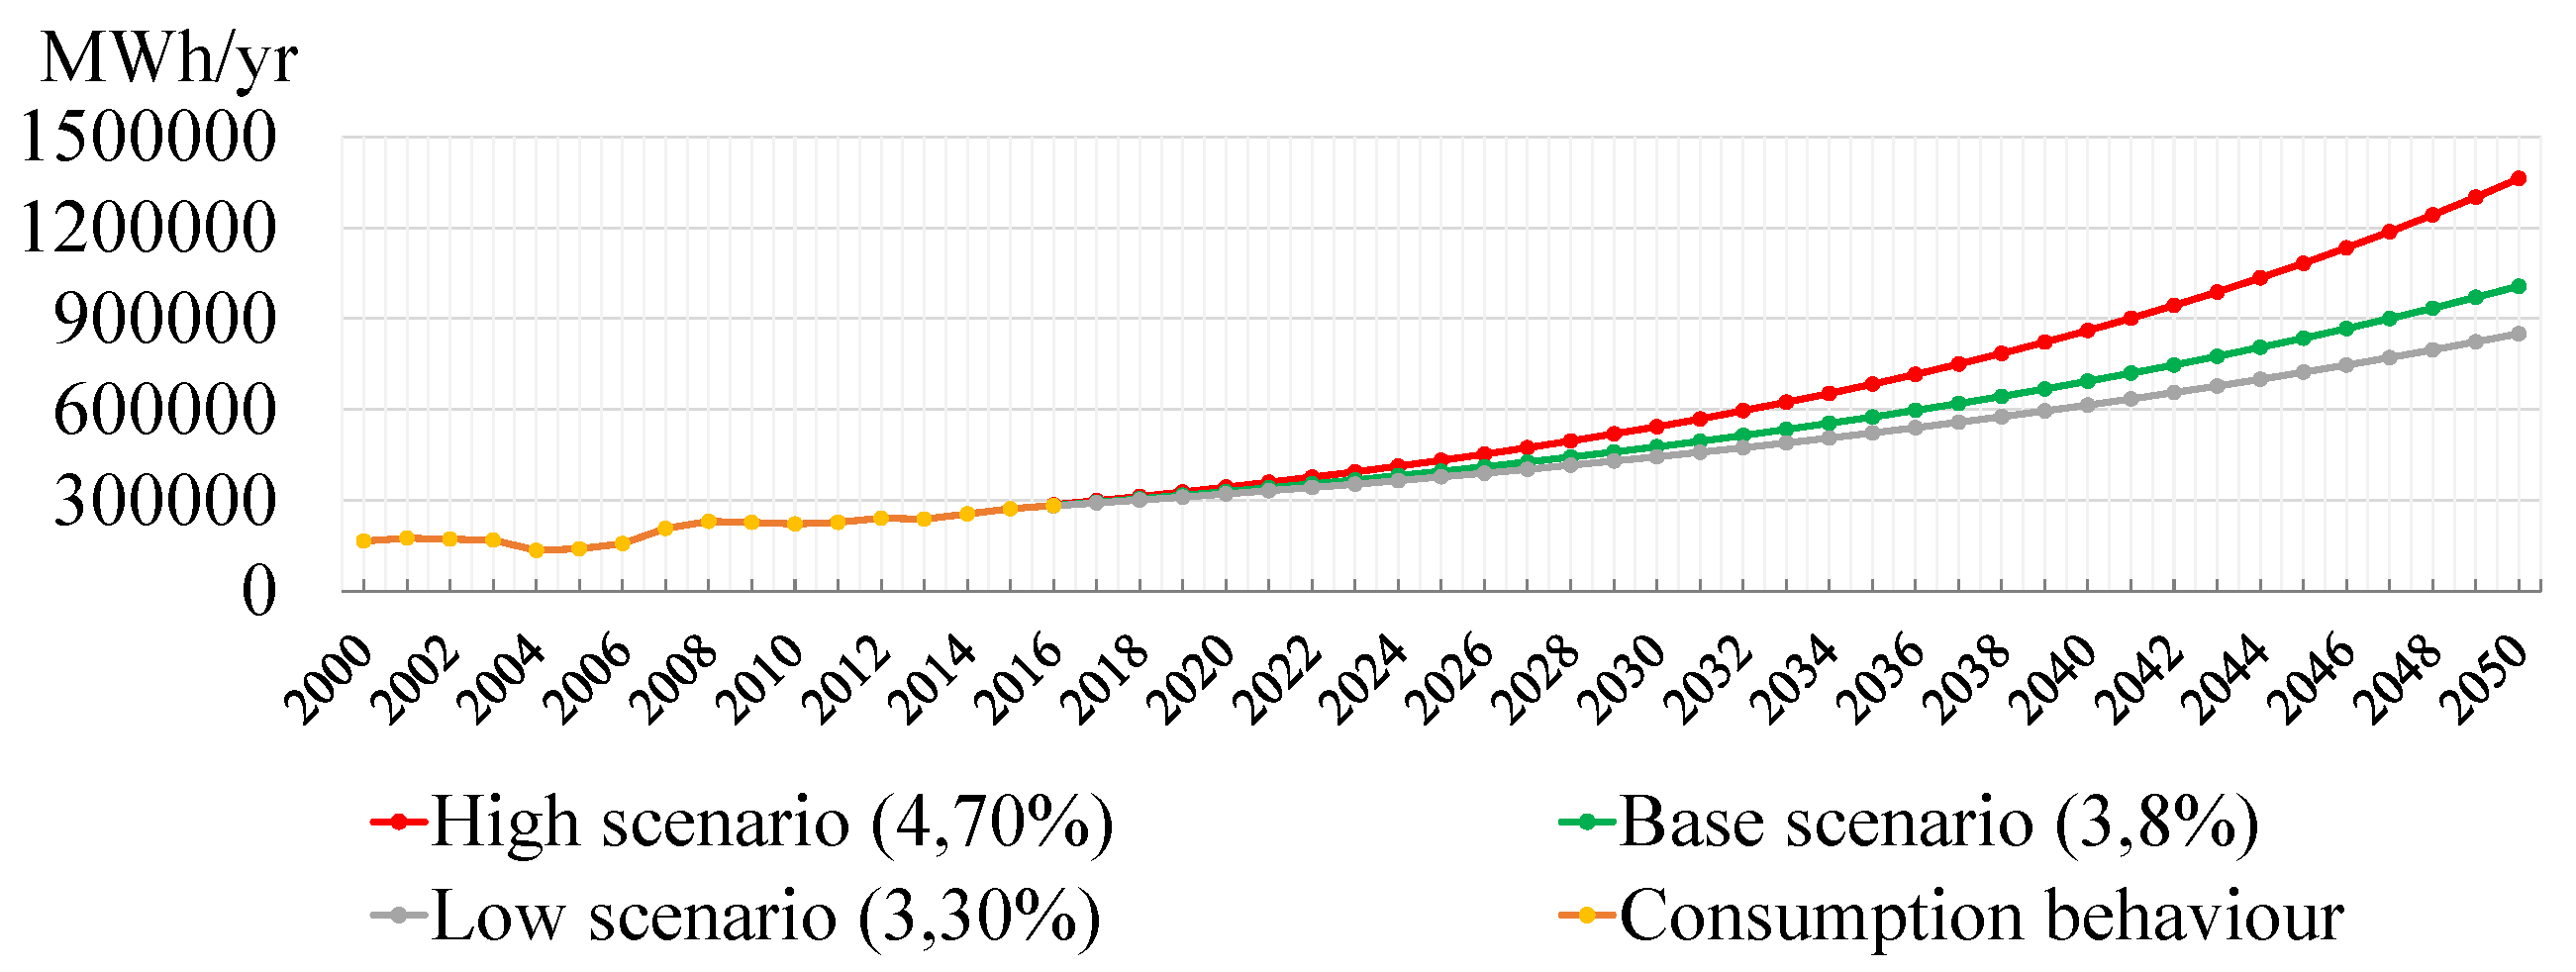
3.4.1. Setting the Long-Term Electric System Target

The energy planning scenarios developed in this study are based on the data from: PSE [40]; PRODESEN [39]; The Special Program for Exploitation of Renewable Energies (PEAER is its Spanish acronym) [47]; the Climate Change General Law (LGCC is its Spanish acronym) [45]; LTE [44]; National Strategy of Climate Change (ENCC is its Spanish acronym) [48]; Energy Sectorial Program (PROSENER is its Spanish acronym) [49]; the Renewable Energy Prospective (PER is its Spanish acronym) [42]; National Strategy of Energetic Transition and Sustainable Exploitation of Energy (ENTEASE is its Spanish acronym) [50]; LIE, National Strategy of Energy (ENE is its Spanish acronym) [51]; Special Program of Climate Change (PECC is its Spanish acronym) [52]; National Program for the Sustainable Exploitation of Energy (PRONASE is its Spanish acronym) [53]; and the Transition Strategy to Promote the Use of Cleaner Fuels and Technologies of 2016 [46].
For Cozumel Island, the target is to reduce the fossil fuel consumption through electricity production from RETs to cover 50% of all electric consumption by 2050. This target is within the range proposed by [57,58]: from 15% (Antigua and Barbuda) to 100% (Dominica) for the Caribbean Islands. Therefore, the methodology used in this case study can be applied to other islands or to the SIDS.
The prospective growth rates for the electricity sector on the Island will be the same as those for the Peninsular region control, as shown in Table 3. According to this growth indicator for the three scenarios, forecasts for power demand and electrical consumption were made. These predictions were made to achieve the targets given in Table 2. The prospective electricity consumption scenarios from 2016 to 2050 on Cozumel Island (see Figure 3) were obtained from the prospective growth rates indicated in Table 3 and from the information specified in Figure 4. The prospective scenarios from 2016 to 2050 on Cozumel Island in power demand (see Figure 5) were obtained from the prospective growth rates indicated in Table 3 and from the information specified in Figure 6.

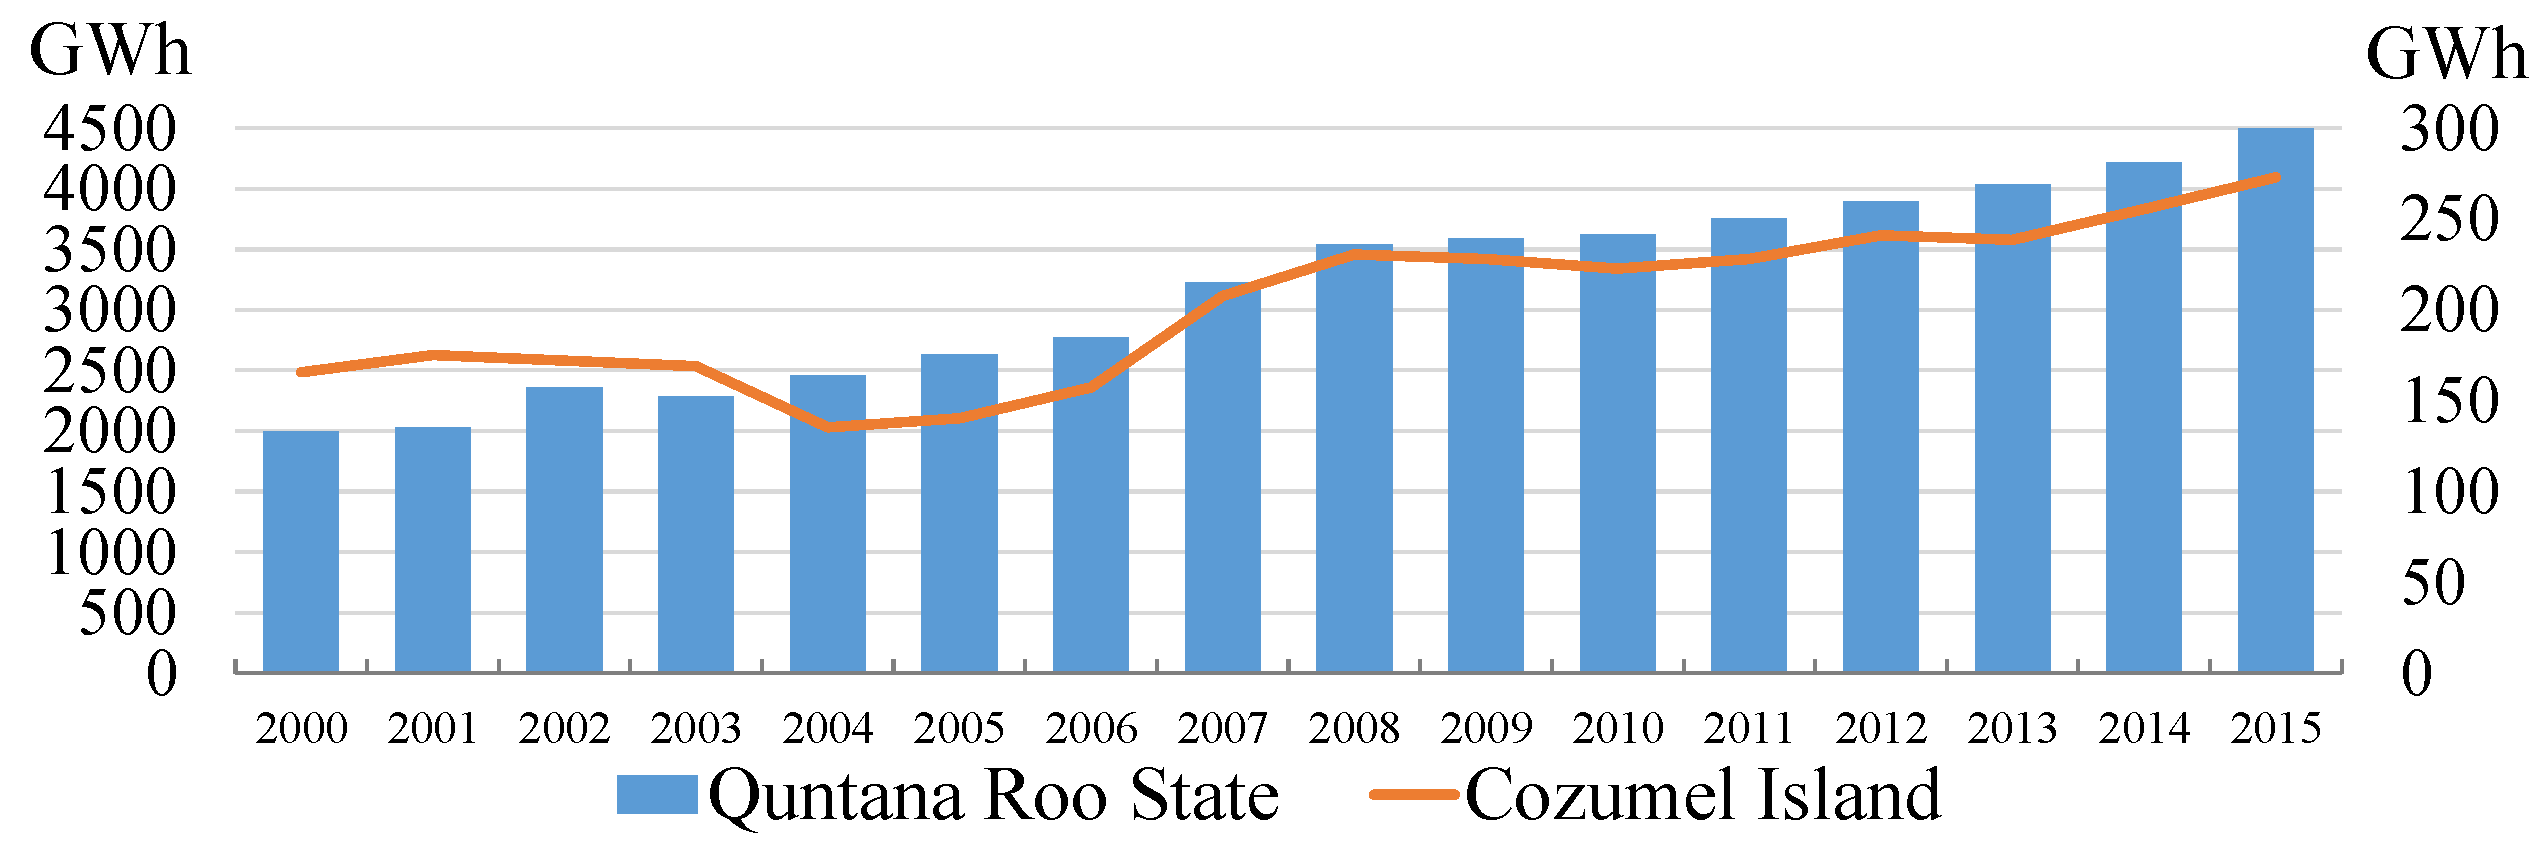
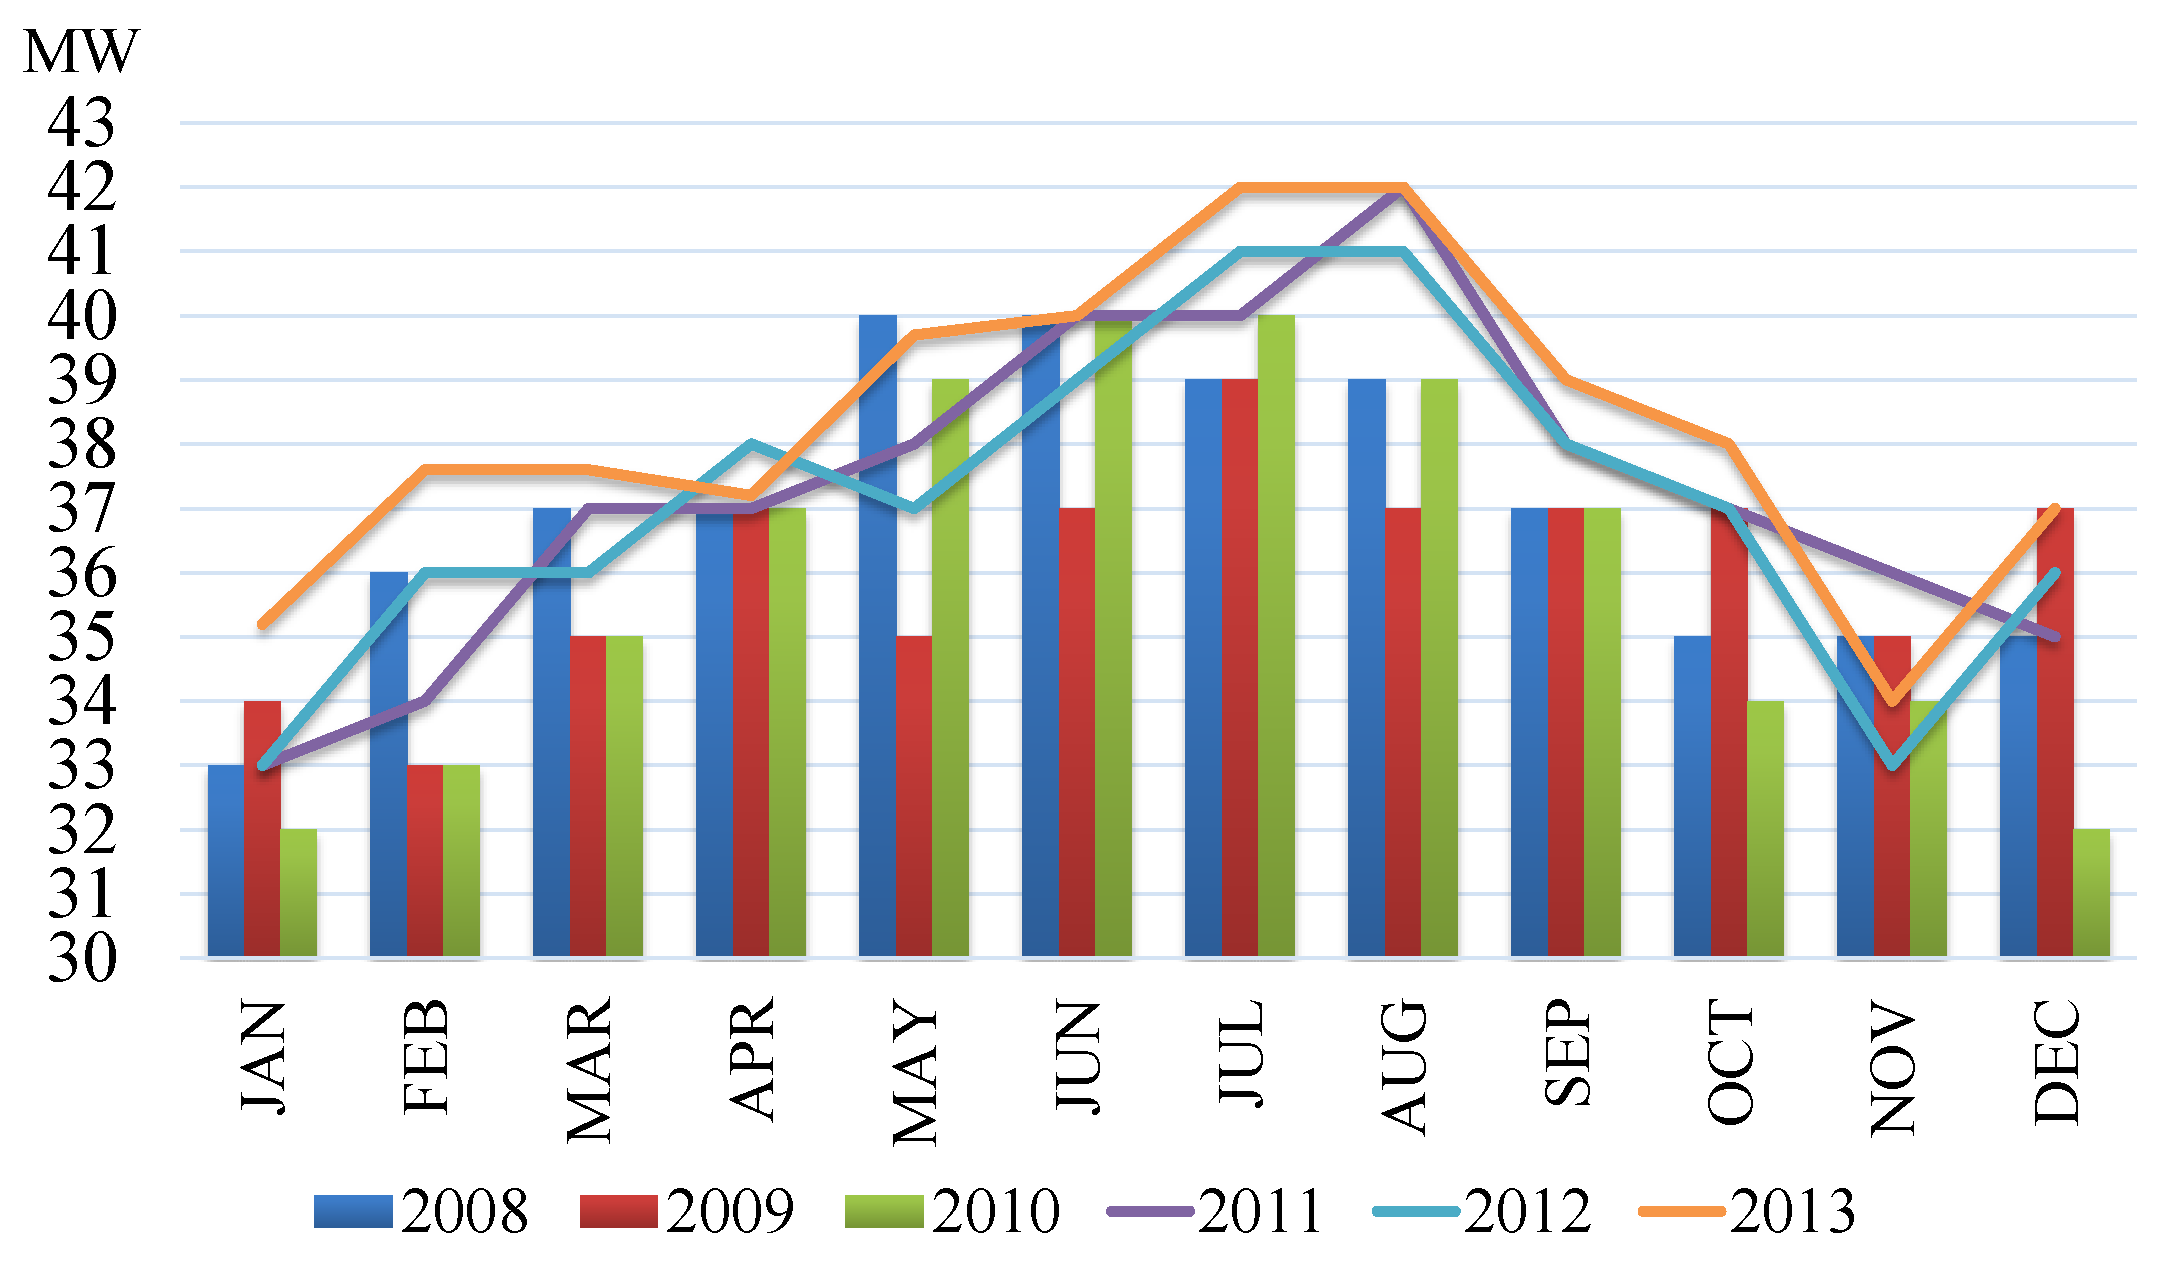
3.4.2. Analysis of the Current Electric System

Currently, the electricity generation on the Island depends solely on diesel turbogas machines (single cycle gas turbines burning diesel). There are three diesel turbogas machines: (1) W Diesel 19.2 MVA, (2) M Diesel 17.5 MVA and (3) GE Diesel 45.2 MVA. These machines are used to support the peak demand on the Island, and in some cases to supply part of the electricity demand on the North part of the State. The Island has a submarine interconnection cable to provide the electricity needed. In case of a wire fault, the diesel turbogas machines support the power demand. Through this submarine cable connection from the Riviera Maya node to the Cozumel node, the electricity can flow in both directions.
The maximum power demand fluctuates between 41 MW in 2011 and 44 MW in 2014 (see Figure 6). The maximum power generated on the Island covers the electric demand, but sometimes the electricity excess production flows to the main land (Riviera Maya node) [59]. The electricity consumption on the Island in 2015 was 272.97 GWh, 6.77% higher in regard to 2014 [37]. Figure 4 indicates the electricity consumption behavior from 2000 to 2015 [59,60].
The hourly power demand seasonal profiles for Cozumel Island were based on the information from [39,40,55,59,60]. This information will be used in the hourly electrical operation simulations of the electrical grid. This way, the projections of maximum power demand and electricity consumption were developed from 2016 to 2050.

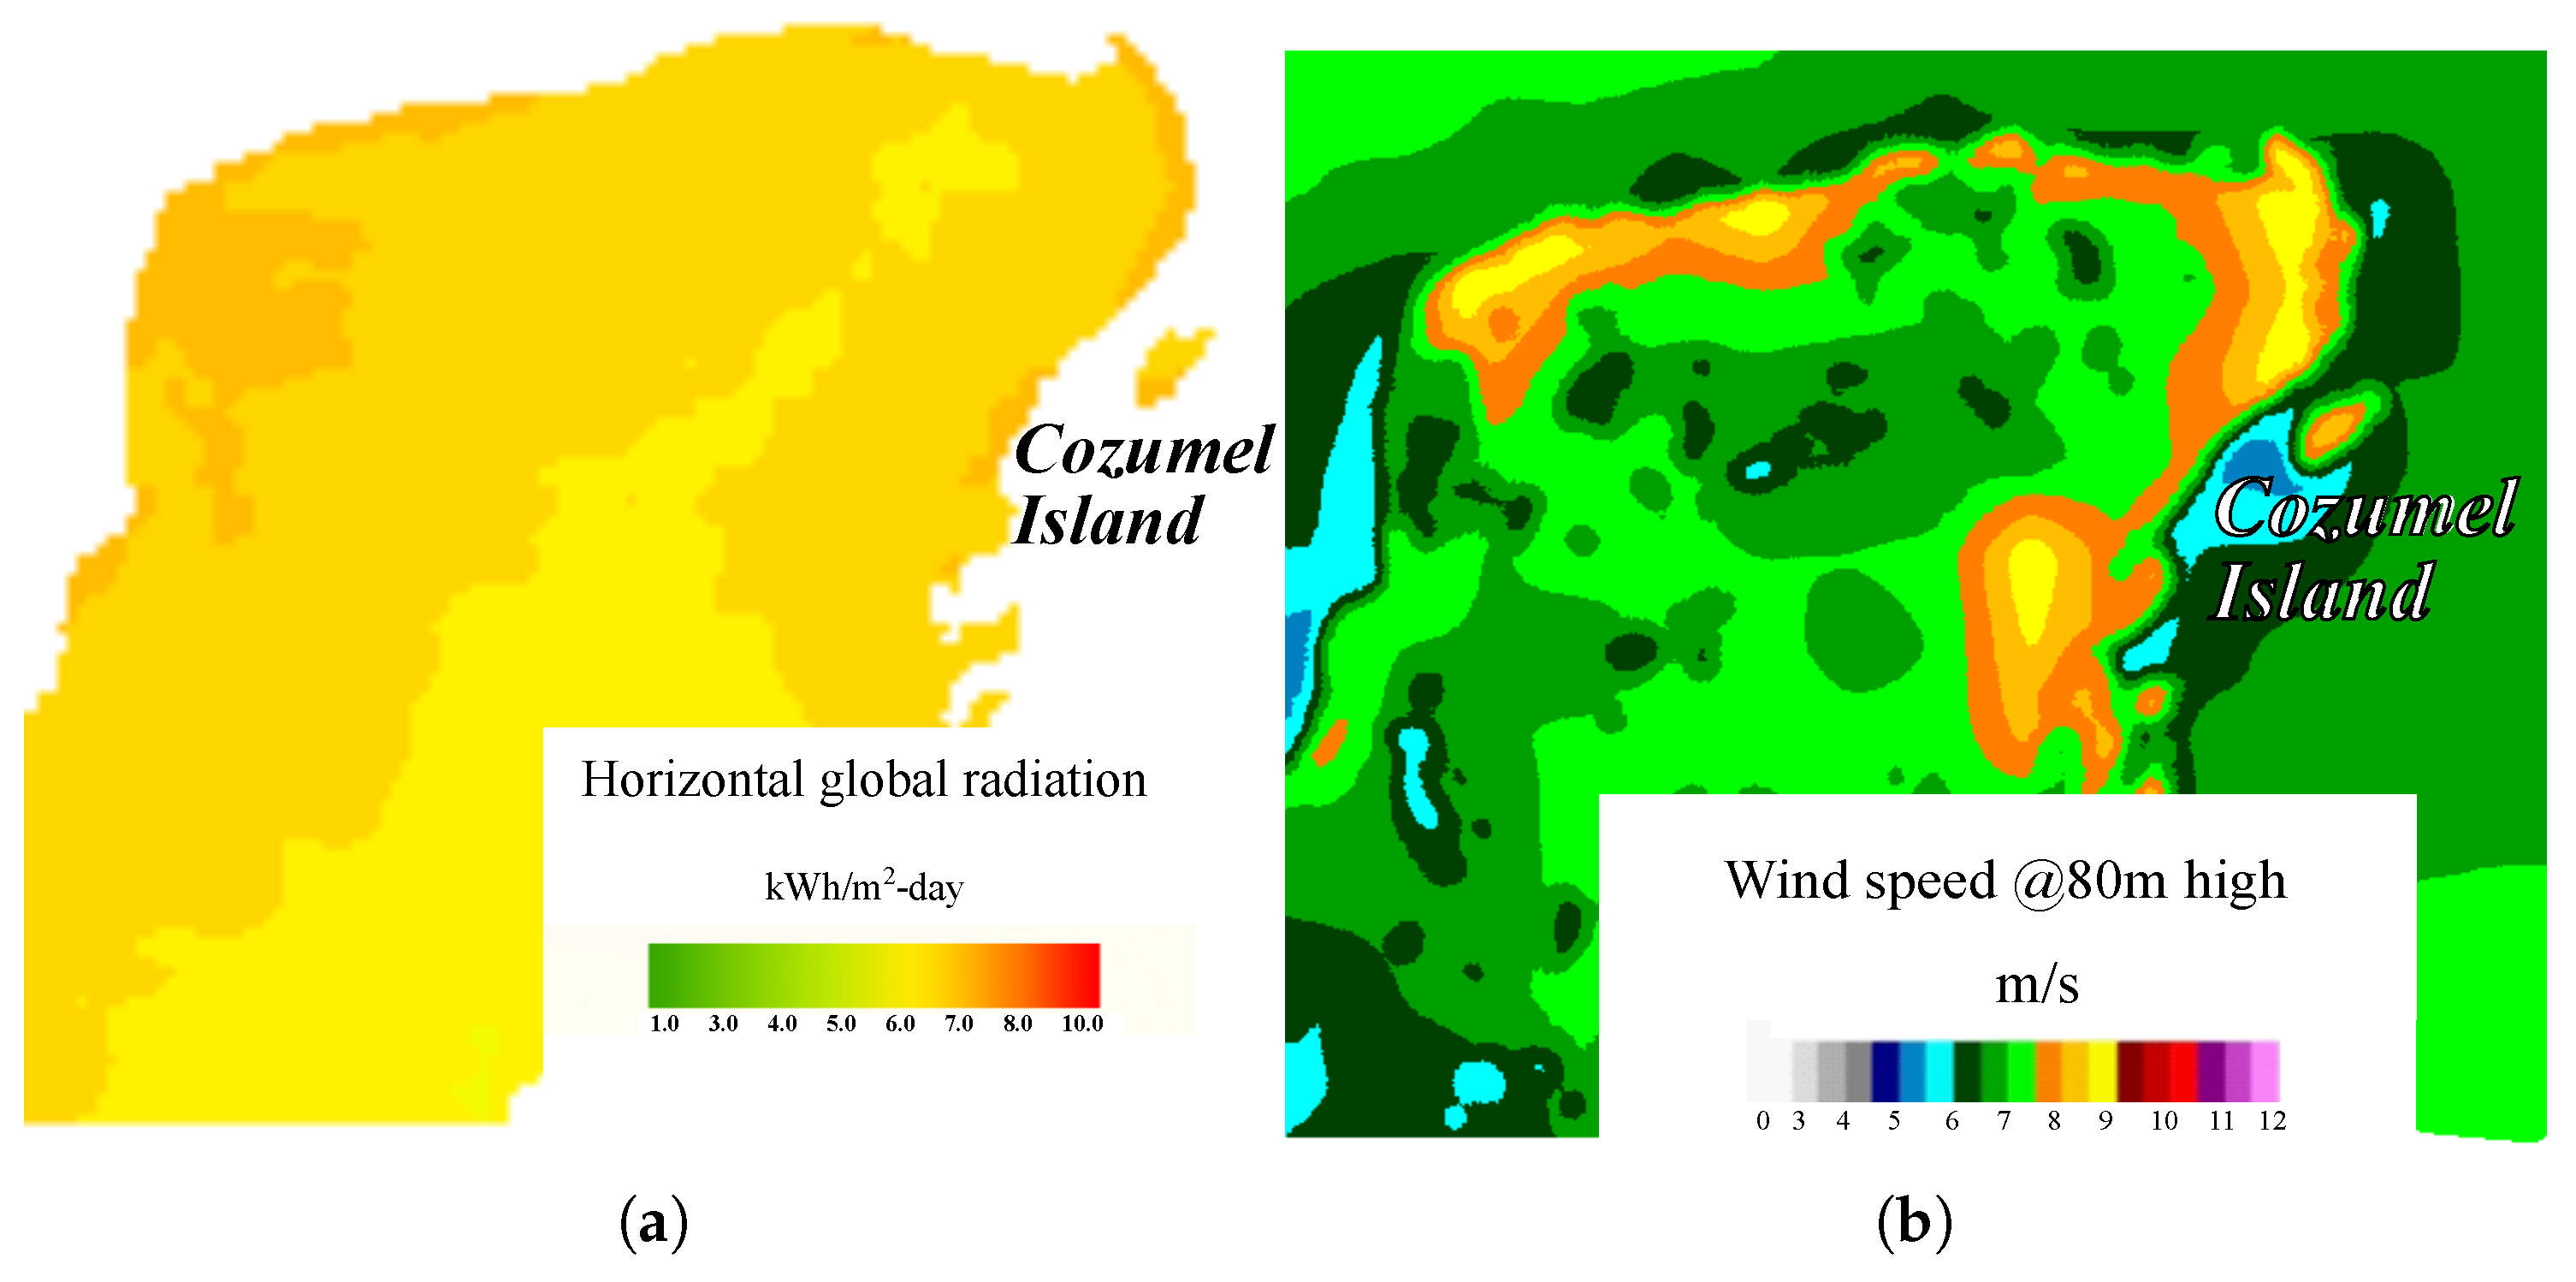
3.4.3. RE Potential on Cozumel Island

The RE potential in the Yucatan Peninsula and Cozumel Island was obtained from the INERE [61] and CONABIO [62] Website tool through a Geographic Information System (GIS), from the RES statistical and geographic database. Figure 7a,b show the Horizontal global radiation and the wind speed @80m, respectively, of the RE resources’ potential on the Yucatan Peninsula and Cozumel Island. According to this information of the RE resources’ potential, PV and Wind technologies have been selected to develop this potential on the island.

3.4.4. Renewable Energy Sources Selection

The environmental impact of land use in the selection of RETs is important due to the damage that can affect the selected site. Protected natural areas play a major role in the restrictions of RE sites [63]. Multiple arrangements of the RETs selected in the previous subsection have been considered in this study, on the basis of a minimum land impact that does not represent an environmental risk. This includes on-shore and off-shore wind combined with/without PV on unused land on the Island (see Table 4). The land where these systems can be deployed is common land, which has already been impacted by livestock and agricultural uses, but to this day is idle land. Cozumel common land covers 145,068 Hectares (Ha). Of this surface area, 15,347 Ha are for agricultural use and 129,721 Ha are unused land [64]. This unused land is not entirely idle land. It is divided into many smallholdings. Therefore, in order to impact the minimum quantity of land used for each system and to achieve the targets indicated, twelve different system proposals were selected. The use of off-shore turbines in combination with on-shore and/or PV will be considered (see Table 4).
Figure 8 shows a preliminary feasible option for the 5 Ha of land surface: a combination of 2, 2.5 and 3 MW on-shore wind turbines with 333.33 kW of PV. The size has been agreed between owners and local agrarian authorities, taking into account external restrictions such as land used for the production of drinkable water and other agricultural activities. In this land size, and to avoid wind turbulence from the wooded area of the jungle (8–10 m tree high), the minimum distance and the surface roughness length have been considered [65]. To avoid shadowing, due to the position of the sun on the horizon in the PV panels area, the minimum distance from obstacles or trees has also been considered. Figure 8 represents a basic scheme of the land size available for each PV-Wind combination. It does not mean that this scheme is a restricted surface configuration to be applied.

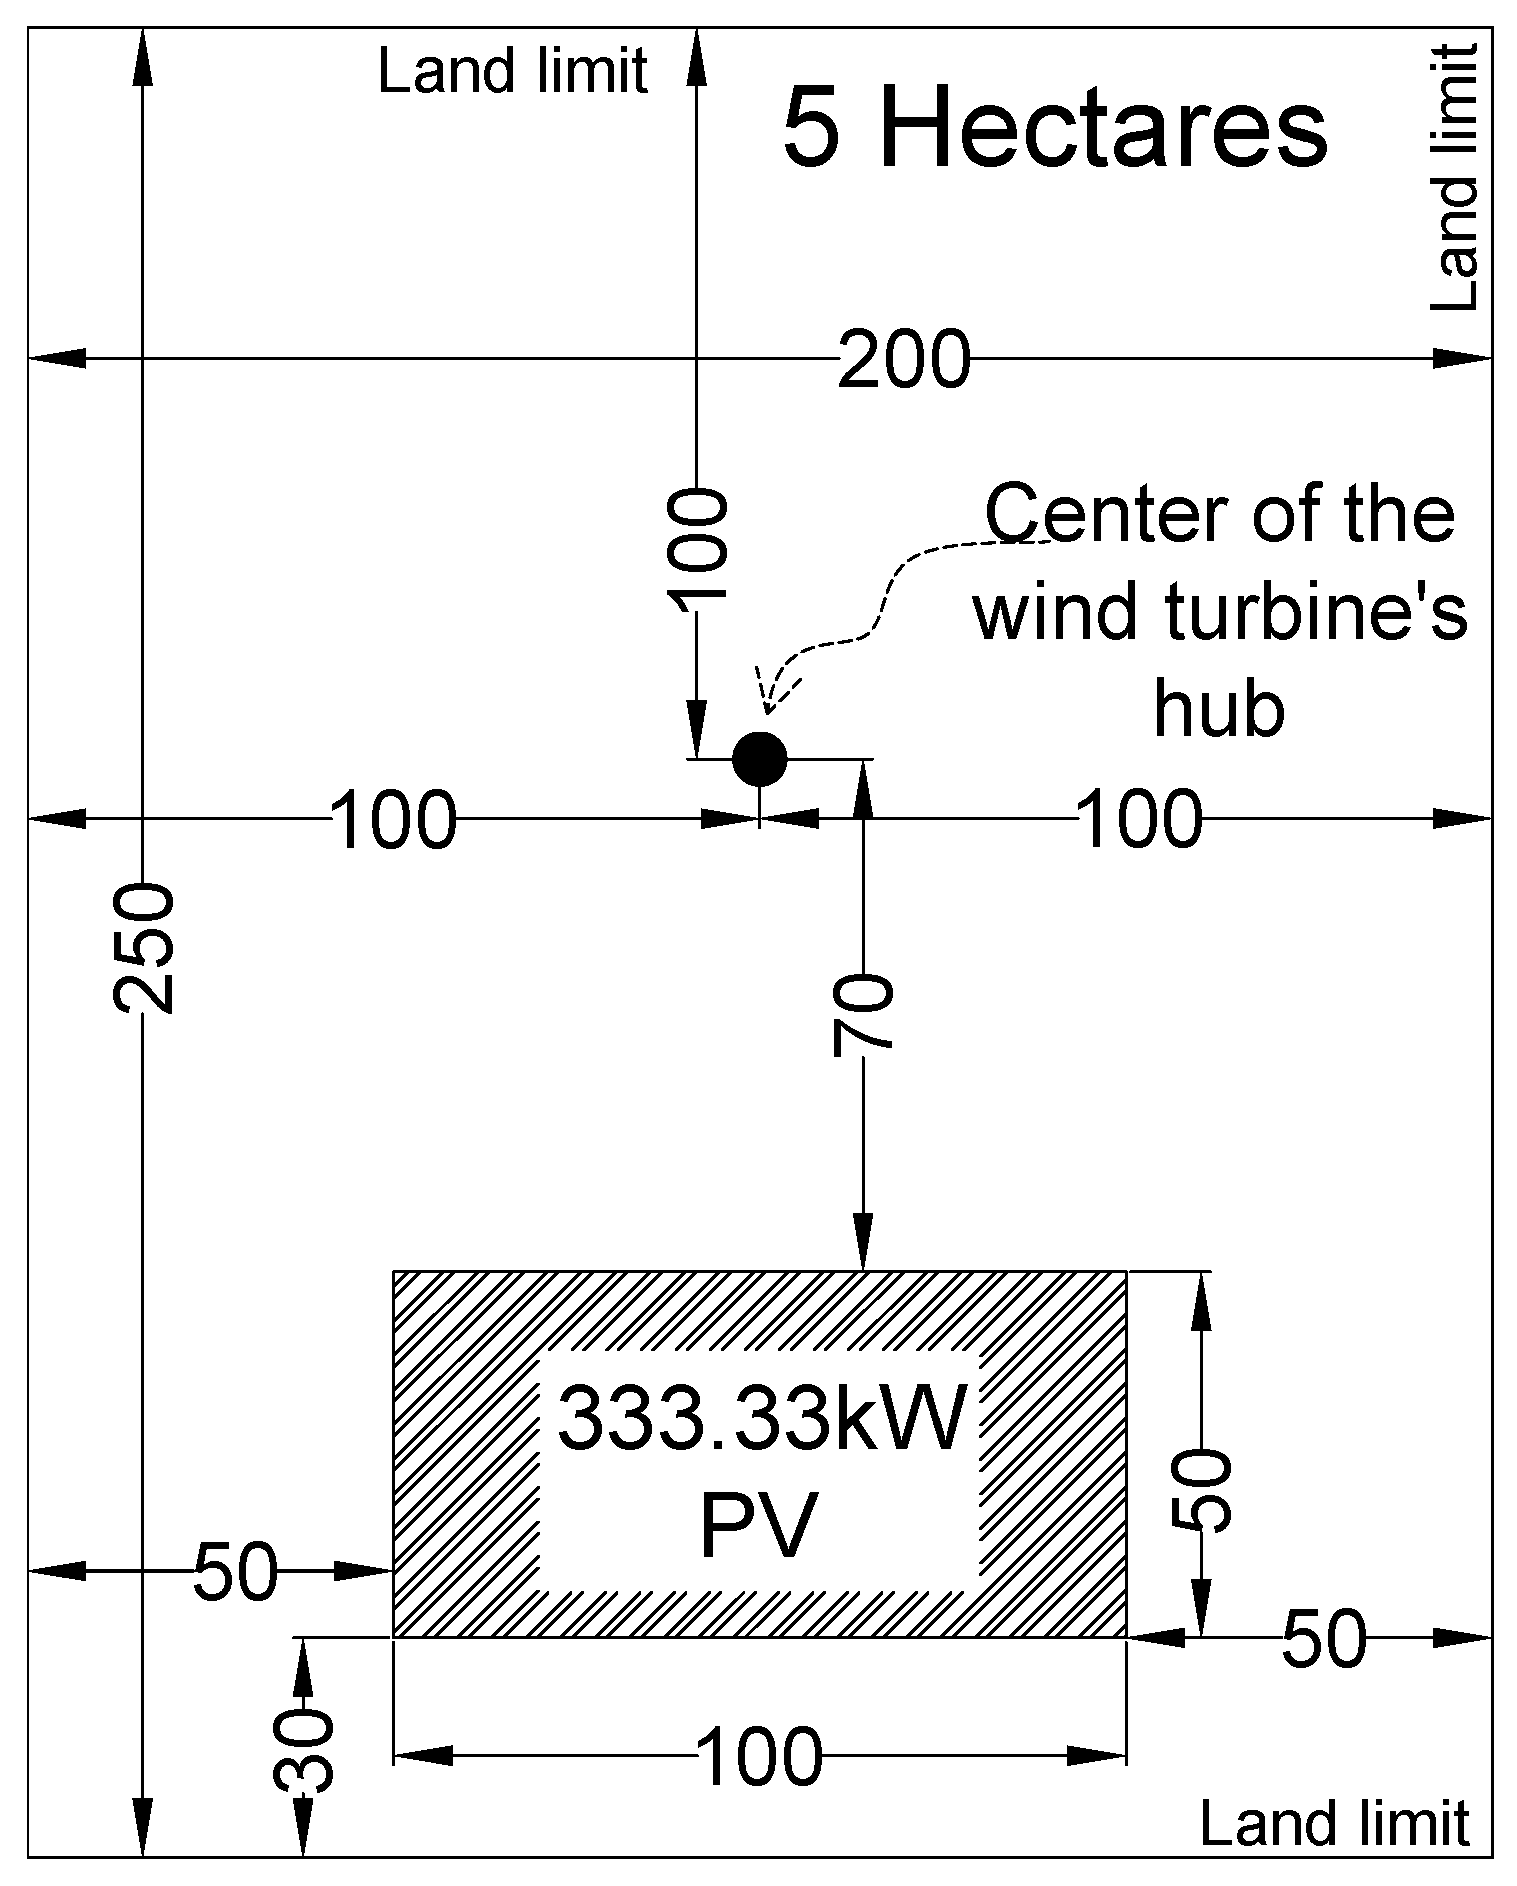
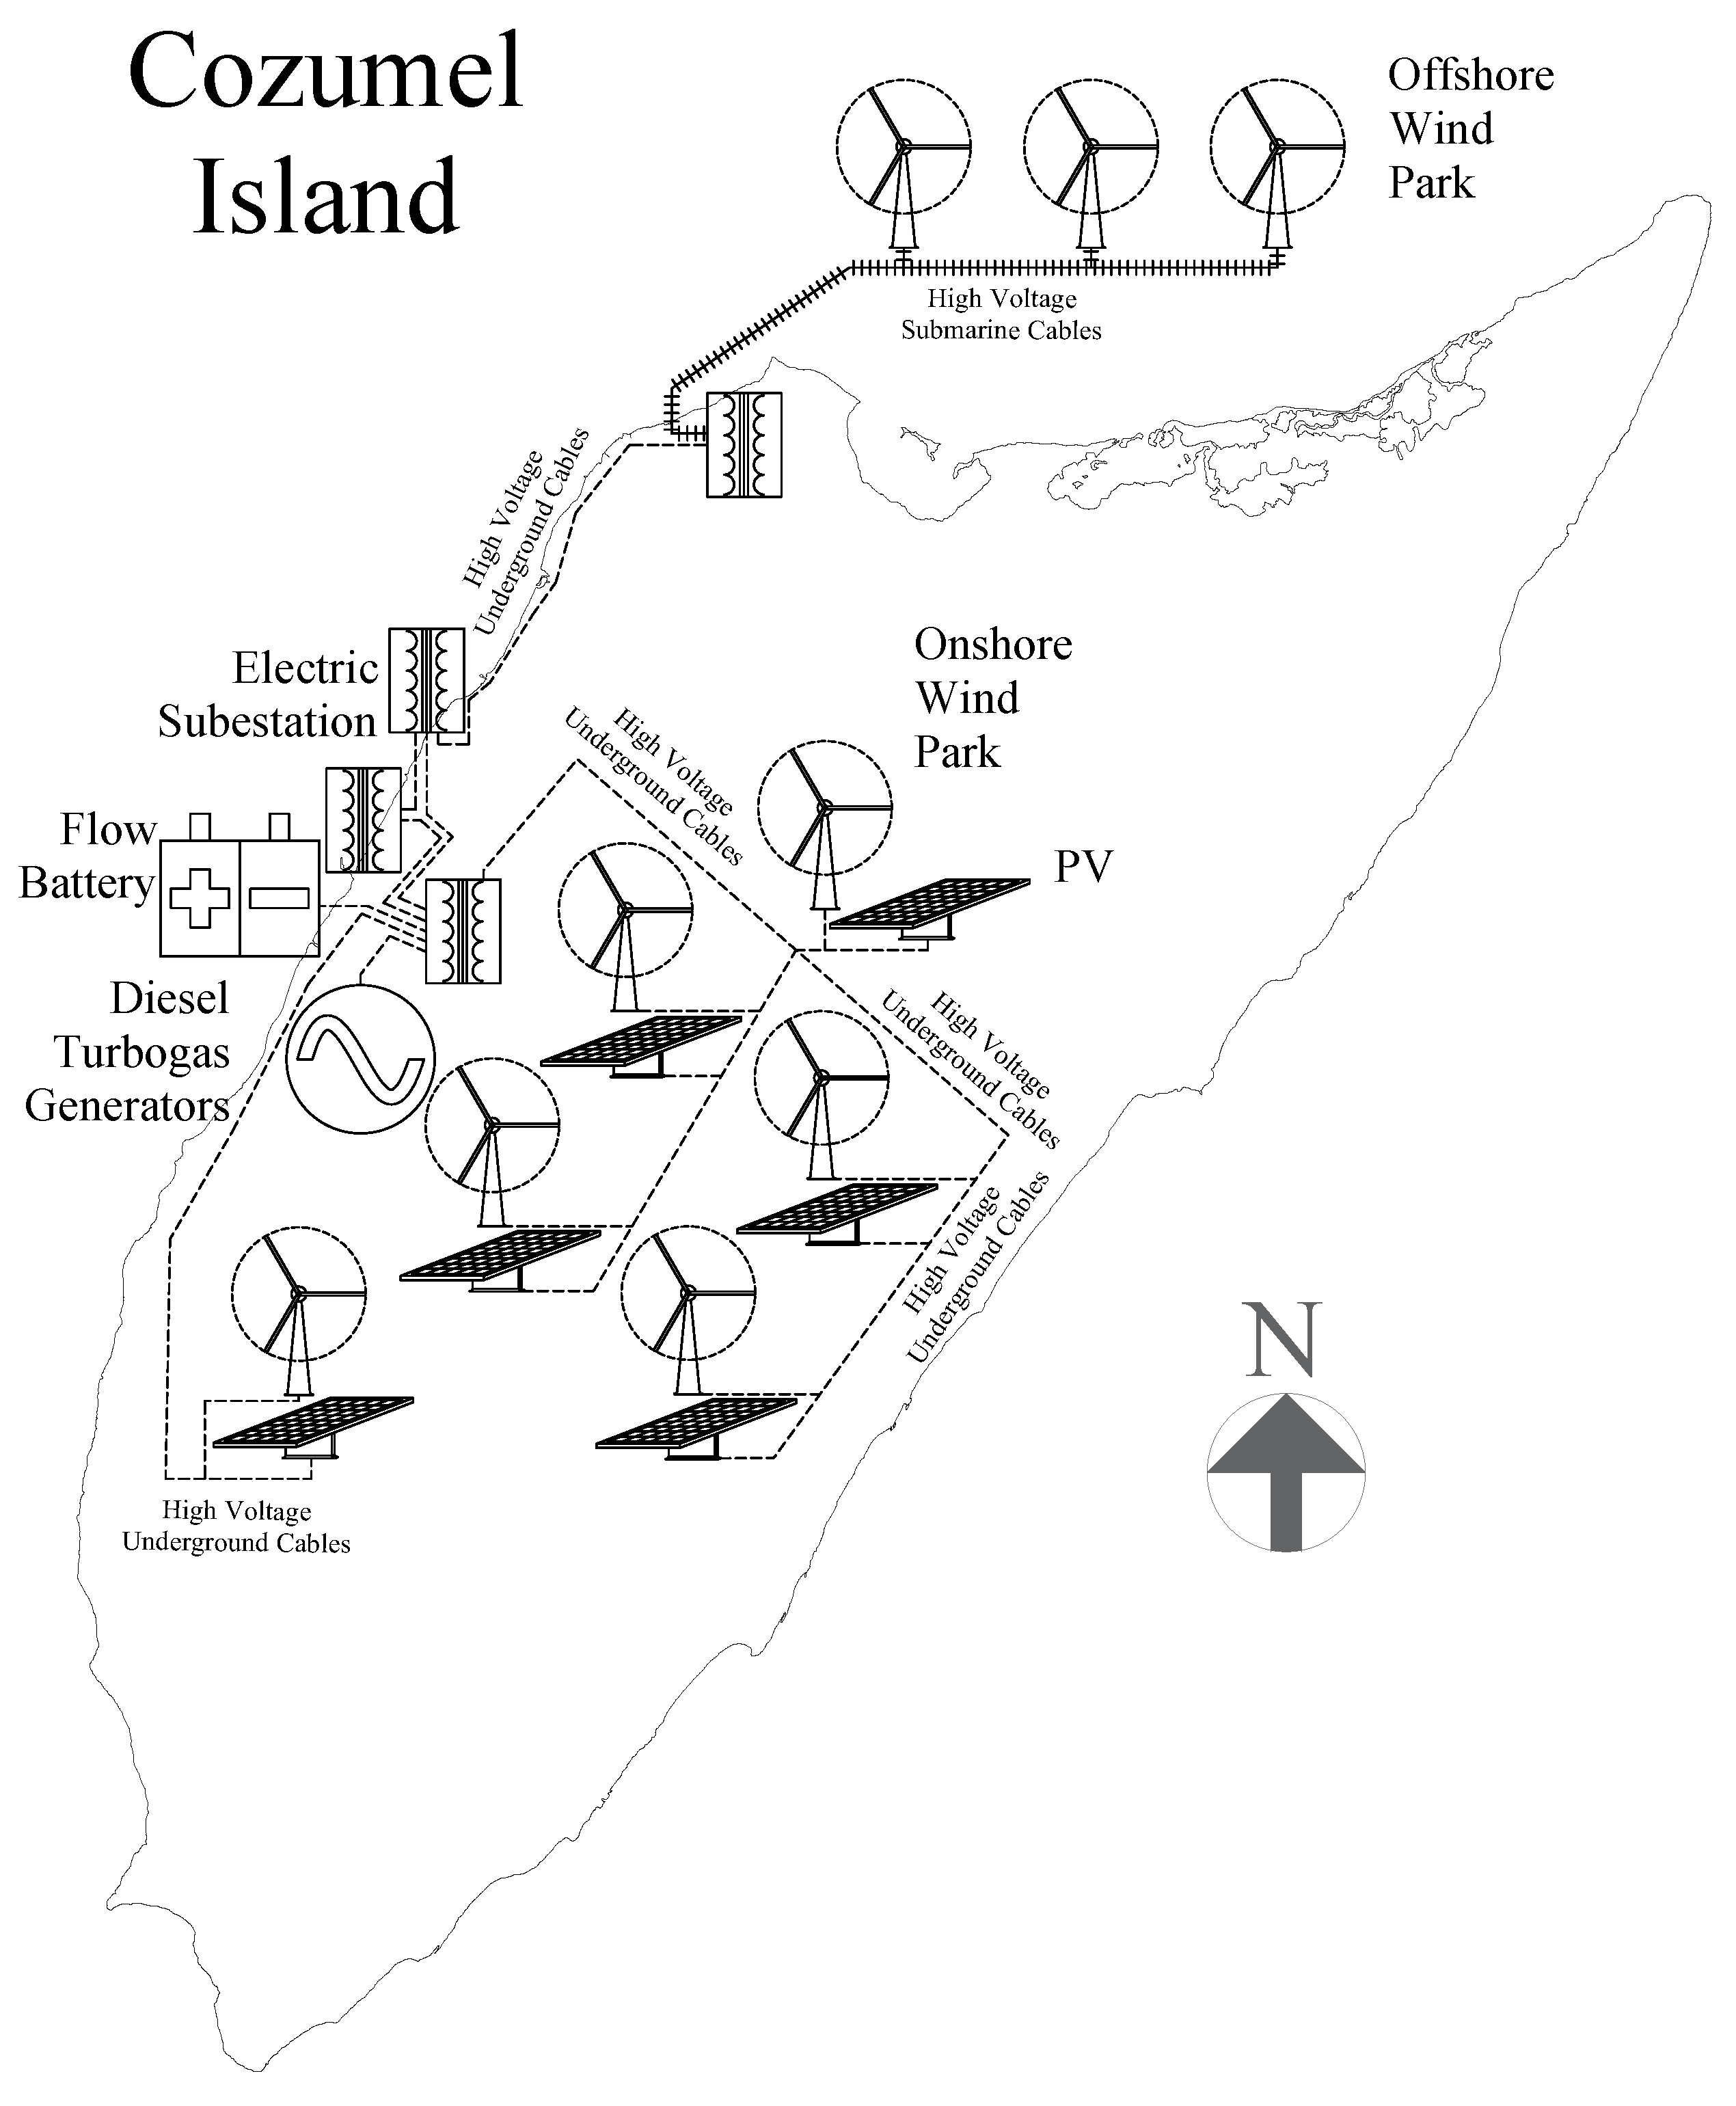
3.4.5. RETs System Proposals and Its Combination with Diesel and Flow Batteries

Rules and controls in the electricity sector exist to maintain the reliability of the grid when the generation plants are integrated into it. The grid code is the interconnection rules and controls for the RETs or any generation sources at the moment they are integrated into the electrical system, keeping the reliability and stability of the electrical grid. To make this possible, this code has the minimum or maximum control and protection parameters. The code depends on the country in which the RETs are going to interconnect. For instance, the grid code for large-scale photovoltaic power plants (LS-PVPPs) and very large-scale PVPPs (VLS-PVPPs) connected to the transmission system vary according to the country’s grid code, as indicated by [66]. In this study, the grid code parameters have been considered accomplished, according to the existing one in the SEN. Therefore, the control, protections and demand response are outside the scope of this proposal.
The simulations of the RETs integration on the Cozumel Island’s grid, in combination with diesel turbogas machines and flow batteries have been done through the HOMER®software tool [23] and using its modified standard models included in this electronic tool. HOMER®uses a two-dimensional linear interpolation through a probabilistic logic strategy using the complete enumeration method. Through this process, the software determines the optimal values of variables that the system designer controls, such as the mix of components that make up the system and the size or quantity of each variable. The optimal system or the best system configuration is the one that satisfies the user-specified constraints at the lowest total net present cost [27,67].
The technology selected for these simulations is indicated in Table 4. The topology and the renewable electrical system of the grid in this study are shown in Figure 9, including the current generation and main transformation system. The equipment selected for these simulations was: Generic PV system; GOLD WIND turbine machines (121/2.5 MW) type IIIB [68]; WIND to ENERGY turbines (132/3 MW) type IIIA [69]; SANY wind turbines (SE11520 2 MW) type S [70]; EWT turbine machines (DW54/250 kW, DW54/500 kw, DW54/900 kW) type IIIB [71]; and ENERCON wind turbine (E-126 135 7.5 MW) type IA [72]. These proposed systems have considered the existing diesel turbogas machines and one additional diesel turbogas machine (named: Turbogas Diesel). This new machine will be added only when the power demand exceeds the existing generation capacity, including the 6% reserve margin. The years in which this new diesel turbogas machine will be added are 2021, 2024, 2030, 2035 and 2050. The ideal energy model for the flow batteries was used and the quantity of flow batteries (EnerStore50, from ZBB ENERGY CO. [73]) in order to achieve 2 hours of backup power was proposed. The Kinetic Battery Model to determine the amount of energy that can be absorbed by or withdrawn from the storage bank each time step [74] was used. The AC/DC converter (EnerSection Converter, from ZBB ENERGY CO. [75]) was dimensioned, considering the 2 hours of backup time from batteries on a full discharge time. This backup time is considered as the time that allows a diesel turbogas machine, starting from a cold point, to supply the electricity needed in that moment, as well as to minimize the fossil fuel generation and to maintain the reliance of the system. As shown in Figure 10, in the first 8 h of 2018 in the Base Scenario, the RES and batteries supply the power demand while the diesel turbogas machine runs. However, between 47 h and 71 h, the fossil fuel generation is imperative, because there is no RE production and the batteries are discharged. It is important to remark that these electrical simulations on the electric grid of Cozumel Island were done in an off-grid mode. This operation allows the system to supply the electricity through fossil fuels for several hours when the renewable sources are not producing and the batteries are discharged. The system runs inversely when batteries are fully charged and renewable sources are producing enough electricity to supply the demand completely. In these two cases, fossil fuels and renewable energy supply the electricity demanded by the system. Because of this, the capacity installed must be much bigger than the power demand, having a 6% reserve margin.
The elements included in each system belong to a series of direct combinations between 333.33 kW in PV with one wind turbine in a 5 Ha surface area for on-shore (see Figure 8), considering the low wind profile resource using wind turbines with a type III-B (GW121-2.5 MW; DW-54/250 kW; DW-54/500 kW; DW-54/900 kW) and S (SE-115/2 MW) power curve. For off-shore, two turbines—type III-A (W2E-3 MW) and I-A (E-126-7.5 MW) power curve—were placed at a separation distance nine times their height in the same prevailing wind direction, and five times their height perpendicular to the direction of the prevailing wind. This was to avoid the presence of a wake effect and the wind production reduction [65]. Figure 9 shows the proposed topology of the electric grid in combination with the existing equipment on the Island. Only one system (System 12) was selected on the basis of PV, considering a surface area of 1.5 Ha/MW of peak capacity installed. The Figure 11 shows the total land surface affected by 2050 in the Base Scenario, by each of the 12 systems proposed. For instance, System 9 will need 2005 Ha and System 2 will need 175 Ha on-shore and 1140 Ha off-shore.

4. Results

4.1. Previous Essential Information

The basic considerations to develop the economic proposal on Cozumel Island (see Table 5) were made based on data from PRODESEN [39], PRE [42], International Energy Agency (IEA) [13,76,77], Sandia National Laboratories [78], and from the Department of Energy (DOE, USA) [79]. The average diesel cost was obtained from the World Bank Website [80] and from PRODESEN. The capital cost of the equipment, O&M, and other economic considerations from the Mexican Government’s report were used in these simulations. The Renewable Energy Certificates’ (CEL is its Spanish acronym) economic inputs were not considered. The results obtained were: the generation capacity of fossil fuels and renewable energy; the electricity generated; the LCOE; the capital cost; the Internal Return Rate (IRR); the payback time, among others. In addition to these results obtained through HOMER®tool, other results were obtained: the surface area used; the CO 2 emissions emitted and avoided; the specific electricity generated by each system; the reserve margin; the targets in contrast to each concept shown in Table 6, inter alia. These results are for the 12 defined systems proposed in this study (see Section 3.4.5). Two lifetime data for the PV and wind technologies have been chosen in the sensitivity parameters: 25 years and 12.5 years. This is due to the risk of a hurricane during the lifetime of the project as indicated at the end of Section 4.3. Wind resource data used in the simulations was compared, obtaining a high similarity with the data obtained from Figueroa-Espinoza and Paulo Salles [81]. Technical results are included in Section 4.2. Economic results are indicated in Section 4.3. System selection is shown in Section 4.4. After the system selection, analysis of the best system was conducted, as discussed in Section 4.5. Finally, the emission factor reduction results are shown in Section 4.6.
Table 6 shows the electricity generation and the power demand expected for the Island. Considering the existing 68.82 MW fossil fuel generation, the Table 6 also includes the electricity generation composition in RE and fossil fuel and the minimum and maximum power capacity composition to be installed [59]. Data in Table 6 is based on the targets for Cozumel Island, indicated in Table 2. Points 1 and 2 in Table 6 represent the forecast data according to the prospective growth from Figure 3 and Figure 5. Points 3 and 4 show the minimum data for the RE results. Figure 12 and Figure 13 indicate the results for these points in RE, contrasting them with their targets. Points 5 and 6 show the maximum fossil fuel data for the results. Point 5 was always fulfilled in regard to the maximum fossil fuel production. Point 6 was never accomplished, because the fossil fuel always supplied the demand when there was not enough RE production. In some hours during the year (2021 in the Base Scenario), the power demand was higher than the installed fossil fuel power capacity. This resulted in the addition of a new fossil fuel generator from this year until 2050 (named: Turbogas Diesel), including the 6% of the reserve margin. Point 7 shows the maximum emission factor to fulfil the emission factor reduction regarding the one calculated for 2000 (see Figure 22 in Section 4.6). Point 8 is the maximum reserve margin to be considered in the power capacity installed. It is important to note that this 6% in the reserve margin was never accomplished, because the most restrictive of all targets in RE was the emission factor reduction (see Figure 14). Whereas the electricity generation targets for RE and the power capacity installed were achieved, the fulfilment of the factor emission reduction target implicated an increase in the RE generation capacity (see Figure 13).

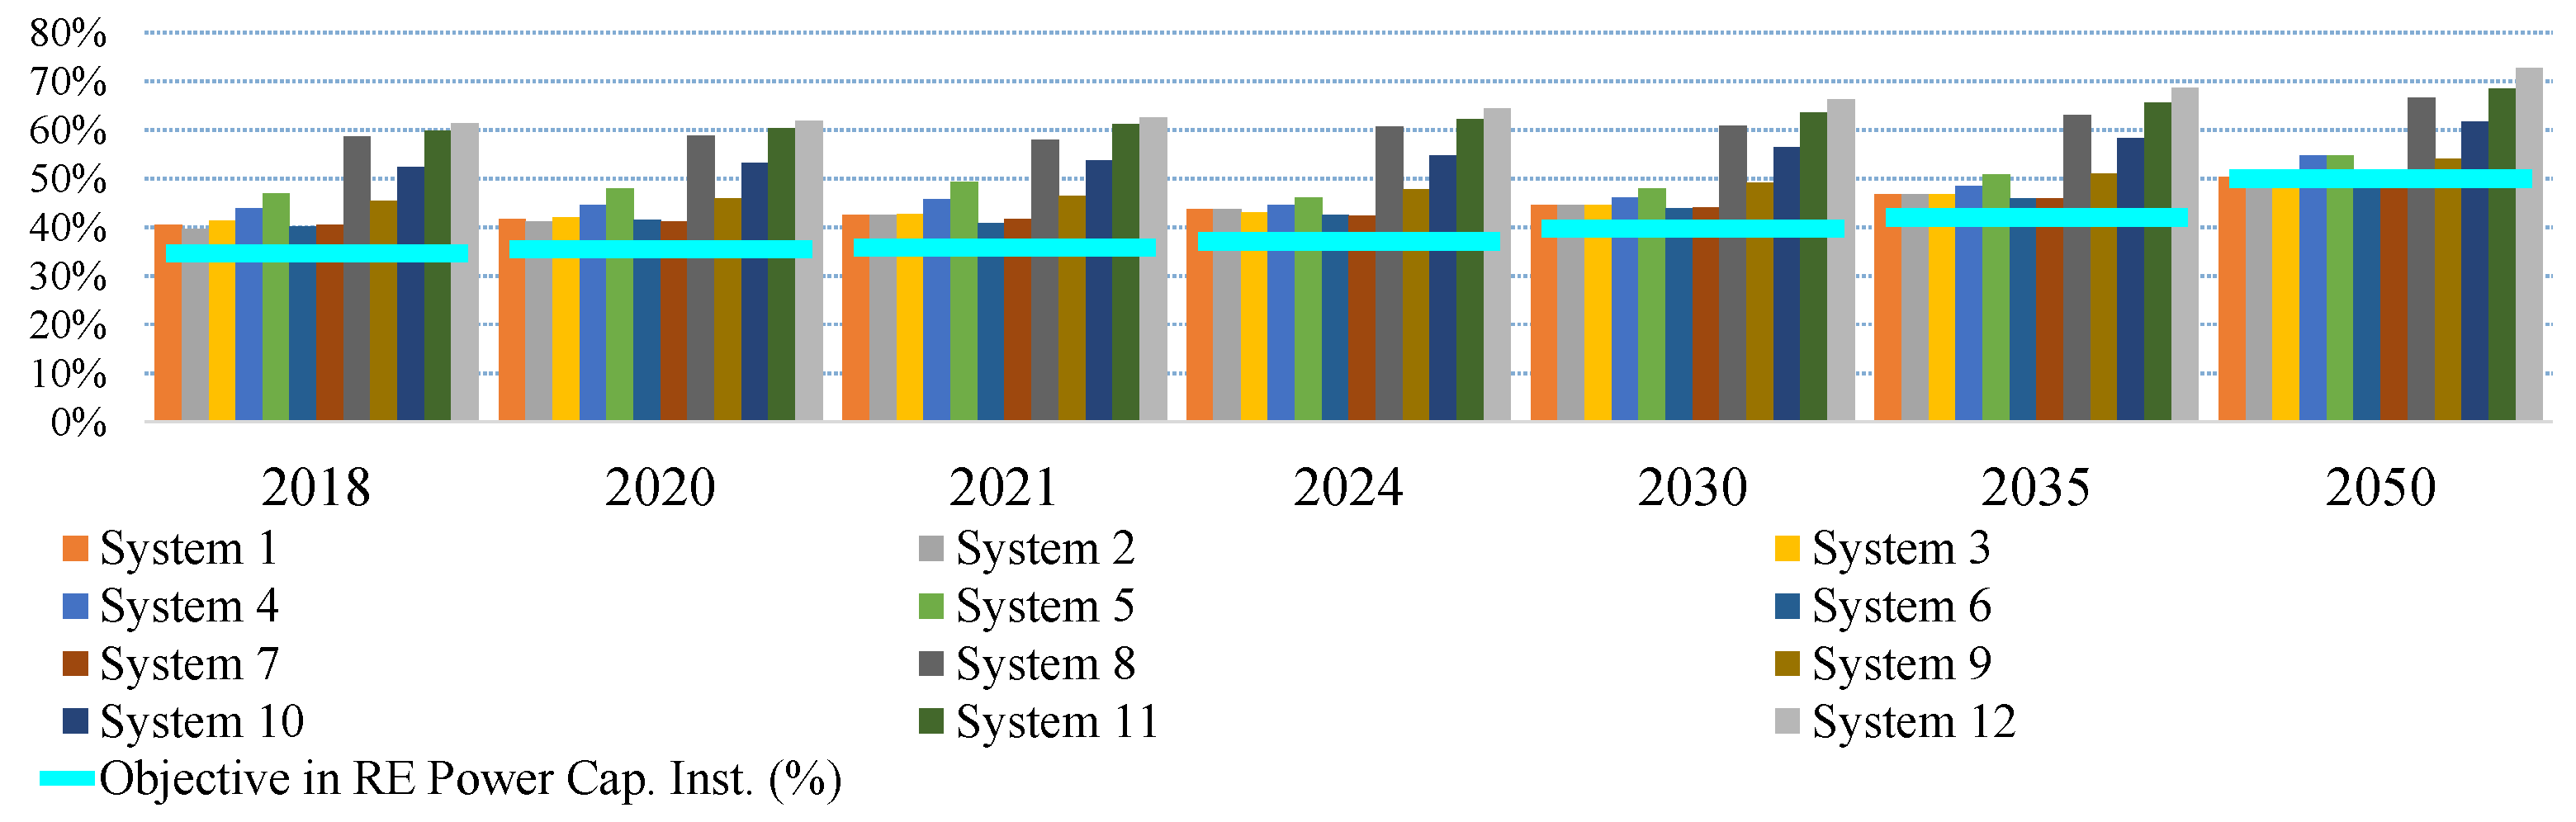
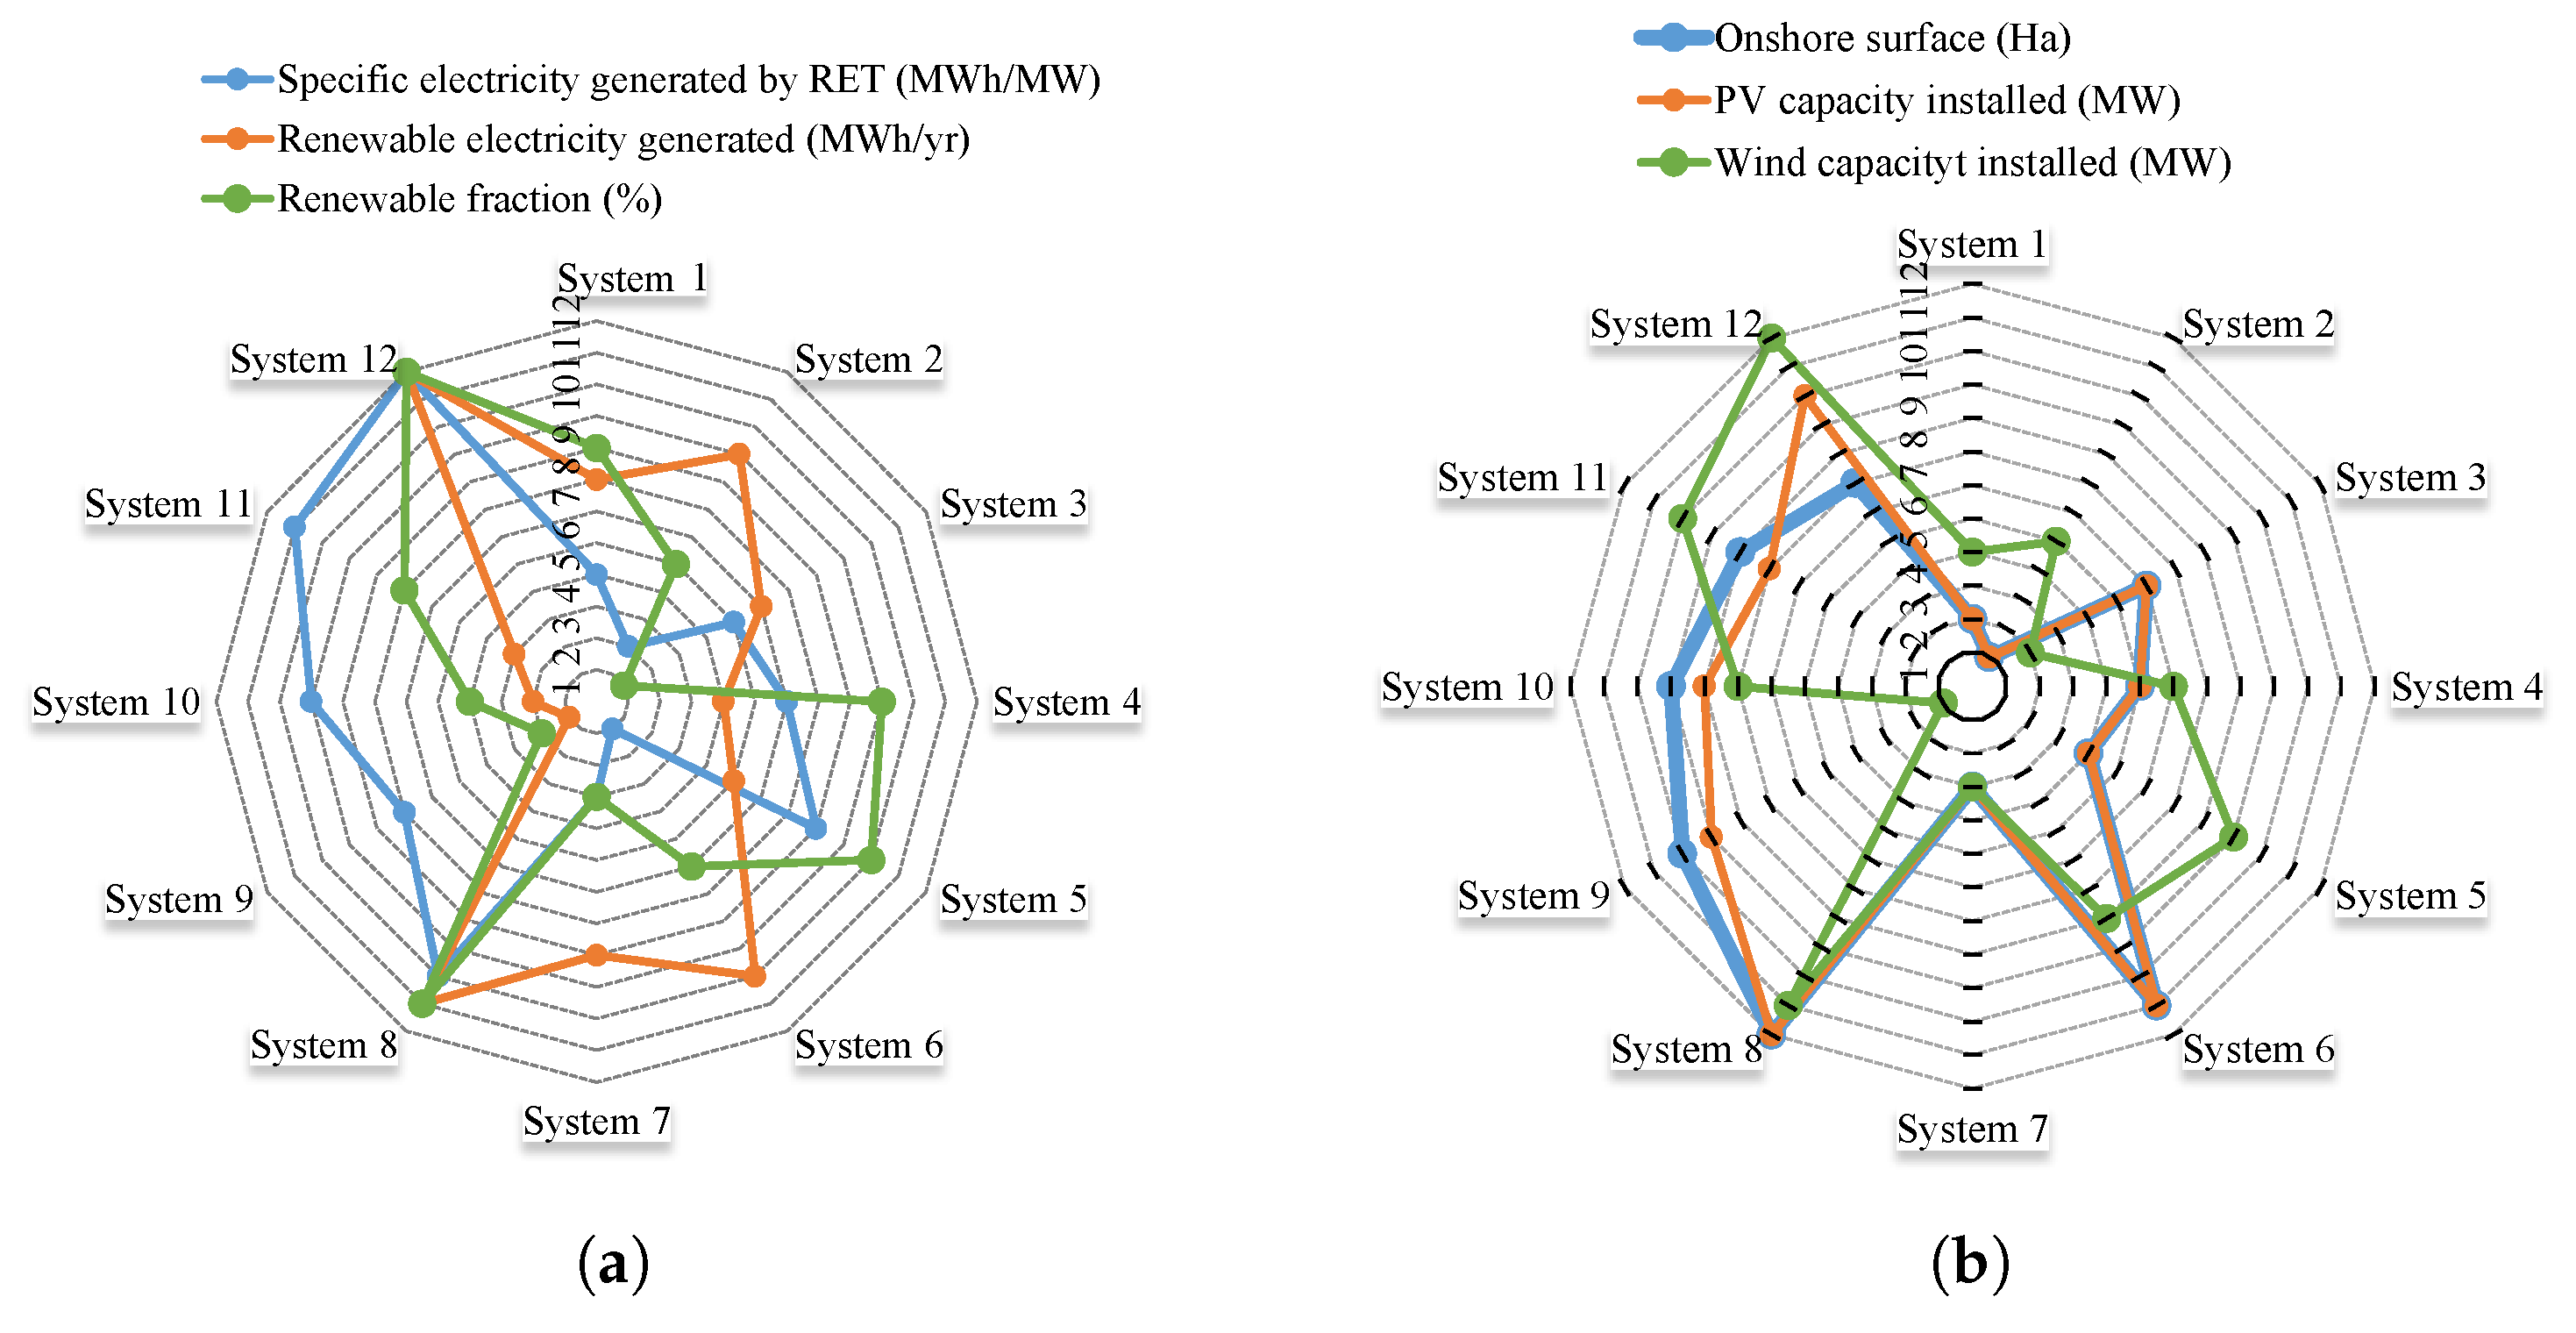
4.2. Technical Results

In accordance with the RE targets, Table 7 shows the results for each system proposed for 2050 in the Base Scenario. The quantity of on-shore and off-shore wind turbines is included in combination with PV, in some cases. For all systems proposed, the diesel generation, the flow batteries and the converter are always present.
Figure 11 shows the surface area used on-shore and off-shore for each system in the Base Scenario in 2050, as an example. Figure 12, Figure 13 and Figure 14 show results of renewable electricity generated, renewable power capacity installed and the reserve margin in comparison with their targets for the 12 systems in the seven key years. In Figure 14, the Mexican Government projects a 6% reserve margin, according to the result from: R M = [ ( i + j C I - D B ) / D B ] × 100 . Where R M is the reserve margin, i + j C I is the existing and projected power capacity installed and D B is the power demand [54]. Considering only the power capacity installed on the Island, this 6% is not enough to achieve the required power capacity generation in RE and fossil fuel to supply the electricity consumption needed in time, as Figure 14 shows. The system is oversized and the reserve margin results will be out of the target indicated by the Mexican Government. Comparing the three scenarios’ results (Low, Base and High), similarities can be found, but the amount of electric data changes. This means that topology and technologies included in the 12 systems proposed never change. Only the power demand, the electric consumption and the capacity of the system elements change. The RE generation capacity data will change in direct proportion to these variations. In the Low Scenario, the data diminishes and in the High Scenario the data increases in relation with the Base Scenario.

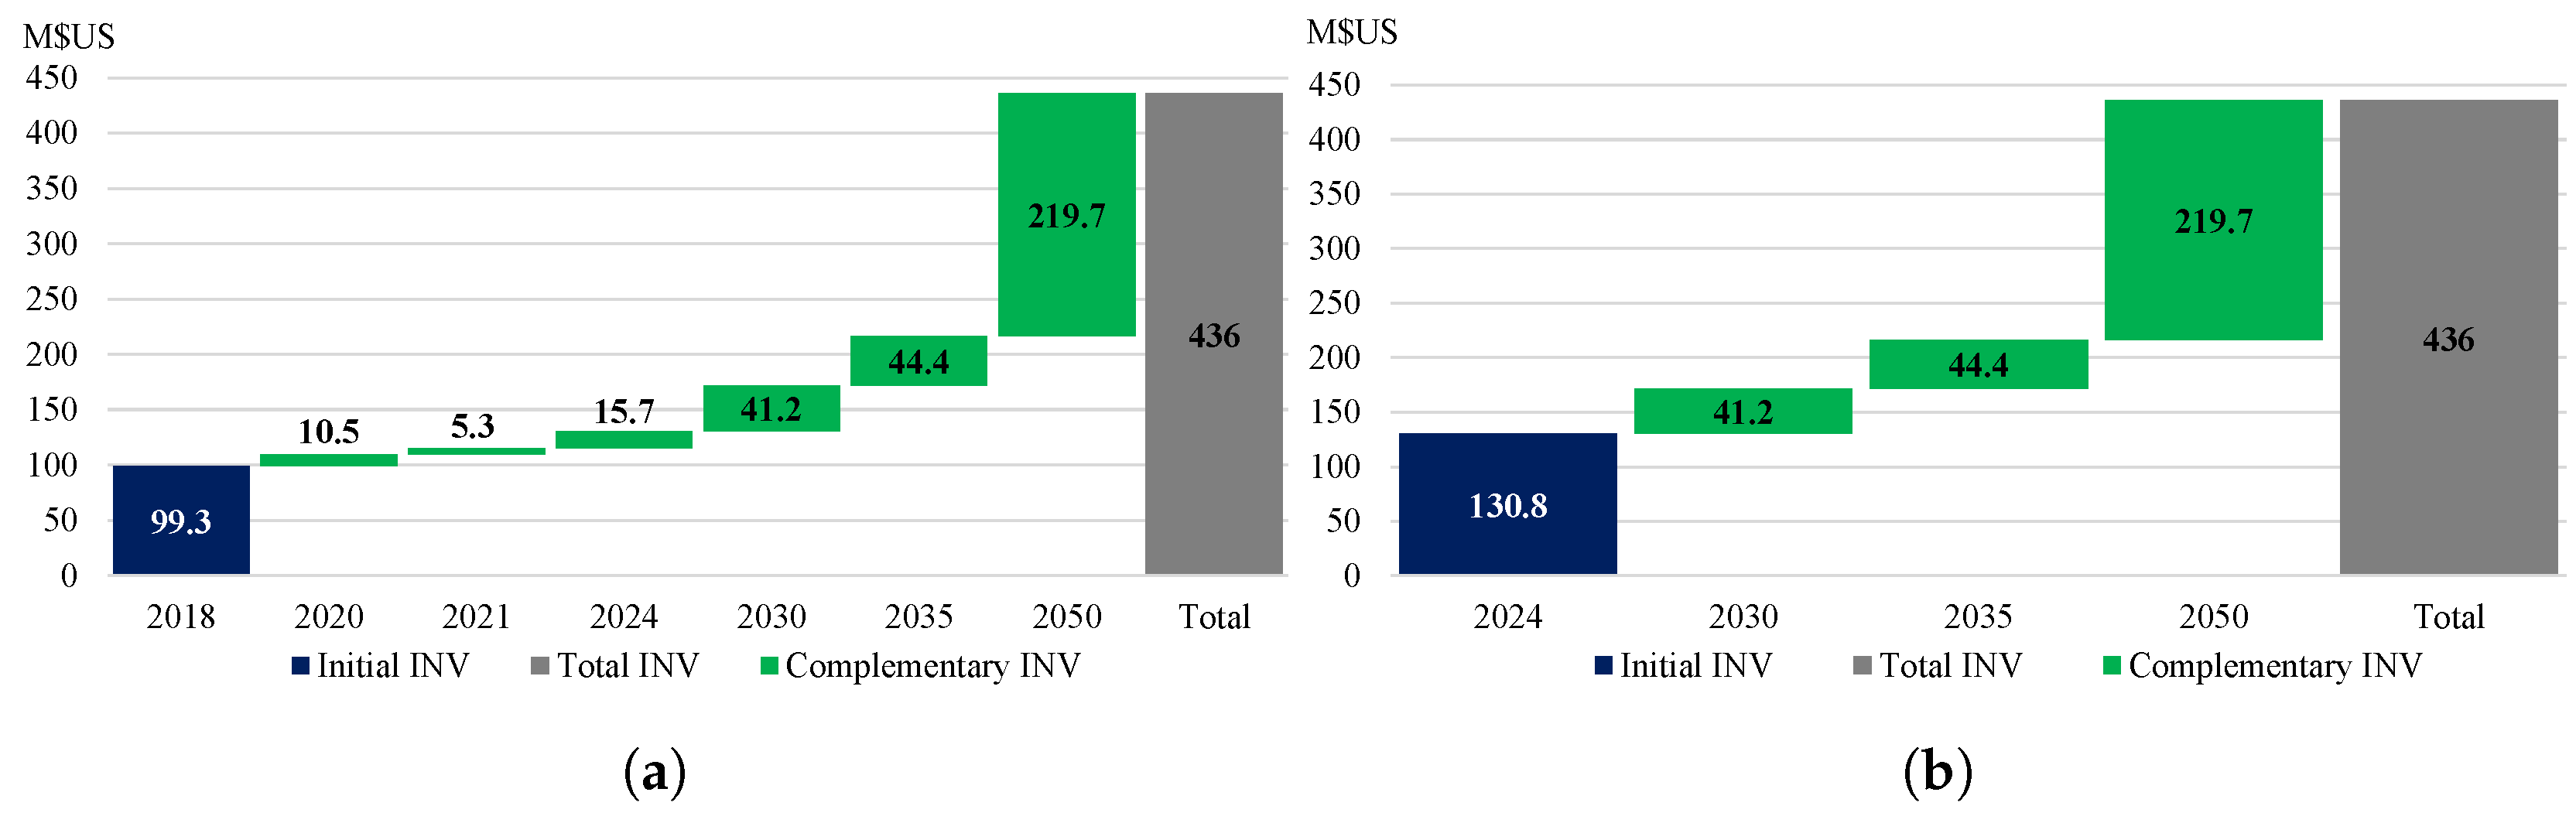
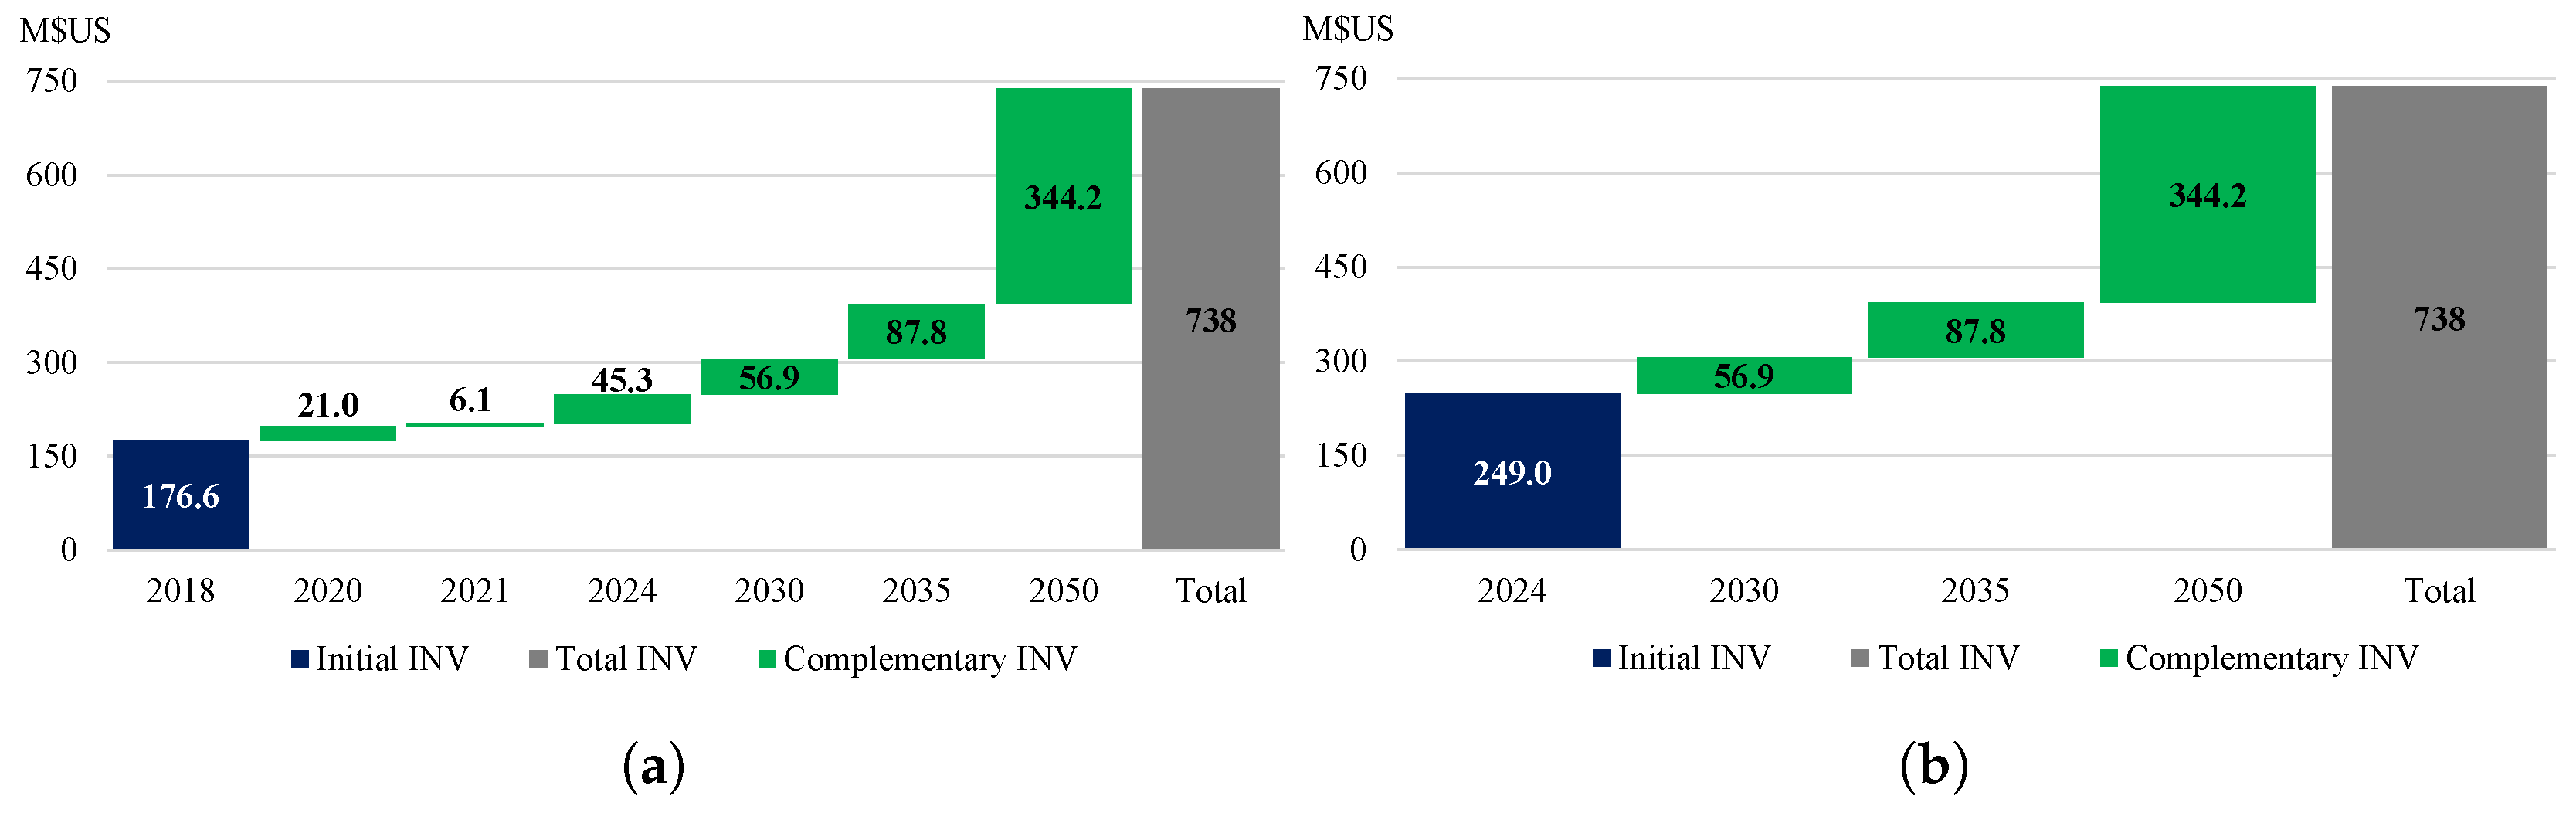
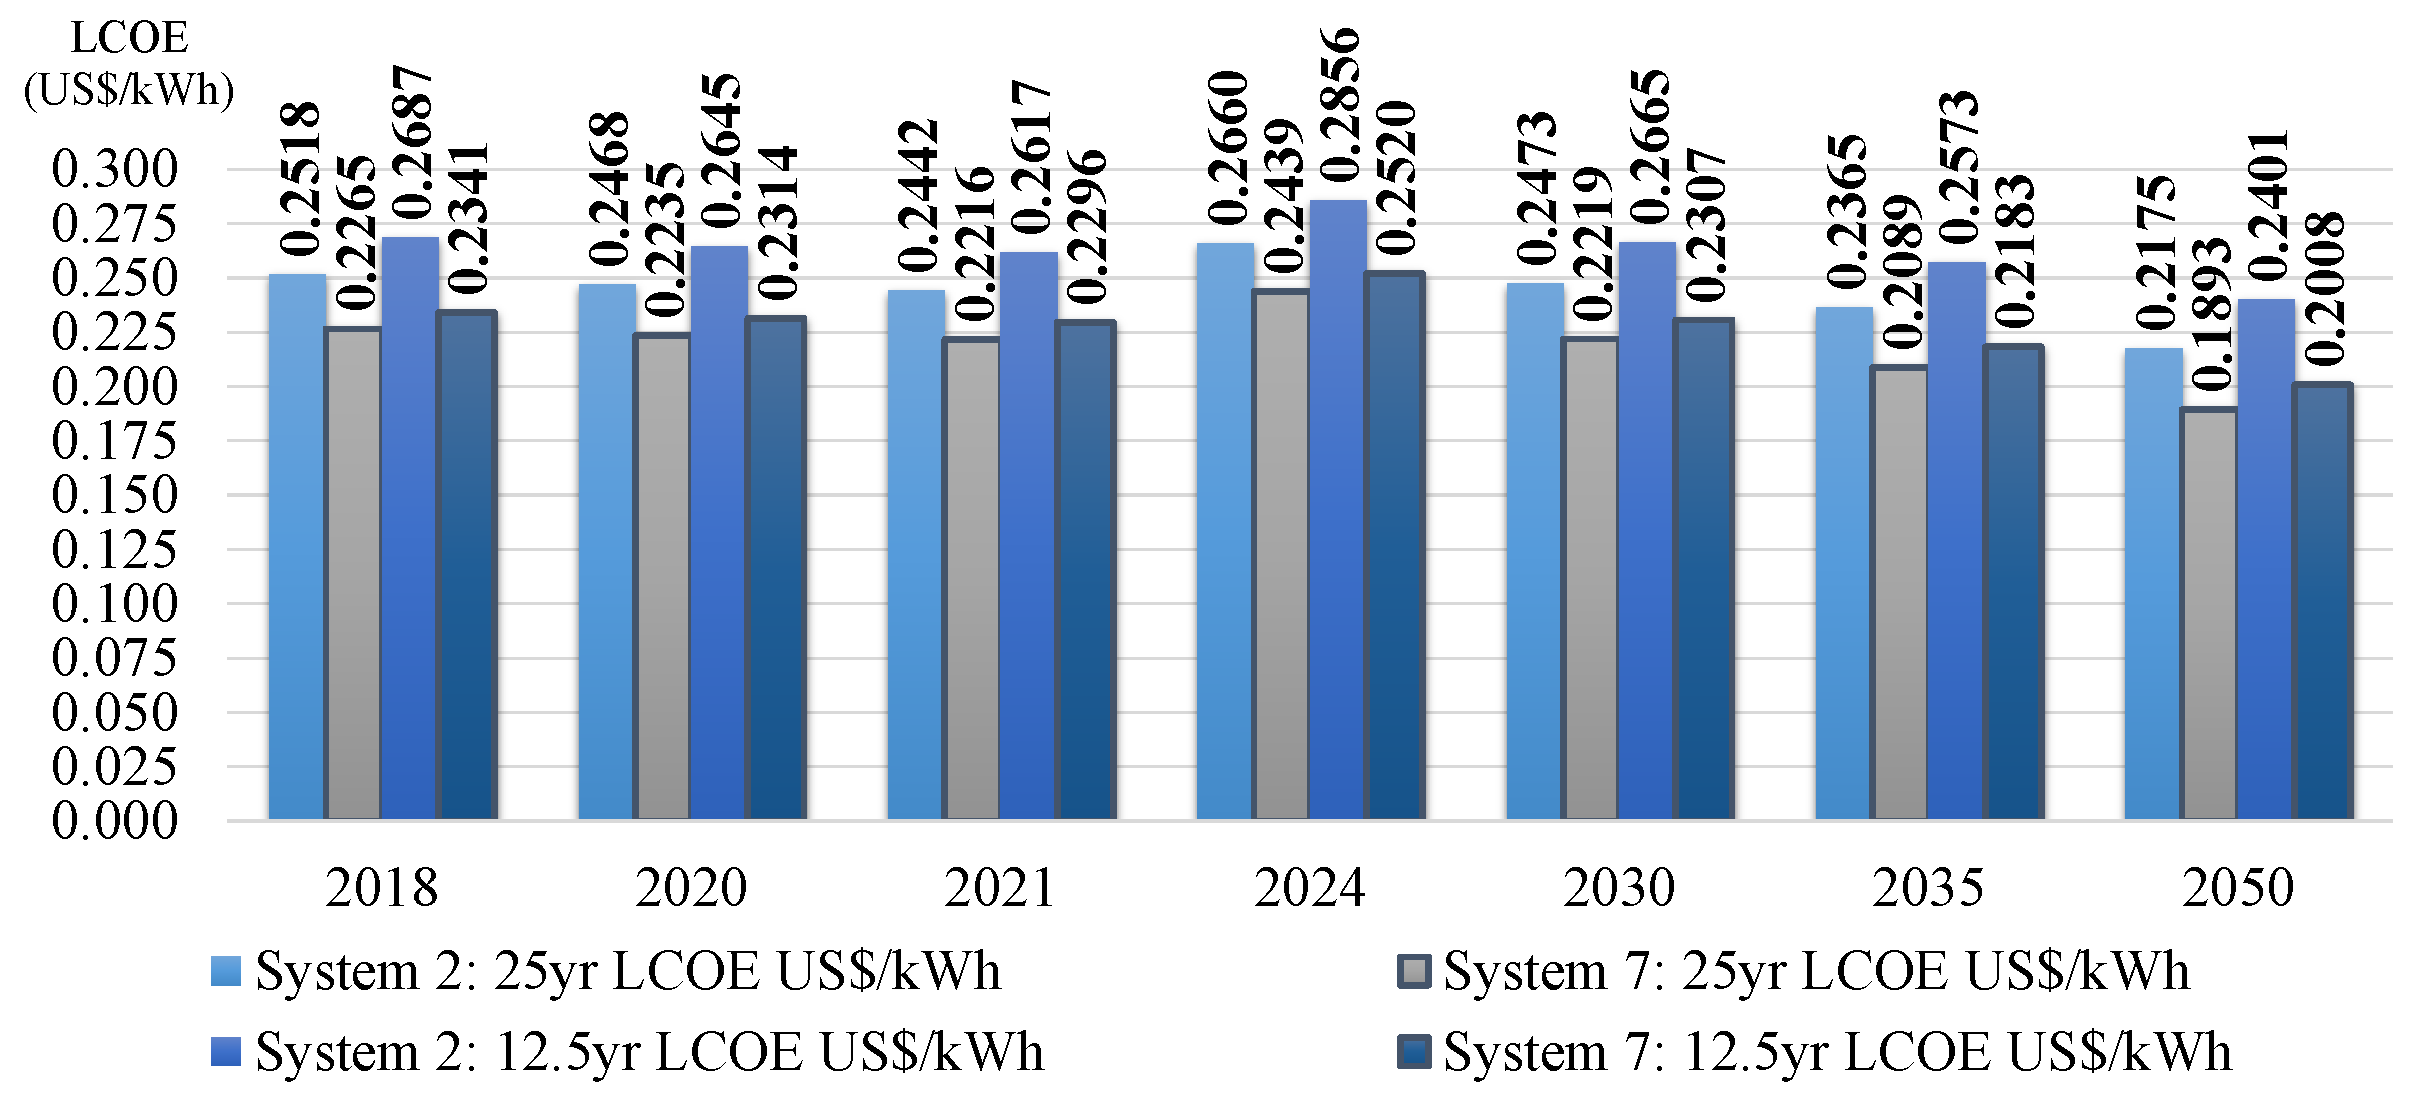
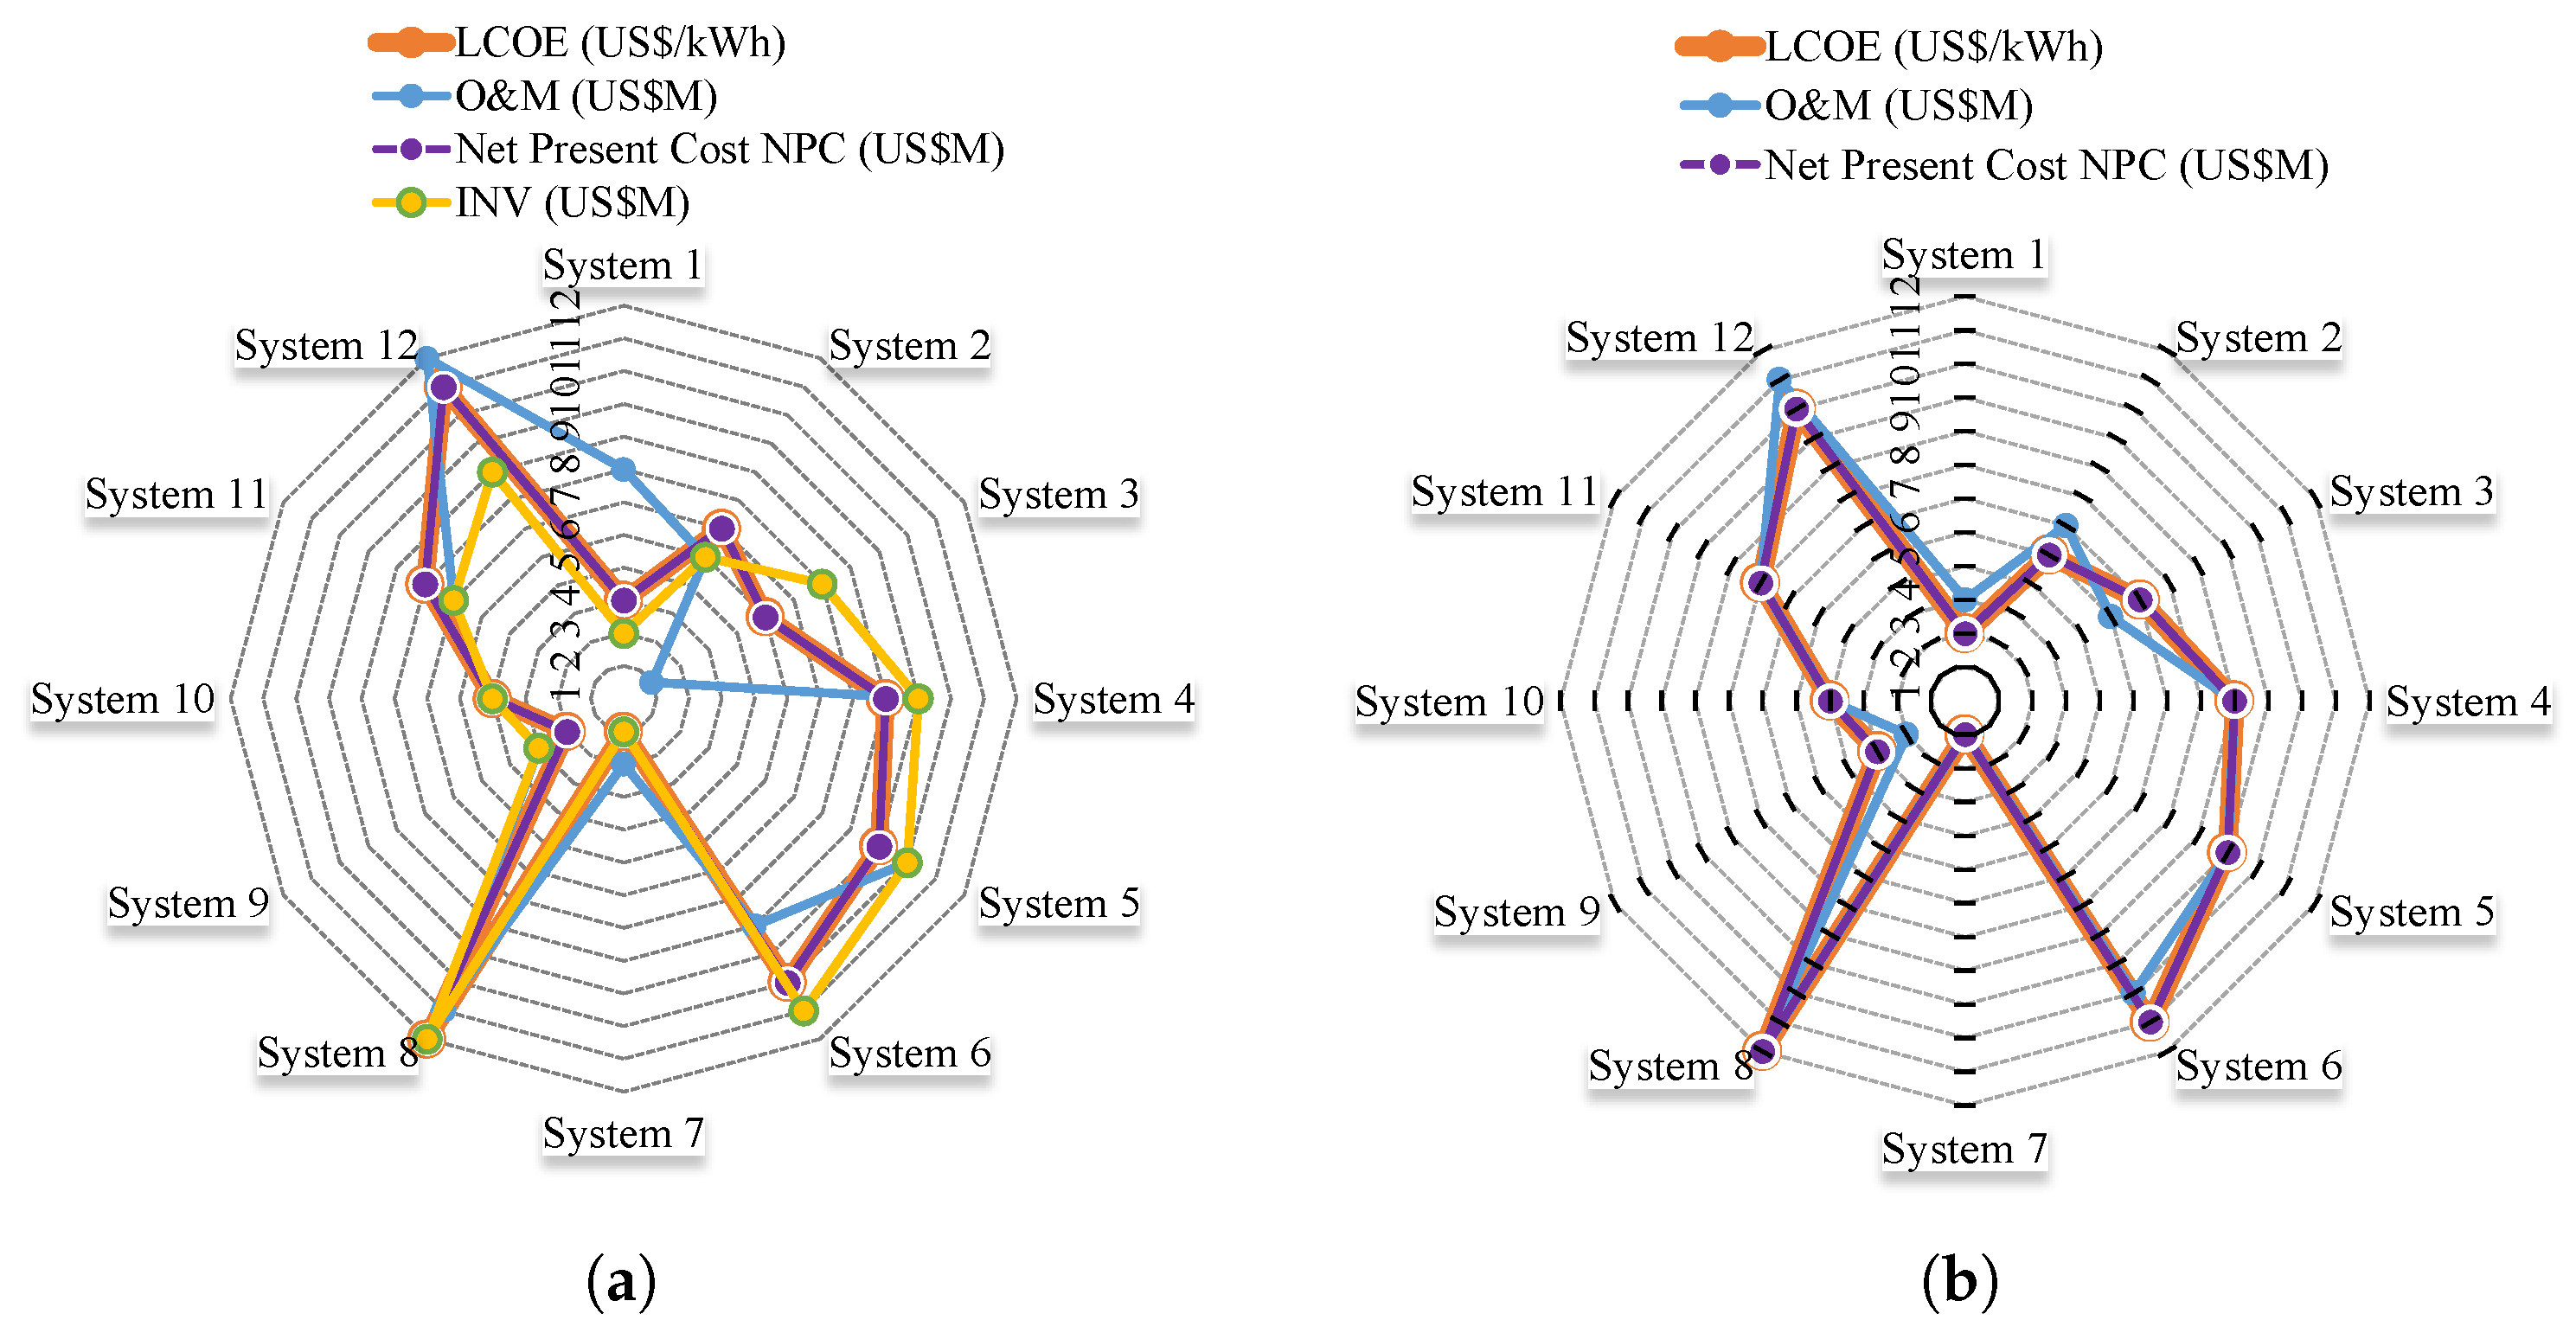
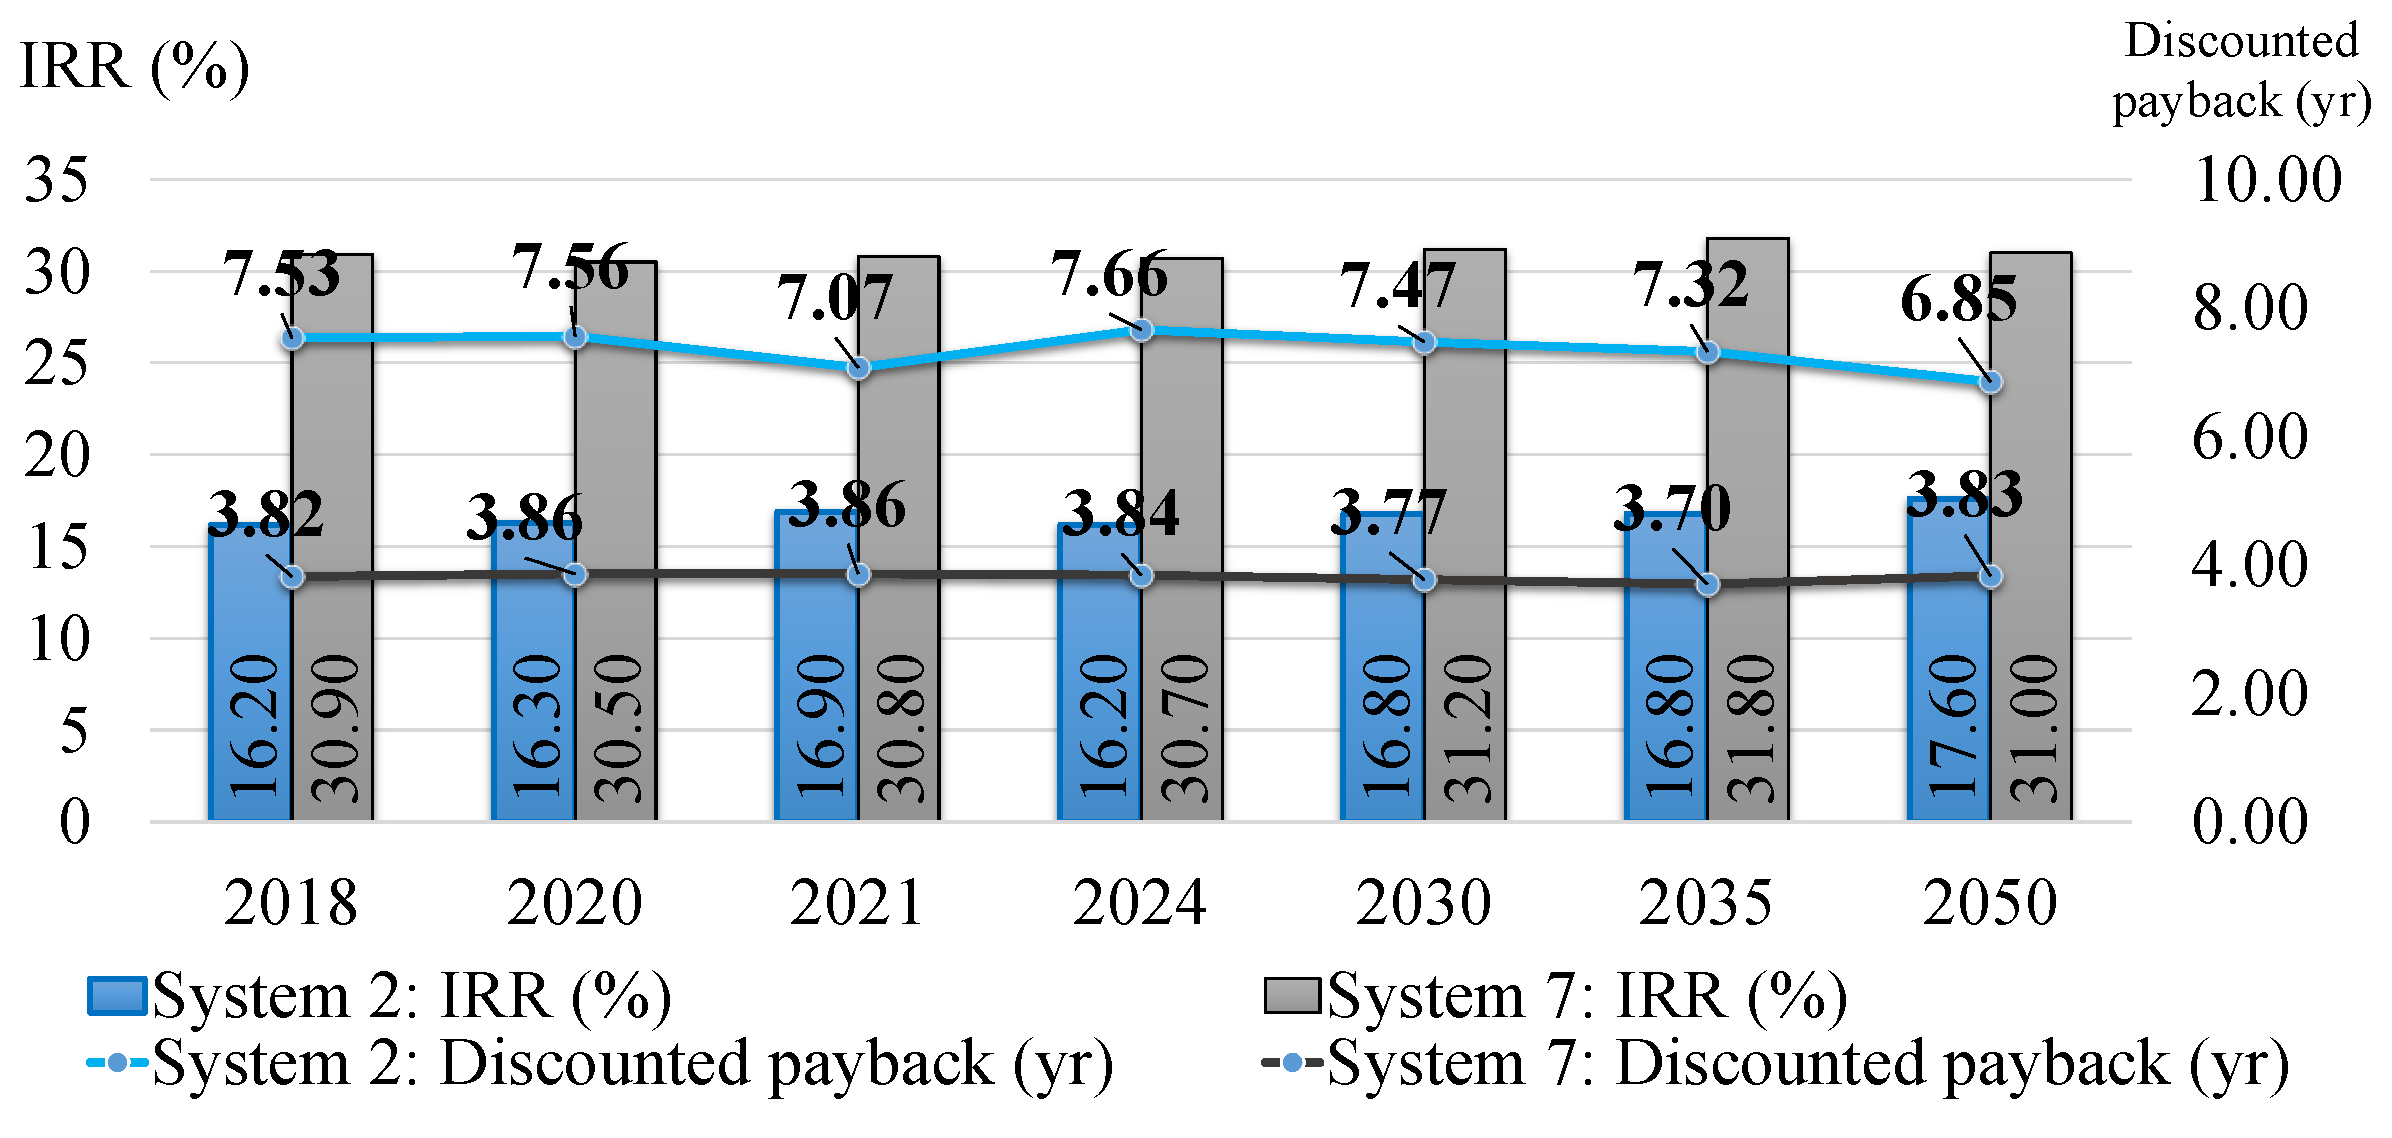
4.3. Economic Results

The LCOE generated for each selected piece of generation equipment, including the existing diesel turbogas machines and the new one, are indicated in Table 8. The LCOE resultant of each system is the average cost per kWh of useful electrical energy produced by the systems indicated in Table 9 (25 years and 12.5 years of lifetime project). The Net Present Cost (NPC) and the O&M are also indicated according to their lifetime (25 years or 12.5 years). Table 9 also shows the Initial Capital Cost (INV), the Discounted Price Value (DPV), the Internal Return Rate (IRR) and the Discounted Payback time as common results. The simulations developed were based on fossil fuels, the prices of which were not increased.
On 24 September 2015, the production cost in the peak period (from 6 p.m. to 11 p.m. approx.) was 0.351 US$/kWh on Cozumel Island [59,82]. In this study, the result obtained for this production cost was 0.230 US$/kWh for the existing diesel turbogas machines, and 0.251 US$/kWh for the new machine using a diesel price of 1 US$/L [37,80] (see Table 8). Results obtained in this study are very far from the ones reported by the Mexican government. For instance, in the first energy auction closed on 30 March 2016, the average electricity price from clean sources was 0.04748 US$/kWh + CEL [39]. However, in the second long-term electric auction, preliminary results published on 22 September 2016, the average electricity price from clean sources was 0.03347 US$/kWh + CEL [83].
Table 10 shows Tropical Storms and Hurricanes in Quintana Roo State from 1901 to 2015. This table was made according to the data from Gómez Ramírez and Álvarez Román [84] and the Hurricane Research Division [85]. In this table, two categories are indicated: (a) From Tropical Storm wind forces (less of 119 km/h) to Hurricane Category 2 wind forces (154–177 km/h) and (b) from Hurricane Category 3 wind forces (178–208 km/h) or higher [86]. As can be seen in Table 9, a major Hurricane (Category 3 or higher) in a 25-year lifetime project can affect the economic results shown in the 12.5-year lifetime project cost. If the major hurricane happens before the payback time has been reached, or two or more times within its lifetime project, these proposals could be economically infeasible

4.4. System Selection

From all system proposed, two have been selected to represent the results for the other two scenarios: Low Scenario and High Scenario. On the base of a DSV model through primary and secondary category rankings and through a decision support system and an applied spreadsheet tool, the selection analysis of the best system proposed was made. A score was given to each system, depending on its results. Systems were ranked and ordered from best to worst, considering the conditioned distribution of a specific variable. A 12-point score was given to the best result for each specific variable analysed. On the other hand, a 1-point score was given to the worst result for the same specific variable analysed.
For instance, the specific RE generated for each capacity unity proposed (MWh/MW) for all systems. In this case, the best system is the one with more electricity production (MWh) over less capacity installed (MW). The winner is System 6 in the Base Scenario for 2050 (see Figure 15). For the economical results, the same selection methodology was used and it is illustrated in Figure 16. The ranking positions of the system results are indicated in Table 11. The overall results are considered as the main category, while the economical, technical and land use results are considered as secondary categories. Through the Minitab®Statistical Software [87], these results have been validated.

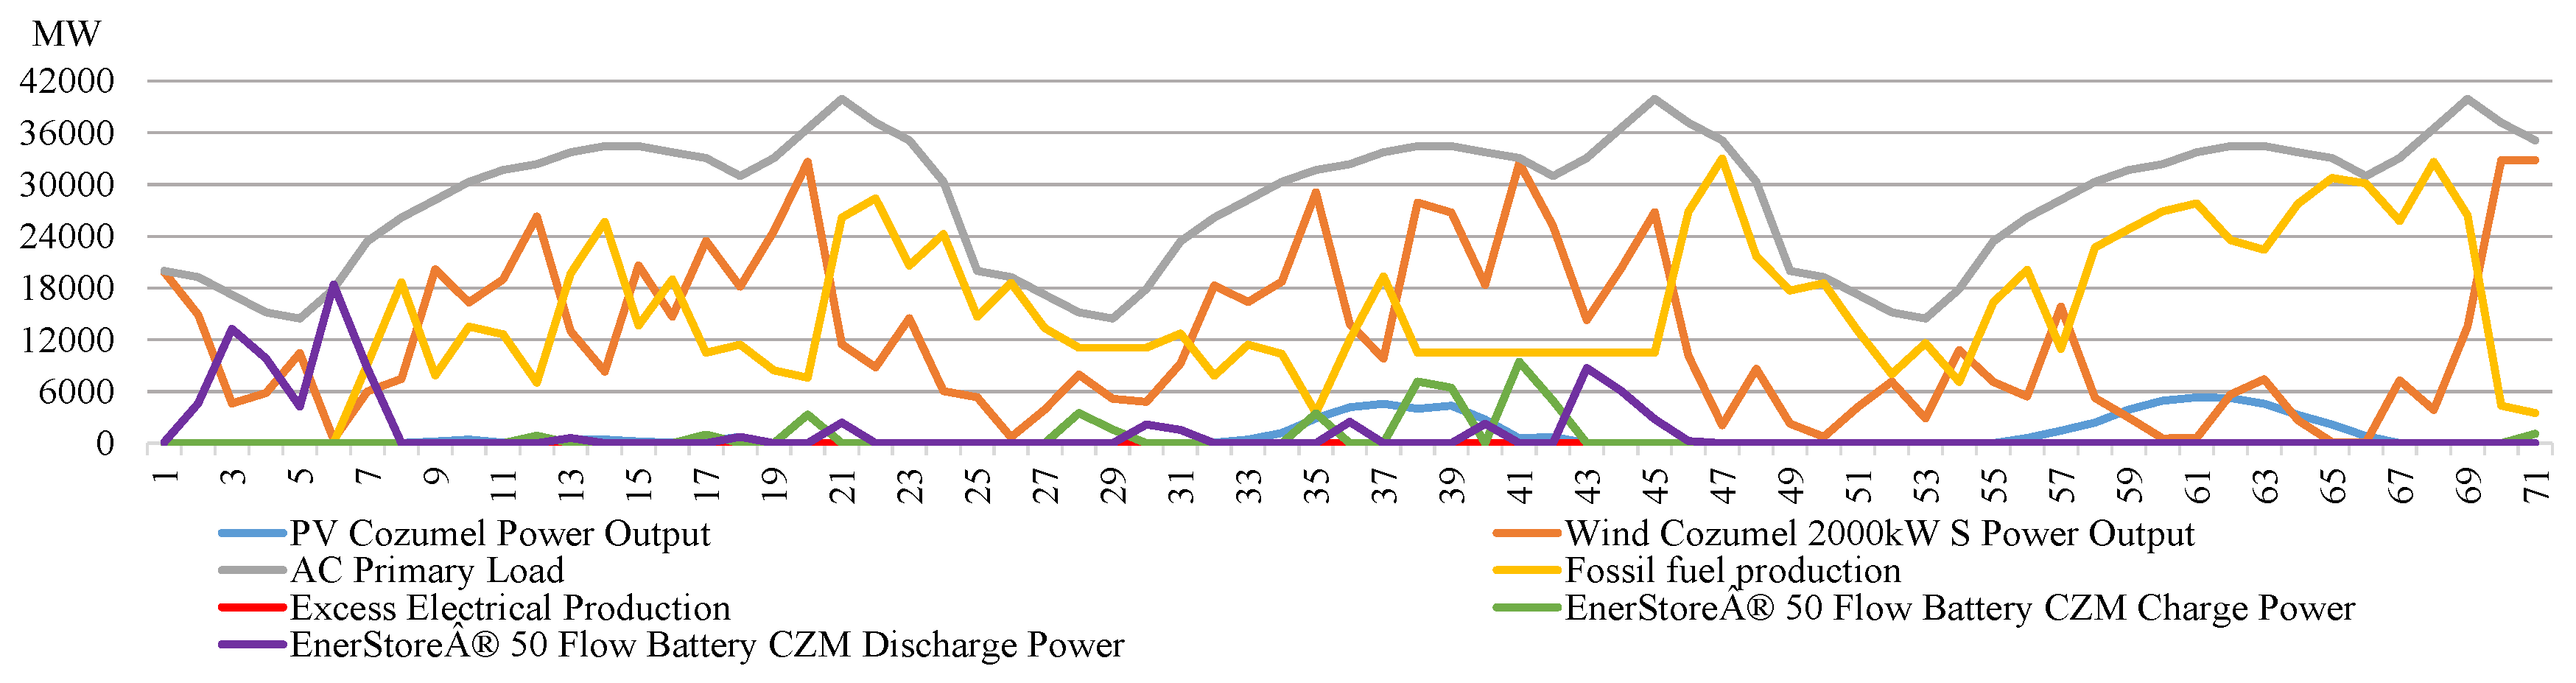
4.5. Selected System Analysis

Considering the previous results, System 7 (2 MW/333.33 kW Wind/PV) and System 2 (2.5 MW/333.33 kW Wind/PV + 3 MW off-shore wind) have been selected. The economic results for both are indicated in Table 9 and Figure 17. In this Figure 17, the investments will be made depending on the year chosen to start the project. It will not be a yearly investment. Figure 18 (System 2) and Figure 19 (System 7) indicate the initial capital investment for 2018 and 2024. They also show complementary investments that need to be made in order to have the required equipment capacity installed to reach the RE targets in the following years. Figure 18 and Figure 19 (left side for both) show the initial capital investment to develop in 2018. The right sides of both show the initial capital investment to develop in 2024. Likewise, in view of the fact that implementing RE-integrated projects can last from 3 to 15 years [55], this study has considered 7 years of implementation. This would happen if, in 2017, the application process for the RE-integrating project is started before the Energy Regulatory Commission (CRE is its Spanish acronym) in Mexico. It is important to clarify that the timing of the investment takes into account the total cost of the project during the project lifetime, i.e., total cost by 2050 in the Base Scenario for System 2 (Figure 17a) will be 738 M$US, but if we choose to start the investments in 2024, the investment will be 249 M$US.
A comparison of the results between Systems 2 and 7 is indicated in Figure 20 and Figure 21 in the Base Scenario. The values of Internal Return Rate (IRR) and the discounted payback are compared in Figure 20. The values of the LCOE for each system are compared in Figure 21. The relative frequency results of the power discharge from the batteries for 2018 in System 7 for the Base Scenario showed that 89.2% of the time, over one year, the power discharge goes from 0 MW to 1 MW, and only 0.228% of the time does it reach the full power discharge. In future works, the results by complementary methodologies, such as cost minimization methodology or multi-criteria methodology, will be analysed. Also, the use of analytical programmed energy system tools and linear programming optimization models can provide more data in cost and energy storage optimization [88,89].

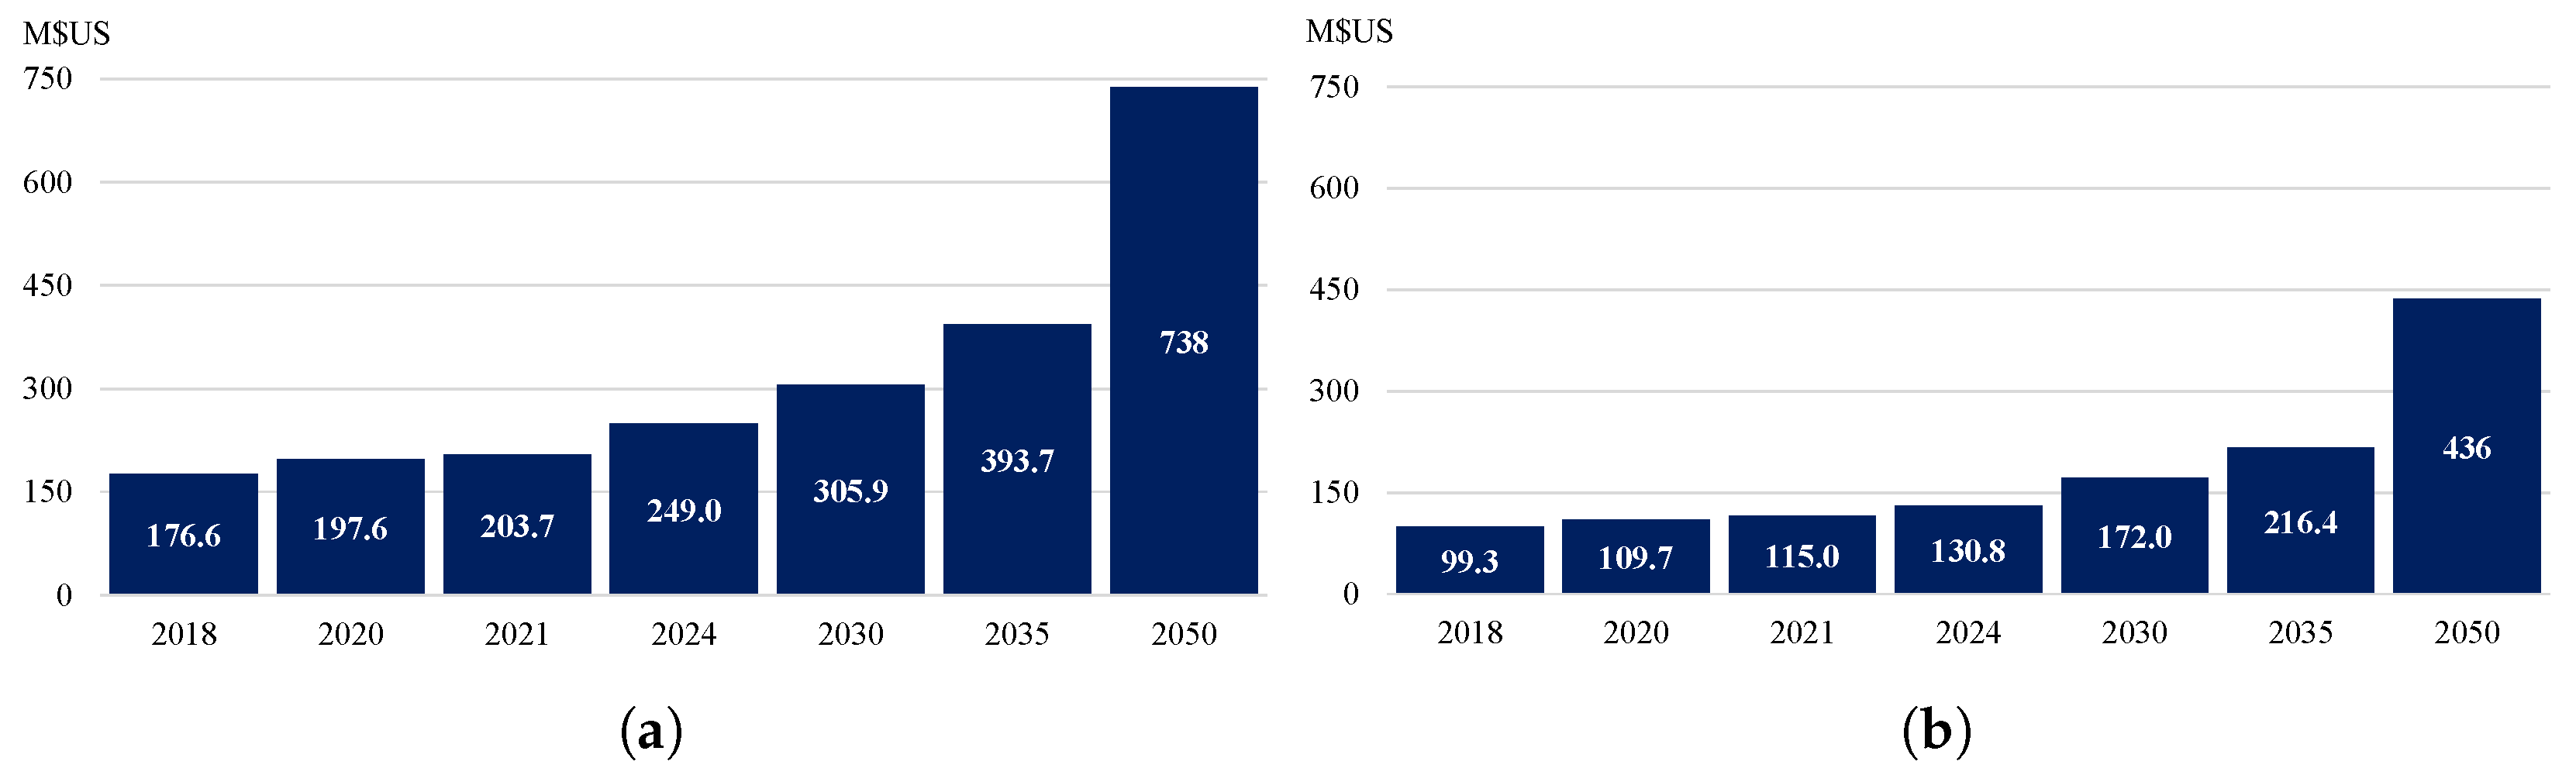
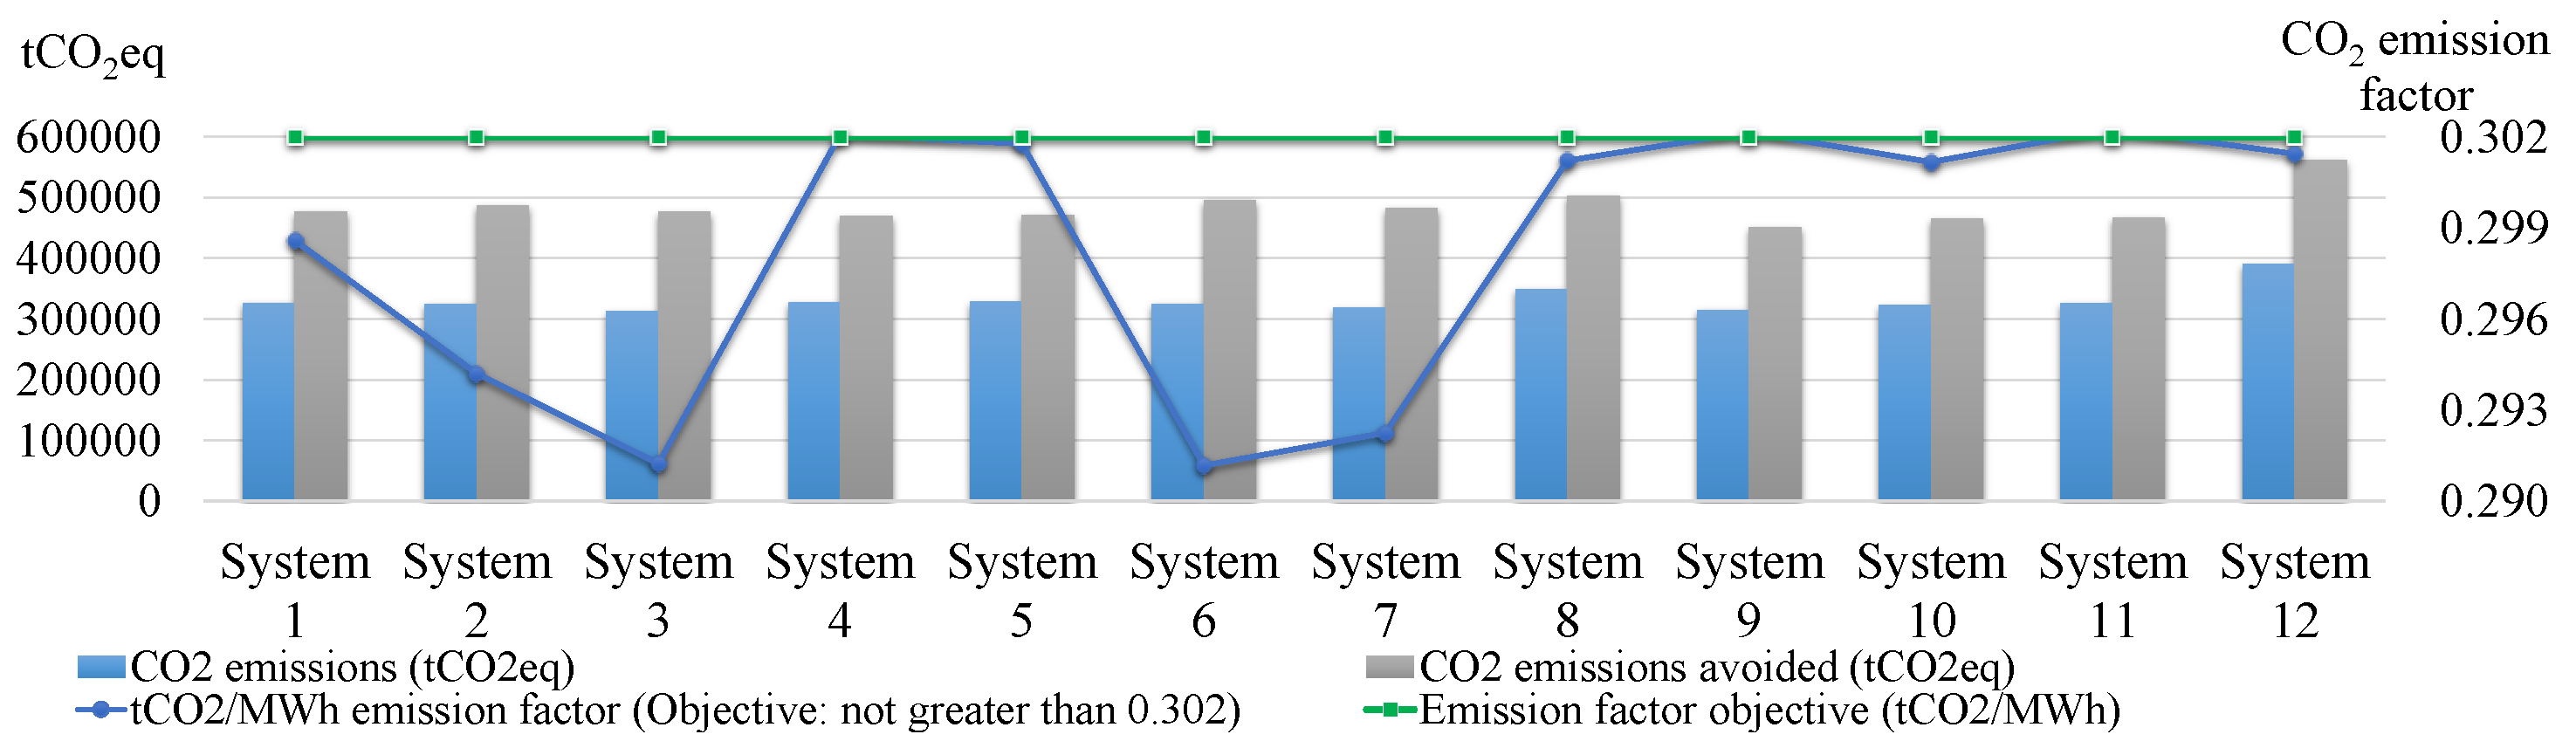
4.6. Emission Factor Reduction Results

The results of the CO 2 factor emission reduction for each MWh produced through electricity generation are indicated in Figure 22 in the Base Scenario for 2050, as an example. In Table 6, point 7 specifies the minimum factor of this emission to achieve the goals in this matter. The amount of CO 2 emissions in the 2000 for an electricity generation of 165,638 MWh on Cozumel Island was 100,095 tCO 2 eq [60]. The emission factor in that year was 0.6043 tCO 2 eq/MWh. In 2014, this emission factor dropped to 0.454 (−24.87% respect to 2000) [90]. In 2018, 2020, 2024, 2030, 2035 and 2050, the minimum emission factor was used, as indicated in point 7 of Table 6.

5. Conclusions and Discussion

To fulfil the 50-50 energy target on a small island—using Cozumel Island, Mexico, as a case study—in order to reduce the fossil fuel consumption through electricity generation from renewable energy sources to cover 50% of all electric consumption by 2050, 12 system proposals were compared and two systems were chosen. Focusing on their overall results, Table 7 shows the quantity of the equipment selected to achieve this target. Meanwhile, Table 9 shows the LCOE for all the systems analysed.
All systems proposed are able to completely satisfy the renewable electricity needed by 2050 in all scenarios. The differences between them were evaluated and two systems, System 2 and System 7, were chosen as eligible systems to be installed. Table 11 shows the ranking points. For System 7, the most important criteria were the overall and the economical results. The criteria used to choose System 2 were land use and technical results. System 7 (Rank 1) had an initial capital cost of 99.3 US$M by 2018 and System 2 (Rank 6) had an initial capital cost of 176.6 US$M (Figure 17). System 7 (Rank 4) had an on-shore impact of 223 Ha and System 2 (Rank 1) had an on-shore impact of 91.9 Ha, and an off-shore impact of 1140 Ha (Figure 11). Figure 21 shows the LCOE results from the two selected systems. According to the targets, input data and operational assumptions and constraints, the economic results shows that System 7 is the best system, with a lower LCOE of 0.1893 US$/kWh by 2050 in the Base Scenario. On the other hand, and also according to the targets, input data and operational assumptions and constraints, the land-used results show that System 2 is the best system, with a lower land surface of 25 Ha used by 2018 and 175 Ha by 2050 in the Base Scenario.
According to System 7, by 2018, in the Base Scenario, by reducing the battery backup time to 1 h, the initial capital cost (INV) was reduced from 99.3 USM$ to 81 USM$ and the LCOE dropped from 0.2265 US$/kWh to 0.2214 US$/kWh. Without batteries, the INV was 62.1 USM$ and the LCOE was 0.2188 US$7kWh. In this scenario and year, for System 7, the cost of each hour of backup with flow batteries was close to 20 USM$/h-backup time.
Each presented simulation includes a sensitivity analysis with a 25-year and 12.5-year lifetime for the PV/Wind technologies. In spite of the 12.5-year lifetime considered, the IRR was maintained above the 13.5% reported by the Mexican government for authorised and presented RE projects. As the results in this paper indicate, the IRR value fluctuated from 17.2% for System 2 to 31% for System 7. The sensitivity analysis was conducted on the basis that one major hurricane would strike the RE plant. If the major hurricane happens before the payback time has been reached, or two or more times within its lifetime project, this proposal could be economically infeasible (Figure 20). It is important to remark that these economic analyses were conducted without capital cost reductions through time. The main objective in this study was to formulate an approach to the investment needed according to the increase in RE and the fulfilment of the targets indicated at the beginning of this work. The report elaborated by the European Commission in the Joint Research Centre, through the Institute for Energy and Transport, contains an assessments of energy technology reference indicators. It is aimed at providing independent and up-to-date cost and performance characteristics of the present and future European energy technology portfolio projections for 2010–2050. As an example of these capital cost reductions, the fixed PV capital cost could be reduced by 58.6% by 2050 in relation to the 2014 prices in the high CAPEX consideration [91]. This study used the worst case scenario with no cost reductions.
The decision to choose to construct the final system relies on broad-based political support by the highest authority, because the decision includes risks in terms of the feasibility and sustainability of renewable energy development [57]. The methodology used in this case study can be applied to others small islands or to the SIDS for planning island electricity systems that will achieve low emission targets in their electricity generation.

Acknowledgments

The author would like to acknowledge the support of the Consejo Nacional de Ciencia y Tecnología (CONACYT) in this work through the financial support of scholarship ID 437020. The author would also like to thank the kind collaboration of Rafael Cervera Casanueva in the proofreading of the text.

Author Contributions

Javier Mendoza-Vizcaino conceived, designed and performed the system simulations and wrote the paper; Andreas Sumper analyzed the data and improved the system; and Samuel Galceran-Arellano contributed with the results analysis.

Conflicts of Interest

The authors declare no conflict of interest. The founding sponsors had no role in the design of the study; in the collection, analyses, or interpretation of data; in the writing of the manuscript, and in the decision to publish the results.

References

  1. Romano, A.A.; Scandurra, G.; Carfora, A.; Pansini, R.V. Assessing the determinants of SIDS’ pattern toward sustainability: A statistical analysis. Energy Policy 2016, 98, 688–699. [Google Scholar] [CrossRef]
  2. Bertin, A.; Frangi, J. Contribution to the study of the wind and solar radiation over Guadeloupe. Energy Convers. Manag. 2013, 75, 593–602. [Google Scholar] [CrossRef]
  3. Meschede, H.; Holzapfel, P.; Kadelbach, F.; Hesselbach, J. Classification of global island regarding the opportunity of using RES. Appl. Energy 2016, 175, 251–258. [Google Scholar] [CrossRef]
  4. Blechinger, P.; Cader, C.; Bertheau, P.; Huyskens, H.; Seguin, R.; Breyer, C. Global analysis of the techno-economic potential of renewable energy hybrid systems on small islands. Energy Policy 2016, 98, 674–687. [Google Scholar] [CrossRef]
  5. Blechinger, P.; Seguin, R.; Cader, C.; Bertheau, P.; Breyer, C. Assessment of the Global Potential for Renewable Energy Storage Systems on Small Islands. Energy Procedia 2014, 46, 294–300. [Google Scholar] [CrossRef]
  6. Kaldellis, J.; Gkikaki, A.; Kaldelli, E.; Kapsali, M. Investigating the energy autonomy of very small non-interconnected islands. Energy Sustain. Dev. 2012, 16, 476–485. [Google Scholar] [CrossRef]
  7. Patlitzianas, K.D.; Christos, K. Effective financing for provision of renewable electricity and water supply on islands. Energy Sustain. Dev. 2012, 16, 120–124. [Google Scholar] [CrossRef]
  8. Díaz-González, F.; Sumper, A.; Gomis-Bellmunt, O.; Villafáfila-Robles, R. A review of energy storage technologies for wind power applications. Renew. Sustain. Energy Rev. 2012, 16, 2154–2171. [Google Scholar] [CrossRef]
  9. Portero, U.; Velázquez, S.; Carta, J.A. Sizing of a wind-hydro system using a reversible hydraulic facility with seawater. A case study in the Canary Islands. Energy Convers. Manag. 2015, 106, 1251–1263. [Google Scholar] [CrossRef]
  10. Chen, C.L.; Chen, H.C.; Lee, J.Y. Application of a generic superstructure-based formulation to the design of wind-pumped-storage hybrid systems on remote islands. Energy Convers. Manag. 2016, 111, 339–351. [Google Scholar] [CrossRef]
  11. Kuang, Y.; Zhang, Y.; Zhou, B.; Li, C.; Cao, Y.; Li, L.; Zeng, L. A review of renewable energy utilization in islands. Renew. Sustain. Energy Rev. 2016, 59, 504–513. [Google Scholar] [CrossRef]
  12. Mendoza-Vizcaino, J.; Sumper, A.; Sudria-Andreu, A.; Ramirez, J. Renewable technologies for generation systems in islands and their application to Cozumel Island, Mexico. Renew. Sustain. Energy Rev. 2016, 64, 348–361. [Google Scholar] [CrossRef]
  13. International Energy Agency (IEA). Energy Technology Perspectives 2014; Technical Report; International Energy Agency: Paris, France, 2014. [Google Scholar]
  14. International Energy Agency (IEA). Energy Technology Perspectives 2015 (Executive Summary); Technical Report; International Energy Agency: Paris, France, 2015. [Google Scholar]
  15. Paris 2015: Tracking country climate pledges. Carbon Brief, 16 September 2015.
  16. United Nations Framework Convention on Climate Change (UNFCCC). Paris Agreement—Status of Ratification; UNFCCC: Paris, France, 2015. [Google Scholar]
  17. Presidency of the Republic of Kazakhstan. CONCEPT for Transition of the Republic of Kazakhstan to Green Economy; Technical Report; Presidency of the Republic of Kazakhstan: Astana, Kazakhstan, 2013.
  18. Climate Action Programme. United Arab Emirates Sets Sights on 50% Clean Energy Target—Climate Action Programme; Climate Action Programme: London, UK, 2017. [Google Scholar]
  19. Ministerio de Pesca y Medio Ambiente (MPMA). Contribuciones Previstas Determinadas a Nivel Nacional; Technical Report; MPMA: Malabo, Equatorial Guinea, 2015.
  20. International Energy Agency (IEA). Island Energy—Status and Perspectives. EXECUTIVE SUMMARY; Technical Report; International Energy Agency: Tokyo, Japan, 2015. [Google Scholar]
  21. Fripp, M. Switch: A Planning Tool for Power Systems with Large Shares of Intermittent Renewable Energy. Environ. Sci. Technol. 2012, 46, 6371–6378. [Google Scholar] [CrossRef] [PubMed]
  22. Nelson, J.; Johnston, J.; Mileva, A.; Fripp, M.; Hoffman, I.; Petros-Good, A.; Blanco, C.; Kammen, D.M. High-resolution modeling of the western North American power system demonstrates low-cost and low-carbon futures. Energy Policy 2012, 43, 436–447. [Google Scholar] [CrossRef]
  23. HOMER Energy LLC. HOMER PRO Ver. 3.7.4; HOMER Energy LLC: Boulder, CO, USA, 2016. [Google Scholar]
  24. Clark, R. A Predictive Optimal Dispatch and Optimal Sizing Method for a System Declaration of Authorship. Master’s Thesis, University of the Witwatersrand, Johannesburg, South Africa, 2014. [Google Scholar]
  25. HOMER Energy LLC. HOMER Microgrid White Papers; HOMER Energy LLC: Boulder, CO, USA, 2017. [Google Scholar]
  26. HOMER Energy LLC. HOMER Energy; HOMER Energy LLC: Boulder, CO, USA, 2017. [Google Scholar]
  27. Lambert, T.; Gilman, P.; Lilienthal, P. MICROPOWER SYSTEM MODELING WITH HOMER. In Integration of Alternative Sources of Energy, 1st ed.; Farret, F.A., Simões, M.G., Eds.; Wiley-IEEE: Hoboken, NJ, USA, 2006; Chapter 15; p. 504. [Google Scholar]
  28. Watson, D.; Binnie, Y.; Duncan, K.; Dorville, J.F. Photurgen: The open source software for the analysis and design of hybrid solar wind energy systems in the Caribbean region: A brief introduction to its development policy. Energy Rep. 2017, 3, 61–69. [Google Scholar] [CrossRef]
  29. Watson, D.; Binnie, Y.; Duncan, K.; Dorville, J.-F. Photurgen 1.0. |The Open-Source Renewable Energy Software, University of the West Indies: Kingston, Jamaica, 2016.
  30. Gils, H.C.; Simon, S. Carbon neutral archipelago—100% renewable energy supply for the Canary Islands. Appl. Energy 2017, 188, 342–355. [Google Scholar] [CrossRef]
  31. Quesada, P.V.; Isidoro, M.A.; López, M.L.A. Curso y Ejercicios de Estadística, 3rd ed.; Alhambra Longman, S.A.: Madrid, Spain, 1982; p. 433. [Google Scholar]
  32. Hong, G.W.; Abe, N.; Baclay, M.; Arciaga, L. Assessing users’ performance to sustain off-grid renewable energy systems: The capacity and willingness approach. Energy Sustain. Dev. 2015, 28, 102–114. [Google Scholar] [CrossRef]
  33. Prasad, R.D.; Raturi, A. Grid electricity for Fiji islands: Future supply options and assessment of demand trends. Energy 2017, 119, 860–871. [Google Scholar] [CrossRef]
  34. Yue, C.D.; Chen, C.S.; Lee, Y.C. Integration of optimal combinations of renewable energy sources into the energy supply of Wang—An Island. Renew. Energy 2016, 86, 930–942. [Google Scholar] [CrossRef]
  35. International Energy Agency (IEA). Key World Energy Statistics; Technical Report; International Energy Agency: Paris, France, 2016. [Google Scholar]
  36. Organization for Economic Cooperation and Development. Primary Energy Supply (Indicator); Organization for Economic Cooperation and Development: Paris, France, 2016. [Google Scholar]
  37. Secretaría de Energía. Sistema de Información de Energía (SIE); Secretaría de Energía: Mexico City, Mexico, 2016.
  38. Iñaki, A.; Iñigo, C.P.; Rosa, L.; Gorka, B.; Bermejo, R. The energy requirements of a developed world. Energy Sustain. Dev. 2016, 33, 1–13. [Google Scholar]
  39. Secretaría de Energía. Development Program for the National Electric System (PRODESEN) 2016–2030 PART II; Technical Report; Secretaría de Energía: Mexico City, Mexico, 2016.
  40. Secretaría de Energía. Prospectiva del Sector Eléctrico (PSE) 2015–2029; Technical Report; Secretaría de Energía: Mexico City, Mexico, 2015.
  41. Presidencia de la República Mexicana. Decreto Expedición de la Ley de la Industria Electrica (LIE) y la Ley de Energía Geortermia (LEG); Technical Report; Presidencia de la República Mexicana: Mexico City, Mexico, 2014.
  42. Secretaría de Energía. Prospectiva de Energías Renovables (PER) 2015–2029; Technical Report; Secretaría de Energía: Mexico City, Mexico, 2015.
  43. International Energy Agency (IEA). Mexico Energy Outlook 2016; Technical Report; International Energy Agency: Paris, France, 2016. [Google Scholar]
  44. Presidencia de la República Mexicana. Ley de Transición Energética (LTE); Technical Report; Presidencia de la Republica: Mexico City, Mexico, 2015.
  45. Presidencia de la República Mexicana. Ley General De Cambio Climático (LGCC); Technical Report; Presidencia de la República Mexicana: Mexico City, Mexico, 2012.
  46. Secretaría de Energía. Estrategia de Transición para Promover el Uso de Tecnologías y Combustibles más Limpios 2016; Technical Report; Secretaría de Energía: Mexico City, Mexico, 2016.
  47. Secretaría de Energía. Programa Especial para el Aprovechamiento de Energías Renovables (PEAER) 2014; Technical Report; Secretaría de Energía: Mexico City, Mexico, 2014.
  48. Secretaría de Medio Ambiente y Recursos Naturales. Estrategia Nacional de Cambio Climático (ENCC); Technical Report; Secretaría de Medio Ambiente y Recursos Naturales: Mexico City, Mexico, 2013.
  49. Secretaría de Energía. Programa Sectorial de Energía (PROSENER) 2013–2018; Technical Report; Secretaría de Energía: Mexico City, Mexico, 2013.
  50. Secretaría de Energía. Estrategia Nacional de Transición Energética y el Aprovechamiento Sustentable de la Energía (ENTEASE) 2014; Technical Report; Secretaría de Energía: Mexico City, Mexico, 2014.
  51. Secretaría de Energía. Estrategia Nacional de Energía (ENE) 2014–2028; Technical Report; Secretaría de Energía: Mexico City, Mexico, 2014.
  52. Secretaría de Energía. Programa Especial de Cambio Climatico (PECC) 2014; Technical Report; Secretaría de Energía: Mexico City, Mexico, 2014.
  53. Secretaría de Energía. Programa Nacional Para el Aprovechamiento Sustentable de la Energía (PRONASE) 2014; Technical Report; Secretaría de Energía: Mexico City, Mexico, 2014.
  54. Secretaría de Energía. Development Program for the National Electric System (PRODESEN) 2016–2030 PART I; Technical Report, Secretaría de Energía: Mexico City, Mexico, 2016. [Google Scholar]
  55. Instituto Nacional de Estadística y Geografía (INEGI). Cuentame (INEGI); INEGI: Mexico City, Mexico, 2015.
  56. Wiken, E.; Jiménez-Nava, F.; Griffith, G. North American Terrestrial Ecoregions—Level III; Technical Report; Commission for Environmental Cooperation: Montreal, QC, Canada, 2011. [Google Scholar]
  57. Dornan, M.; Shah, K.U. Energy policy, aid, and the development of renewable energy resources in Small Island Developing States. Energy Policy 2016, 98, 759–767. [Google Scholar] [CrossRef]
  58. Timilsina, G.R.; Shah, K.U. Filling the gaps: Policy supports and interventions for scaling up renewable energy development in Small Island Developing States. Energy Policy 2016, 98, 653–662. [Google Scholar] [CrossRef]
  59. Comisión Federal de Electricidad (CFE). Economic Dispatch (Despacho económico); CFE: Mexico City, Mexico, 2015.
  60. Instituto Nacional de Estadística y Geografía (INEGI). BIINEGI; INEGI: Mexico City, Mexico, 2015.
  61. Secretaría de Energía. National Inventory of Renewable Energy (INERE); Secretaría de Energía: Mexico City, Mexico, 2016.
  62. Comisión Nacional para el Conocimiento y Uso de la Biodiversidad. INE, (28/10/2014). ‘Ríos. Conjunto de Datos Vectoriales del Instituto Nacional Electoral.’; Comisión Nacional para el Conocimiento y Uso de la Biodiversidad: Mexico City, Mexico, 2015.
  63. Instituto Nacional de Estadística y Geografía (INEGI). Anuario Estadístico y Geográfico de Quintana Roo 2015; Technical Report; Instituto Nacional de Estadística y Geografía: Mexico City, Mexico, 2015.
  64. Instituto Nacional de Estadística y Geografía (INEGI). Atlas Agropecuario: Quintana Roo 1996. Datos Ejidales; Technical Report; Instituto Nacional de Estadística y Geografía: Mexico City, Mexico, 1996.
  65. Villarrubia López, M. Influencia de obstáculos. In Ingeniería de la Energía Eólica, 1st ed.; Marcombo, S., Ed.; Engineering Faculty, Barcelona University: Barcelona, Spain, 2012; Chapter 4; p. 283. [Google Scholar]
  66. Cabrera-Tobar, A.; Bullich-Massagué, E.; Aragüés-Peñalba, M.; Gomis-Bellmunt, O. Review of advanced grid requirements for the integration of large scale photovoltaic power plants in the transmission system. Renew. Sustain. Energy Rev. 2016, 62, 971–987. [Google Scholar] [CrossRef]
  67. Katsigiannis, Y.A.; Georgilakis, P.S.; Karapidakis, E.S. Genetic Algorithm Solution to Optimal Sizing Problem of Small Autonomous Hybrid Power Systems. In Artificial Intelligence: Theories, Models and Applications. LNCS; Konstantopoulos, S., Perantonis, S., Karkaletsis, V., Spyropoulos, C.D., Vouros, G., Eds.; Springer: Berlin/Heidelberg, Germany; Athens, Greece, 2010; Volume 6040, pp. 327–332. [Google Scholar]
  68. Goldwing USA Inc. PMDD Wind Turbine; Goldwing USA Inc.: Chicago, IL, USA, 2016. [Google Scholar]
  69. W2E Wind to Energy GmbH. Harvester 3.0 MW; W2E Wind to Energy GmbH: Rostock, Germany, 2016. [Google Scholar]
  70. Sany Heavy Energy Machinery Co. Ltd. Poem of the Wind; Sany Heavy Energy Machinery Co. Ltd.: Beijing, China, 2016. [Google Scholar]
  71. EWT Americas Inc. Power Curve DW54; EWT Americas Inc.: Amersfoort, Germany, 2016. [Google Scholar]
  72. ENERCON GmbH. ENERCON Product Overview; ENERCON GmbH: Aurich, Germany, 2016. [Google Scholar]
  73. EnSync Inc. Agile Flow Battery; EnSync Inc.: Menomonee Falls, WI, USA, 2016. [Google Scholar]
  74. Manwell, J.F.; McGowan, J.G. Lead acid battery storage model for hybrid energy systems. Sol. Energy 1993, 50, 399–405. [Google Scholar] [CrossRef]
  75. EnSync Inc. EnerSection® Power & Energy Control; EnSync Inc.: Menomonee Falls, WI, USA, 2016. [Google Scholar]
  76. International Energy Agency (IEA). Next Generation Wind and Solar Power; Technical Report; International Energy Agency: Paris, France, 2016. [Google Scholar]
  77. International Energy Agency (IEA); Organization for Economic Cooperation and Development (OECD); Nuclear Energy Agency (NEA). Projected Costs of Generating Electricity, 2015 ed.; Technical Report; International Energy Agency: Paris, France, 2015. [Google Scholar]
  78. Huff, G.; Currier, A.B.; Kaun, B.C.; Rastler, D.M.; Chen, S.B.; Bradshaw, D.T.; Gauntlett, W.D. DOE/EPRI 2013 Electricity Storage Handbook in Collaboration with NRECA; Report SAND2013; Sandia National Laboratories: Albuquerque, NM, USA, 2013; p. 340. [Google Scholar]
  79. Wiser, R.; Bolinger, M. 2015 Wind Technologies Market Report; Technical Report, U.S. Department of Energy, Office of Scientific and Technical Information: Oak Ridge, TN, USA, 2016. [Google Scholar]
  80. World Bank. World Bank Data; World Bank: Washington, DC, USA, 2016. [Google Scholar]
  81. Figueroa-Espinoza, B.; Salles, P.; Zavala-Hidalgo, J. On the wind power potential in the northwest of the Yucatan Peninsula in Mexico. Atmósfera 2014, 27, 77–89. [Google Scholar] [CrossRef]
  82. Diario Oficial de la Federación (DOF). Exchange Rate Indicators; DOF: Mexico City, Mexico, 2016.
  83. Centro Nacional de Control de Energía (CENACE). Resultados Preliminares de la 2a Subasta Eléctrica de Largo Plazo; CENACE: Mexico City, Mexico, 2016.
  84. Ramirez, M.G.; Román, K.E.Á. Ciclones tropicales que se formaron al Este de las Antillas menores e impactaron los estados costeros del litoral oriental de México de 1900 al 2003. Revista Geográfica 2005, 137, 57–80. [Google Scholar]
  85. Division, H.R. Hurrican Data By Year and Storm; National Oceanic and Atmospheric Administration (NOAA): Virginia Key, FL, USA, 2016.
  86. Schott, T.; Landsea, C.; Hafele, G.; Lorens, J.; Thurm, H.; Ward, B.; Willis, M.; Zaleski, W. The Saffir-Simpson Hurricane Wind Scale; National Hurricane Center, National Oceanic and Atmospheric Administration (NOAA): Virginia Key, FL, USA, 2012; pp. 1–4.
  87. Minitab Inc. Minitab® Statistical Software, Minitab Inc.: State College, PA, USA, 2013.
  88. Vidal-Amaro, J.J.; Østergaard, P.A.; Sheinbaum-Pardo, C. Optimal energy mix for transitioning from fossil fuels to renewable energy sources—The case of the Mexican electricity system. Appl. Energy 2015, 150, 80–96. [Google Scholar] [CrossRef]
  89. Østergaard, P.A. Reviewing EnergyPLAN simulations and performance indicator applications in EnergyPLAN simulations. Appl. Energy 2015, 154, 921–933. [Google Scholar] [CrossRef]
  90. Secretaría de Medio Ambiente y Recursos Naturales. Factor de Emisión Eléctrico 2014 (Programa GEI México); Secretaría de Medio Ambiente y Recursos Naturales: Mexico City, Mexico, 2014.
  91. Joint Research Centre of the European Commission. Energy Technology Reference Indicator Projections for 2010–2050; Technical Report; Institute for Energy and Transport of the Joint Research Centre of the European Commission: Petten, The Netherlands, 2014. [Google Scholar]
Figure 1. Methodology used to integrate the renewable electricity generation on small islands.
Sustainability 09 00905 g001
Figure 2. Cozumel Island location [12].
Sustainability 09 00905 g002
Figure 3. Electricity consumption and forecast on Cozumel Island from 2000 to 2050, based on the information from [39,55,59,60].
Sustainability 09 00905 g003
Figure 4. Electric consumption on Cozumel Island from 2000 to 2015 [59,60].
Sustainability 09 00905 g004
Figure 5. Forecast of maximum power demand on Cozumel Island from 2016 to 2050, based on the information from [39,55,59,60].
Sustainability 09 00905 g005
Figure 6. Maximum power demand on Cozumel Island from 2008 to 2013 [59].
Sustainability 09 00905 g006
Figure 7. Atlas for RE potential in the Peninsula Area [61,62]. (a) Renewable Electricity generated and RE fraction; (b) RE capacity installed and on-shore surface used.
Sustainability 09 00905 g007
Figure 8. PV and wind turbine combination on a proposed 5 Ha area of land (dimensions are in meters).
Sustainability 09 00905 g008
Figure 9. Topology and renewable electricity system, including the current generation and main transformation system, proposed for Cozumel Island.
Sustainability 09 00905 g009
Figure 10. Operational curve for System 7 in the Base Scenario for Cozumel Island by 2018.
Sustainability 09 00905 g010
Figure 11. Results of on-shore and off-shore surface area used by each system on Cozumel Island for 2050 in the Base Scenario.
Sustainability 09 00905 g011
Figure 12. Results of renewable electricity generated vs. its objective for each system in the Base Scenario.
Sustainability 09 00905 g012
Figure 13. Results of total renewable power capacity installed vs. its objective for each system in the Base Scenario.
Sustainability 09 00905 g013
Figure 14. Results of reserve margin vs. its objective for each system in the Base Scenario.
Sustainability 09 00905 g014
Figure 15. Technical evaluation results by system, from best (1) to worst (12) in 25-year lifetime on Cozumel Island for 2050 in the Base Scenario. (a) Renewable Electricity generated and RE fraction; (b) RE capacity installed and on-shore surface area used.
Sustainability 09 00905 g015
Figure 16. Economical evaluation results by system, from best (1) to worst (12) on Cozumel Island for 2050 in the Base Scenario. (a) Levelized Cost of Energy (LCOE), Operation and Maintenance (O&M), Initial Capital Cost (INV) and Net Present Cost (NPC) for 25-year lifetime; (b) LCOE, O&M and NPC for 12.5-year lifetime.
Sustainability 09 00905 g016
Figure 17. The results are the investments needed depending on when the project starts. These amounts are calculated on the basis of the money invested in 2016 in US$M. (a) Investments for System 2 in the Base Scenario; (b) Investments for System 7 in the Base Scenario.
Sustainability 09 00905 g017
Figure 18. After the project begins, each year shows a complementary investment that needs to be made until 2050. These amounts are calculated on the basis of the money invested in 2016 US$M. (a) Investments for System 2 starting in 2018; (b) Investments for System 2 starting in 2024.
Sustainability 09 00905 g018
Figure 19. After the start of the project, each year shows a complementary investment that needs to be made until 2050. These amounts are calculated on the basis of the money invested in 2016 US$M. (a) Investments for System 7 starting in 2018; (b) Investments for System 7 starting in 2024.
Sustainability 09 00905 g019
Figure 20. Comparison of economic results in Internal Return Rate (IRR) and Payback time between System 2 and System 7 in the Base Scenario.
Sustainability 09 00905 g020
Figure 21. Economic results comparison in Levelized Cost Of Energy (LCOE) for 25-year and 12.5-year lifetime between System 2 and System 7 in the Base Scenario.
Sustainability 09 00905 g021
Figure 22. Results in CO 2 emissions emitted and avoided by each system and emission factor vs. their objectives on Cozumel Island for 2050 in the Base Scenario.
Sustainability 09 00905 g022
Table 1. Intended Nationally Determined Contributions (INDCs) and the Paris Agreement signature dates [15,16].
Intended Nationally Determined Contributions (INDCs)Paris Agreement
Number of parties that have submitted an INDC:189Summary of the INDCsShare of 2012 Greenhouse Gases (GHG)SignatureRatificationEntry into Force
Share of global emissions covered by INDCs:99.10%Acceptance (A)
No.CountryDate
1China30 June 2015A peak in carbon dioxide emissions by 2030, with best efforts to peak earlier. China has also pledged to source 20% of its energy from low-carbon sources by 2030 and to cut emissions per unit of GDP by 60–65% of 2005 levels by 2030, potentially putting it on course to peak by 2027.23.75%22 April 201603 September 201604 November 2016
2USA31 March 201526–28% domestic reduction in greenhouse gases by 2025 compared to 2005, making its best effort to reach the 28% target.12.10%22 April 201603 September 2016 (A)04 November 2016
3EU06 March 2015At least a 40% domestic reduction in greenhouse gases by 2030 compared to 1990 levels.8.97%22 April 201605 October 201604 November 2016
4India01 October 2015A 33–35% reduction in emissions intensity by 2030, compared to 2005 levels. Also pledges to achieve 40% of cumulative electricity installed capacity from non-fossil fuel based resources by 2030. Will also increase tree cover, creating an additional carbon sink of 2.5 to 3 billion tonnes of CO 2 equivalent by 2030.5.73%22 April 201602 October 201604 November 2016
5Brazil28 September 2015A 37% reduction in emissions by 2025, compared to 2005 levels, with a further indicative target of a 43% reduction in emissions by 2030.5.70%22 April 201621 September 201604 November 2016
6Russia31 March 201525–30% domestic reduction in greenhouse gases by 2030 compared to 1990 levels.5.35%22 April 2016
7Japan17 May 2015A 26% reduction in emissions on 2013 levels by 2030.2.82%22 April 201608 November 2016 (A)08 December 2016
8Canada15 May 2015A 30% reduction on 2005 greenhouse gas emissions, by 2030.1.96%22 April 201605 October 201604 November 2016
9Congo18 August 2015A 17% reduction compared to a business-as-usual scenario by 2030.1.53%22 April 2016
10Indonesia23 September 2015A 29% reduction in emissions by 2030, compared to business as usual.1.49%22 April 201631October 201630 November 2016
11Australia11 August 2015A 26% to 28% reduction in emissions by 2030 on 2005 levels.1.45%22 April 201609 November 201609 December 2016
12South Korea30 June 2015A 37% reduction on business-as-usual emissions by 2030.1.28%22 April 201603 November 201603 December 2016
13Mexico30 March 2015Unconditional 25% reduction in greenhouse gases and short lived climate pollutants from a business-as-usual scenario by 2030, which would rise to 40% subject to the outcome of a global climate deal. For the unconditional pledge, this means peaking net emissions by 2026 and reducing emissions intensity per unit of GDP by around 40% from 2013 to 2030.1.27%22 April 201621 September 201604 November 2016
14Bolivia12 October 2015Ending illegal deforestation by 2020, and increasing the share of renewable energy to 79% by 2030 from 39% in 2010.1.19%22 April 201605 October 201604 November 2016
15Iran21 November 2015A 4% cut in emissions by 2030 relative to business as usual.1.05%22 April 2016
16Saudi Arabia10 November 2015Expects emissions savings of up to 130 million tonnes of CO 2 equivalent in 2030, relative to business as usual.1.05%03 November 201603 November 201603 December 2016
17Myanmar28 September 2015Increase hydropower capacity to 9.4 gigawatts by 2030, to achieve rural electrification based on at least 30% renewable sources and to increase the forested area to 30% by 2030.1.01%22 April 2016
27Kazakhstan28 September 2015An unconditional 15% reduction in economy-wide emissions by 2030, compared to 1990 levels.0.70%02 August 20166 December 201605 January 2017
35United Arab Emirates22 October 2015Increase the share of “clean energy” in the energy mix to 24% by 2021, up from 0.2% in 2014.0.39%22 April 201621 September 2016 (A)04 November 2016
134Equatorial Guinea21 September 2015A 20% reduction in greenhouse gas emissions by 2030, compared to 2010 levels, with a longer-term goal to cut emissions 50% by 2050.0.01%22 April 2016
141Niue25 November 2015Commits to increase the share of renewables in its electricity generation to 38% by 2020, up from 2% in 2014. This will partly be delivered through a 10% reduction in electricity demand.0.00%28 October 201628 August 201627 November 2016
142Micronesia24 November 2015An unconditional reduction in greenhouse gases by 28% on 2000 levels by 20250.00%22 April 201615 September 201604 November 2016
144Cook Islands20 November 2015An 81% reduction in emissions by 2030 compared to 2006 levels.0.00%24 June 201601September 201604 November 2016
145Saint Lucia18 November 2015Commits to a 23% reduction in emissions by 2030 compared to a business-as-usual scenario, equating to emissions reductions of 188GgCO 2 e, with an intermediate target of a 16% reduction by 2023.0.00%22 April 201622 April 201604 November 2016
146Saint Vincent and the Grenadines18 November 2015Unconditional 22% reduction in emissions by 2025, compared to a business-as-usual scenario.0.00%22 April 201629 June 201604 November 2016
148Fiji05 November 2015An unconditional 10% emissions cut by 2030, compared to business-as-usual levels. Also targets 100% renewable electricity by 2030.0.00%22 April 201622 April 201604 November 2016
149Antigua and Barbuda19 October 2015By 2030 reaching 50 megawatts of renewable power capacity.0.00%22 April 201621 September 201604 November 2016
151Samoa01 October 2015Commits to generating 100% of its electricity from renewable energy by 2025.0.00%22 April 201622 April 2016
154Barbados29 September 2015A 44% economy-wide emissions cut in 2030, compared to business as usual. Its interim goal of 37% in 2025 is equivalent to a 21% cut relative to 2008 levels.0.00%22 April 201622 April 201604 November 2016
155Cabo Verde29 September 2015Increasing renewable energy grid penetration, increasing energy efficiency and reforestation programmes.0.00%22 April 2016
156Dominica29 September 2015An 18% emissions cut by 2020, compared to 2014 levels, with cuts of 39% by 2025 and 45% by 2030 against the same baseline.0.00%22 April 201621 September 201604 November 2016
157Vanuatu29 September 2015Moving to 65% renewable energy use by 2020 and nearly 100% renewable electricity by 2030, reducing energy emissions by 30% in 2030 compared to business as usual.0.00%22 April 201621 September 201604 November 2016
158Maldives28 September 2015An unconditional 10% reduction in energy sector emissions by 2030, compared to business as usual.0.00%22 April 201622 April 201604 November 2016
159Kiribati26 September 2015A conditional 13.7% by 2025 and 12.8% by 2030 reduction, compared to business as usual levels.0.00%22 April 201621 September 201604 November 2016
165Marshall Islands21 July 2015A 32% reduction in emissions below 2010 levels by 2025, with a further indicative target to reduce emissions by 45% below 2010 levels by 2030, with a view to achieving net zero GHG emissions by 2050, or earlier if possible.0.00%22 April 201622 April 201604 November 2016
Table 2. Targets summary of electricity generation in renewable energy (RE) for Mexico by 2050 [39,40,42,44,45,46,47,48,49,50,51,52,53].
No.SubjectScenario2018202020212024203020352050
1Electricity generation with renewable energy sources (%)High25.0%30.0%30.0%35.0%38.0%40.7%50.0%
Base
Low
2Renewable power generation capacity installed (%)High34.6%35.4%35.8%37.1%39.7%42.1%50.0%
Base
Low
3Reduction of the CO 2 emission factor respect to 2000 (0.604 tCO 2 eq/MWhel)High −30.0% −50.0%
Base
Low
Table 3. Peninsular annual average growth rate expected from 2016 to 2030 [39].
Scenario
LowBaseHigh
Electricity consumption (%)4.73.83.3
Power demanded (%)4.94.13.6
Table 4. Systems proposed for the hybrid system simulations.
Technology TypePVWindWindWindWindWindWindWind
CompanyGenericGoldWindWind to EnergySanyEWTEWTEWTEnercon
Power curve type III BIII ASIII BIII BIII BI A
Capacity333.33 kW2.5 MW3 MW2 MW250 kW500 kW900 kW7.5 MW
Model GW121W2E 132SE11520DW 54/250DW 54/500DW 54/900E-126 135
Place to installOn-shoreOn-shoreOff-shoreOn-shoreOn-shoreOn-shoreOn-shoreOff-shore
System 1
System 2
System 3
System 4
System 5
System 6
System 7
System 8
System 9
System 10
System 11
System 12
All systems include:W DieselM DieselGE DieselTurbogasEnerStoreEnerSection
Diesel50 kWhConverter
*Only for years 2021, 2024, 2030, 2035 and 2050*
Table 5. Economic and financial parameters for the technologies used in the simulations
ConceptUnitDieselWindPVFlow Batteries
CurrentNewOn-ShoreOff-Shore(Bulk Storage)
Capital Cost$/kW0620160045001346484
$/kWh 238
Remplacement Cost$/kW620160045001346
O&M$/kWh-year 0.025 0.0005
$/h0.0042
$/kW 194.50
Diesel price$/L1
Lifetimeyear25
Discount Rate%10
Inflation Rate%3
Real Discount Rate%6.8
Diesel start cost$/year1241
CurrencyUS $2016 constant
Operating Reserve%6
Random Variability of electric load%0
Table 6. Forecast of the electrical system of Cozumel Island to be fulfilled with the simulation results until 2050.
No.SubjectScenario2018202020212024203020352050
1Electricity consumed (GWh/year)High313.3343.4359.6412.7543.7684.01362.2
Base305.3328.9341.4381.9477.6575.51007.0
Low300.9321.1331.7365.6444.2522.5850.4
2Maximum power demand (MW)High53.258.561.470.994.4119.9245.8
Base51.655.958.265.683.5102.1186.6
Low50.654.356.362.677.392.3156.9
3Electricity generation with renewable energy sources (GWh/year)High78.3103.0107.9144.3206.5278.3681.1
Base76.398.7102.4133.5181.4234.1503.5
Low75.296.399.5127.9168.7212.6425.2
4Renewable power generation capacity installed including 6% of reserve margin (MW)High19.522.023.327.839.853.5130.3
Base18.921.022.125.835.245.598.9
Low18.620.421.424.632.641.283.2
5Electricity generation with fossil fuel sources (GWh/year)High235.0240.4251.7268.4337.2405.7681.1
Base229.0230.3239.0248.3296.2341.4503.5
Low225.7224.8232.2237.8275.5310.0425.2
6Fossil fuel power generation capacity installed including 6% of reserve margin (MW)High36.940.141.847.360.373.6130.3
Base35.838.339.643.853.462.798.9
Low35.137.238.341.749.456.783.2
7Reduction of the CO 2 emission factor respect to 2000 (0.604 tCO2eq/MWhel)High
Base0.4330.4230.4180.4040.3780.3570.302
Low (−30%) (−50%)
8Reserve Margin (%)High6%
Base
Low
Table 7. System results for electric generation for 2050 in the Base Scenario.
PV (MW) GW121 Quantity W2E 132 Quantity SE11520 Quantity DW 54/250 Quantity DW 54/500 Quantity DW 54/900 Quantity E-126 135 Quantity W Diesel (MW) M Diesel (MW) GE Diesel (MW) Turbogas Diesel (MW)EnerStore 50 kWh QuantityEnerSection Converter (MW)
System 123.771 16.321438.51305130128.25
System 211.73534 16.321438.51305130128.25
System 355.7 39 167 16.321438.51305130128.25
System 449.7 39 149 16.321438.51305130128.25
System 545.7 39 137 16.321438.51305130128.25
System 6 67 16.321438.51305130128.25
System 730.4 85 16.321438.51305130128.25
System 8 5316.321438.51305130128.25
System 9134.4 401 16.321438.51305130128.25
System 10127.7 383 16.321438.51305130128.25
System 11116.7 350 16.321438.51305130128.25
System 12527.0 16.321438.51305130128.25
Table 8. Levelized Cost of Energy (LCOE) resultant for each piece of selected generation equipment for every scenario and key years.
Generation Equipment LCOE (US$/kWh) 25 Years Lifetime ProjectLCOE (US$/kWh) 12.5 Years Lifetime Project Generation Equipment LCOE (US$/kWh) 25 Years Lifetime ProjectLCOE (US$/kWh) 12.5 Years Lifetime Project
PV0.090.13DW 54/900 kW0.120.16
GW121/2.5 MW0.060.08E-126 135 7.5 MW0.250.34
W2E 132/3 MW0.140.19W Diesel0.230.23
SE11520 2 MW0.060.08M Diesel0.230.23
DW 54/250 kW0.060.07GE Diesel0.230.23
DW 54/500 kW0.080.11Turbogas Diesel0.250.25
Table 9. Economic results for the systems with a projected lifetime of 25 years and 12.5 years by 2050 in the Base Scenario.
Common Results25 Years Lifetime12.5 Years Lifetime
Initial Capital Cost (INV) (US$M)Discounted Present Value (DPV) (US$M)Internal Return Rate (IRR) (%)Discounted Payback (year)LCOE (US$/kWh)Net Present Cost (NPC) (US$B)Operation & Maintenance (O&M) (US$M)LCOE (US$/kWh)Net Present Cost (NPC) (US$B) Operation & Maintenance (O&M) (US$M)
System 14391,11330.14.00.19262.31570.20422.4169
System 273881617.66.90.21752.61570.24012.9180
System 379181816.97.10.21732.61520.24192.9177
System 483671115.38.00.22632.71570.25253.0184
System 590863613.99.10.23242.81570.26133.1187
System 61,02852112.011.70.24222.91570.27543.3191
System 74361,15231.03.80.18932.31540.20082.4166
System 81,912−4653.916.10.32463.91660.39044.7232
System 94641,12329.24.10.19202.31540.20452.4167
System 1060196722.15.60.20492.41560.22252.7173
System 1178476916.57.30.22142.61570.24572.9181
System 1283250913.09.80.24342.91750.26953.2201
Table 10. Tropical Storms and Hurricanes in Quintana Roo State from 1901 to 2015 [84,85].
190119091916193119331938
From Tropical Storm to
Hurricane category 2
Hurricane category 3
or higher
194219441955196719711974
From Tropical Storm to
Hurricane category 2
Hurricane category 3
or higher
197519882003200520072008
From Tropical Storm to
Hurricane category 2
Hurricane category 3
or higher
201020112012201320142015
From Tropical Storm to
Hurricane category 2
Hurricane category 3
or higher
Table 11. Results for 2050 in the Base Scenario in ranking and points for the analysed systems.
Main CategorySecondary Categories
Overall Points and Ranking ObtainedEconomical Points and Ranking ObtainedTechnical Points and Ranking ObtainedLand-Use Points and Ranking Obtained
PointsRankPointsRankPointsRankPointsRank
System 71223178713752614
System 11158272433643702
System 911003752232752110
System 2954448463861841
System 10916562842608289
System 3803640173484546
System 117897540521410358
System 4680831193086614
System 55999249102817693
System 124571031989611427
System 6414111751122591411
System81891290129212712

