1. Introduction
Desertification is a major ecological problem worldwide [
1,
2]. In China, desertification threatens more than a quarter of the national land area, and has become one of the most serious ecological and social problems [
3,
4,
5]. Revegetation using woody species can effectively halt desert encroachment [
6]. However, vegetation restoration in arid and semi-arid regions is largely controlled by soil water availability [
7]. As the main source of soil water recharge in arid and semi-arid regions [
8], rainfall directly affects the soil water balance through hydrological processes, such as rainwater infiltration, runoff generation, and groundwater recharge, at both local and catchment scales [
9,
10,
11]. Thus, understanding the balance is essential to quantify the linkage between regional hydrology, ecology, and physiography [
12].
The Horqin Sandy Land, located in a semiarid agro-pastoral transition zone between the Inner Mongolian Plateau and the Northeast Plains of China, has become one of the most severely desertified regions in China, mainly attributed to long-term human disturbances including overgrazing and extensive firewood harvesting [
13,
14]. Dune-interdunes (e.g., mobile, semi-mobile, semi-fixed, and fixed dunes-interdunes) are the main landscape types in this region [
11], where ecosystems are sensitive and fragile to climate change and human activities [
15]. Since the 1980s, large areas revegetation projects have been initiated to stabilize sand dunes in the Horqin Sandy Land [
16,
17,
18,
19], and rates of desertification has slowed down and even reversed in some areas [
20,
21,
22]. However, water shortages have become more serious as the initially simple vegetation system developed into a complex ecosystem required to reverse desertification in these areas [
14,
23]. Given this situation, a good understanding of water balance dynamics of micro-landforms in the dune-interdune landscape is essential in determining the water-use efficiency of plants at different positions and developing viable water-saving management strategies.
However, quantitative investigation of water balance dynamics including evapotranspiration, soil water storage change, drainage, and lateral flow in the dune-interdune landscape, remains a difficult task. This is because experimental observations are easily restricted by test conditions with unexpected results, and there is an absence of sufficiently rapid techniques to measure these water balance components. Numerical simulation is a flexible and cost-efficient alternative and approximates the hydrological system using computational models. Some scholars have applied mechanistic models such as HYDRUS, SWMS, and APRI to investigate the hillslope hydrological mechanisms related to the management of water resources [
24,
25,
26]. However, to our knowledge, there has been no research on predicting hydrological processes in the dune-interdune landscape in the Horqin Sandy Land using hydrological models. The SWMS-2D model offers ease of use and nearly perfect mass balances [
27]; however, no data have yet been reported in the literature on the model’s ability to model the water flow in the Horqin Sandy Land.
Therefore, in this study, the SWMS-2D model was applied to study the water flow in the dune-interdune landscape. It was hypothesized that micro-topography drives differences in water budgets among the top, upper, down, and bottom positions of the dune slope, and the lowland area. The objective of this study was to compare the seasonal variations of water balance components based on the calibrated and validated SWMS-2D model in different micro-landforms during the growing season. The expected outcomes of this study could be generalized to other similar areas with corresponding model calibration, and would improve our general understanding of water balance variations under the local topography, climate, soil, and vegetation conditions.
2. Materials and Methods
2.1. Field Experimental Data
2.1.1. Study Site
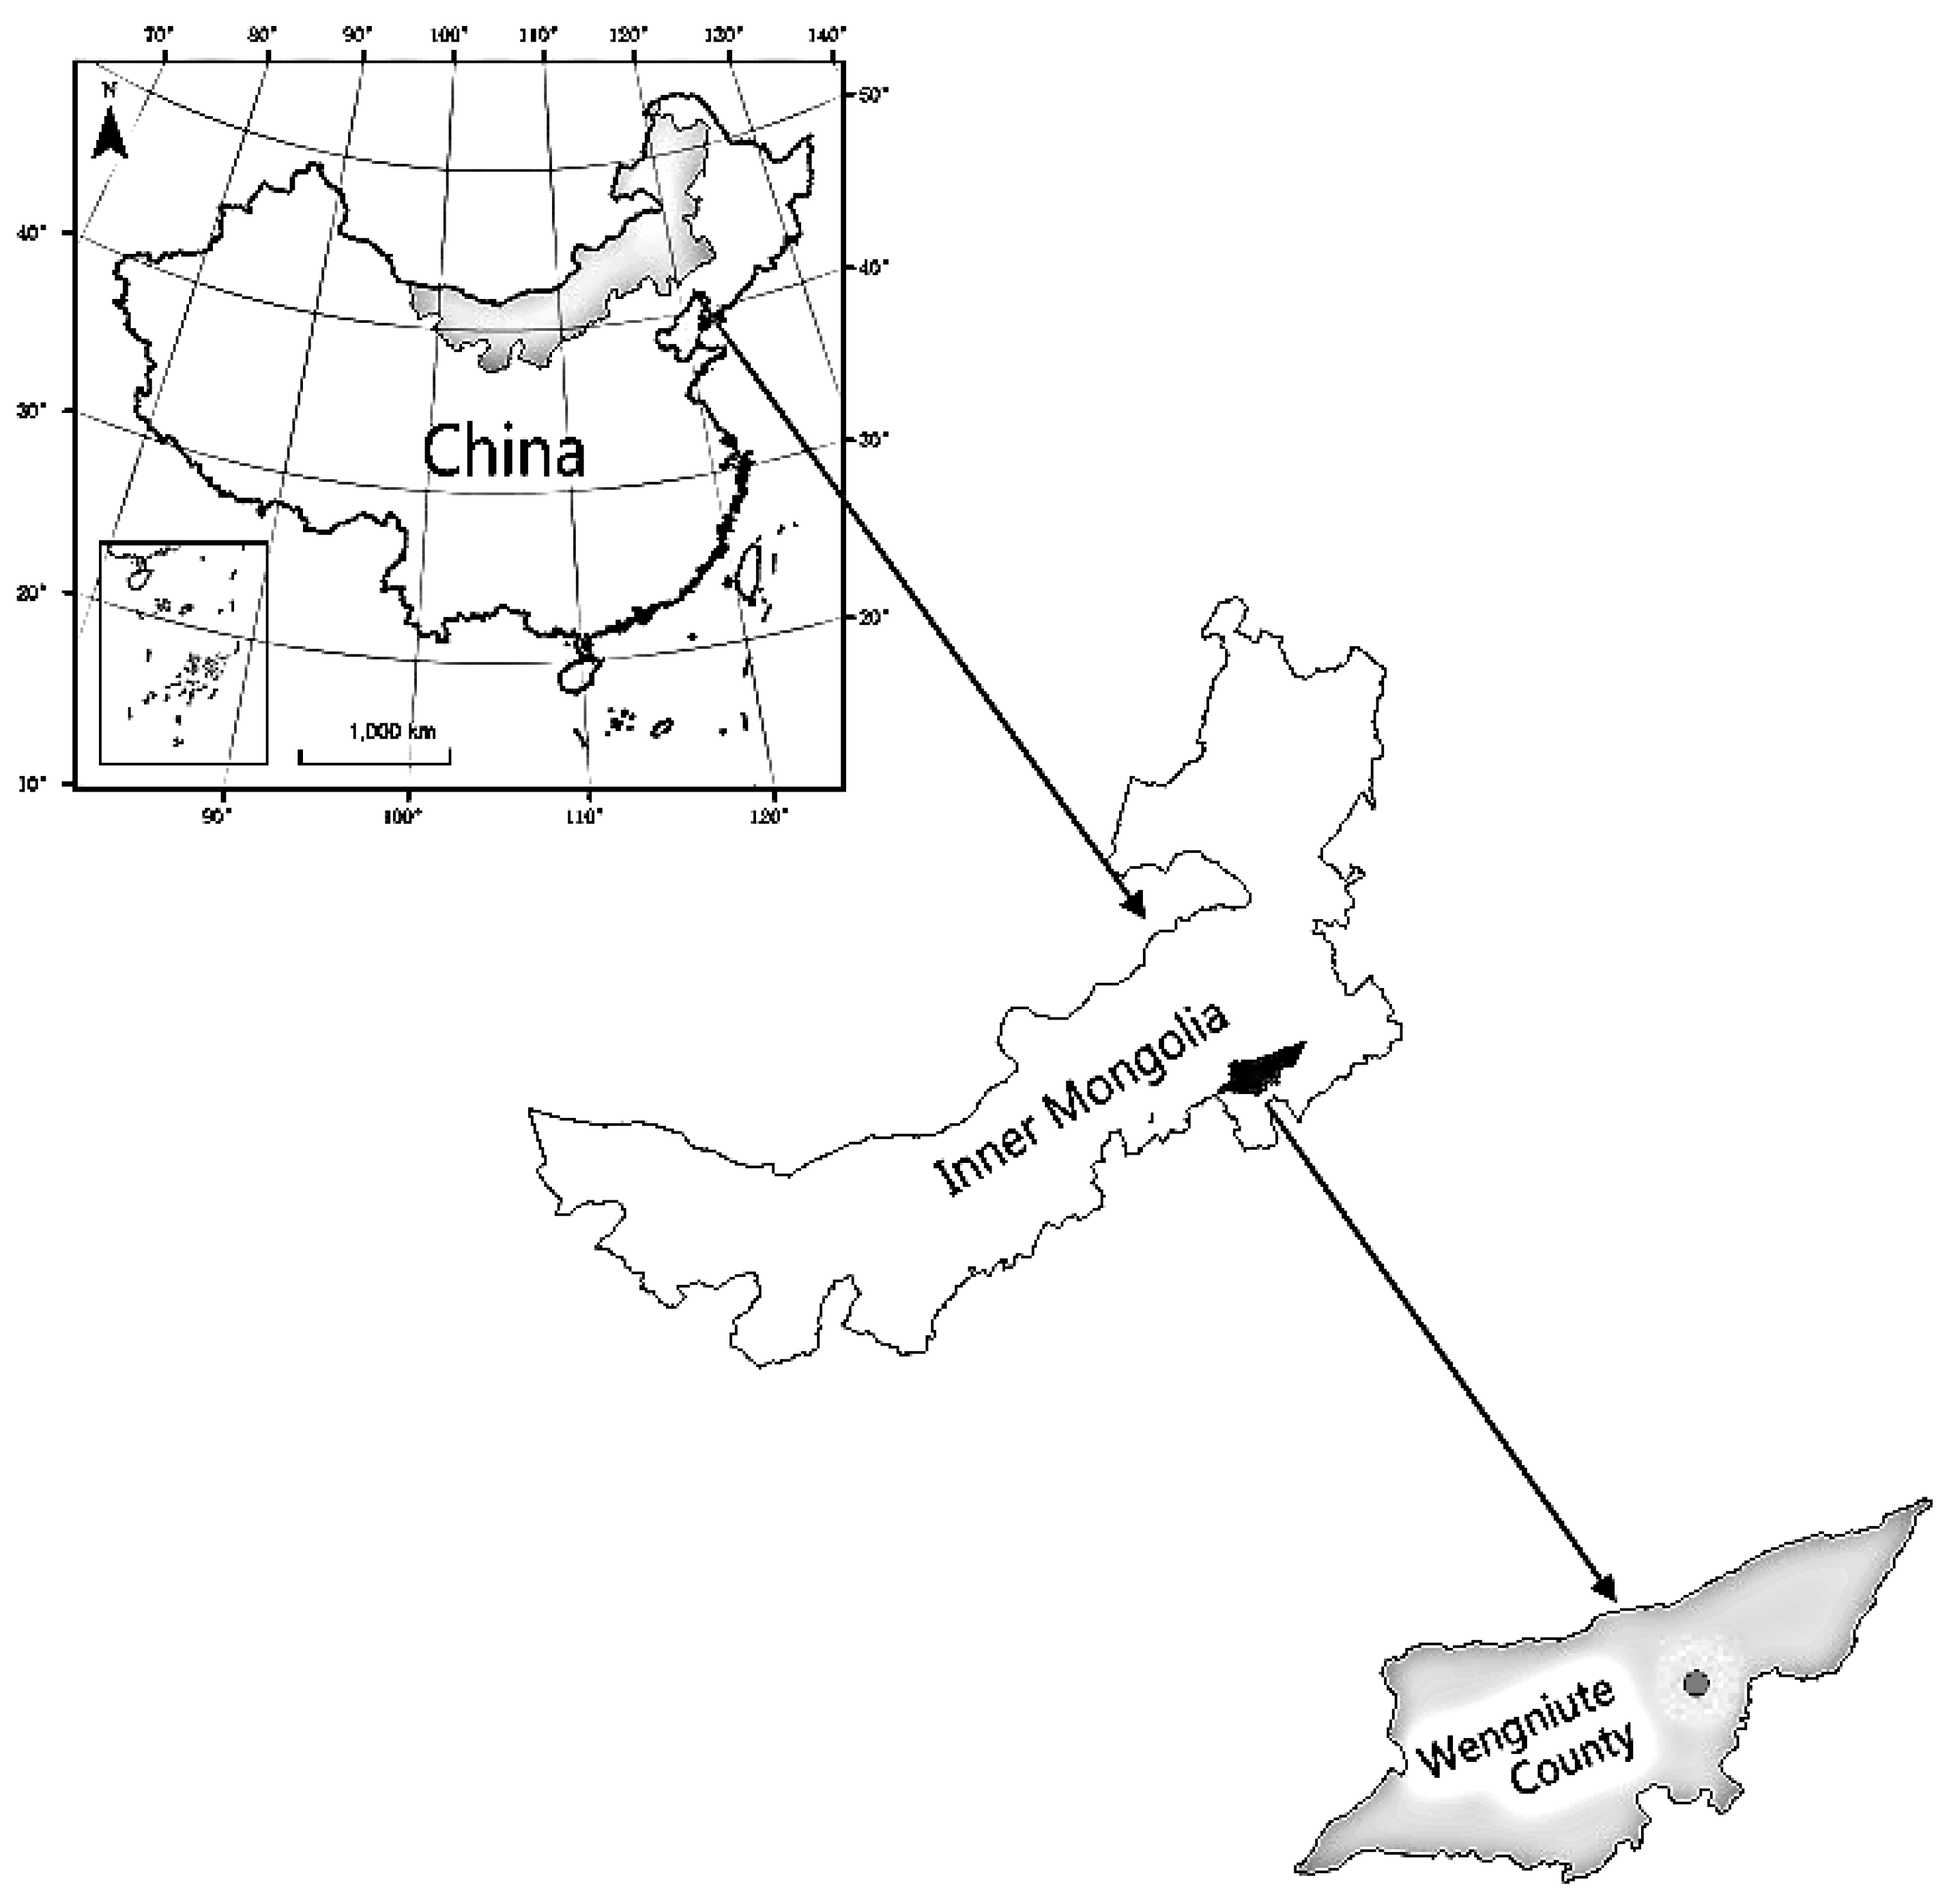
The study was conducted at Wulanaodu Experimental Station of Desertification (43°02′N, 119°39′E and 498 m above sea level) (
Figure 1), Chinese Academy of Sciences, located in Western Horqin Sandy Land, Northeast China. The region has a semiarid continental monsoon climate. The mean annual wind velocity is 4.2 m s
−1, and the prevailing wind direction is northwest in winter and spring, and southwest to south in summer and autumn. The mean annual precipitation (
P) is 284 mm, with about 70% of this occurring between June and August, while the mean annual pan evapotranspiration (
ET) is over 2300 mm. The annual mean temperature is 6.2 °C, and the frost-free period is 130 days. The minimum of monthly mean temperature was −11.7 °C in January, and the maximum was 23.6 °C in July.
The study area is characterized by sand dunes that alternate with gently undulating interdune lowlands. Soil textures are mainly fine sand and sandy loam with a loose structure, which are vulnerable to erosion. Moreover, caliche is generally found in the form of either nodules or layers in the soil profile, and meadow saline soil is commonly distributed in the interdune lowlands. The vegetation at the site is dominated by shrubs (e.g., Caragana microphylla in the dune area, and Tamarix chinensis and Salix flavida in the lowland area), and herbaceous plants (e.g., Setaria viridis, Leymus chinensis and Bassia dasyphylla) are randomly dispersed under these shrubs.
2.1.2. Sampling and Measurements
We selected an area of typical dune-interdune as the experimental plot. In this area,
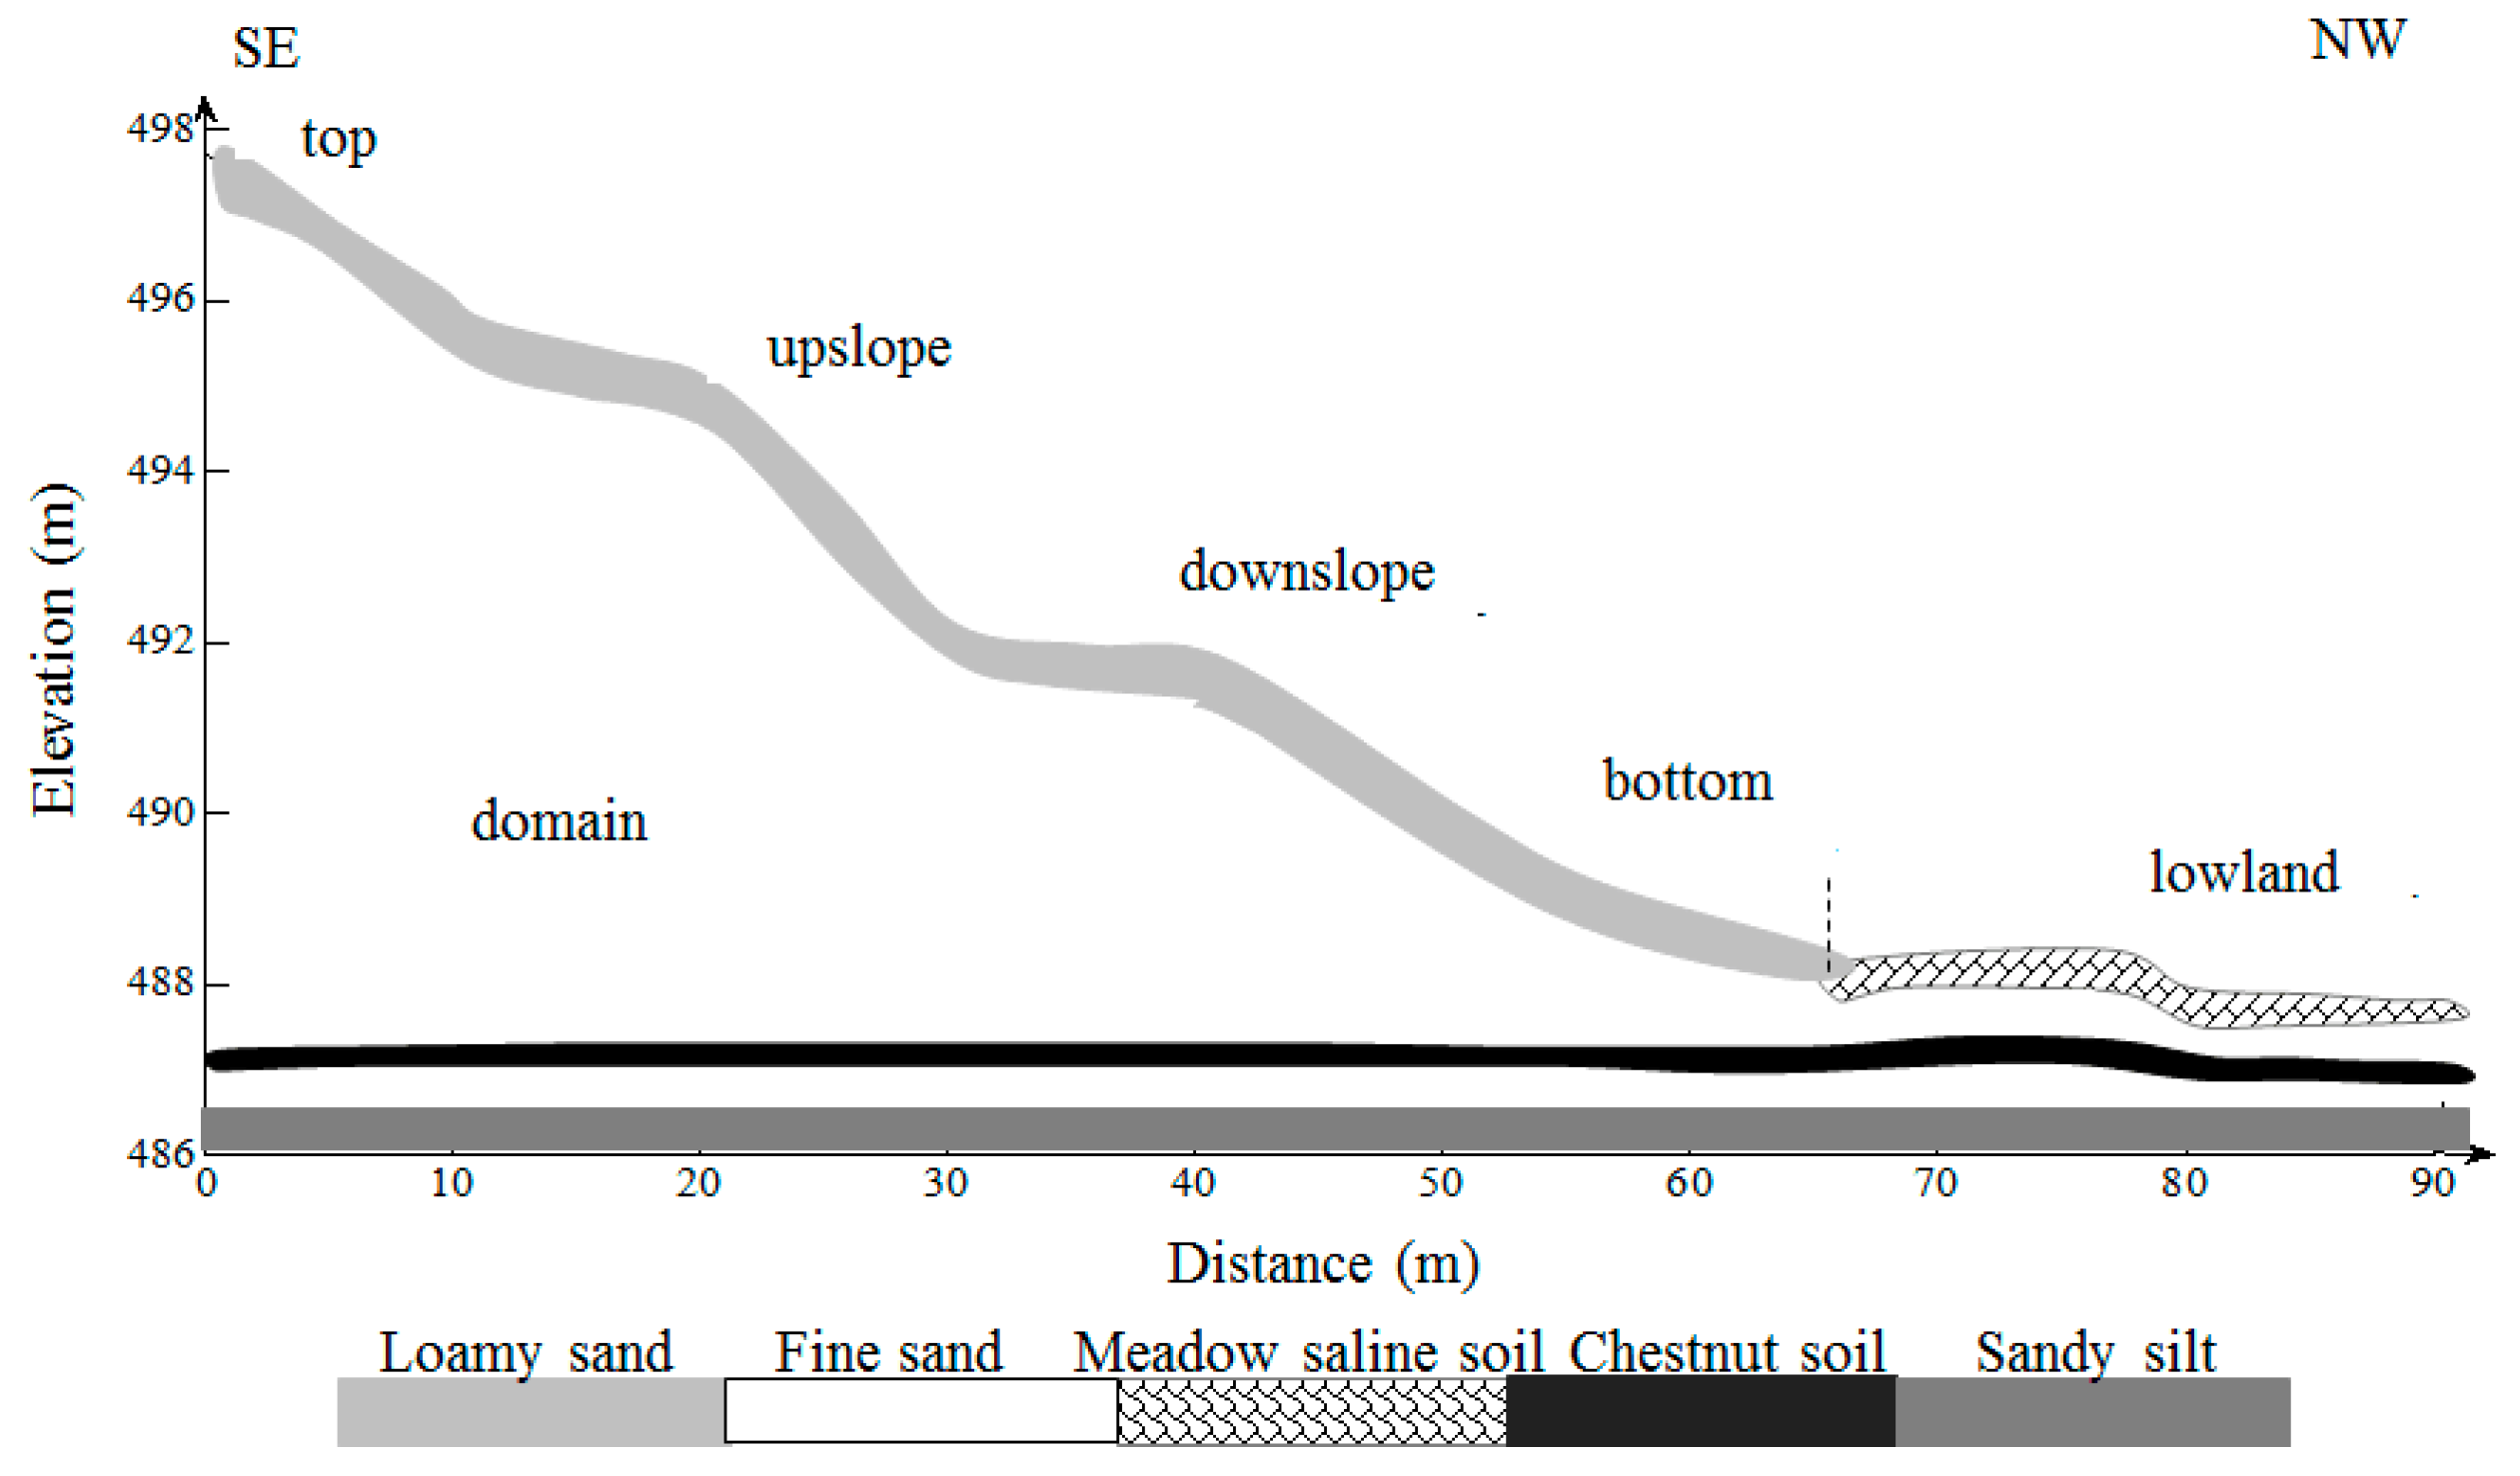
C. microphylla was planted in 1 m × 1 m straw checkerboard sand barrier squares built on the dunes surface as sand stabilization screens in the 1980s. A ~90 m transect was projected on the windward slope of the plot, crossing from the dune top to lowland (southeast–northwest direction) (
Figure 2). The sample positions were set at 5 or 10 m intervals along the transect. The elevations of sample positions were measured using Global Positioning System (GPS) and the geometric gradienter, ranging from 486.76 to 497 m with a height difference of ~10.24 m.
At each sample position, soil samples were taken at 10 cm increments from the surface to a depth of 200 cm using a 3 cm-diameter soil auger, and the sample volume was about 20 cm
3. Three replicates were taken at each depth. This sampling procedure was repeated approximately every 10 days from 26 April to 30 September in 2013 and 2015. Soil water content was measured using the oven dry method. The volumetric soil water content was obtained by converting gravimetric soil water content based on soil bulk density [
16].
Air temperature, precipitation, relative humidity, wind speed, actual vapor pressure, atmospheric pressure and actual duration of sunshine hours were obtained from a meteorological station located about 1000 m away from the study area. During the growing season, the total rainfall was 242 mm in 2013, and 157.6 mm in 2015. We defined that 2013 and 2015 was the wet and dry year accordingly.
2.2. Numerical Modeling
2.2.1. Modelling Approach
Numerical simulations of soil water movement in the experimental field were conducted using the SWMS-2D model [
28]. The code solves the two-dimensional form of the Richards’ equation using a Galerkin linear finite element formulation, as given here:
where
h is the pressure head (L),
θ is the volumetric water content (L
3 L
−3),
K(h) is the unsaturated hydraulic conductivity (L T
−1),
S is a sink or source term (T
−1),
xj is the spatial coordinates (
i =1, 2),
t is the time (T), and
is the components of a dimensionless anisotropy tensor.
2.2.2. Flow Domain, Soil Properties, and Time Discretization
A 2D domain was considered in numerical simulations, which was in the x–z plane with 90 m width (
X axis) and 1.4–11.5 m depth (
Z axis) (
Figure 2). The total area of the transport domain was about 490 m
2. An unstructured finite element grid was created with the sampling positions introduced.
Five soil types in the profile (
Figure 2) were defined according to our measurements and previous studies [
16,
29]. The Van Genuchten soil hydraulic properties (SHPs) including
θr,
θs,
α,
n and
Ks (
Table 1) [
30], which were required by the SWMS-2D model, were estimated using pedotransfer functions and a Rosetta database [
31]. The initial time step was 0.01 day and the minimum time step was 0.0001 day.
2.2.3. Initial and Boundary Conditions
The measured soil water contents were converted into pressure head values by the Van Genuchten model [
30] including soil water retention
θ(h) and hydraulic conductivity
K(h), which were represented as follows:
where
where
Se is the effective water content,
θs and
θr are the saturated and residual water contents (L
3 L
−3), respectively,
Ks is the saturated hydraulic conductivity (L T
−1),
α (L
−1) and
n are the parameters controlling the shape of the retention curve, and
l is the pore connectivity and tortuosity factor, which is often set as 0.5.
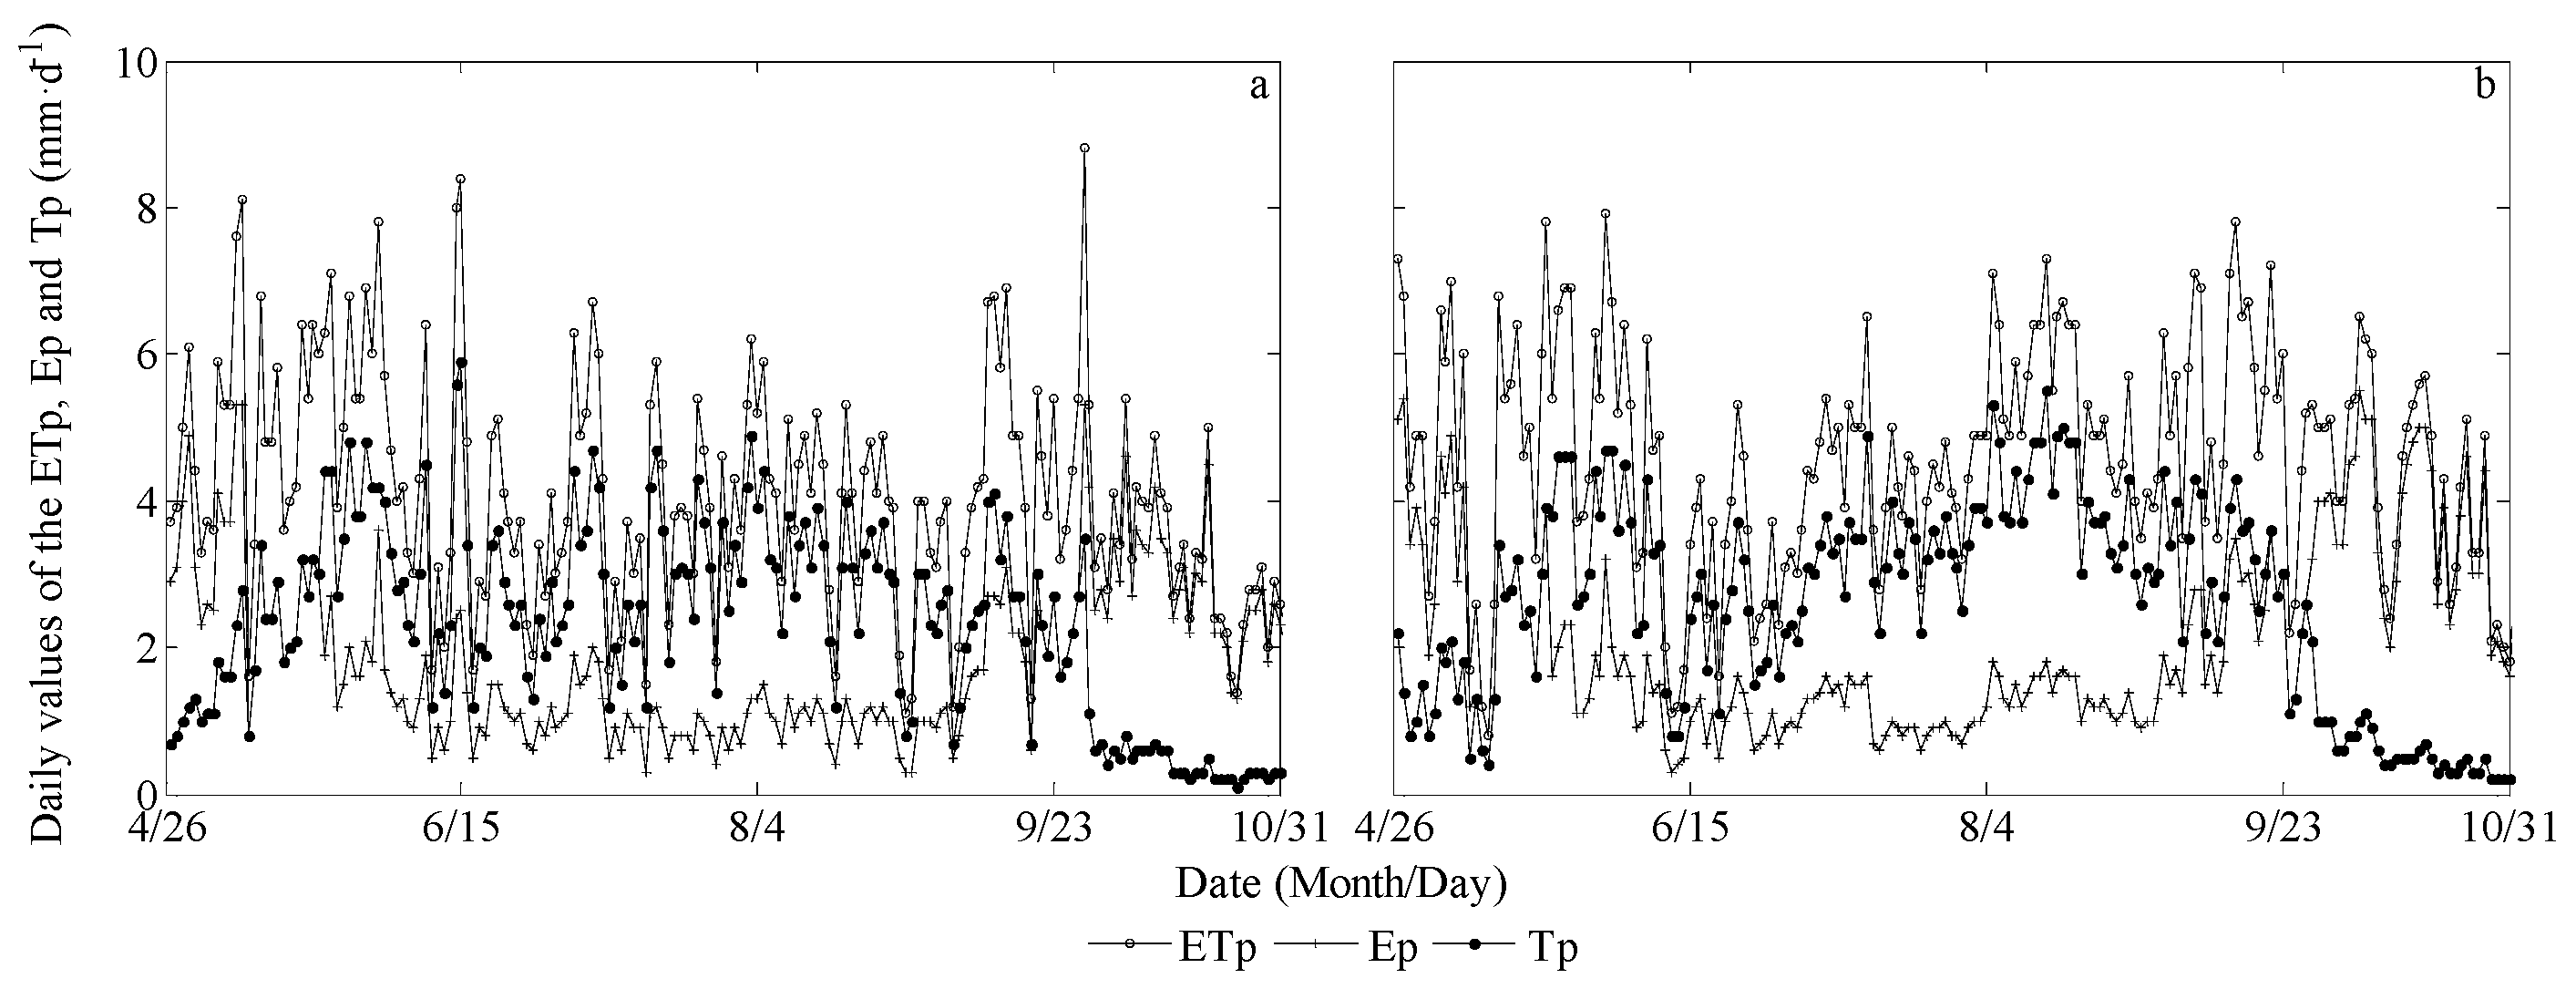
The initial pressure head profile was determined from interpolation of all measured data at the first step time studied (26 April 2013 and 2015). Additionally, it was assumed that there were the same initial pressure heads at the bottom boundary, which were set as 0 (i.e., saturated soil water content). The boundary conditions varied daily during the simulations. The upper boundary conditions were provided from rainfall and potential values of evaporation (
Ep) and transpiration (
Tp) (
Figure 3), calculated according to Penman-Monteith equation and crop coefficient method recommended by the FAO [
32]. The bottom boundary was set as a variable flux boundary. The lateral boundary conditions were established from the measured soil pressure-head data at the 0 m location of the dune slope, and 90 m location of the lowland area (
Figure 2). In addition, linear interpolation was performed between the two nearest neighboring measurements to obtain the pressure-head values for all nodes during each time step.
2.2.4. Root Water Uptake
Root water uptake
S(h,x,z) in the model is described by the Feddes approach [
33]. The approach calculates the spatial distribution of root water uptake in the soil. The spatial distribution of potential water uptake rate
Sp(x,z) over the root zone is described by assigning a root-distribution function
b(x,z) to each node [
34], which is implemented based on the observed root density and depth obtained by field observations and relevant literature values [
11,
23,
35]:
where
a(h) is a prescribed dimension1ess function of the soil pressure-head (0 ≤
a(h) ≤ 1),
Tp is the potential transpiration rate (L T
−l), and
Lt is the width (L) of the soil surface associated with the transpiration process.
In this study, it was assumed that no roots were presented at soil surface (0 cm). For the dune area, a large portion of roots were concentrated in the 40–80 cm depth section, and b(x,z) was set to 1. In addition, linear growth was set in 0–40 cm interval, and a linear decrease in root density toward 0 was set in the 80–120 cm section. For the lowland area, there were more roots at 0–70 cm depth, and b(x,z) was set to 1, and a linear decrease in root density toward 0 was set in 70–90 cm interval.
2.2.5. Performance Evaluation
The performance analysis was based on comparisons between the measured and simulated soil water contents from 26 April to 30 September in 2013 and 2015. The root mean square error (RMSE) was used to assess the accuracy of the simulation, which was represented as follows:
where
Si (cm
3 cm
−3) and
Mi (cm
3 cm
−3) are the simulated and measured soil water contents, respectively.
2.3. Data Analyses
Water budgets in five micro-landforms (
Figure 2, i.e., the top, upper, down, and bottom positions of the dune slope, and the interdune lowland area) were investigated from May to October in 2013 and 2015. Based on the simulation results of the SWMS-2D model, the soil water storage change (Δ
S), drainage (
D) and lateral flow (
LF) within 140 cm soil depth (root zone) were quantified at the daily, monthly, and seasonal scales. The
ET in different micro-landforms was calculated using the following water balance equation [
36]:
3. Results
3.1. Model Calibration and Validation
The measured values of soil water content in 2013 were used to calibrate the soil hydraulic properties (i.e.,
θr,
θs,
α,
n and
Ks) and root water uptake parameters.
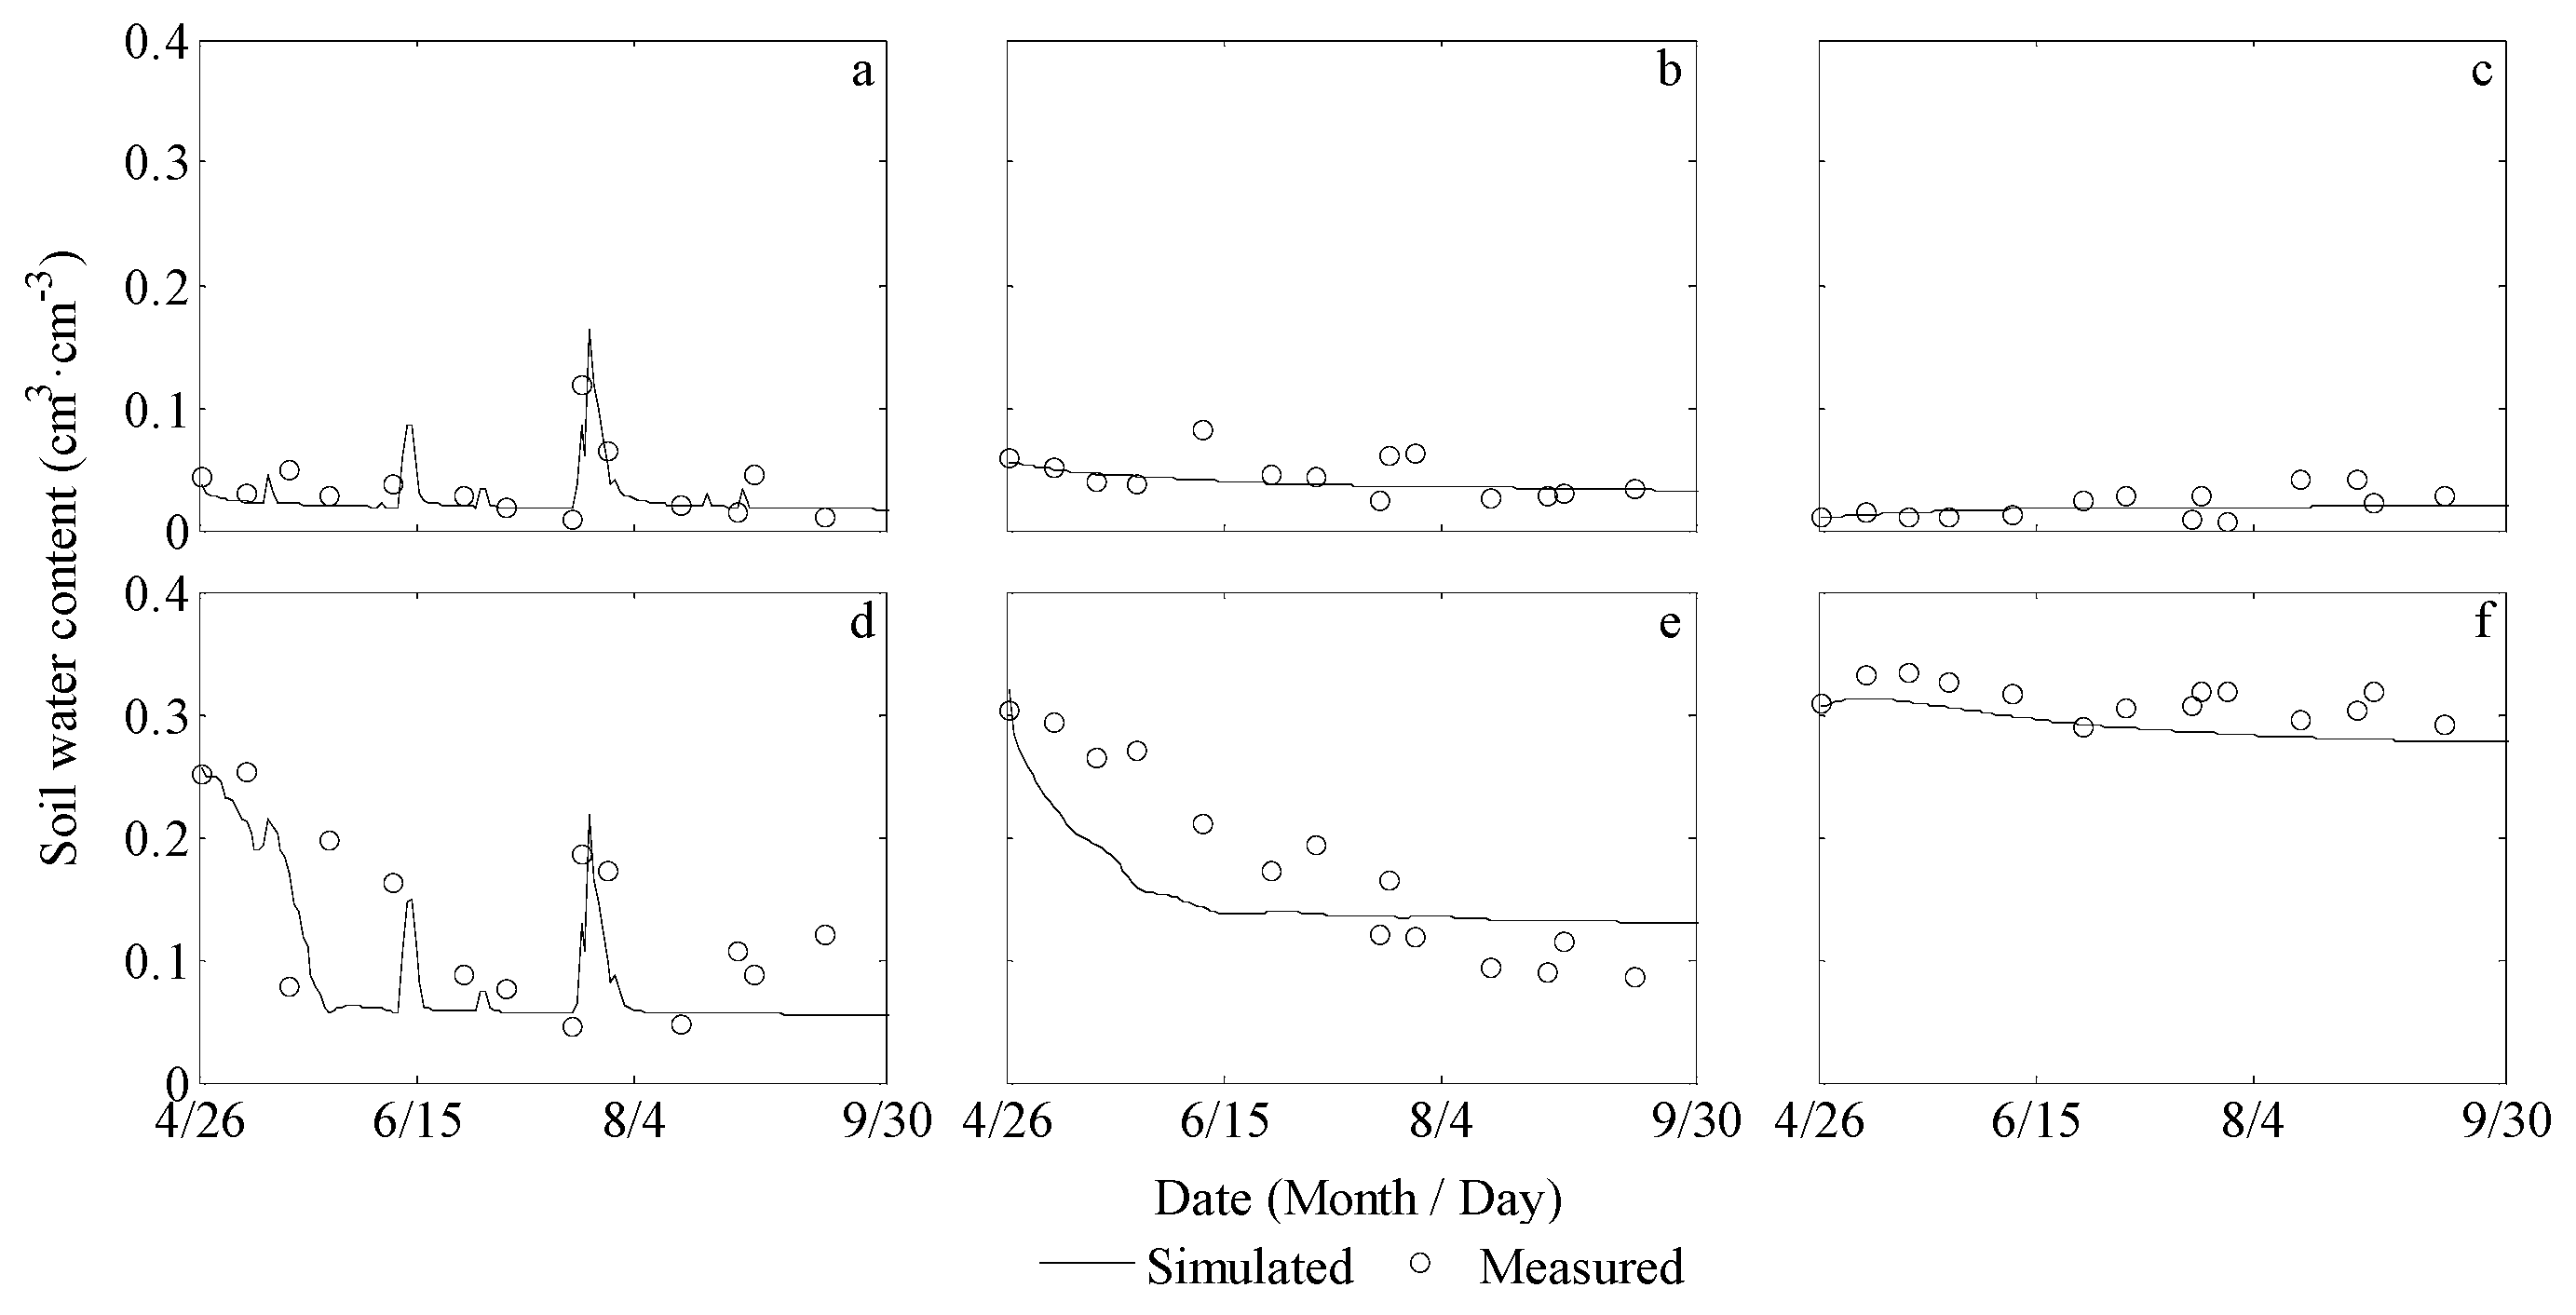
Figure 4a–f shows time series plots of the measured soil water contents compared with the simulated values at different depths (0–20, 40–60, and 90–110 cm) in different micro-landforms (the top and down positions of the dune slope) in 2013, with RMSE values of 0.011, 0.017, 0.010, 0.014, 0.015, and 0.026, respectively, which indicated good agreement.
The calibrated parameters (
Table 1) were then used to simulate the soil water contents in 2015 to validate the model.
Figure 5a–f shows time series plots of the simulated and measured soil water contents at 0–20, 40–60, and 90–110 cm depths at the top position of the dune slope and the lowland area in 2015, with RMSE values of 0.015, 0.015, 0.010, 0.024, 0.025 and 0.022, respectively. During this validation period, the agreement between measured and simulated soil water contents was similarly good. Therefore, the calibrated SWMS-2D model is effective for the simulation of water flow in the dune-interdune landscape.
3.2. Soil Water Dynamics
Figure 6 shows the seasonal variations of average soil water contents at 0–140 cm depth. When a rainfall event of >5 mm occurred, soil water increased, but presented a declining trend after rainfall. Rainfall of 6–10, 10–20, and >20 mm increased the mean soil water content by 0.003–0.005, 0.010–0.015, and 0.017–0.040 cm
3 cm
−3 in the 0–140 cm soil layers, respectively.
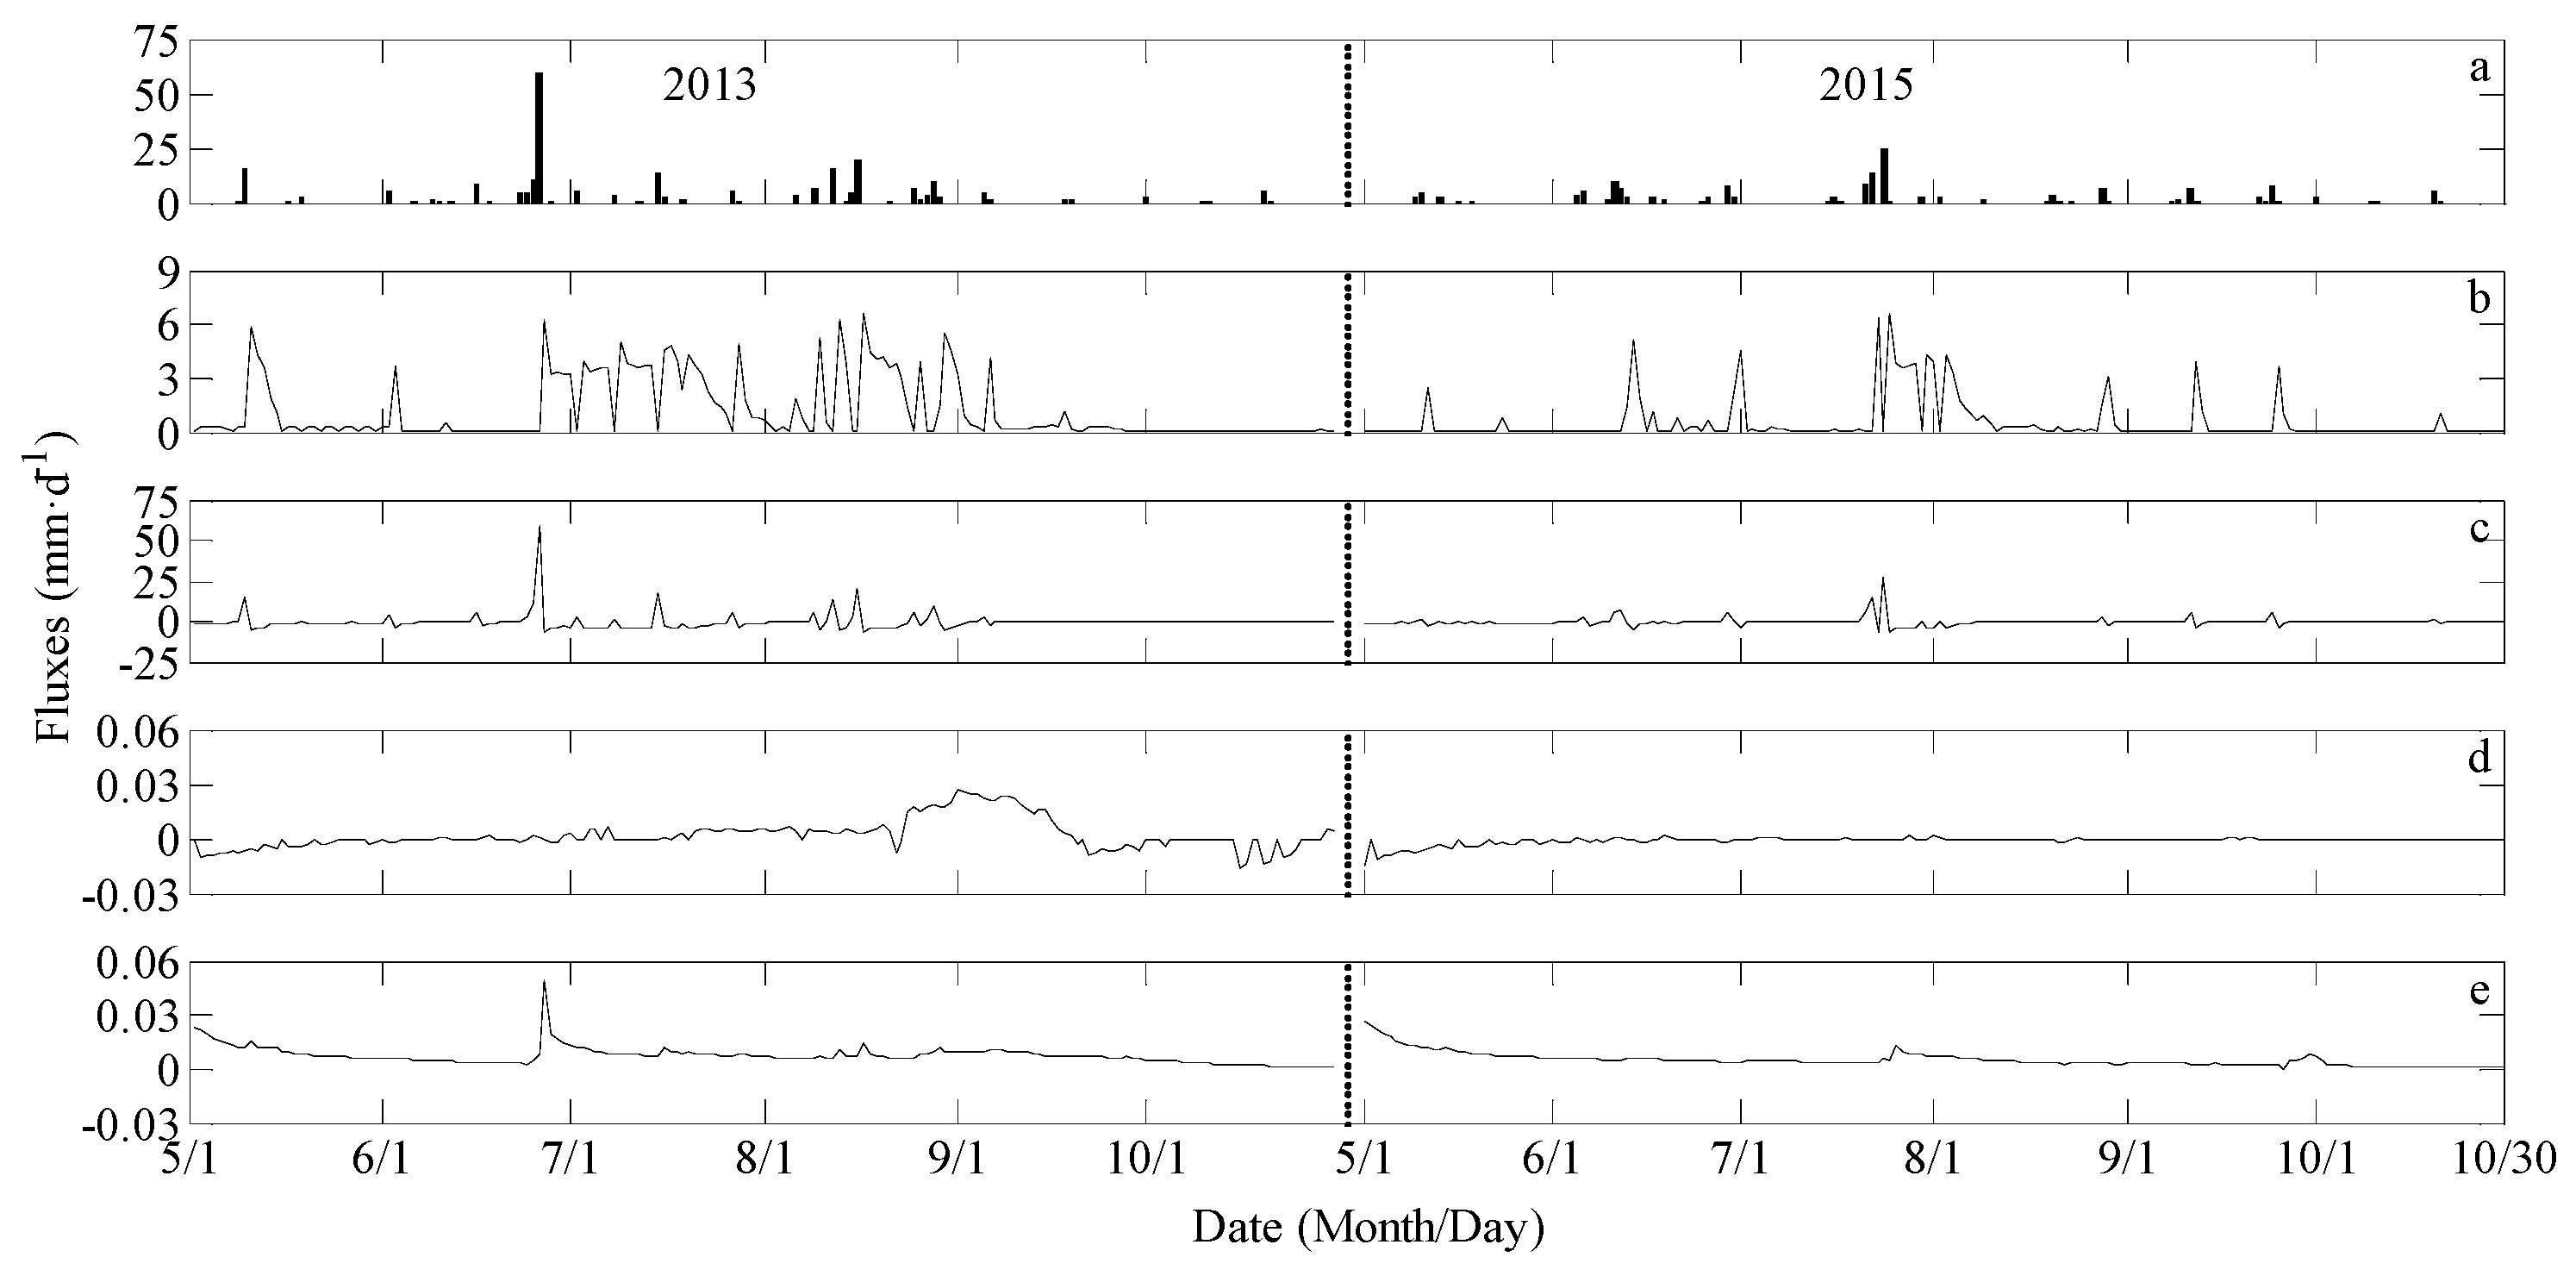
3.3. Characteristics of Daily Water Balances
Seasonal variations of water balance components including the
P,
ET, Δ
S,
D and
LF at 0–140 cm depth in the dune-interdune landscape are shown in
Figure 7. The
ET values ranged from 0.08 to 6.67 mm d
−1 from early May to later October 2013, and 0.04–6.56 mm d
−1 in 2015. Moreover, the higher daily
ET occurred in July and August, especially after rainfall (
Figure 7b). The daily average of the
ET was 1.17 mm d
−1 during the growing season in 2013, and 0.56 mm d
−1 in 2015.
The fluctuations in Δ
S closely followed the rainfall events (
Figure 7c). During a rainfall event, the soil water storage generally started to increase, and the maximum Δ
S was 59.3 mm d
−1 for 2013, and 27.2 mm d
−1 for 2015, corresponding to the dates with the heaviest rainfall. However, the soil water storage showed a declining trend after rainfall, and the minimum Δ
S was about −6.50 mm d
−1 during the study periods.
Figure 7d,e shows seasonal variations of the
D and
LF at 0–140 cm soil depth. The daily values of the
D and
LF were generally less than 0.06 mm d
−1 throughout the two study periods. However, the
LF prominently increased when the heaviest rainfall occurred, while the increase of the
D lagged behind the rain. Overall, the daily
D and
LF within 140 cm soil depths were far lower than the daily values of other water balance components and were within the RMSE of the analysis.
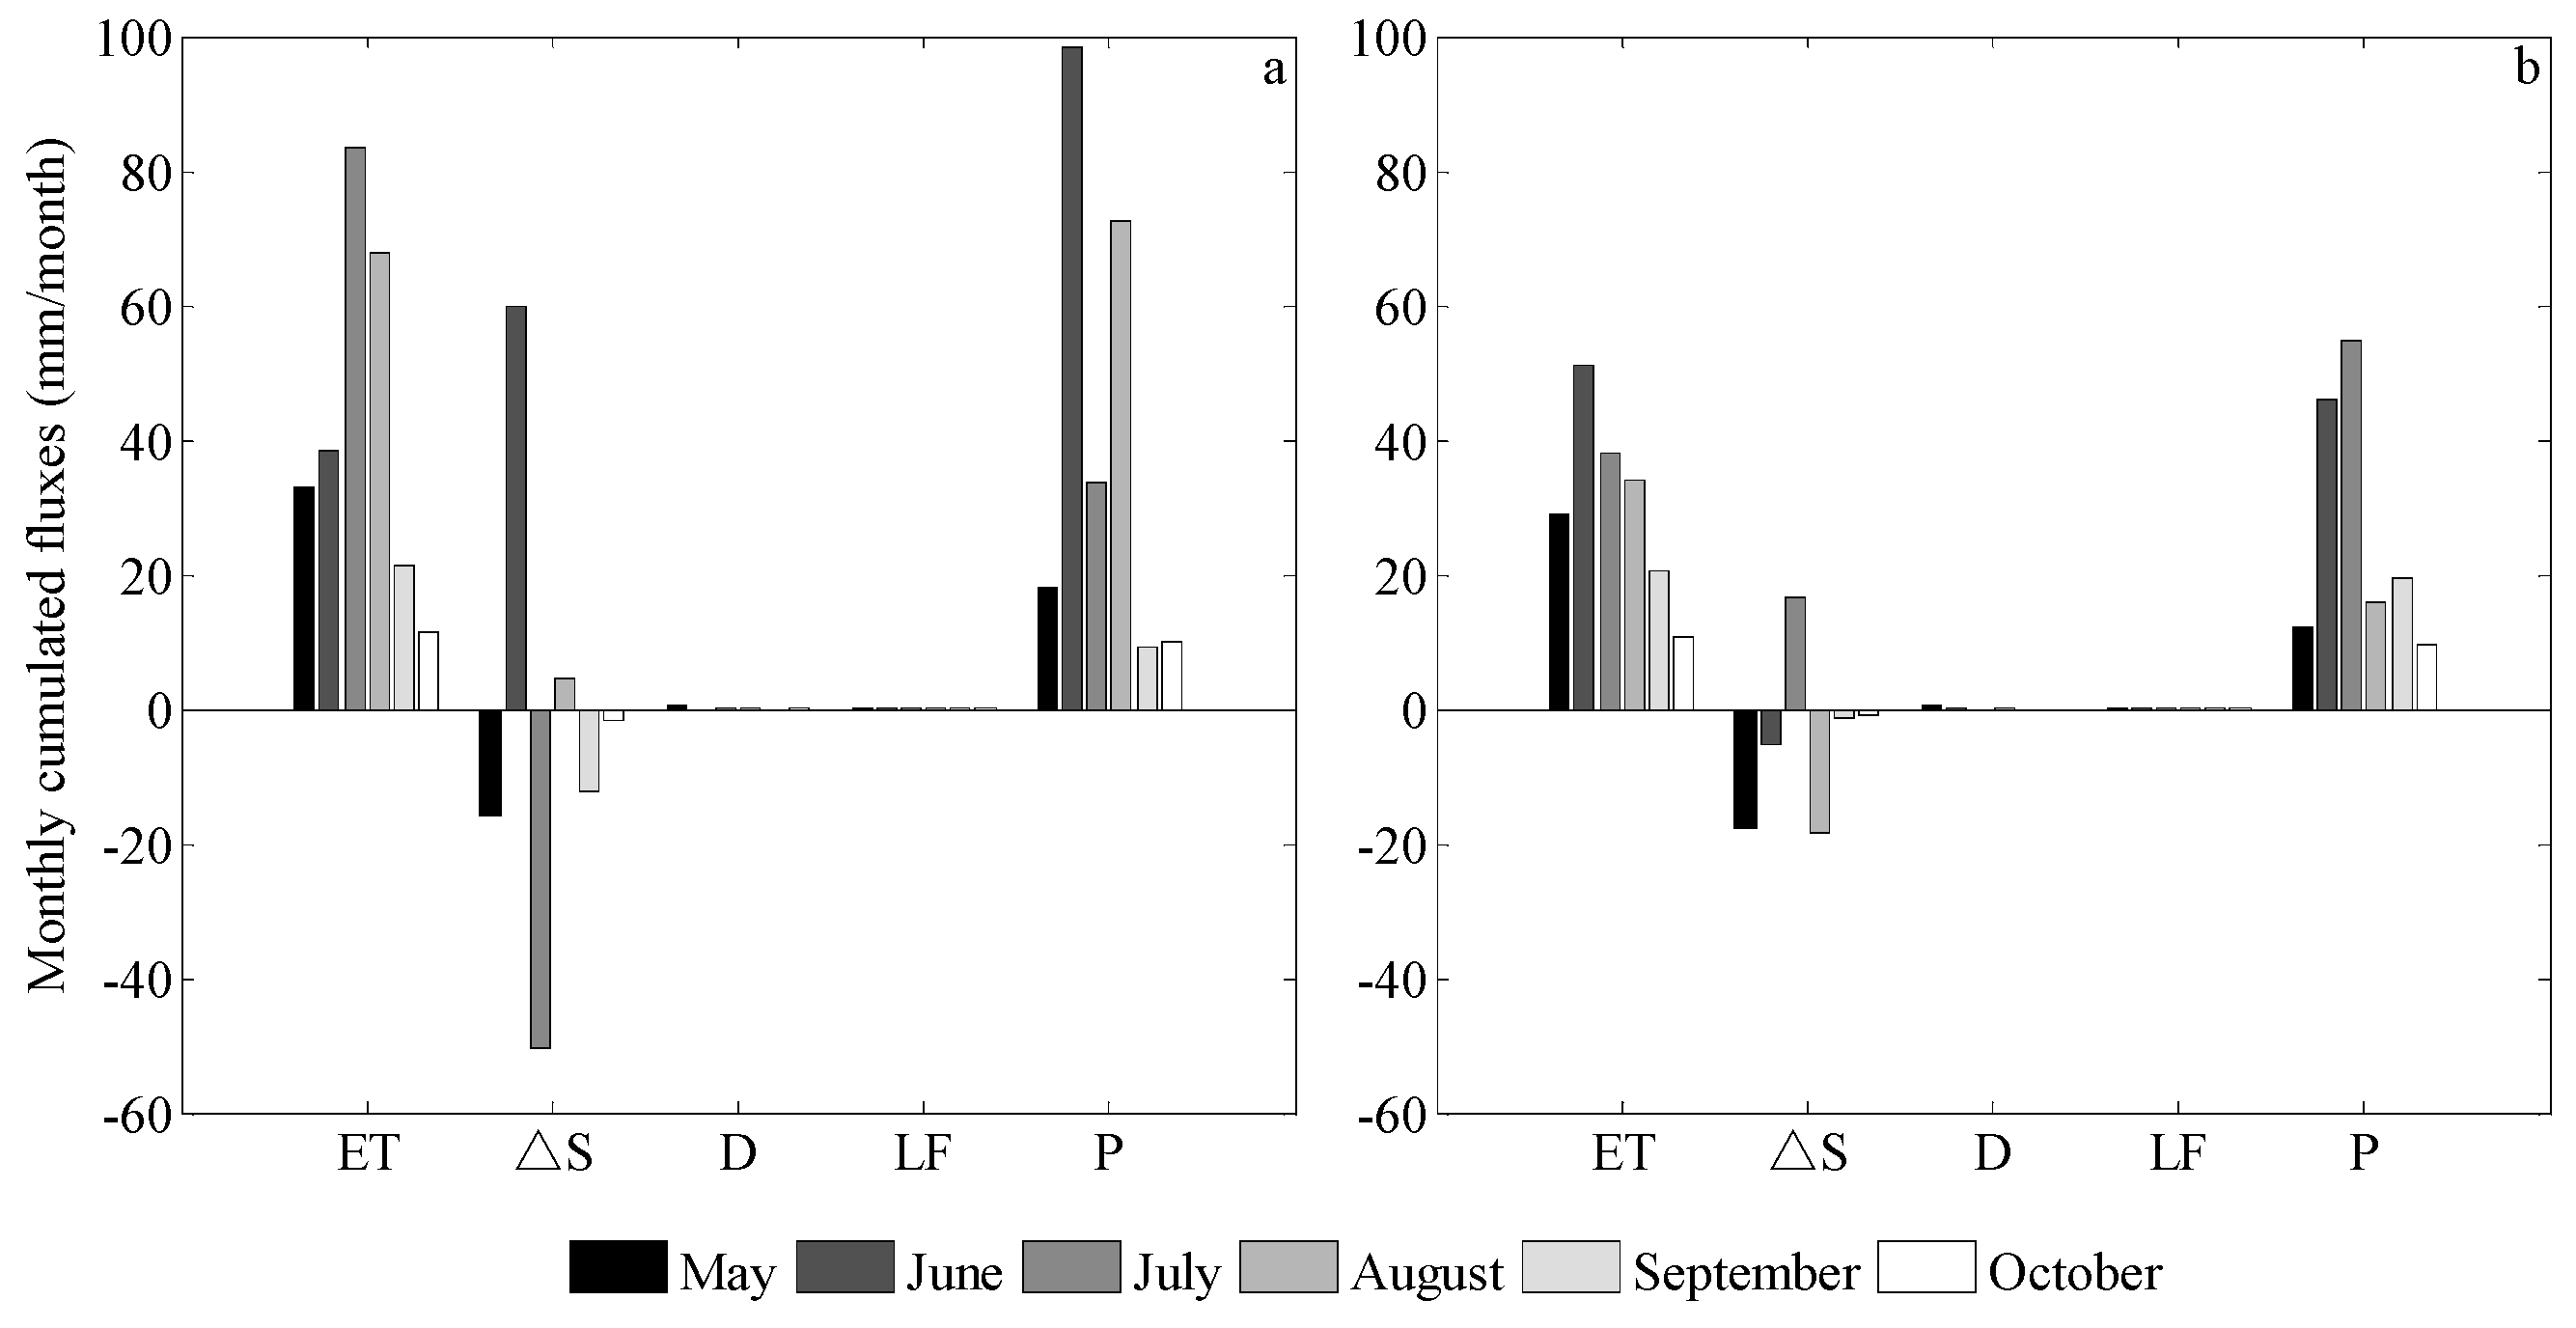
3.4. Characteristics of Monthly Water Balances
The monthly mean values of the
ET, Δ
S,
D and
LF at 0–140 cm depth varied from 11.56 to 83.32, −50.21–59.99, −0.04–0.42, and 0.04–0.27 mm during the growing season for 2013, respectively (
Figure 8a); and 10.62–51.02, −18.40–16.60, −0.04–0.42, and 0.01–0.27 mm for 2015 (
Figure 8b). These values indicate that compared with the other water balance components,
LF and
D were trivial in the monthly water balance calculation.
The
ET was mainly concentrated in June, July and August during the growing season, accounting more than 70% of the total
ET, and peaking in July 2013 (
Figure 8a), and June 2015 (
Figure 8b). The
ET in each month was generally larger than the
P, except for June and August 2013 and July 2015, when the larger monthly rainfall occurred (e.g., >54 mm) (
Figure 8). The ratio of
ET to
P in May, June, July, August, September, and October was 1.84, 0.39, 2.49, 0.93, 2.26, and 1.14, respectively, for 2013; and 2.40, 1.11, 0.69, 2.14, 1.07, and 1.11, respectively, for 2015. The monthly average of the
ET in 2013 was higher than that in 2015, corresponding to the higher
P.
The net soil water storage was synchronous with rainfall at a monthly scale. For example, the soil water storage increased by 59.99 and 4.67 mm in June and August 2013, respectively (
Figure 8a), and 16.6 mm in July 2015 (
Figure 8b), when the monthly rainfall was larger. However, the monthly average of soil water storage generally decreased in other months of the growing season, and the maximum monthly decrease was 50.21 mm in July 2013 (
Figure 8a), and 18.40 mm in August 2015 (
Figure 8b).
3.5. Growing Season Water Balances in Different Micro-Landforms
Water budgets in different micro-landforms during the growing season of 2013 and 2015 are shown in
Table 2. In 2013, the
ET at the top, upper, down, and bottom positions of the dune slope, and the lowland area was 233.0, 234.0, 207.7, 231.4, and 369.1 mm, respectively, and the ratio of
ET to
P was 96%, 97%, 86%, 96%, and 153%, respectively. In 2015, the
ET for the five micro-landforms was 162.3, 162.6, 138.8, 164.2, and 288.6 mm, respectively, and the ratio of
ET to
P was 103%, 103%, 88%, 104%, and 183%, respectively. It is clear that the interannual variation of the
ET was consistent with the
P during the growing season. The
ET in the lowland area was greater than in other micro-landforms and the minimum occurred at the downslope position. At the top, upper, and bottom positions of the dune slope, the
ET was less than the
P in the wet year (2013) and greater than the
P in the dry year (2015).
The soil water storage at the lowland area was consistently depleted during the two growing seasons, decreasing by around 134.0 mm from early May to later October. However, the net soil water storage in the dune area was related to the P, and showed significant differences among different micro-landforms. In 2013, the soil water storage at the top, upper, down, and bottom positions of the dune slope increased by 8.9, 7.7, 33.6, and 8.1 mm, respectively; while in 2015, the soil water storage at the top, upper, and bottom positions decreased by 4.8, 5.5, and 8.2 mm, respectively, except for an increase occurring in the downslope position.
The D and LF were relatively lower than the other water balance components, and the values at the top, upper, and down positions were less than 0.5 mm, which could be neglected in the water balance calculation at the annual scale. The LF within 0–140 cm soil depths at the bottom position was around 1.0 mm during the growing season; while the lateral outflow occurred in the lowland area (6.5 mm in 2013 and 4.2 mm in 2015). During the growing season, the D at depth of 140 cm only occurred in the bottom position (3.4 mm in 2013 and 2.7 mm in 2015).
4. Discussion
4.1. Seasonal Variations of Hydrological Budgets
In a semiarid climate, the
ET during the growing season is strongly associated with
P. In this study, the
ET rate was relatively high after rainfall, and the total
ET in the wet year (2013) was highly greater than that in the dry year (2015). This suggests that the
ET response of vegetation declines at high soil water deficit (i.e., with less rainfall), which was consistent with the findings of Ewers et al. [
37] and Pataki et al. [
38]. Moreover, our results showed that at a monthly scale, the ratio of
ET to
P was generally nearly equal to or larger than 1. Thus, all water from rainfall evaporated in most of the months, and the soil water deficit was notable, especially in July 2013 and August 2015. The monthly
ET was not synchronous with
P, and there was a time lag between them. For example, the
P in June 2013 was far heavier than that in July and August, and the
P in July 2015 was heavier than that in June and August, but the
ET was in a reverse order. Therefore, despite the serious water shortage during most of the studied months, the time lag could allow water supply in the month with the heavier rainfall to compensate water consumption in the month with less rainfall. This could relieve temporary drought in this area, and ensure continued plant growth.
4.2. Effect of Micro-Topography on Hydrological Budgets
Micro-landforms had different effects on hydrological budgets. Although previous scholars have proposed that micro-topography drives differences in soil water condition and causes differences in plant growth on a cropped hillslope [
39], there has been an absence of quantitative and systematic investigations of water balance at the micro-landform scale in the dune-interdune landscape. Such analyses would help to reveal the mechanisms of soil water movement and provide practical water management measures for similar areas.
In our study, water balance components at the top, upper, down, and bottom positions of the dune slope and the lowland position were compared in detail. In the wet year (2013), the ratio of ET to P was 96%, 97%, 86%, 96%, and 153% for the five micro-landforms, respectively. In the dry year (2015), the ratio was 103%, 103%, 88%, 104%, and 183%, respectively. In the lowland area, the ET was greater than rainfall, and the soil water storage also showed the largest declining trend. This was mainly attributed to larger vegetation coverage. In addition, water storage consumption of the lowland area was similar in the wet/dry year, which indicated that vegetation in the lowland area used additional water supply, such as groundwater recharge in the dry year, to maintain growth. However, in the dune area, the ET in the wet year (2013) was less than the P, and soil water storage was recharged by rainfall, which ensured growth of C. microphylla. Conversely, in the dry year (2015), ET was mostly larger than the P and hence soil water storage was consumed, where the growth conditions of C. microphylla was also poor. These results indicate that water shortages in dune areas are particularly acute, and the density of sand-fixing shrub plantation at the top, upper, and bottom positions of the dune slope should be appropriately reduced by grazing or other human disturbances with different intensity. This would ensure that the soil water budgets are balanced, and the growth of plants are steadily. At the downslope position of the dune, the ET was lower, which mainly attributed to lower vegetation coverage (25%) compared with other micro-landforms (>30%).
Our results showed that the
LF within the root zone from top to bottom was trivial, which might be explained by the small elevation difference or rainfall intensity [
40,
41], or lack of a headwater catchment [
24]. Thus, further work is needed to quantify the response of
LF to altered precipitation intensity and sand-fixing shrub density in dune-interdune landscapes, which would contribute to water resource management.
5. Conclusions
The SWMS-2D model was tested and used to estimate the variations of water balances during the growing season in a semiarid dune-interdune area of Northeastern China. The main results can be summarized as follows:
The soil water content, daily evapotranspiration and soil water storage change closely followed with the change of rainfall patterns. The daily mean values in 2013 were higher than 2015.
At a monthly scale, evapotranspiration was greater than precipitation in most of the months during the growing season, which suggested that water from rainfall mostly evaporated. Moreover, the monthly evapotranspiration was not synchronous with rainfall. Therefore, despite the lack of soil water in most of the studied months, water supply from the greater monthly rainfall would meet temporary water use in the dry months, and ensure the growth of plants.
Among different micro-landforms, there was a significant difference in water balance. Evapotranspiration in the lowland area was far greater than rainfall, and the soil water storage also showed a larger decline compared with other micro-landforms, which was similar in the wet and dry years. In the wet year (2013), the ratio of evapotranspiration to precipitation at the top, upper, down, and bottom positions of the dune slope was 96%, 97%, 86%, and 96%, respectively. In the dry year (2015), the ratio was 103%, 103%, 88%, and 104%, which indicates that evapotranspiration at the top, upper, and bottom positions was larger than precipitation, and all water replenishment from precipitation was consumed by evapotranspiration. The lateral flow of the root zone from top to bottom accounted for only a small portion of water budget during the growing season.
The results of this study improve our general understanding of water balance variations at the micro-landform scale in a revegetated semiarid sandy land. However, more work will be needed to quantify the role that altered precipitation intensity and sand-fixing shrub density may play in lateral flow generation.
Acknowledgments
The research was funded by the State Basic Research Development Program (2013CB429902), Key projects of the Chinese Academy of Sciences: KFZD-SW-305, and the National Natural Science Foundation of China (31670712). We are grateful to Ulan’aodu Station for providing climate data of this region. We also thank Y.M. Luo and H.M. Wang for their help with field work.
Author Contributions
All authors contributed to designing and performing the experiments, analyzing the data, and writing the manuscript.
Conflicts of Interest
The authors declare no conflict of interest in study design, data collection and analysis, preparation of the manuscript, or decision to publish.
References
- Moran, M.S.; Scott, R.L.; Keefer, T.O.; Emmerich, W.E.; Hernandez, M.; Nearing, G.S.; Paige, G.B.; Cosh, M.H.; O’Neill, P.E. Partitioning evapotranspiration in semiarid grassland and shrubland ecosystems using time series of soil surface temperature. Agric. For. Meteorol. 2009, 149, 59–72. [Google Scholar] [CrossRef]
- Liu, W.Z.; Zhang, X.C.; Dang, T.H.; Ouyang, Z.; Li, Z.; Wang, J.; Wang, R.; Gao, C.Q. Soil water dynamics and deep soil recharge in a record wet year in the southern Loess Plateau of China. Agric. Water Manag. 2010, 97, 1133–1138. [Google Scholar] [CrossRef]
- Fullen, M.A.; Mitchell, D.J. Desertification and reclamation in North-Central China. Ambio 1994, 23, 131–135. [Google Scholar]
- Liu, J.G.; Diamond, J. China’s environment in a globalizing world. Nature 2005, 435, 1179–1186. [Google Scholar] [CrossRef] [PubMed]
- Wang, F.; Pan, X.B.; Wang, D.F.; Shen, C.Y.; Lu, Q. Combating desertification in China: Past, present and future. Land Use Policy 2013, 31, 311–313. [Google Scholar] [CrossRef]
- Pan, Y.X.; Wang, X.P. Factors controlling the spatial variability of surface soil moisture within revegetated-stabilized desert ecosystems of the Tengger Desert, Northern China. Hydrol. Process. 2009, 23, 1591–1601. [Google Scholar] [CrossRef]
- Zheng, M.G.; Liao, Y.S.; He, J.J. Sediment delivery ratio of single flood events and the influencing factors in a headwater basin of the Chinese Loess Plateau. PLoS ONE 2014, 9, e112594. [Google Scholar] [CrossRef] [PubMed]
- Puri, S.; Stephen, H.; Ahmad, S. Relating TRMM precipitation radar land surface backscatter response to soil moisture in the Southern United States. J. Hydrol. 2011, 402, 115–125. [Google Scholar] [CrossRef]
- Llorens, P.; Domingo, F. Rainfall partitioning by vegetation under Mediterranean conditions. A review of studies in Europe. J. Hydrol. 2007, 335, 37–54. [Google Scholar] [CrossRef]
- Tweed, S.; Leblanc, M.; Cartwright, I.; Favreau, G.; Leduc, C. Arid zone groundwater recharge and salinisation processes; an example from the Lake Eyre Basin, Australia. J. Hydrol. 2011, 408, 257–275. [Google Scholar] [CrossRef]
- Liu, X.P.; He, Y.H.; Zhao, X.Y.; Zhang, T.H.; Li, Y.L.; Yun, J.Y.; Wei, S.L.; Yue, X.F. The response of soil water and deep percolation under Caragana microphylla to rainfall in the Horqin Sand Land, Northern China. Catena 2016, 139, 82–91. [Google Scholar] [CrossRef]
- Richard, M.; Petrone, J.S.; Price, S.K.; Waddington, J.M. Statistical characterization of the spatial variability of soil moisture in a cutover peatland. Hydrol. Process. 2004, 18, 41–52. [Google Scholar] [CrossRef]
- Liu, S.L.; Wang, T. Aeolian desertification from the mid-1970s to 2005 in Otindag Sandy Land, Northern China. Environ. Geol. 2007, 51, 1057–1064. [Google Scholar] [CrossRef]
- Wang, B.; Zhang, G.H.; Shi, Y.Y.; Zhang, X.C. Effect of natural restoration time of abandoned farmland on soil detachment by overland flow in the Loess Plateau of China. Earth Surf. Process. Landf. 2013, 38, 1725–1734. [Google Scholar] [CrossRef]
- Zhang, G.L.; Dong, J.W.; Xiao, X.M.; Hu, Z.M.; Sheldon, S. Effectiveness of ecological restoration projects in Horqin Sandy Land, China based on SPOT-VGT NDVI data. Ecol. Eng. 2012, 38, 20–29. [Google Scholar] [CrossRef]
- Su, Y.Z.; Zhao, H.F. Soil properties and plant species in an age sequence of Caragana microphylla plantations in the Horqin Sandy Land, North China. Ecol. Eng. 2003, 20, 223–235. [Google Scholar] [CrossRef]
- Su, Y.Z.; Zhang, T.H.; Li, Y.L.; Wang, F. Changes in soil properties after establishment of Artemisia halodendron and Caragana microphylla on shifting sand dunes in semiarid Horqin sandy land, Northern China. Environ. Manag. 2005, 36, 272–281. [Google Scholar] [CrossRef] [PubMed]
- Cao, C.Y.; Jiang, S.Y.; Ying, Z.; Zhang, F.X.; Han, X.S. Spatial variability of soil nutrients and microbiological properties after the establishment of leguminous shrub Caragana microphylla Lam. plantation on sand dune in the Horqin Sandy Land of Northeast China. Ecol. Eng. 2011, 37, 1467–1475. [Google Scholar] [CrossRef]
- Musa, A.; Jiang, D.M.; Niu, C.Y. The applicable density of sand-fixing shrub plantation in Horqin Sand Land of Northeastern China. Ecol. Eng. 2014, 64, 250–254. [Google Scholar] [CrossRef]
- Ao, Y.H.; Pei, H.; Wang, Y.L.; Li, Y.P. Monitoring on land cover dynamics of Hunshandake Sandland by remote sensing. J. Desert Res. 2010, 30, 33–39, (In Chinese with English Abstract). [Google Scholar]
- Han, Z.W.; Wang, T.; Yan, C.Z.; Liu, Y.; Liu, L.; Li, A.; Du, H. Change trends for desertified lands in the Horqin sandy land at the beginning of the twenty-first century. Environ. Earth Sci. 2010, 59, 1749–1757. [Google Scholar] [CrossRef]
- Stokes, A.; Sotir, R.; Chen, W.; Ghestem, M. Soil bio- and eco-engineering in China: Past experience and future priorities preface. Ecol. Eng. 2010, 36, 247–257. [Google Scholar] [CrossRef]
- Jian, S.Q.; Zhao, C.Y.; Fang, S.M.; Yu, K. Effects of different vegetation restoration on soil water storage and water balance in the Chinese Loess Plateau. Agric. For. Meteorol. 2015, 206, 85–96. [Google Scholar] [CrossRef]
- Thomas, Z.; Mol’enat, J.; Caubel, V.; Grimaldi, C.; M’erot, P. Simulating soil-water movement under a hedgerow surrounding a bottomland reveals the importance of transpiration in water balance. Hydrol. Process. 2008, 22, 577–585. [Google Scholar] [CrossRef]
- Hopp, L.; McDonnell, J.J. Connectivity at the hillslope scale: Identifying interactions between storm size, bedrock permeability, slope angle and soil depth. J. Hydrol. 2009, 376, 378–391. [Google Scholar] [CrossRef]
- Dafny, E.; Simunek, J. Infiltration in layered loessial deposits: Revised numerical simulations and recharge assessment. J. Hydrol. 2016, 538, 339–354. [Google Scholar] [CrossRef]
- Gribb, M.M.; Sewell, G. Solution of Ground Water Flow Problems with General Purpose and Special Purpose Computer Codes. Ground Water 1998, 36, 366–372. [Google Scholar] [CrossRef]
- Simunek, J.; Vogel, T.; Van Genuchten, M.T. The SWMS_2D Code for Simulating Water Flow and Solute Transport in Two-Dimensional Variably Saturated Media (Version 1.21); Research Report No. 132; U.S. Salinity Laboratory Agricultural Research Service, U.S. Department of Agriculture: Riverside, CA, USA, 1994.
- Cao, C.Y.; Jiang, D.M.; Teng, X.H.; Jiang, Y.; Liang, W.J.; Cui, Z.B. Soil chemical and microbiological properties along a chronosequence of Caragana microphylla Lam. plantations in the Horqin sandy land of Northeast China. Appl. Soil Ecol. 2008, 40, 78–85. [Google Scholar] [CrossRef]
- Van Genuchten, M.T. A closed-form equation for predicting the hydraulic conductivity of unsaturated soils. Soil Sci. Soc. Am. J. 1980, 44, 892–898. [Google Scholar] [CrossRef]
- Schaap, M.G.; Leij, F.J. Database-related accuracy and uncertainty of pedotransfer functions. Soil Sci. 1998, 163, 765–779. [Google Scholar] [CrossRef]
- Allen, R.G.; Pereira, L.S.; Raes, D.; Smith, M. Crop Evapotranspiration (Guidelines for Computing Crop Water Requirements); FAO Irrigation and Drainage Paper; Food and Agriculture Organization of the United Nations: Rome, Italy, 1998. [Google Scholar]
- Feddes, R.A.; Kowalik, P.; Kolinskamalinka, K.; Zaradny, H. Simulation of field water-uptake by plants using a soil-water dependent root extraction function. J. Hydrol. 1976, 31, 13–26. [Google Scholar] [CrossRef]
- Vogel, T.; Cislerova, M. On the reliability of unsaturated hydraulic conductivity calculated from the moisture retention curve. Transp. Porous Media 1988, 3, 1–15. [Google Scholar] [CrossRef]
- Niu, C.Y.; Musa, A.; Zong, Q.; Luo, Y.M.; Toshio, O.; Sun, G.F.; Liu, Q. Allocation patterns of above-and below-ground biomass of Caragana microphylla in Horqin Sandy Land, North China. Chin. J. Ecol. 2013, 32, 1980–1986, (In Chinese with English Abstract). [Google Scholar] [CrossRef]
- Zhang, G.S.; Wang, L.H.; Dong, Z. A study on water balance of main fixed-dune shrub (arbors) in mu us. J. Inn. Mong. Agric. Univ. 2002, 23, 1–9, (In Chinese with English Abstract). [Google Scholar]
- Ewers, B.E.; Mackay, D.S.; Gower, S.T.; Ahl, D.E.; Burrows, S.N.; Samanta, S.S. Tree species effects on stand transpiration in Northern Wisconsin. Water Resour. Res. 2002, 38, 1–11. [Google Scholar] [CrossRef]
- Pataki, D.E.; Oren, R.; Smith, W.K. Sap flux of co-occurring species in a western subalpine forest during seasonal soil drought. Ecology 2000, 81, 2557–2566. [Google Scholar] [CrossRef]
- Li, X.Y.; Zhang, S.Y.; Peng, H.Y.; Hu, X.; Ma, Y.J. Soil water and temperature dynamics in shrub-encroached grasslands and climatic implications: Results from Inner Mongolia steppe ecosystem of North China. Agric. For. Meteorol. 2013, 171, 20–30. [Google Scholar] [CrossRef]
- Li, X.Y.; Yang, Z.P.; Li, Y.T.; Lin, H. Connecting ecohydrology and hydropedology in desert shrubs: Stemflow as a source of preferential flow in soils. Hydrol. Earth Syst. Sci. 2009, 13, 1133–1144. [Google Scholar] [CrossRef]
- Wei, Y.F.; Fang, J.; Liu, S.; Zhao, X.Y.; Li, S.G. Stable isotopic observation of water use sources of Pinus sylvestris var. mongolica in Horqin Sandy Land, China. Trees-Struct. Funct. 2013, 27, 1249–1260. [Google Scholar] [CrossRef]
© 2017 by the authors. Licensee MDPI, Basel, Switzerland. This article is an open access article distributed under the terms and conditions of the Creative Commons Attribution (CC BY) license (http://creativecommons.org/licenses/by/4.0/).


