Regional Maldistribution of China’s Hospitals Based on Their Structural System

1
School of Construction Management and Real Estate, Chongqing University, Chongqing 400045, China
2
Center for Construction Economy and Management, Chongqing University, Chongqing 400045, China
3
Business School, University of Shanghai for Science and Technology, Shanghai 200093, China
*
Author to whom correspondence should be addressed.
Sustainability 2017, 9(6), 1046; https://doi.org/10.3390/su9061046
Submission received: 24 April 2017
/
Revised: 6 June 2017
/
Accepted: 14 June 2017
/
Published: 16 June 2017
(This article belongs to the Special Issue Social Sustainability and Justice)
Abstract
:Health equity is significant for social sustainability and the Chinese government is trying to achieve the goals of “universal access to basic health care services”. As the comprehensive carrier of health care services, hospitals are almost the most important health care resources and their regional maldistribution needs to give a special concern for health justice and social sustainability. This study aims to explore regional maldistribution of various hospitals through constructing, decomposing and calculating per capita hospitals Gini Coefficient based on the unique structural system of China’s hospitals from 2003–2014. Results show that: (1) the level of regional maldistribution of hospitals in China is not too serious in terms of quantity and there is a slight decline in recent years; (2) regional maldistribution of hospitals is mainly from General Hospitals and in inland areas; and (3) the slight decrease of regional maldistribution is mainly caused by Concentration Effect and increased per capita hospitals. Based on empirical results and the reality of China, some targeted policy suggestions are proposed to reduce regional maldistribution of hospitals and promote health equity for social sustainable development.
1. Introduction
Social sustainability is a comprehensive concept that covers equity, safety, eco-prosumption and urban forms [1], of which equity is the most known representative of social dimensions within the study on sustainability [2], and achievement of equity or justice has already become one of the top goals in sustainable development of the UN’s post-2015 development agenda [3,4]. Simultaneously, because the ultimate aim of sustainable development is to enhance human well-being [5], and health is the foundation of social development, whether from the conceptual dimension or specific area, health equity or justice is a very important aspect of social sustainability and health inequality needs to be solved for social sustainability both in developed and in underdeveloped countries.
China has experienced rapid growth of economy and urbanization since the end of the 1970s when the Reform and Opening policy was officially implemented [6]. Although China has dramatically accelerated economic growth, its regional unbalanced development is also prominent, in particular, there is a considerable disparity between eastern coastal areas and western inland areas in terms of income and public services [7,8]. Most public service resources are strongly concentrated in well-developed regions, especially big cities, while fewer resources are allocated in the western inland and underdeveloped regions [9,10,11]. Faced with this situation, which could lead to greater social conflicts, the Chinese government is committed to changing the phenomenon and the conception of “basic public service equalization” was put forward in the sixth plenum of the 16th Communist Party of China Central Committee in 2006. As a crucial subsystem of public services, even though healthcare services have grown rapidly in recent years [12], there is a marked disparity in health care services similar to other areas of public services because of the long-standing inequality in social and economic development [8,13,14,15]. According to World Health Report 2000. Health Systems: Improving Performance by World Health Organization (WHO) [16], China is ranked 188 out of 191 countries with regard to the equality of health [17]. To change this situation, which threatens social sustainable development, the conception of “universal access to basic healthcare services” was put forward by the Communist Party of China during its 17th National Congress in 2007, which made it clear this is the goal of China’s healthcare development.
Healthcare resources are inputs in the production of healthcare services as well as the determinants of the quantity or quality of healthcare services [18]. Following economic reforms, China’s healthcare sector has changed from a centrally planned system to a market-based system [19]. To improve efficiency, the central government devolved the responsibility of the supply of public health services to the local governments and residents [20], thus local governments and residents have to pay for healthcare resources by themselves [21]. Consequently, wealthier areas can afford more facilities and attract more skilled physicians with better salaries, while the poorer regions have insufficient revenues to adequately develop their healthcare systems [14]. Therefore, regional maldistribution of healthcare services emerge and become a hot topic that attracts increasing interests from the public to academic community gradually [9,11,12].
Hospitals, as the synthetic factors (covering labor, capital, land, and technology) of producing healthcare services, financially account for about 50% of overall healthcare expenditure and organizationally dominate the healthcare system [22]. Of course, they are very important comprehensive carriers of healthcare services and almost viewed as the most important healthcare resources, which determine the quality and ability of health care services of a place [23]. Therefore, the balanced distribution of hospitals is a significant foundation for providing equal healthcare services and promoting social sustainable development of in China.
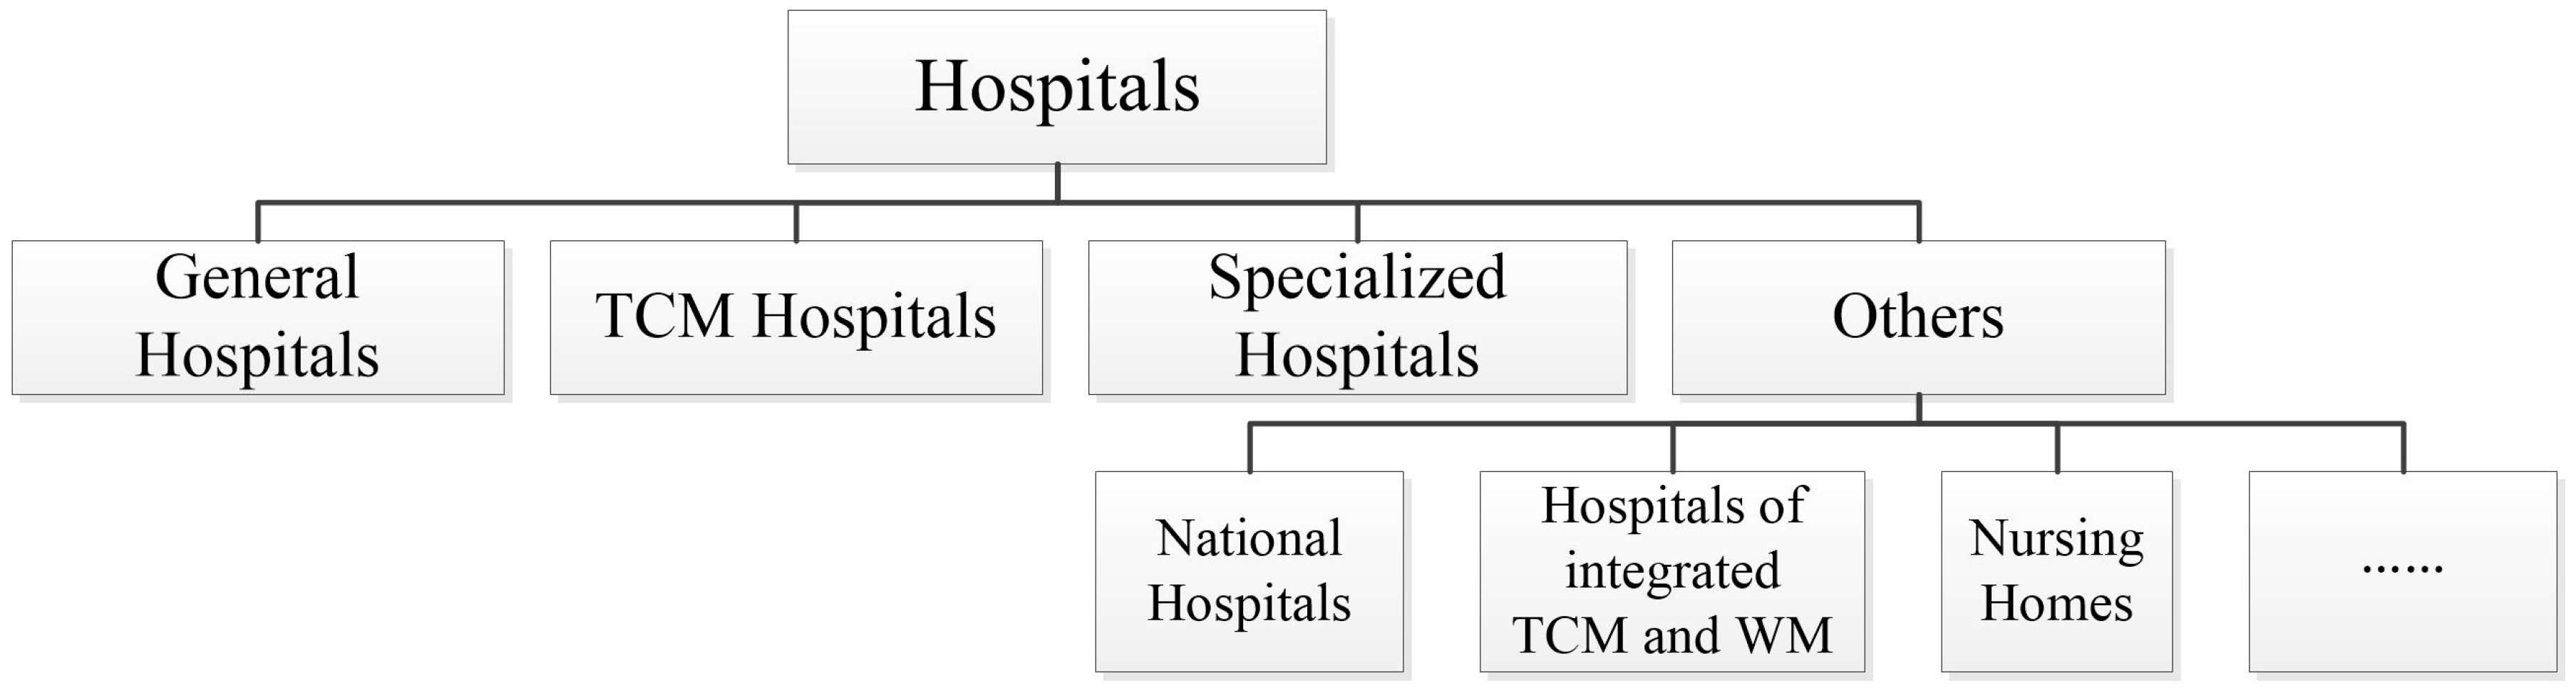
In China, hospitals are divided into various kinds in the light of their ranges of taking and treating patients (Figure 1), which includes General Hospitals, Specialized Hospitals, Traditional Chinese Medicine (TCM) Hospitals, Hospitals of integrated TCM and Western Medicine (WM), National Hospitals, Nursing Homes, etc. Equipped with all categories of clinics and departments, General Hospitals possess massive health care resources, which enable them to be backbones of the hospital system [24]. As a main part of the modern traditional Chinese medicine service network system, TCM Hospitals are the main places of providing TCM services as well as the major basis of inheriting and developing TCM [25]. Specialized Hospitals emerged from gradual refinements of clinical branches [26], whose significant function is to solve some specialized problems which cannot be solved by General Hospitals [27]. Furthermore, to emphasize both TCM and WM, and promote integration of TCM and WM, Hospitals of integrated TCM and WM are established [28]. To inherit and develop medicine of minorities, National Hospitals are founded [29]. For the sake of providing daily nursing, rehabilitation nursing and hospice services to some old people or patients who cannot take care of themselves or suffer severe or terminal illness, Nursing Homes are set up [30]. Each kind of hospitals provides healthcare services for Chinese residents, gives play to their own functions and advantages, and jointly constitutes a complete hospital structural system [23]. Among them, General Hospitals, Specialized Hospitals and TCM Hospitals account for over 97% totally, while Hospitals of integrated TCM and WM, National Hospitals and Nursing Homes only account for less than 3%. Therefore, in this paper, Hospitals of integrated TCM and WM, National Hospitals and Nursing Homes will be all classified as Others.
Although hospitals are almost the most important healthcare resources and their regional distribution can have far reaching impact on social sustainability, there have been few debates on the distribution of China’s hospitals, especially according to the unique structural system of hospitals with Chinese characteristics. For instance, is the regional distribution of China’s various hospitals balanced or not? What is the level of regional maldistribution of various hospitals? What roles do various hospitals play in regional maldistribution of hospitals (RMH)? If the level of RMH changed, why? Further research is needed to solve these problems and fill the research gap. Through this research, it is expected to cover the shortage of related studies on regional maldistribution of China’s hospitals based on their unique structural system, provide indicative references for solutions to solving the problem about RMH, and promote health equity for social sustainability.
The rest of this paper has five parts: Section 2 is theoretical framework and literature review; Section 3 introduces research materials and methods, including indicator selection, data sources, Gini Coefficient construction and decomposition; Section 4 carries out the analysis of empirical results; Section 5 includes related discussions; and Section 6 makes final conclusions.
2. Theoretical Framework and Literature Review
2.1. Theoretical Framework
Social sustainability is a synthetic and complex conception. According to the original definition, sustainable development is “development which meets that needs of the present without compromising the ability of future generations to meet their own needs”, in which needs of human beings and social justice/equity are emphasized [31]. In fact, many scholars argue basic needs and social equity are two fundamental components of social sustainability [31,32,33]. Generally, basic needs include healthcare, education, housing, security, etc., which are significant to maintain the quality of human life [34]; social equity includes not only the equal distribution of income and welfare, but also the equal access to the basic needs related to the quality of human life [33,35,36].
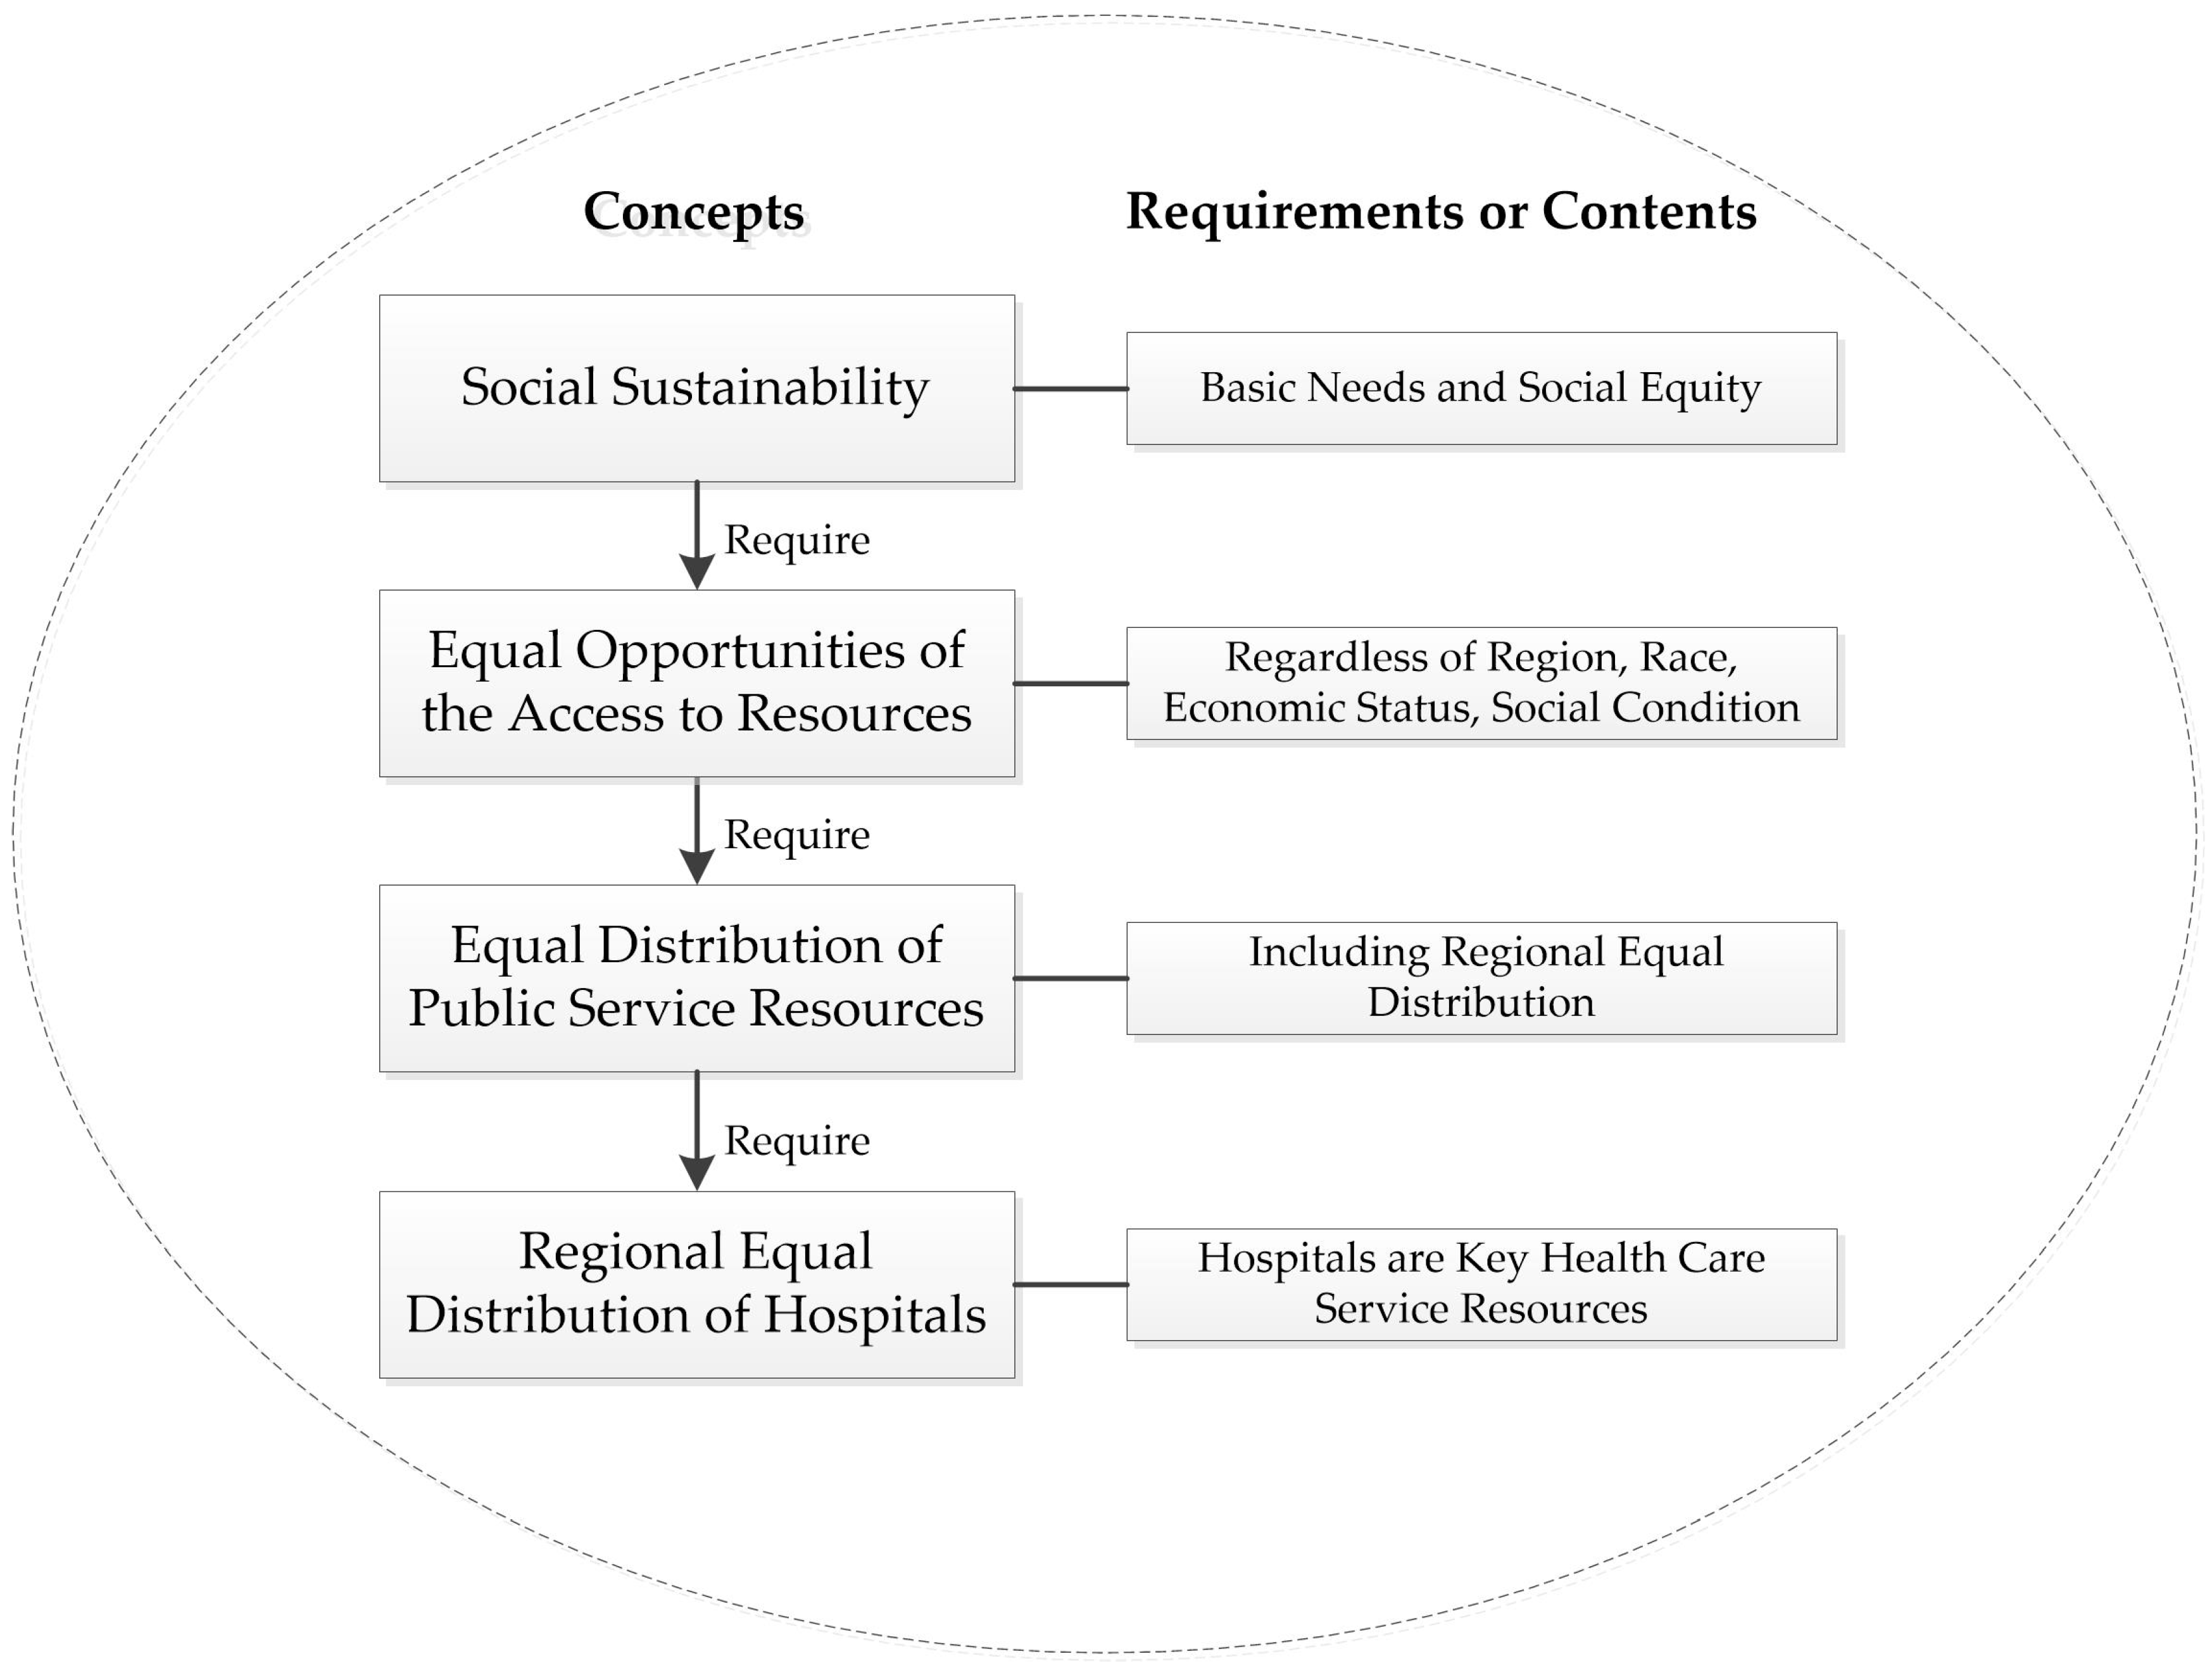
Based on the analysis above, the logic relationship between social sustainability and regional equal distribution of hospitals is shown in Figure 2. Firstly, social sustainability requires all people to have equal opportunities of the access to the key public service resources, regardless of region, race, economic status, or social condition [37]. Secondly, social sustainability means the equal distribution of the key public service resources, especially for countries large in economic and geography, there are significant regional differences so that regional balanced distribution of key public service resources is very crucial for social sustainability [33,37]. Thirdly, the key public service resources mainly refer to the resources related to the quality of human life [34], such as healthcare resources and educational resources. As the key resources related to residents’ health and well-being, healthcare resources’ regional equal distribution is significant for social sustainability. In which, hospitals are almost the most important healthcare resources and their regional equal distribution is very important for social sustainability. Reversely, it would undermine social equity and social sustainability if there were obvious RMH.
2.2. Literature Review
To achieve social equity and sustainability, RMH should be practically solved by policy makers and theoretically analyzed by scholars. Scientific research on RMH will help to grasp the basic facts that are benefit for better scientific decision-making. Existing researches mostly explore RMH or relevant areas from four aspects. (1) Measuring RMH: Many studies quantify RMH through per capita or per land beds or physicians [38,39,40,41,42,43]. (2) Looking for the influencing factors and determinants of regional healthcare resource distribution: Economics [12,18], society [11], institution [19,21], and location [14], which all play significant roles in regional healthcare resource distribution. (3) Analyzing the relationship between equal opportunities for healthcare and health outcome inequality: Although people’s life expectancy and health are closely related to the extent and quality of healthcare resources available [36], equal opportunities of the access to healthcare resources may not result in the equal health outcome as individual differences [44]. However, unequal opportunities will result in health outcome inequality [21,35,36,37,45], which would threaten sustainable development [37]. (4) Exploring the quantitative methods and mathematical tools for regional healthcare resource distribution: The measurement of health inequity is a multidisciplinary endeavor [44], which especially needs the mathematical tools, thus Gini Coefficient [35,36,40,43], Theil Index [43,46], and Variation Coefficient [47] are common methods used to analyze and study.
These studies provide a good theoretical perspective and analytical paradigm, which contribute to understand RMH or relevant resources maldistribution, whereas there are some limitations in existed literature: (1) The study on RMH has not yet taken account of the specific structural system, which is not conducive to master the more detailed information and make more accurate decisions. Most studies focus on regional maldistribution of healthcare resources from the whole perspective, but the specific structure or components are ignored. China’s hospitals not only are a whole, but also have their structural system. (2) There is a lack of quantitative explanation for the reasons why regional maldistribution of healthcare resources changes. (3) Inequality between coastal and inland areas of China is always a hot issue [48] and previous studies paid more attention to the inequality between coastal and inland areas, but rarely analyzed the respective within maldistribution of healthcare resources.
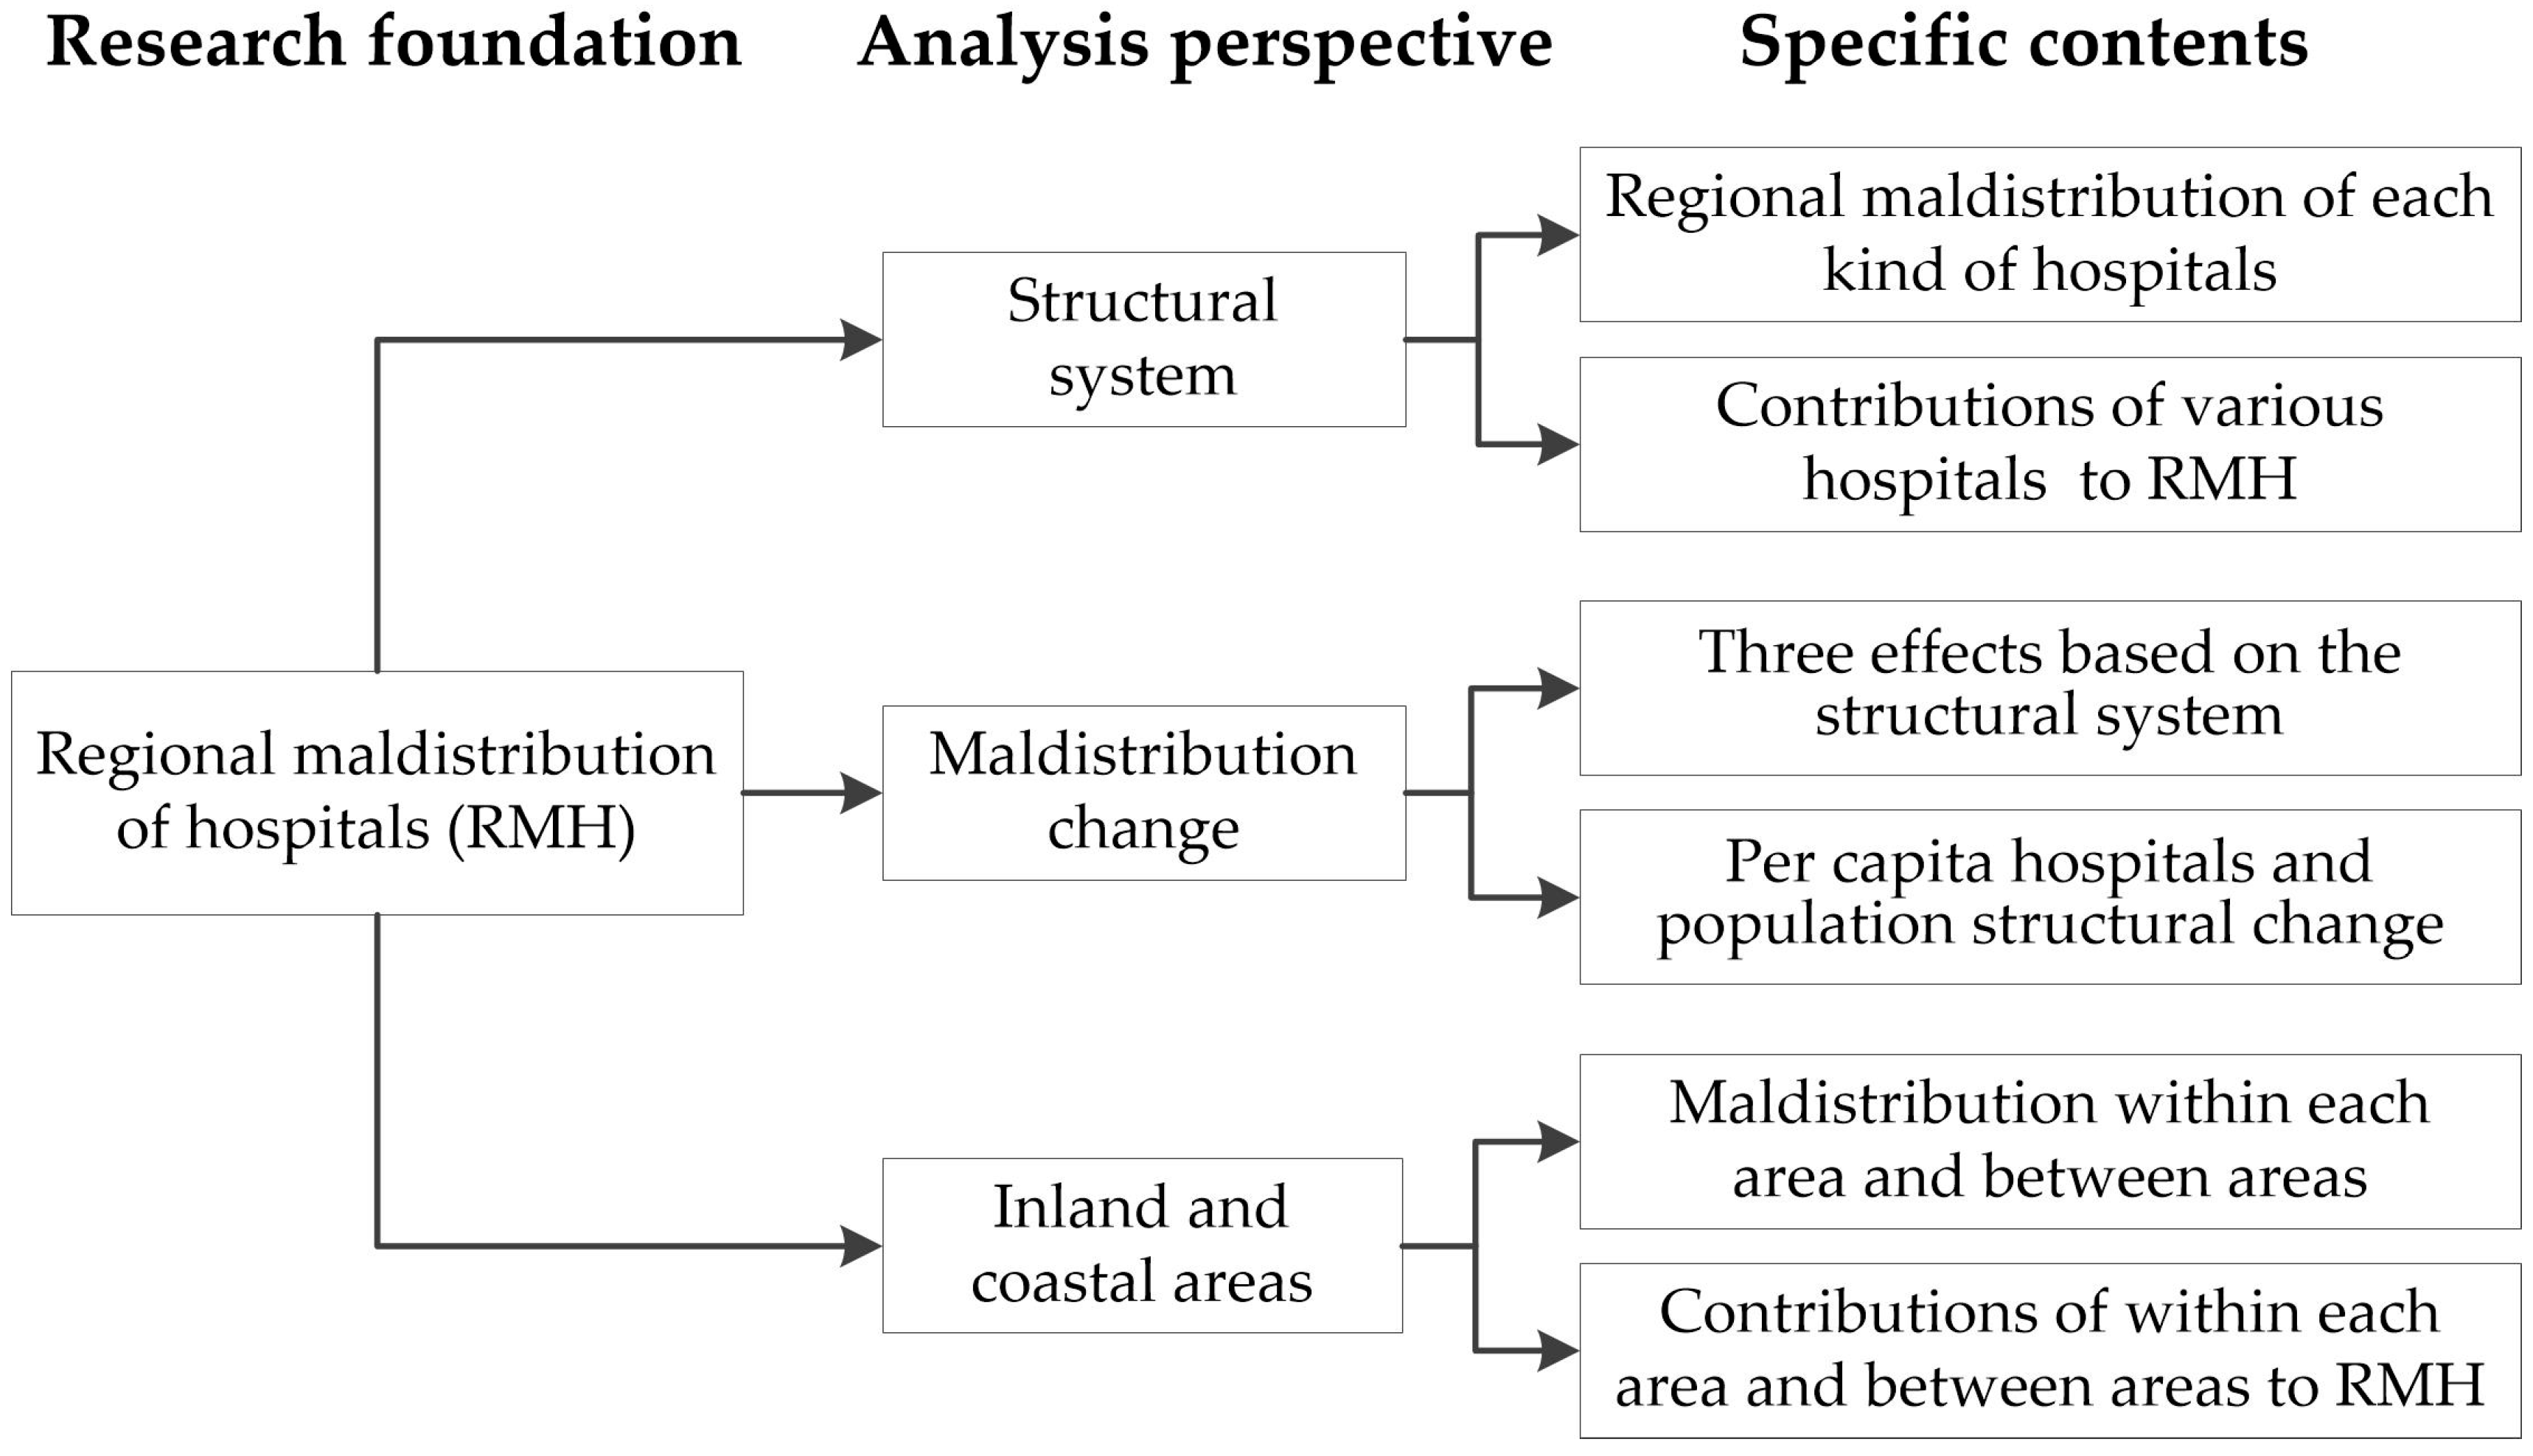
Consequently, this article will bring the structural system of China’s hospitals into the analytical framework and study RMH from the perspective of the structural system and maldistribution change; meanwhile, it will explore the status quo of hospital distribution in inland and coastal areas as previous exploration about the distribution of healthcare resources in inland and coastal areas is inadequate. As shown in Figure 3, the research framework is established as follows: Firstly, quantifying the level and trend of RMH as the research foundation to conduct analysis. Secondly, setting up three perspectives, the structural system, maldistribution change, and inland versus coastal areas, to explore. Finally, exploring the specific contents based on the respective analysis perspective. It is expected to provide a proper analytical framework and paradigm for exploring the maldistribution of healthcare resources through this paper, as well as obtain more accurate conclusions and scientific policy suggestions to guide the relevant practice through the quantitative study.
3. Materials and Methods
3.1. Indicator Selection
This study chooses per capita hospitals in each region based on the following reasons: (1) Most previous studies focus on specific healthcare resources of hospitals, such as beds [38,39,40] or physicians [41,42,43], rather than the whole hospital institutions. This study aims to make up the previous gap to explore regional maldistribution of the whole hospitals based on the China’s unique hospital structural system so that we focus on the whole hospitals but not one resource of hospitals. (2) Both Chinese and international studies have already used per capita healthcare institution numbers to explore China’s regional maldistribution of healthcare institutions [35,36]. Because hospitals are crucial components of healthcare institutions in China, it is rational that per capita hospitals are used to measure China’s hospitals regional maldistribution based on previous studies. (3) The establishment of a hospital must go through a strict administrative approval procedure in China and hospitals must have a certain scale so that the basic capacities of each hospital completely have a guarantee and the scale disparities between different hospitals can remain within a certain range, even if hospitals differs in capacities and services. Consequently, it is possible and rational to use per capita hospitals to assess the richness of hospitals in a certain region. (4) There is the limitation of statistical materials. Without doubt that a more specific and precise situation can be mastered if more detailed data (such as per capita beds or physicians of various hospitals in each region) could be acquired, Chinese statistical department does not collect the detailed data of various hospitals in each region. Consequently, per capita hospitals can relatively better reflect the regional richness of hospitals at present situation.
3.2. Data Sources
Data of the number of various hospitals in each region are acquired in China Health Statistical Yearbook (2004–2015), and the data of population are in China Statistical Yearbook (2004–2015). The data in yearbooks are about a year before the published year (for instance, the data in the yearbook of 2004 are about that of 2003), therefore, the time span of this study is from 2003 to 2014. The reasons for this time span are listed as the following: (1) From 2003, the inequity of hospitals began to be of more concern in China. At the end of the last century, hospitals paid more attention to efficiency [49], and this situation has changed since 2003 when SARS emerged. Along with the fight against SARS, the theoretical circle started reflection and discussion of equity of healthcare services. Meanwhile, social circles gradually began to pay attention to equity of healthcare services and some regions attempted to carry out property system reform on hospitals [50]. (2) To guarantee the coherence of the statistical caliber, the statistical caliber changed in 2002, before that Specialized Disease Prevention and Cure Centers were included as hospitals in China, but subsequent statistics do not include such institutions. (3) Lack of statistical data of Specialized Hospitals in each region before 2002: China Health Statistical Yearbook is compiled since 2003 so there are no data for Specialized Hospitals in each region before 2002.
3.3. Gini Coefficient Construction and Decomposition
Gini Coefficient is firstly used to measure income inequality [51]. Thereafter, it is widely used to study inequalities in various fields, such as macro-economy [3,52], environment [53,54], health [11,35,36,41,55], transportation [56], education [10,57] and others. Compared with other common measure indexes that are applied to measure inequality, such as Theil index, Coefficient of Variation, and Centration Index, Gini Coefficient has a wider application [58]. Meanwhile, Gini Coefficient is capable of the following functions: (1) Gini Coefficient can measure the overall inequality directly, which means that it is able to measure regional maldistribution of various China’s hospitals and master their trends. (2) Gini Coefficient can be decomposed according to sources of income [59]. Therefore, it is possible to find the contribution rate (CR) of each kind of hospitals to RMH. (3) Gini Coefficient can conduct incremental decomposition [60,61], which makes it possible to find the causes and their corresponding CR to the RMH change. (4) Gini Coefficient can conduct decomposition as per regional groups [62], which is beneficial to the analysis of the maldistribution of hospitals between coastal and inland areas in China. The data range of Gini Coefficient is 0–1, which stands for the level of RMH (the larger, the more unbalanced) [3].
Based on the analysis above, this study will construct or decompose Gini Coefficient from four aspects, as shown in Table 1. (1) To acquire the level and the trend of regional maldistribution of various hospitals by constructing and calculating Gini Coefficient of each kind of hospitals. (2) To find the CR of each kind of hospitals to RMH through decomposing Gini Coefficient from the structural system of hospitals. (3) To seek causes of RMH change by decomposing the increment of Gini Coefficient of hospitals in two dimensions: one is carried out in light of the structural system of hospitals that will discover Structure Effect, Concentration Effect and Integrative Effect (Section 3.3.3 will give detailed instructions to the three effects), and the other is to be decomposed by per capita hospitals and population structural change. (4) To explore the maldistribution of hospitals between coastal and inland areas by decomposing Gini Coefficient according to groups.
3.3.1. Constructing Gini Coefficient of Various Hospitals
Respective formulas of Gini Coefficient of various kinds of hospitals are listed as follows:
In Formula (1), represents Gini Coefficient of hospitals in China, while represents population and stands for per capita hospitals. and , respectively, represent Region and Region per capita hospitals. Similarly, in Formulas (2)–(5), , , , and , respectively, stand for Gini Coefficient of General Hospitals, TCM Hospitals, Specialized Hospitals and Others, while , , , and are their respective per capita numbers; , , , and represent their respective per capita numbers in Region ; and , , , and represent their respective per capita numbers in region .
3.3.2. The CR of Each Kind of Hospitals to Gini Coefficient of Hospitals
Through the formula calculation, the CR of each kind of hospitals to Gini Coefficient of hospitals can be found. Specific calculation formula is as follows:
In Formula (6), is Gini Coefficient of hospitals, represents the proportion of the Kind hospitals, and represents the concentration index (pseudo Gini Coefficient) of Kind Hospitals. represents Gini Coefficient of Kind Hospitals. represents the correlation coefficient of Gini Coefficient for Kind Hospitals and hospitals, calculated as follows:
In Formula (7), and represent the number of Kind Hospitals in Region and Region , respectively, the data range of is [−1, 1] [59], and 31 represents that there are 31 regions in Mainland China. Then, Formula (6) can be transformed into Formula (8):
In this formula, is the CR of Kind Hospitals to Gini Coefficient of hospitals.
3.3.3. Decomposing the Increment of Gini Coefficient
Regional maldistribution changes along with demographic and economic factors. It is able to find the reasons why it changes through decomposing increment of Gini Coefficient. This study decomposes and calculates the increment of Gini Coefficient in two dimensions.
In Dimension 1, the increment of Gini Coefficient is decomposed by hospitals’ structural system. According to Formula (6), Formula (9) can be obtained.
In this formula, represents the increment of Gini Coefficient, and stand for Gini Coefficient of the current and the base period, respectively; represents the proportion of Kind Hospitals change; and stand for the proportion of Kind Hospitals in the current and the base period; represents the concentration index change (pseudo Gini Coefficient) of Kind Hospitals; and and stand for the concentration index (pseudo Gini Coefficient) of the Kind Hospitals in the current and the base period, respectively. Therefore, the three sections on the right side of Formula (9) can be defined as: Structure Effect is the structural change of various hospitals; Concentration Effect is the concentration change of various hospitals; and Integrative Effect is the joint action of the first two.
In Dimension 2, the increment of Gini Coefficient is decomposed by the method proposed by Hong, which is based on the per capita hospitals change, regional rank of per capita hospitals, and shares of population in each region [61]. The specific calculation formula is as follows:
In this formula, represents the increment of Gini Coefficient, represents the increment of Gini Coefficient caused by the change of per capita hospitals, represents the increment of Gini Coefficient caused by the change of the regional per capita hospitals rank, and represents the increment of Gini Coefficient caused by the change of population shares in each region. Finally, these three sections divided by is the CR of the increment of Gini Coefficient.
3.3.4. Decomposing Gini Coefficient According to Inland and Coastal Areas
The 31 regions in Mainland China can be divided into two groups, inland and coastal areas (the coastal areas include Beijing, Tianjin, Hebei, Liaoning, Shandong, Shanghai, Jiangsu, Zhejiang, Fujian, Guangdong, and Hainan, while the inland areas include Shanxi, Inner Mongolia, Jilin, Heilongjiang, Anhui, Jiangxi, Henan, Hubei, Hunan, Hainan, Chongqing, Sichuan, Tibet, Guizhou, Yunnan, Shaanxi, Gansu, Qinghai, Xinjiang, and Ningxia), and Gini Coefficient can be decomposed according to the two groups. The specific calculation formula is as follows [56]:
where , . and represent the proportion of hospitals in coastal areas and inland areas, respectively; and represent the proportion of population in coastal areas and inland areas, respectively; and stand for Gini Coefficient of hospitals within coastal areas and inland areas, respectively; represents Gini Coefficient between coastal and inland areas; and represents the residual term as a result of the cross of per capita hospitals between inland and coastal areas. The mathematical expression of was provided firstly by Lambert and Decoster [63]:
where and represent the distribution function of per capita hospitals in coastal and inland areas, respectively. stands for the mean of national per capita hospitals.
4. Results and Analysis
4.1. The Level of Regional Maldistribution of Various Hospitals and Their Trend
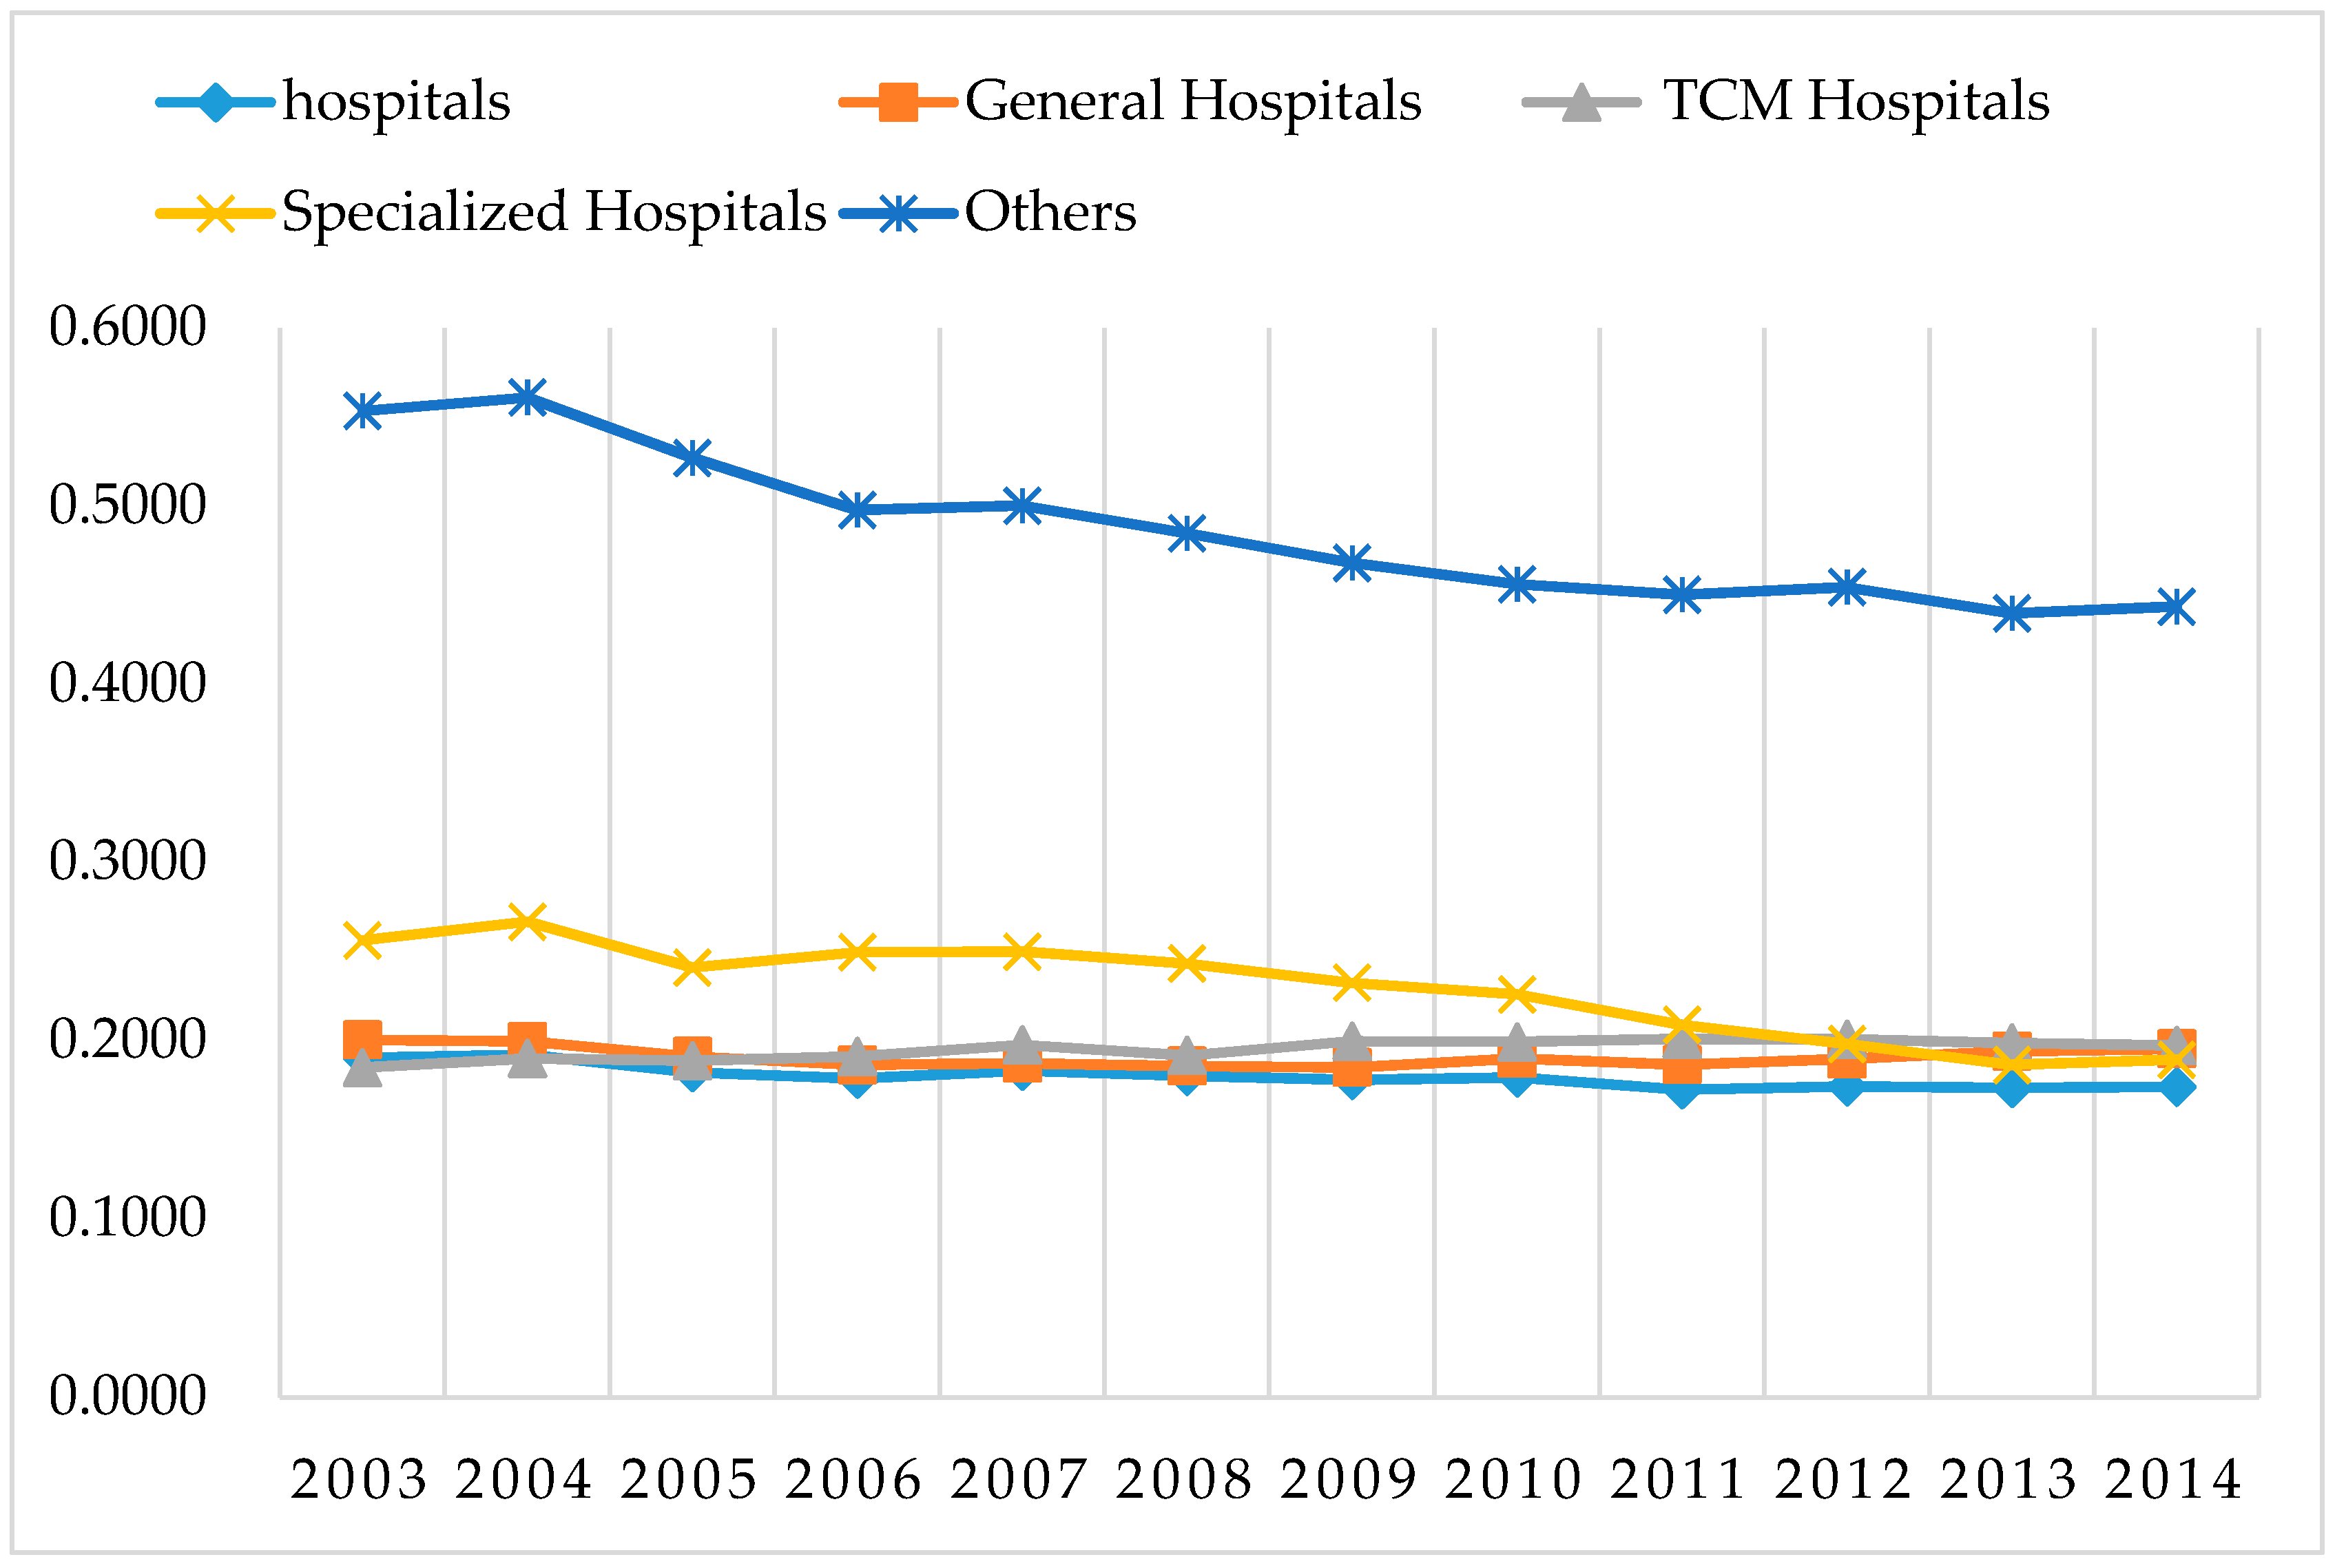
As shown in Figure 4, Gini Coefficient of all kinds of hospitals (except Others) in China is about 0.2. According to general international standards, a Gini Coefficient that is smaller than 0.3 represents a particularly equitable condition, 0.3–0.4 is the normal condition, while greater than 0.4 raises concern, and a value greater than 0.6 indicates a dangerous state [36]. Gini Coefficient less than 0.3 shows that China’s RMH is still relatively balanced in terms of quantity in recent years. This is closely related to the existing hospital system in China. Normally, regardless of the level of their social and economic development, each town has at least one public hospital to ensure the basic health needs of local residents, and each county also has county General Hospitals (such as the county People’ Hospital), TCM Hospitals and some Specialized Hospitals to provide the corresponding public healthcare services in China. These considerable quantities of primary hospitals are evenly distributed in various regions, thus ensuring the equilibrium of the distribution of hospitals in China.
In addition, from 2003 to 2014, the number of hospitals per 10,000 persons only increased from 0.0983 to 0.1213, which reflects the total number of hospitals is still limited. Combined with the interregional distribution being relatively balanced, it reflects hospital resources are still very tight in most regions of China.
From the perspective of trends: (1) Gini Coefficient of hospitals slightly reduces from 0.1904 to 0.1741, the decline is not particularly evident. (2) Gini Coefficient of Specialized Hospitals and Others shows a downward trend, indicating that the extent of maldistribution of these two kinds of hospitals decreases significantly. Specialized Hospitals and Others are mainly private hospitals [26]; their establishment is mainly market oriented. Because of the limitation of economic development level, these hospitals were mainly distributed in economically developed regions initially. However, with the development of the economy in other regions, the expansion rate of these hospitals was significantly higher than that in the developed regions in recent years. For instance, from 2003 to 2014, the number of Specialized Hospitals in Sichuan Province increased from 141 to 363. On the contrary, the number of Specialized Hospitals in Tianjin increased from 54 to 75 in the same period, and its increase was far less than that of Sichuan. (3) Gini Coefficient of General Hospitals and TCM Hospitals has not changed much; in other words, it shows that the extent of regional maldistribution of these hospitals has not changed significantly. These hospitals are usually large public hospitals in China; all towns have public General Hospitals and each county has TCM Hospitals nearly. Because the establishment and operation of such hospitals require a large government fiscal investment, and such hospitals already exist in local regions, these kinds of hospitals have no remarkable growth. Therefore, neither the per capita hospitals nor the maldistribution extent of such hospitals has changed significantly.
Comparing Gini Coefficient of various hospitals: (1) Gini Coefficient of hospitals is the smallest, which implies that the distribution of different kinds of hospitals has a certain alternative and the mutual substitution of healthcare services among different kinds of hospitals reduces the regional inequality of the number of hospitals. For example, both General Hospitals and Dental Specialized Hospitals can provide oral health care services, thus if there are already more General Hospitals (which almost have dental departments) in a region that would occupy the development space of Dental Specialized Hospitals, the total number of hospitals in these regions will keep relatively balanced, which results in the more balanced distribution of hospitals among regions. (2) Gini Coefficient of Others is the largest and it is significantly higher than other kinds of hospitals, which means that this kind of hospitals is the most regional maldistribution. Others are composed of a variety of specific kinds of hospitals such as Hospitals of integrated TCM and WM and National Hospitals; these kinds of hospitals provide differential healthcare services and have the strong regional characteristic so that their distribution is highly unbalanced. However, because Others are for meeting regional specific population, the maldistribution of this kind of hospitals is acceptable. (3) In recent years, there is no significant difference in Gini Coefficient among General Hospitals, Specialized Hospitals and TCM Hospitals, which shows that the level of regional maldistribution of these three kinds of hospitals is close recently. As mentioned above, most General Hospitals and TCM Hospitals are public hospitals, in order to ensure the basic health needs of local residents, each town established at least one of public hospitals, each county also has county General Hospitals and TCM Hospitals, therefore, the gap of regional maldistribution between General Hospitals and TCM Hospitals is traditionally small. However, Specialized Hospitals are mainly private hospitals and their establishment is through market orientation. With the market-oriented reform, not only more Specialized Hospitals are established, but also their regional gap is gradually narrowing, even though the level of regional maldistribution is close to General Hospitals and TCM Hospitals, which are mainly public hospitals. This proves that persisting hospital be market oriented is not only conducive to the establishment of more hospitals, but also contributes to the interregional fairness of distribution of hospitals.
4.2. The CR of Each Kind of Hospitals to Regional Maldistribution of China’s Hospitals
As shown in Table 2, the CR of General Hospitals is the highest and always around 70%, while the CR of other hospitals is sorted from large to small as follows: Specialized Hospitals, TCM Hospitals and Others.
From the points of the CR trend, the CR of General Hospitals first decreases and then increases afterwards: it drops from 73.78% in 2003 to the lowest point 67.63% in 2009, and then there is a certain extent of recovery. This situation is closely related to the development speed of General Hospitals in this period. From 2003 to 2009, General Hospitals increased by 2527, but from 2009 to 2014, they increased by 5569 and the growth rate is significantly higher than the previous period. On the contrary, the CR of TCM Hospitals increases firstly and then decreases. Such a situation is also related to the development speed of TCM Hospitals, but it is the opposite of General Hospitals, the growth rate of TCM Hospitals in the previous period is much faster. Finally, the CR of Specialized Hospitals experiences a rapid increase firstly and then declines slightly. This situation is closely related to the development speed of Specialized Hospitals yet, from 2003 to 2014, Specialized Hospitals increased from 2271 to 5478 so that their contribution to Gini Coefficient increases significantly. Besides, there is a very small range for the variation of the CR of Others and it maintains from 4% to 5%.
The above analysis shows that General Hospitals contribute most to regional maldistribution of hospitals in China, and other kinds of hospitals would lead to a certain extent of regional maldistribution of hospitals. Therefore, China needs to focus on solving the maldistribution of General Hospitals and other kinds of hospitals should be appropriate consideration at the same time.
4.3. The Reasons Why RMH Changed
From 2003 to 2014, Gini Coefficient of hospitals decreased by 8.56%, which shows RMH is alleviated slightly in China. Through the decomposition of Gini Coefficient increment in two dimensions, reasons of Gini Coefficient decline can be obtained.
From the decomposing result in Dimension 1, as shown in Table 3, Concentration Effect is 84.12% and contributes most to the decrease of Gini Coefficient, which indicates that the regional concentration of hospitals decreases effectively. Conversely, Structure Effect increases Gini Coefficient by 0.0025, which indicates that the structural change of hospitals aggravates the maldistribution and the structure of various hospitals should be further optimized in China.
Based on the decomposing result in Dimension 2, as shown in Table 4, the increased per capita hospitals is the most important reason for the RMH drops. On the contrary, the change of the regional per capita hospitals rank increases Gini Coefficient, which indicates the rank change aggravated the maldistribution. Besides, the change of population shares in each regional also increases Gini Coefficient.
This result shows that China needs to increase the supply of hospitals continually, especially increase input in the regions where there are fewer per capital hospitals. In doing so, China can not only build more hospitals, but can also promote regional hospital distribution equity. Meanwhile, the change of regional rank aggravated the maldistribution, which indicates that interregional hospital supply is unbalanced, which leads to more serious maldistribution in the past period. In addition, encouraging appropriate population flow could also decrease the maldistribution to some extent.
4.4. Maldistribution of Hospitals in Inland and Coastal Areas
The economic inequality between inland and coastal areas has existed for a long time in China [47]. How do hospitals distribute between inland and coastal areas? The question is answered through decomposing Gini Coefficient according to inland and coastal areas.
As shown in Table 5, the CR of inland areas is always about 40% and it contributes most to Gini Coefficient of hospitals. This result shows that the inequality within inland areas is the main source of RMH in China.
Gini Coefficient of coastal areas is obviously smaller than that of inland areas, which indicates that the level of maldistribution of hospitals within coastal areas is obviously lower than that in inland areas. Gini Coefficient between inland and coastal areas decreases first and then increases afterwards: it drops from 0.0268 in 2003 to the lowest point 0.0191 in 2007, and then quickly increases to 0.0309 in 2014, which indicates that the level of maldistribution of hospitals between inland and coastal areas experiences an evolution that narrows at first and then enlarges. The CR of the residual term is always above 30%, which not only indicates that there are many crosses about per capita hospitals between inland and coastal areas, but also shows that RMH in China is not mainly caused by the inequality between inland and coastal areas for that many inland areas have per capita hospitals as many as some coastal areas.
The above analysis shows RMH is mainly from inland areas and maldistribution within inland areas is obviously more serious than that of coastal areas in China. Therefore, more attention should be paid to inland areas and China should carry on different hospitals supply policies in inland areas based on the facts of each inland region.
5. Discussion and Policy Suggestions
This paper studies RMH in China during 2003 to 2014 based on constructing, decomposing and calculating Gini Coefficient of various hospitals. Compared with the previous studies, this study mainly makes a progress in the following three aspects: (1) The previous studies mainly focus on the regional distribution of a certain kind of healthcare resources as a whole, including the studies on regional distribution of medical institutions [35,36], medical expenses [8], physicians [41,42,43], and medical beds [38,39,40]. However, few studies analyze a certain kind of healthcare resources based on the structural systems themselves deeply. Taking the hospital as an example, this paper not only studies the regional maldistribution of various hospitals with Chinese characteristics, but also analyzes their contributions to RMH respectively. This is an important step in the study on structural healthcare resources and their distribution. (2) The previous researches on the change of the maldistribution in healthcare resources are mainly qualitative explanations [11], but there are few quantitative studies on the reasons for the change of the maldistribution. This paper not only analyzes the reasons of the interregional maldistribution change in two dimensions, but also makes a precise quantification of the CR of each cause. (3) The previous studies mainly analyze the inequality of healthcare resources between inland and areas [18,64], but ignored the inequality within inland or coastal internal areas. Meanwhile, it has not been found that there is research on analysis of inland or coastal internal areas’ contribution to the China’s regional maldistribution in the field of healthcare resources. This paper not only studies RMH between inland and coastal areas, but also researches the inequality within inland and coastal areas, as well calculates the corresponding CR to RMH. The following main conclusions are obtained through this study.
First, overall, Gini Coefficient of hospitals is always below 0.2 and decreases from 0.1904 to 0.1741, which not only indicates that RMH in China is not too serious in terms of quantity and decreases slightly, but also reflects there is a tension of hospitals in many regions from another dimension, thus China should build more hospitals all over the country.
Second, Gini Coefficient of hospitals is mainly contributed by General Hospitals and their CR is always about 70%, which indicates that General Hospitals are the main source of RMH in China. Therefore, China needs to focus on solving the maldistribution of General Hospitals.
Third, it is found that Concentration Effect and the increased per capita hospitals are two main reasons why Gini Coefficient slightly decreases through decomposing the increment of Gini Coefficient. Instead, Structure Effect increases regional maldistribution of hospitals. Therefore, to reduce RMH, China not only needs to continue to increase the supply of hospitals, especially in regions where there are fewer per capital hospitals, but also should optimize the structure of various hospitals in the future. In addition, the appropriate population flow could also reduce the inequality.
Finally, decomposing Gini Coefficient by inland and coastal areas, this study discovers that RMH is mainly derived from inland areas and maldistribution within inland areas is more serious.
Based on the results and conclusions of this study, combined with China’s reality, some targeted suggestions are proposed as follows.
(A) To further relax the market access conditions and broaden the sources of funds for hospital construction. In the past, government investment is the main source of funds for hospital construction. However, the fiscal fund cannot meet the public growing demand for healthcare, especially in underdeveloped areas, where fiscal income is limited and it is essential to expand the financing channels for hospital construction.
(B) The hospital supply must give full play to the roles of the market and government. Given that hospitals rely solely on the government supply not only exceeds the government supply capacity, but also leads to the shortage of the supply efficiency and quality. This study demonstrates that hospital market orientation is conducive to the establishment of more hospitals and the regional balanced distribution of hospitals (as analyzed in Section 4.1). Therefore, China needs to introduce the market mechanism to solve the problem of supply. Public–private partnerships (PPP) are introduced and applied in many fields of public services recently by the Chinese government and is a good way to provide healthcare services including hospitals. It could not only solve the shortage of funds for hospital construction and reduce the dependence on government, but also make the hospital supply more effective [65]. However, we should also point that the market is not a panacea, especially in areas where the profitability is very limited and the government should assume the main responsibility for the supply of hospitals.
(C) China should not only increase the quantity of hospitals, but also put emphasis on improving the quality of hospital services. Regional distribution of hospitals is relatively balanced in terms of quantity, however, there is still a big regional gap of the quality of hospital services in China [11]. The quality of hospital services in economically developed regions is significantly higher than that in the economically undeveloped regions [10]. Therefore, China should boost both the quantity and the quality of hospitals.
(D) Healthcare services should also meet the differentiated and diverse demands of the public, rather than just focus on the average distribution of hospitals. The balanced distribution of hospitals reflects the social equity and justice, but mainly in the basic healthcare services, instead, overemphasis on the average of public services would damage the efficiency of supply [66,67], and the contents of basic medical services should be formulated in accordance with the national healthcare system and its own economic conditions [68,69,70]. Although China is in a stage of rapid development at present, it is still a developing country, and the goal of the healthcare service development is still basic healthcare for everyone in China [11]. For hospitals, it is inappropriate to expand the scope of the equalization, and balanced distribution is mainly for hospitals that provide basic healthcare services. However, to meet the differentiated and diverse demands of the public, as well as ensure the supply of hospitals of high quality and high efficiency, China should differentiate categories of hospital services and clearly divide the responsibilities of the supply based on the specific situation.
6. Conclusions
Based on the analysis conducted in this study, it is found that RMH is not serious in terms of quantity in China, and there is a slight decline in recent years. Nevertheless, the result implies there is a full tension of hospitals in most areas from another perspective. Meanwhile, according to the decomposition and calculation of Gini Coefficient in three aspects, it is also found: (1) General Hospitals are the main source of RMH in China; (2) Concentration Effect and increased per capita hospitals are two main reasons why the maldistribution slightly decreases; and (3) RMH is mainly derived from inland areas.
RMH in China is not just an important practical problem, but also a hot topic worth studying; the reality is much more complicated than the research of this paper. Study on RMH just tries to analyze and interpret equal opportunities for healthcare from the perspective of the spatial distribution. Although spatial distribution of China’s hospitals is relatively equal, as found by the researches of this article and others [35,36], this cannot represent that all residents have the equal opportunity and right to hospital resources. Acquisition of healthcare resources is restricted by economy, society, institution and others. For instance, the poverty may not afford the hospital expense if the social security is not perfect, in this case they could not get the equal opportunities for healthcare. Simultaneously, the right of residents to public services is often linked to their hukou in China so that migrants without local hukou are largely excluded from the welfare and opportunities that just local residents can enjoy [71,72], which means migrants cannot get the equal opportunities for healthcare. Based on analysis above, Chinese government needs to further strengthen financial support for the impoverished, hukou system of discrimination should be eliminated, and a more equal system environment should be created to ensure that all people can get really equal opportunities for healthcare. Furthermore, equal opportunities may not mean equal outcome of health as the individual differences [44]; it is necessary to provide more accurate healthcare services based on individual characteristics and promote the health level in the whole society. In addition, all income inequality [9,12,73], environmental inequality [74,75,76], and institution inequality [11,21,72] will result in health inequality. Consequently, a more equal society should be established for health equity and social sustainability.
As a method of measuring inequality, Gini Coefficient is not a panacea and the variables considered can only exist in the formulas. It cannot directly reflect the factors that do not exist in the formulas, such as economic variables, policy variables, environmental variables, etc. Meanwhile, because of the limitation of the availability of data, the indicator, the per capita hospitals, is not perfect. As the comprehensive carrier of healthcare resources, hospitals have medical personnel, hardware equipment, investment funds, etc., thus the regional distribution of all kinds of healthcare resources in hospitals is worthy of attention. The authors will try to collect more relevant statistical data and conduct deeper researches on the regional distribution of health care resources. Besides, China’s hospitals can also be classified by their grades, and regional distribution of hospitals of various grades is also worth studying. This study mainly focuses on various hospitals in the light of their ranges of taking and treating patients, without stressing regional distribution of hospitals according to different grades for fear that the latter topic is too scattered to cover.
Health inequity or inequality is a worldwide problem for social sustainability. As the comprehensive carrier of healthcare resources, hospitals and their regional distribution are worthy of research and attention for social sustainable development. Especially in China, not only do hospitals have obvious regional distribution characteristics, but they also have their unique structural system. Meanwhile, previous studies are rarely interested in regional distribution of China’s hospitals from their unique structural system, as well relatively lack of quantitative methods to study the relevant area of social sustainability [1]. Consequently, the study on regional distribution of various hospitals is helpful for both researchers and policy makers. Nevertheless, we should also note the method of Gini Coefficient and the indicator of the per capita hospitals are not perfect, and more in-depth and systematic study on the specific problems of China’s hospitals needs to be conducted in the future.
Acknowledgments
This paper was funded by the National Natural Science Foundation of China (Project No. 71473203) and National Social Science Foundation of China (Project No. 10XGL009). This paper was also funded by the Fundamental Research Funds for the Central Universities (Project No. 2016CDJXY and Project No. 106112016 CDJSK 03 JD 01).
Author Contributions
Lie Ma contributed to study design, data collection, and drafting and revising the manuscript. Xiaosu Ye conceptualized the study design. Qiu Xie reviewed the manuscript, collected and sorted some of the data. Shiying Shi contributed to writing and interpretation of findings. Aifeng Zhao contributed much to revising the manuscript. All authors read, revised and approved the final manuscript.
Conflicts of Interest
The authors declare no conflict of interest.
References
- Eizenberg, E.; Jabareen, Y. Social Sustainability: A New Conceptual Framework. Sustainability 2017, 9, 68. [Google Scholar] [CrossRef]
- Jabareen, Y. A New Conceptual Framework for Sustainable Development. Environ. Dev. Sustain. 2008, 10, 179–192. [Google Scholar] [CrossRef]
- Ye, X.; Ma, L.; Ye, K.; Chen, J.; Xie, Q. Analysis of Regional Inequality from Sectoral Structure, Spatial Policy and Economic Development: A Case Study of Chongqing, China. Sustainability 2017, 9, 633. [Google Scholar] [CrossRef]
- Wei, Y. Towards Equitable and Sustainable Urban Space: Introduction to Special Issue on “Urban Land and Sustainable Development”. Sustainability 2016, 8, 804. [Google Scholar] [CrossRef]
- Yan, Y.; Shan, P.; Wang, C.; Quan, Y.; Wu, D.; Zhao, C.; Wu, G.; Deng, H. Assessment of urban sustainability efficiency based on general data envelopment analysis: A case study of two cities in western and eastern China. Environ. Monit. Assess. 2017, 189, 191. [Google Scholar] [CrossRef] [PubMed]
- Tian, X.; Yu, X. The Enigmas of TFP in China: A meta-analysis. China Econ. Rev. 2012, 23, 396–414. [Google Scholar] [CrossRef]
- Xin, M.; Tang, Y.; Wong, C.W.Y. Environment: Polluters migrate to China’s poor areas. Nature 2015, 518, 483. [Google Scholar]
- Chou, W.L.; Wang, Z. Regional inequality in China’s health care expenditures. Health Econ. 2009, 18, S137–S146. [Google Scholar] [CrossRef] [PubMed]
- Bakkeli, N.Z. Income inequality and health in China: A panel data analysis. Soc. Sci. Med. 2016, 157, 39–47. [Google Scholar] [CrossRef] [PubMed]
- Wang, J.; Jang, W. Educational inequality among Chinese urban schools: The business ethics of private schools. Asia Pac. Bus. Rev. 2016, 22, 1–14. [Google Scholar] [CrossRef]
- Xu, H.W.; Xie, Y. Socioeconomic Inequalities in Health in China: A Reassessment with Data from the 2010–2012 China Family Panel Studies. Soc. Indic. Res. 2017, 132, 219–239. [Google Scholar] [CrossRef]
- Chen, Z.; Meltzer, D. Beefing up with the Chans: Evidence for the effects of relative income and income inequality on health from the China Health and Nutrition Survey. Soc. Sci. Med. 2008, 66, 2206–2217. [Google Scholar] [CrossRef] [PubMed]
- Blumenthal, D.; Hsiao, W. Privatization and its discontents—The evolving Chinese health care system. N. Engl. J. Med. 2005, 353, 1165–1170. [Google Scholar] [CrossRef] [PubMed]
- Li, Y.; Wei, Y.H. A Spatial-Temporal Analysis of Health Care and Mortality Inequalities in China. Soc. Sci. Electron. Pubic 2010, 51, 767–787. [Google Scholar] [CrossRef]
- Huang, C.; Liu, C.J.; Pan, X.F.; Liu, X.; Li, N.X. Correlates of unequal access to preventive care in China: A multilevel analysis of national data from the 2011 China Health and Nutrition Survey. BMC Health Serv. Res. 2016, 16, 1–13. [Google Scholar] [CrossRef] [PubMed]
- World Health Organization (WHO). World Health Report 2000. Health Systems: Improving Performance; WHO: Geneva, Switzerland, 2001. [Google Scholar]
- Li, S.P. The realistic choice of improving health equity. Health Econ. Res. 2005, 11, 14. [Google Scholar]
- Qin, X.; Hsieh, C.R. Economic Growth and the Geographic Maldistribution of Health Care Resources: Evidence from China, 1949–2010. China Econ. Rev. 2014, 31, 228–246. [Google Scholar] [CrossRef]
- Ma, J.; Lu, M.; Quan, H. From a national, centrally planned health system to a system based on the market: Lessons from China. Health Aff. 2008, 27, 937–948. [Google Scholar] [CrossRef] [PubMed]
- Akin, J.S.; Dow, W.H.; Lance, P.M.; Loh, C.P. Changes in access to health care in China, 1989–1997. Health Policy Plan. 2005, 20, 80–89. [Google Scholar] [CrossRef] [PubMed]
- Brixi, H.; Mu, Y.; Targa, B.; Hipgrave, D. Engaging sub-national governments in addressing health equities: Challenges and opportunities in China’s health system reform. Health Policy Plan. 2013, 28, 809–824. [Google Scholar] [CrossRef] [PubMed]
- McKee, M.; Healy, J. The role of the hospital in a changing environment. Bull. World Health Organ. 2000, 78, 803–810. [Google Scholar] [PubMed]
- Cao, J.W.; Liu, Y.Z. Hospital Management, 3rd ed.; Fudan University Press: Shanghai, China, 2010. (In Chinese) [Google Scholar]
- Li, M.; Li, X. A Series of Studies on Benefit Analysis of Chinese Medical and Health Undertakings: Benefit Analysis of Chinese Health Service during 1990–2009. Value Eng. 2012, 26, 283–285. [Google Scholar]
- Yin, D.M. Analysis on the Development Issues of Traditional Chinese Medicine Hospitals and Responding Strategy. Ph.D. Thesis, Fudan University, Shanghai, China, 2013. (In Chinese). [Google Scholar]
- Yu, S.H. Discussion and Practice on the development path of specialized hospitals. Chin. Hosp. Manag. 2007, 27, 52–53. [Google Scholar]
- Yu, X.Y.; Huo, Y.; Zhang, H.P.; Shou, C.C. Discussion on the construction of specialized hospitals. China Health Ind. 2005, 9, 74–75. [Google Scholar]
- Jin, L.G.; Zhang, Q.J.; Jiang, C. A study on the combination of Traditional Chinese Medicine and Western Medicine in 21st Century. J. Manag. Chin. Med. 2008, 16, 741–743. [Google Scholar]
- Bo, Y. National Hospital: Although it is romantic but not mainstream. China Health Ind. 2004, 9, 30–31. [Google Scholar]
- Ahroni, J.H.; Boyko, E.J.; Davignon, D.R.; Pecoraro, R.E. The Health and Functional Status of Veterans with Diabetes. Diabetes Care 1994, 17, 318–321. [Google Scholar] [CrossRef] [PubMed]
- World Commission on Environment and Development. Our Common Future; Oxford University Press: Oxford, UK, 1987. [Google Scholar]
- Littig, B.; Griessler, E. Social sustainability: A catchword between political pragmatism and social theory. Int. J. Sustain. Dev. 2005, 8, 65–79. [Google Scholar] [CrossRef]
- Liu, Y.; Dijst, M.; Geertman, S.; Cui, C. Social Sustainability in an Ageing Chinese Society: Towards an Integrative Conceptual Framework. Sustainability 2017, 9, 658. [Google Scholar] [CrossRef]
- Marozzi, M.; Bolzan, M. An Index of Household Accessibility to Basic Services: A Study of Italian Regions. Soc. Indic. Res. 2016. [Google Scholar] [CrossRef]
- He, M.H. Research on Health Service Equity in China. Ph.D. Thesis, Third Military Medical University, Chongqing, China, 2013. (In Chinese). [Google Scholar]
- Jin, J.; Wang, J.X.; Ma, X.Y.; Wang, Y.D.; Li, R.Y. Equality of Medical Health Resource Allocation in China Based on the Gini Coefficient Method. Iran. J. Public Health 2015, 44, 445–457. [Google Scholar] [PubMed]
- Hosseinpoor, A.R.; Bergen, N.; Schlotheuber, A. Promoting health equity: WHO health inequality monitoring at global and national levels. Glob. Health Action 2015, 8, 29034. [Google Scholar] [CrossRef] [PubMed]
- Meskarpouramiri, M.; Mehdizadeh, P.; Barouni, M.; Dopeykar, N.; Ramezanian, M. Assessment the Trend of Inequality in the Distribution of Intensive Care Beds in Iran: Using GINI Index. Glob. J. Health Sci. 2014, 6, 28–36. [Google Scholar]
- Asl, I.M.; Abolhallaje, M.; Raadabadi, M.; Nazari, H.; Nazari, A; Salimi, M.; Javani, A. Distribution of hospital beds in Tehran Province based on Gini coefficient and Lorenz curve from 2010 to 2012. Electron. Phys. 2015, 7, 1653–1657. [Google Scholar]
- Saw, C.G.; Chee, K.C.; Victor, C.W.H.; Chiu-Wan, N. Equitable Distribution of Public Hospitals According to Health Needs in Malaysia: Does It Exist or Not? Asia Pac. J. Public Health 2015, 27, 79–85. [Google Scholar]
- Rios-Diaz, A.J.; Metcalfe, D.; Singh, M.; Zogg, C.K.; Olufajo, O.A.; Ramos, M.S.; Caterson, E.J.; Talbot, S.G. Inequalities in Specialist Hand Surgeon Distribution across the United States. Plast. Reconstr. Surg. 2016, 137, 1516–1522. [Google Scholar] [CrossRef] [PubMed]
- Koike, S.; Yasunaga, H.; Matsumoto, S.; Ide, H.; Kodama, T.; Imamura, T. A future estimate of physician distribution in hospitals and clinics in Japan. Health Policy 2009, 92, 244–249. [Google Scholar] [CrossRef] [PubMed]
- Song, P.G.; Ren, Z.H.; Chang, X.L.; Liu, X.B.; An, L. Inequality of Paediatric Workforce Distribution in China. Int. J. Environ. Res. Public Health 2016, 13, 703. [Google Scholar] [CrossRef] [PubMed]
- Asada, Y.; Hurley, J.; Norheim, O.F.; Johri, M. A three-stage approach to measuring health inequalities and inequities. Int. J. Equity Health 2014, 13, 98. [Google Scholar] [CrossRef] [PubMed]
- Segall, S. Health, Luck, and Justice; Princeton University Press: Princeton, NJ, USA, 2010. [Google Scholar]
- Liu, W.; Liu, Y.; Twum, P.; Li, S. National equity of health resource allocation in China: Data from 2009 to 2013. Int. J. Equity Health 2016, 15, 68. [Google Scholar] [CrossRef] [PubMed]
- Fisher-Owens, S.A.; Soobader, M.J.; Gansky, S.A.; Isong, I.A.; Weintraub, J.A.; Platt, L.J.; Newacheck, P.W. Geography matters: State-level variation in children’s oral health care access and oral health status. Public Health 2016, 134, 54–63. [Google Scholar] [CrossRef] [PubMed]
- Wan, G.; Zhang, Y. Explaining the Poverty Difference between Inland and Coastal China: A Regression-based Decomposition Approach. Rev. Dev. Econ. 2008, 12, 455–467. [Google Scholar] [CrossRef]
- Cao, R.G. Hospital reform in China for 30 years—Historical, achievement and challenge. Chin. Hosp. 2008, 12, 1–8. [Google Scholar]
- Liu, W.Q. Thoughts on health policy and hospital system reform after SARS. Public Adm. Law 2003, 9, 50–52. [Google Scholar]
- Lambert, P.J.; Aronson, J.R. Inequality decomposition analysis and the Gini coefficient revisited. Econ. J. 2010, 103, 1221–1227. [Google Scholar] [CrossRef]
- Rougoor, W.; Marrewijk, C.V. Demography, Growth, and Global Income Inequality. World Dev. 2015, 74, 220–232. [Google Scholar] [CrossRef]
- Clarke-Sather, A.; Qu, J.; Wang, Q.; Zeng, J.; Li, Y. Carbon inequality at the sub-national scale: A case study of provincial-level inequality in CO2 emissions in China 1997–2007. Energy Policy 2011, 39, 5420–5428. [Google Scholar] [CrossRef]
- Boyce, J.K.; Zwickl, K.; Ash, M. Measuring environmental inequality. Ecol. Econ. 2016, 124, 114–123. [Google Scholar] [CrossRef]
- He, D.; Yu, H.; Chen, Y. Equity in the distribution of CT and MRI in China: A panel analysis. Int. J. Equity Health 2013, 12, 1–15. [Google Scholar] [CrossRef] [PubMed]
- Chen, J.D.; Chen, J.T.; Miao, Y.; Song, M.L.; Fan, Y.J. Unbalanced development of inter-provincial high-grade highway in China: Decomposing the Gini coefficient. Transp. Res. Part D 2016, 48, 499–510. [Google Scholar] [CrossRef]
- Akita, T. Educational Expansion and the Role of Education in Expenditure Inequality in Indonesia Since the 1997 Financial Crisis. Soc. Indic. Res. 2017, 130, 1165–1186. [Google Scholar] [CrossRef]
- Sen, A. On Economic Inequality; Clarendon Press: Oxford, UK, 1997. [Google Scholar]
- Lerman, R.I.; Yitzhaki, S. Income Inequality Effects by Income Source: A New Approach and Applications to the United States. Rev. Econ. Stat. 1985, 67, 151–156. [Google Scholar] [CrossRef]
- Duangkamon, C.; William, G. On Calculation of the Extended Gini Coefficient. Rev. Income Wealth 2001, 47, 541–547. [Google Scholar]
- Hong, X.J. Regional Inequality, Polarization and Mobility in China. Econ. Res. J. 2010, 12, 82–96. [Google Scholar]
- Cowell, F. Measuring inequality. In Income Distribution; Atkinson, A., Bourguignon, F., Eds.; Elsevier: Amsterdam, The Netherlands, 2000. [Google Scholar]
- Lambert, P.J.; Decoster, A. The Gini coefficient reveals more. SSRN Electron. J. 2005, 63, 373–400. [Google Scholar] [CrossRef]
- Zheng, X.Y.; Song, X.M.; Chen, G.; You, Y.Z.; Ren, Q.; Liu, J.F.; Zhang, L.; Tan, L.F.; Wei, J.H.; Chen, Q.Y. Health Inequalities during 20 Years of Rapid Economic Development in China (1980–2000): A Mortality Analysis. Biomed. Environ. Sci. 2011, 24, 329–334. [Google Scholar] [PubMed]
- Javed, A.A.; Lam, P.T.I.; Chan, A.P.C. A model framework of output specifications for hospital PPP/PFI projects. Facilities 2013, 31, 610–633. [Google Scholar] [CrossRef]
- Deverteuil, G. Reconsidering the legacy of urban public facility location theory in human geography. Prog. Hum. Geogr. 2000, 24, 47–69. [Google Scholar] [CrossRef]
- Warner, M.E.; Hefetz, A. Applying Market Solutions to Public Services: An Assessment of Efficiency, Equity, and Voice. Urban Aff. Rev. 2002, 38, 70–89. [Google Scholar] [CrossRef]
- Henk, A.M.; Have, J.T. Choosing core health services in the Netherlands. Health Care Anal. 1993, 1, 43–47. [Google Scholar]
- Na, L.; Bi, L.F. The Research of fairness and efficiency of the balancing mechanism in Chinese Medical Insurance System. Sci. Manag. Res. 2009, 27, 25–29. [Google Scholar]
- Eberl, J.T.; Kinney, E.D.; Williams, M.J. Foundation for a natural right to health care. J. Med. Philos. 2011, 36, 537–557. [Google Scholar] [CrossRef] [PubMed]
- Tani, M. Hukou Changes and Subjective Well-Being in China. Soc. Indic. Res. 2017, 132, 47–61. [Google Scholar] [CrossRef]
- Lam, K.K.; Johnston, J.M. Health insurance and healthcare utilisation for Shenzhen residents: A tale of registrants and migrants? BMC Public Health 2012, 12, 868. [Google Scholar] [CrossRef] [PubMed]
- Pickett, K.E.; Wilkinson, R.G. Income inequality and health: A causal review. Soc. Sci. Med. 2015, 128, 316–326. [Google Scholar] [CrossRef] [PubMed]
- Gordonlarsen, P.; Nelson, M.C.; Page, P.; Popkin, B.M. Inequality in the built environment underlies key health disparities in physical activity and obesity. Pediatrics 2006, 117, 417–424. [Google Scholar] [CrossRef] [PubMed]
- Brulle, R.J.; Pellow, D.N. Environmental justice: Human health and environmental inequalities. Ann. Rev. Public Health 2006, 27, 103–124. [Google Scholar] [CrossRef] [PubMed]
- Grineski, S.E.; Collins, T.W.; Chakraborty, J.; McDonald, Y.J. Environmental Health Injustice: Exposure to Air Toxics and Children’s Respiratory Hospital Admissions in El Paso, Texas. Prof. Geogr. 2013, 65, 31–46. [Google Scholar] [CrossRef]
Figure 1.
The structural system of China’s hospitals.

Figure 2.
Logic relationship between social sustainability and regional equal distribution of hospitals.
Figure 2.
Logic relationship between social sustainability and regional equal distribution of hospitals.

Figure 3.
Research framework and contents.

Figure 4.
Gini Coefficient of various hospitals (2003–2014).


Table 1.
The direction and contents of Gini Coefficient and its decomposition.
| The Direction | Decomposing Dimension | Contents |
|---|---|---|
| Gini Coefficient | Gini Coefficient of each kind of hospitals | |
| CR of each kind of hospitals | The CR of each kind of hospitals to Gini Coefficient of hospitals | |
| Incremental decomposition | Dimension 1 | Structure Effect, Concentration Effect, Integrative Effect |
| Dimension 2 | The change of per capita hospitals, regional rank of per capita hospitals, shares of population | |
| Decomposition according to coastal and inland areas | Gini Coefficient and the CR of coastal areas, inland areas and between them |
Table 2.
The CR of different kinds of hospitals to Gini Coefficient of hospitals (2003–2014).
| Year | General Hospitals | TCM Hospitals | Specialized Hospitals | Others |
|---|---|---|---|---|
| 2003 | 73.78% | 8.87% | 12.46% | 4.89% |
| 2004 | 72.13% | 9.68% | 13.38% | 4.81% |
| 2005 | 71.84% | 9.44% | 13.74% | 4.98% |
| 2006 | 70.03% | 10.24% | 15.01% | 4.72% |
| 2007 | 68.14% | 10.74% | 16.29% | 4.83% |
| 2008 | 67.75% | 10.08% | 17.68% | 4.49% |
| 2009 | 67.63% | 10.96% | 17.13% | 4.28% |
| 2010 | 68.34% | 10.81% | 16.64% | 4.21% |
| 2011 | 68.86% | 10.38% | 16.63% | 4.13% |
| 2012 | 69.36% | 9.90% | 16.31% | 4.43% |
| 2013 | 70.59% | 9.37% | 15.62% | 4.42% |
| 2014 | 69.63% | 9.14% | 16.51% | 4.72% |
Table 3.
Three effects on the change of Gini Coefficient.
| Variable | Structure Effect | Concentration Effect | Comprehensive Effect |
|---|---|---|---|
| ΔG | 0.0025 | −0.0137 | −0.0051 |
| CR | −15.17% | 84.12% | 31.04% |
Table 4.
Increased per capita hospitals, regional rank change, and shares of population change to the change of Gini Coefficient.
Table 4.
Increased per capita hospitals, regional rank change, and shares of population change to the change of Gini Coefficient.
| Variable | ΔW | ΔQ | ΔP |
|---|---|---|---|
| ΔG | −0.0605 | 0.0426 | 0.0016 |
| CR | 371.17% | −261.35% | −9.82% |
Table 5.
Gini Coefficient and the corresponding CR in inland and coastal areas (2003–2014).
| Year | Coastal Areas | Inland Areas | Between Them | Residual Term | ||||
|---|---|---|---|---|---|---|---|---|
| G | CR | G | CR | G | CR | G | CR | |
| 2003 | 0.1685 | 12.50% | 0.1955 | 39.95% | 0.0268 | 14.07% | 0.0637 | 33.48% |
| 2004 | 0.1692 | 12.71% | 0.2007 | 40.18% | 0.0224 | 11.67% | 0.0681 | 35.45% |
| 2005 | 0.1579 | 12.75% | 0.1906 | 39.67% | 0.0245 | 13.45% | 0.0622 | 34.13% |
| 2006 | 0.1491 | 12.55% | 0.1913 | 40.08% | 0.0224 | 12.55% | 0.0622 | 34.82% |
| 2007 | 0.1550 | 13.04% | 0.1964 | 39.52% | 0.0191 | 10.41% | 0.0678 | 37.03% |
| 2008 | 0.1491 | 12.85% | 0.1957 | 39.82% | 0.0206 | 11.40% | 0.0648 | 35.94% |
| 2009 | 0.1315 | 11.52% | 0.2017 | 41.49% | 0.0239 | 13.44% | 0.0597 | 33.55% |
| 2010 | 0.1319 | 11.79% | 0.2039 | 40.85% | 0.0243 | 13.53% | 0.0606 | 33.82% |
| 2011 | 0.1261 | 11.73% | 0.1962 | 40.78% | 0.0254 | 14.72% | 0.0566 | 32.77% |
| 2012 | 0.1220 | 11.22% | 0.1985 | 40.89% | 0.0274 | 15.74% | 0.0560 | 32.15% |
| 2013 | 0.1221 | 11.22% | 0.1946 | 40.40% | 0.0303 | 17.46% | 0.0536 | 30.91% |
| 2014 | 0.1216 | 11.14% | 0.1939 | 40.11% | 0.0309 | 17.73% | 0.0540 | 31.02% |
© 2017 by the authors. Licensee MDPI, Basel, Switzerland. This article is an open access article distributed under the terms and conditions of the Creative Commons Attribution (CC BY) license (http://creativecommons.org/licenses/by/4.0/).
Share and Cite
MDPI and ACS Style
Ma, L.; Xie, Q.; Shi, S.; Ye, X.; Zhao, A. Regional Maldistribution of China’s Hospitals Based on Their Structural System. Sustainability 2017, 9, 1046. https://doi.org/10.3390/su9061046
AMA Style
Ma L, Xie Q, Shi S, Ye X, Zhao A. Regional Maldistribution of China’s Hospitals Based on Their Structural System. Sustainability. 2017; 9(6):1046. https://doi.org/10.3390/su9061046
Chicago/Turabian StyleMa, Lie, Qiu Xie, Shiying Shi, Xiaosu Ye, and Aifeng Zhao. 2017. "Regional Maldistribution of China’s Hospitals Based on Their Structural System" Sustainability 9, no. 6: 1046. https://doi.org/10.3390/su9061046
Note that from the first issue of 2016, this journal uses article numbers instead of page numbers. See further details here.