
Low Carbon Economy Performance Analysis with the Intertemporal Effect of Capital in China


School of Economics & Management, Beijing Institute of Petrochemical Technology, 19 Qingyuan Road, Beijing 102617, China
*
Author to whom correspondence should be addressed.
Sustainability 2017, 9(5), 853; https://doi.org/10.3390/su9050853
Submission received: 6 April 2017
/
Revised: 14 May 2017
/
Accepted: 16 May 2017
/
Published: 19 May 2017
(This article belongs to the Section Economic and Business Aspects of Sustainability)
Abstract
:The “New Normal” of Chinese economy represents the importance of economic performance. To analyze the provincial performance of the low-carbon economy in China, this paper constructed a three-stage dynamic Malmquist model considering the evolutionary promotion of productivity and technical progress. This paper incorporates the lag effect of capital accumulation into the performance evaluation to ensure transitivity and continuity. Furthermore, the inefficiency of the low-carbon economy arises from the disadvantages of resources endowments; therefore, it is necessary to eliminate these to evaluate managerial performance. This paper not only evaluates the provincial performance of the low-carbon economy but also suggests the sources and impetus of regional low-carbon economy development to find feasible transition paths. The empirical results reveal that the performance of the low-carbon economy presents a gradient distribution with obvious distinctions among the eastern, central, and western regions. Tianjin and Hebei should emphasize the optimal allocation of their own resources. Jiangxi and Hunan, by contrast, should focus on the perfection of the resources endowments.
1. Introduction
The economic development model in China is stepping into the “New Normal” economy. The characteristics of “New Normal” are economic slowdown with increasing efficiency, structural optimization with upgrading, and efficient resource allocation. These characteristics represent the importance of economic performance. However, during the period 1997–2014, the economic growth in China was 9.5% with an 8.8% increase in carbon emissions. These data indicate that the economic model is of high-energy expenditure with a dual economy background. Meanwhile, the haze appears in most Chinese provinces. The PM2.5 indices of 17 provinces exceed the ceiling. There are 71 seriously polluted cities, and the PM2.5 index of Shijiazhuang city exceeds 1000 ug/m3. Although the haze is almost caused by the emission of sulphur dioxide, desulfurization is only a partial solution compared with low-carbon emission [1]. The main reason is the increasing carbon emission from coal, automobile and industry with the rapid development of economy. Therefore, energy expenditure and environmental pollution have become problematic for sustainable economic development. The Kyoto Protocol in 1997, Copenhagen Climate Council in 2009, Cancun Conference in 2010, Durban Climate Change Conference in 2011, and the United Nations Framework Convention on Climate Change in Paris in 2015 all reflect that developing a low-carbon economy has become a world-wide consensus. Based on the database of World Bank, since 2006, China has been responsible for the greatest proportion of the world’s carbon emissions (25.5% in 2011). Meanwhile, the carbon emission in China is 5.55 times greater than that of America.
The Chinese government has announced a plan for a green economy, which it has defined as a policy task focused on developing a low-carbon economy. The only solution is increasing the carbon production efficiency [2]. However, each region’s low-carbon economic performance is influenced by its resource endowments and the stage of its economic development. During the planned market economy transformation, the Chinese economy was promoted with a regional cascade structure. Subsequently, openness in China was bolstered using the same structure. Consequently, support for the policy and complementary conditions for the development of a low-carbon economy varies between areas, with extreme variations among the provinces. For example, based on the calculation of the International Panel on Climate Change (IPCC), in 2014, the carbon emissions of Hebei province were 5531.9 billion tons, which is a fifth of the carbon emission in China, whereas those of Hainan province were less than 0.4 billion tons. Thus, a lack of conformity among the Chinese provinces regarding low-carbon economy development is evident.
However, the definitions of low-carbon economy transformation are diversity. Fewer studies refer to the transformation performance evaluation and calculation. Previous studies almost entirely focus on energy consumption and environmental pollution, ignoring the dynamic interaction among the energy, environment and economy. This paper not only calculates the performance of regional low-carbon economies, but suggests the sources and impetus underlying their development to find feasible transition paths. Consequently, this paper presents two main theoretical contributions. First, by incorporating the intertemporal effect into the Malmquist model, this paper explains the sustainability of provincial low-carbon economy performance considering the influence effect lags of physical capital. Second, this paper investigates the managerial performance of the low-carbon economy to eliminate the regional resource endowments influences and their own economic stage. Therefore, on the basis of importance, this paper has selected the following five factors: energy, openness, physical capital, human capital, and carbon emission. This study also has practical implications; the findings may provide decision makers with an increased understanding of the optimal mechanisms and managerial technical level for improving low-carbon economies.
2. Literature Review
Low-carbon economy growth is related to sustainable economy growth [3] and green economy growth [4]. A low-carbon economy is an economy based on low carbon power sources that therefore has a minimal output of greenhouse gas emissions into the biosphere, specifically referring to the greenhouse gas carbon dioxide. The Government Work Report of China in 2015 stressed the importance of total factor productivity (TFP) during the evaluation of national economy performance. Before the East Asian financial crisis of 1997, Krugman [5] has proposed that East Asia is no miracle, indicating that China’s economic growth depended on the accumulation of resources instead of technical progress. However, this driving pattern is unsustainable. Economic growth depends on the progress of TFP [6]; consequently, many studies have focused on researching it. Zheng [7] suggested that the judgment of economic development not only depends on the growth rate, but also on the growth quality for which core content marks the progress of TFP. Li et al. [8] indicated that the low-carbon constraint condition is important to test the relationship between technical progress and TFP. Färe et al. [9] developed a new way to evaluate TFP by combining the nonparametric technique of data envelopment analysis (DEA, [10]) with a Malmquist model. DEA is a nonparametric method in operations research and economics for the estimation of production frontiers. It is used to empirically measure productive efficiency of decision-making units (DMUs). Moreover, the low-carbon economy performance evaluation by TFP has rapidly expanded to include carbon emission calculations [11,12,13], carbon emission influence analysis [14,15,16], industrial carbon emission [17,18,19,20], and carbon emission reduction [21,22,23,24]. Meanwhile, regional diversity plays a key role in the processing of low-carbon emission transformation. The main conclusions of previous studies on regional low-carbon emission performance are classified into two. One is the obvious regional diversity such as the low performance provinces located in western region [25]. The other one is that the improvement of energy efficiency and environment governance can promote the regional economic growth [26]. However, an agreed-upon universal definition of low-carbon economic transformation does not exist [27]. Fewer works in the literature evaluate the process of the transformation [28].
The incorporation of micro and macro analysis significant tests the interaction of variables and the long-term operating pattern [3]. Land, labor and capital are the three principal factors of production. Specifically, the industrial restructuring is necessary for the low-carbon economy promotion of developing counties [29]. Openness, Research and Development (R&D) and their interaction play a positive role in low-carbon economy development [30]. Energy [31] and environment [32] endowments are the important factors for the low-carbon economy. Moreover, market failure causes environmental pollution. Coase Theorem indicates the government should do something with respect to the environmental market. Therefore, the optimal path of low-carbon economy transformation should consider the resource, economy, ecology, technology, and policy [33].
The Solow Growth Model [34] suggested that the accumulation of capital is the primary engine of economic growth. Macro control behavior is gradually effective for economic growth, albeit with a lag, which cannot be ignored in the research of low-carbon economy growth [35]. However, most studies of low-carbon economy growth test influential factors, such as the correlation among energy consumption, carbon emissions, and Gross Domestic Product (GDP) [36,37]; the relationship between energy efficiency and carbon emission [4,38]; and the factors that influence carbon emission efficiency [26,39]. These studies only focus on the single period effect of resources, which defines the single period product feasible set as a reference. In this way, the results do not satisfy the transitivity or the continuity [40]. Nevertheless, in practice, capital accumulation, as one of key factors in the calculation process of TFP, is a continuous process. The changes in productivity and technical progress are always promoted in an evolutionary way. Therefore, it is necessary to consider the intertemporal effect of resources during the evaluation of low-carbon economy performance.
Multiple economic entities have complained that the primary causes of low performance are uncontrollable overarching factors such as financial crises [41]. The traditional evaluation of TFP is affected by these uncontrollable influences [42], meaning that the evaluation by the original model is overestimated and distorted. For example, the disadvantages of the external conditions or random errors lead to the inefficiency of the low-carbon economy. It is therefore necessary to eliminate the external conditions and random errors to evaluate the managerial performance. Many studies focus on the multistage method proposed by Fried et al. [43]. Simar and Wilson [44] constructed a data-generating process to account for the exogenous influence by using a bootstrap procedure. Recently, the main method to separate uncontrollable environmental factors has been to use stochastic frontier analysis (SFA) to regress. Based on the method of SFA, Gimenez et al. [45] utilized a multistage DEA to analyze the educational system performance in 31 countries considering the effects of students’ economic and social backgrounds. Banker and Natarajan [46] explored a two-stage DEA to evaluate the influence of contextual variables on productivity. Shang et al. [47] used a three-stage DEA based on SFA to estimate the service outsourcing of a hotel delaminated into the effects of exogenous factors. Tsutsui and Goto [48] postulated that SFA cannot explain the non-negativity of slacks and can only suppose a non-negative distribution, and adopted a Tobit model with dummy variables to solve this problem. In contrast to the previous studies, this paper developed a three-stage methodology combining a Tobit model with time shift influence with a dynamic Malmquist model to eliminate the resource endowment influences and thus obtain the managerial performance. Moreover, previous literature only focused on the managed performances which eliminate the uncontrollable influences. The incorporation of resource endowment and managed performance is the new standpoint. The transformation of low-carbon economy is a complex system of economy, environment, and society.
3. Basics of Three-Stage Dynamic Malmquist Model
3.1. First Stage: Dynamic Malmquist Calculation
To evaluate the original performance of the provincial low-carbon economy, this paper uses the dynamic Malmquist index [49] to calculate the TFP considering the intertemporal effect [50] of physical capital. The evaluation by Malmquist proposed a best-practice frontier and decomposed the performance into different efficiencies that represent the technology efficiency changes (TEC) and the technical changes (TC) [51]. TEC indicates hard power such as allocation efficiency and scale efficiency of factors. TC refers to soft power such as the knowledge progress of the DMU. The technical efficiency equals 1 if the DMU produces maximal output with the provided isocost lines. The dynamic Malmquist model develops a dynamic best-practice frontier that is more advanced than the original by considering the intertemporal effect. Therefore, this paper defined the dynamic factors and constructed a dynamic Malmquist model to emphasize the intertemporal effect of physical capital.
First, x, yd, yu, and z are assumed as the vectors of input, desirable output, undesirable output, and dynamic factors, respectively, and t as the period. For the efficiency measures in the presence of undesirable output in our model, a conventional and traditional way to handle this problem is to shift undesirable outputs to inputs and to apply traditional DEA models to the data set [52]. The product feasible set of DMUs is as follows:
Thus, the efficiency of DMUs at period t can be expressed as the following distance function:
In Equation (2), sup represents the lowest upper bound, and the distance function Dt is the efficiency of DMUs at period t with respect to the efficient frontier that considers the intertemporal effect. Thus, equals the efficiency of DMU (x, zt−1, yd, yu, zt), compared with that of DMU (X, Zt−1, Yd, Yu, Zt), which is on the best-practice frontier. If (xt, zt−1, ydt, yut, zt) is on the isoquant, Dt equals 1.
Similarly, the efficiency of DMUs at period t + 1 can be expressed as follows:
Practically, the distance function Dt+1 is the efficiency of DMUs at period t + 1, with respect to the efficient frontier that considers the intertemporal effect.
To identify the soft power, this paper assumes that the factors of a DMU at period t are effective at period t + 1. Therefore, this paper measures the factors at period t by comparing them with the other DMU factors at period t + 1. This distance function is expressed as follows:
Similarly, this paper assumes that the factors of a DMU at period t + 1 are effective at period t. Therefore, this paper measures the factors at period t + 1 by comparing them with the other DMU factors at period t. This distance function can be expressed as follows:
With t as the base period, the dynamic TFP index that represents the performance is defined as follows:
In Equation (6), ① is the dynamic technical efficiency change (DTEC) index, which represents the catching-up effect with respect to the best-practice frontier elicited by changes in hard power. The changes include the dynamic pure technical efficiency change (DPTC), representing the allocation efficiency, and the dynamic scale efficiency change (DSEC) representing scale effect. Furthermore, ② is the dynamic technology change (DTC) index, which indicates the frontier shift effect with respect to the best practice frontier elicited by changes in the soft power. The geometric mean of the adjacent two periods prevents calculation errors caused by the selection of the base period. Moreover, using an undesirable DEA output model, this paper solved the aforementioned functions using a two-step method. Indices greater than 1 suggest progress, those less than 1 suggest regressions, and those equaling 1 indicate stable productivity.
In conclusion, the dynamic performance is a product of the hard power denoted as DTEC and the soft power denoted as DTC. Subsequently, DTEC is decomposed into the allocation efficiency as DPTC and the scale effect as DSEC.
3.2. Second Stage: Tobit Model Based on Panel Data
In the first stage, this paper obtained the slack variables of each factor from the calculation of indices. However, these are influenced by uncontrollable factors, internal managerial efficiency, and random errors. The purpose of the second stage is to eliminate these resource endowment influences to obtain the managerial performance. For this purpose, this paper used an extended Tobit model incorporating SFA and considering time shift, defined as the xxTobit model. This new model composes three factors as follows:
where the independent variables Sj are slacks (j = 1, 2, …, n), the dependent variables are decomposed into three parts in Equation (7), which is similar to SFA. In the first part, fit including zi are indicated as uncontrollable variables (i = 1, 2, …, q) and βi is denoted as the parameter vectors (i = 1, 2, …, q). The second part Di refers to the dummy part of the DMUs with the parameter vector δi and a dummy variable dj. The third part is random errors. The latter two parts compose the error ε, which is independent and identically distributed. Di~|N(0,σ2u)| is a one-side error measuring managerial efficiency and vi~N(0,σ2v) is a two-side error representing a traditional statistical noise error.
Using Stata software, we calculate the regression results. Referring to Jondrow et al. [53], we continue to measure uij and vij as Equation (8):
Furthermore, vij can be obtained as follows:
3.3. Third Stage: Adjustment and Managerial Performance Re-Calculation
To eliminate the resource endowment influence, this paper adjusted the input factors of the first stage referring to Tsutsui and Goto [48] by using Equation (10):
Similarly, this paper readjusted the output factors and dynamic factors as follows:
After using the xxTobit model considering time shift and the SFA model to adjust the original data, this paper re-calculated the new data. Thus, this paper evaluated the managerial performance by eliminating uncontrollable influence and random error from the initial result of the dynamic Malmquist calculation.
4. Data
To identify distinctions in the managerial performance of the low-carbon economy among provinces, we gathered data from 30 provinces in China, excluding Tibet. The study period is 1997–2014 because Chongqing became a municipality in 1996. Based on economic growth theory, previous studies have indicated that the performance evaluation focus on physical capital stock, human capital stock, and output value [54,55,56]. Warr and Ayres [57] implicated energy and environmental policy that differ significantly from the traditional growth theory. In addition, the hysteresis of physical capital stock exists in economic growth and technical progress [58]. Furthermore, Hou [59] proved the objectivity of physical capital stock hysteresis and demonstrated that GDP growth depends on the previous year’s fixed capital investment. In other words, the sustainability of economic performance is not only represented by the single period efficiency of factors, but also reflected in the intertemporal effect of physical capital stock.
With the intertemporal effect of physical capital, physical capital stock is defined as a dynamic factor in addition to the input and output factors. Against the background of the world’s low-carbon economy, the performance is directly related to the openness. An improvement to consumption-based carbon accounting that takes technology differences in export sectors into account and thereby tends to more correctly reflect how national policy changes affect total global emissions [60]. These consumption-based accounts are strongly influenced by the trade in metal goods and fuels, facilitating industrialization elsewhere [61]. Moreover, for eliminating the influence of population differences among provinces, this paper defined the per-capita physical capital stock as a dynamic factor; the per-capita GDP as a desirable output; carbon emission as an undesirable output; and the per-capita human capital stock, per-capita energy consumption, and export rate as input factors. Subsequently, all the data are from official statistics, such as the China Statistical Yearbook, China City Statistical Yearbook, and China Energy Statistical Yearbook.
The key variables in the calculation are human capital stock and physical capital stock. Educated and skilled labor is an incentive in the global market. According the human capital stock calculation by Zhao and Zhang [62], we denoted illiteracy as 3 years of schooling, primary education as 6 years of schooling, junior high school education as 9 years of schooling, high school education as 12 years of schooling, college education and above as 16 years of schooling. Using this information, the Equation (14) is defined as follows:
The physical capital stock was calculated by the perpetual inventory method [63] as Equation (15). K means the physical capital stock. i means province and t means year. I is fixed investment, D is depreciation, and P is price deflators. The base period is 1952 because of the data availability, and the depreciation rate is 10.96% [63].
Defining the export rate as the openness benchmark, the export rate is calculated by the ratio of total export to local GDP. Moreover, the GDP is in real terms with the base year of 1997. Energy consumption denotes the cost and availability of substitute energy. Based on the method of International Panel on Climate Change (IPCC), the carbon emission is calculated by Equation (16)
In Equation (16), CO2 is the carbon emission. i means kinds of fossil fuels such as coal, natural gas, coke, fuel oil, petrol, kerosene, and diesel oil. E is primary fossil fuel consumption. NCV is average net calorific value. CEF is the carbon emission index by IPCC.
In Table 1, the descriptive statistical results of the samples were expressed as the average, standard deviation, minimum, and maximum. This paper identified significant differences in GDP, although the input factors exhibited minimal differences, which indicates that the GDP performance exhibits significant differences among provinces during stable investment. Therefore, analyzing factor allocation and suitability is necessary to examine the bottlenecks in the performance improvement of low-carbon economy.
To eliminating the resource endowment influences, the uncontrollable variables are selected that influence the performance of low-carbon economy. The 14 uncontrollable variables were selected, which are classified by 12 resource endowment variables and 2 regional dummy variables. Hereinto, based on the resources endowment theory, these 12 variables came from five perspectives: macro economy, human resources, openness, energy consumption, and R&D shown in Table 2. For regional diversity, this paper defined 2 dummy variables, D1 and D2. D1 = 1 and D2 = 0, means that the province belongs to the eastern region, D1 = 0, D2 = 1 indicates the central region, and D1 = 0, D2 = 0 indicates the western region.
Fiscal expenditure refers to the sum of government expenses, including spending on goods and services, investment and transfer payments like social security and unemployment benefits. The variable unit is billion. Consumer price index (CPI) measures changes in the price level of market basket of consumer goods and services purchased by households. Producer price index (PPI) is a price index that measures the average changes in prices received by domestic producers for their output. These indices are calculated based on the previous year. Application rate of fixed assets is the ratio of newly increased fixed assets and completed investment. Railway mileage is the length of the railway network in kilometers, and highway mileage is the length of the highway network in kilometers. Average wage is a measure for the financial well-being of provincial inhabitants. The unit is yuan per capita. Freight turnover is the finished freight volume by all vehicles, and its unit is billion ton kilometers. Passenger turnover is the finished passenger volume by all vehicles, and its unit is billion person kilometers. Electric rate is the ratio of electric production and consumption. R&D expenditure is the input of research and technical development, and R&D staff is who work for it. Their units are ten thousand yuan and person.
As shown in the Table 2, the first line includes the evaluation variable, such as human capital stock, energy consumption. The first column includes the resource endowments. The stars mean the resource endowments have an impact on the evaluation variable. For example, human capital stock is influenced by fiscal expenditure, CPI, wage, and R&D staff.
5. Empirical Results
5.1. Comparsion of Low-Carbon Economy Performance with Uncontrollable Influence
Comparisons between the original low-carbon economy performance and the managerial performance discover the resource endowment influence. First, the low-carbon economy performance is analyzed based on time-series (Figure 1), and the results indicate a fluctuant rising trend, especially at the stage 2006–2014 (TFP2006 = 1, TFP2010 = 1.0407, TFP2014 = 1.1996). Compared with those of original TFP, the fluctuation period of managerial TFP gradually becomes shorter, indicating that the managerial performance of the low-carbon economy is comparably stable. The accelerated speed of fluctuation is because of the resource endowment influence. The obvious characteristics are at the start and terminal points. At the start point of 1998, the original performance is strong, meaning it benefitted from the resource endowment influences. At the terminal point of 2014, the managerial performance is the highest (TFPM = 1.1996) in the entire study period, yet the original performance at its lowest (TFPO = 0.9793). This means the managerial performance improved by 19.96% in 2014, comparatively, that of original performance regressed by 2.07%. Considering the “new normal” macroeconomic background, the resource endowment influence restrained the increase of the low-carbon economy performance. This means the managerial performance of the low-carbon economy in China gradually increased with supply-side reform. This because, as President Xi Jinping delivered at the Central Economic Working Conference held in Beijing from 18 to 21 December 2015, China’s supply-side structural reform holds the key to its structural adjustment in the short term and will solidify the bedrock for the sustainable development of its economy in the long run, as overseas experts have observed.
The overall managerial TFP of the low-carbon economy in China in the study period is 1.051, and that of the original is 1.048, indicating that the managerial performance is higher. These indices also represent the productivity across all provinces over the entire period improved on average by 5.1%. Here, the original improved by 4.8%. The resource endowment constrains the development of the low-carbon economy. Based on time-series rules, the entire period is divided into two stages, with 2007 as the boundary. In the first stage, from 1997 to 2007, the managerial performance exhibits three fluctuant periods. Subsequently, the performance curve becomes relatively flat with an extreme increase in 2014. Moreover, the low-carbon economy performance in 2014 is the best in the entire period, which proves the efficiency of the supply-side reform in China.
As shown in Figure 2, the managerial TFP is decomposed of DTEC and DTC. DTEC means the hard power of managerial performance improvement, such as the allocation of evaluation variables and scale efficiency. DTC is denoted as the soft power, is critical to performance. However, the effects of the indices are significantly different. In the earlier years, the DTEC contributes substantially to the performance, whereas after 2007, the DTC becomes the major factor for improvement in the performance. Therefore, the dominant determinant of managerial performance is quality efficiency improvement with the promotion of soft power. However, DTEC values constrain the performance, implying that the allocation efficiency and scale efficiency of resources become a constraint to performance improvement. With the policy support of the Four Trillion Yuan Stimulus Plan in 2009, decision makers reinforced the government investment to develop the economy; however, they may have ignored the control of resource efficiency.
The provincial time-series result from 1997 to 2014 highlights the differences in the managerial performance of the low-carbon economy in China. As shown in Figure 3, the provincial features of the managerial performance are obvious when compared with the original performance. The differences of managerial performances in eastern provinces are smallest, and those of the western provinces are largest. This paper selected the top three advantaged provinces (Jiangxi, Chongqing, and Hunan) and the bottom three disadvantaged provinces (Tianjin, Shanxi, and Hebei) according to the changes between the managerial TFP and original one. In the advantaged provinces, the low-carbon economy is greater than their presentation. However, in the disadvantaged provinces, the low-carbon economy benefits from resource endowment influences.
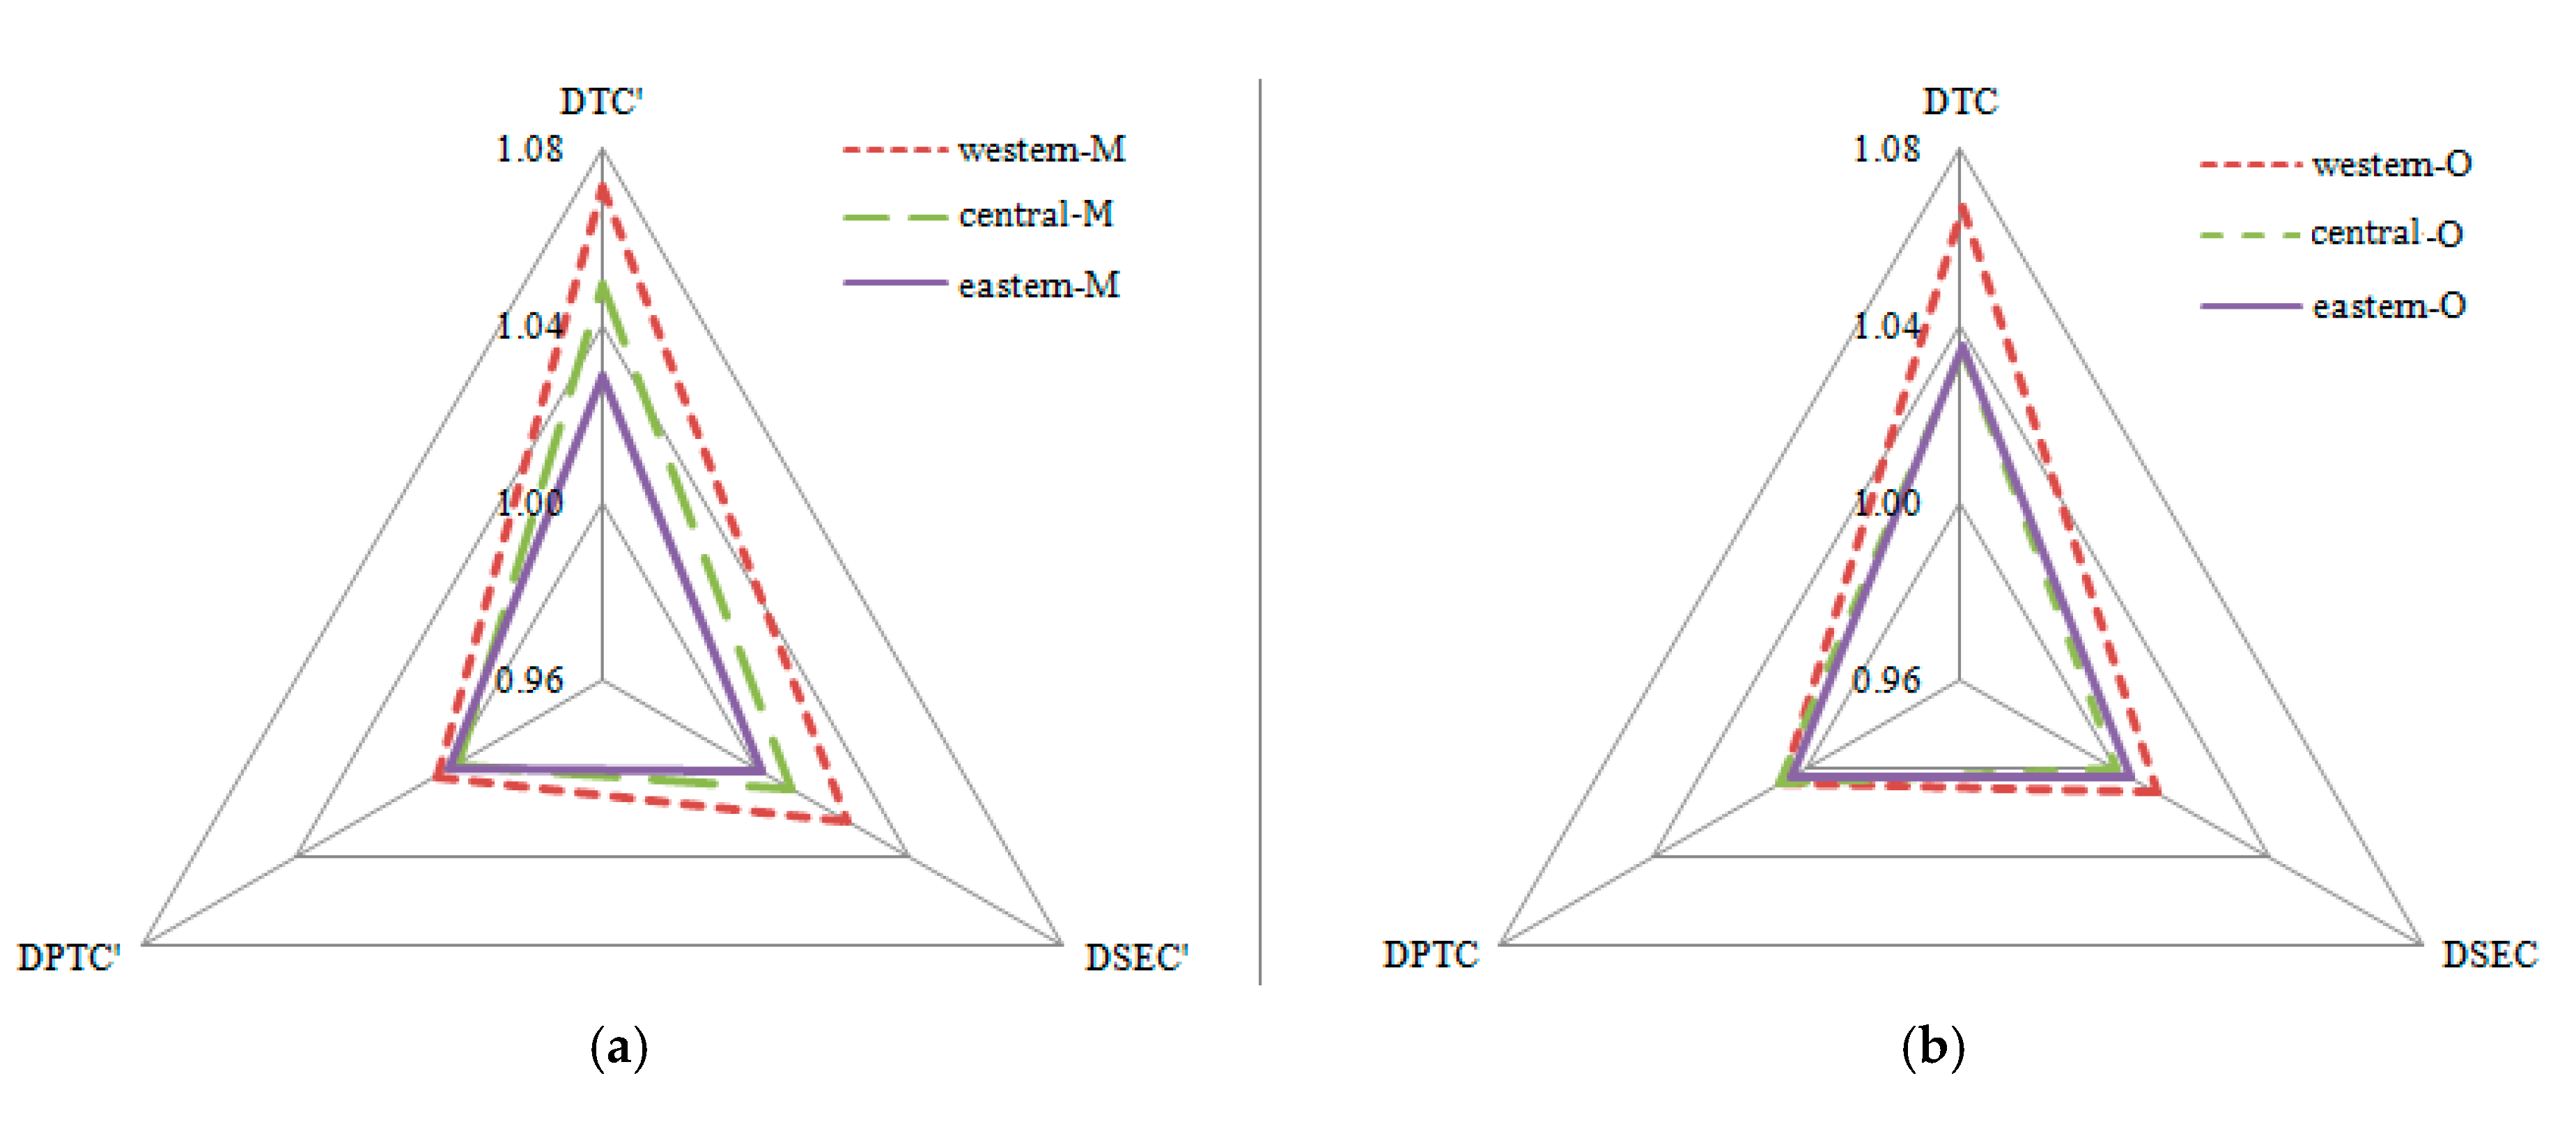
Figure 4 presents the results of the regional performances and the coordinates of the three decomposed efficiency indices. Compared with the original performances, the regional characteristics of managerial performances are significant. The DPTCs among regions are almost undifferentiated, indicating that the allocation efficiency of the low-carbon economy in China is stable. From a managerial performance perspective, the eastern region ranks in the innermost, indicating no evident solutions for performance improvement. The western region is ranked the highest among all the groups, because the absolute DTC advantage indicates a strong soft power. Moreover, the DSEC advantage also implies a stronger scale effect. Eliminating the resource endowment influence, the advantage of the central region is significant compared with that of eastern region, especially with regard to soft power. However, the distance between the central western regions is obvious.
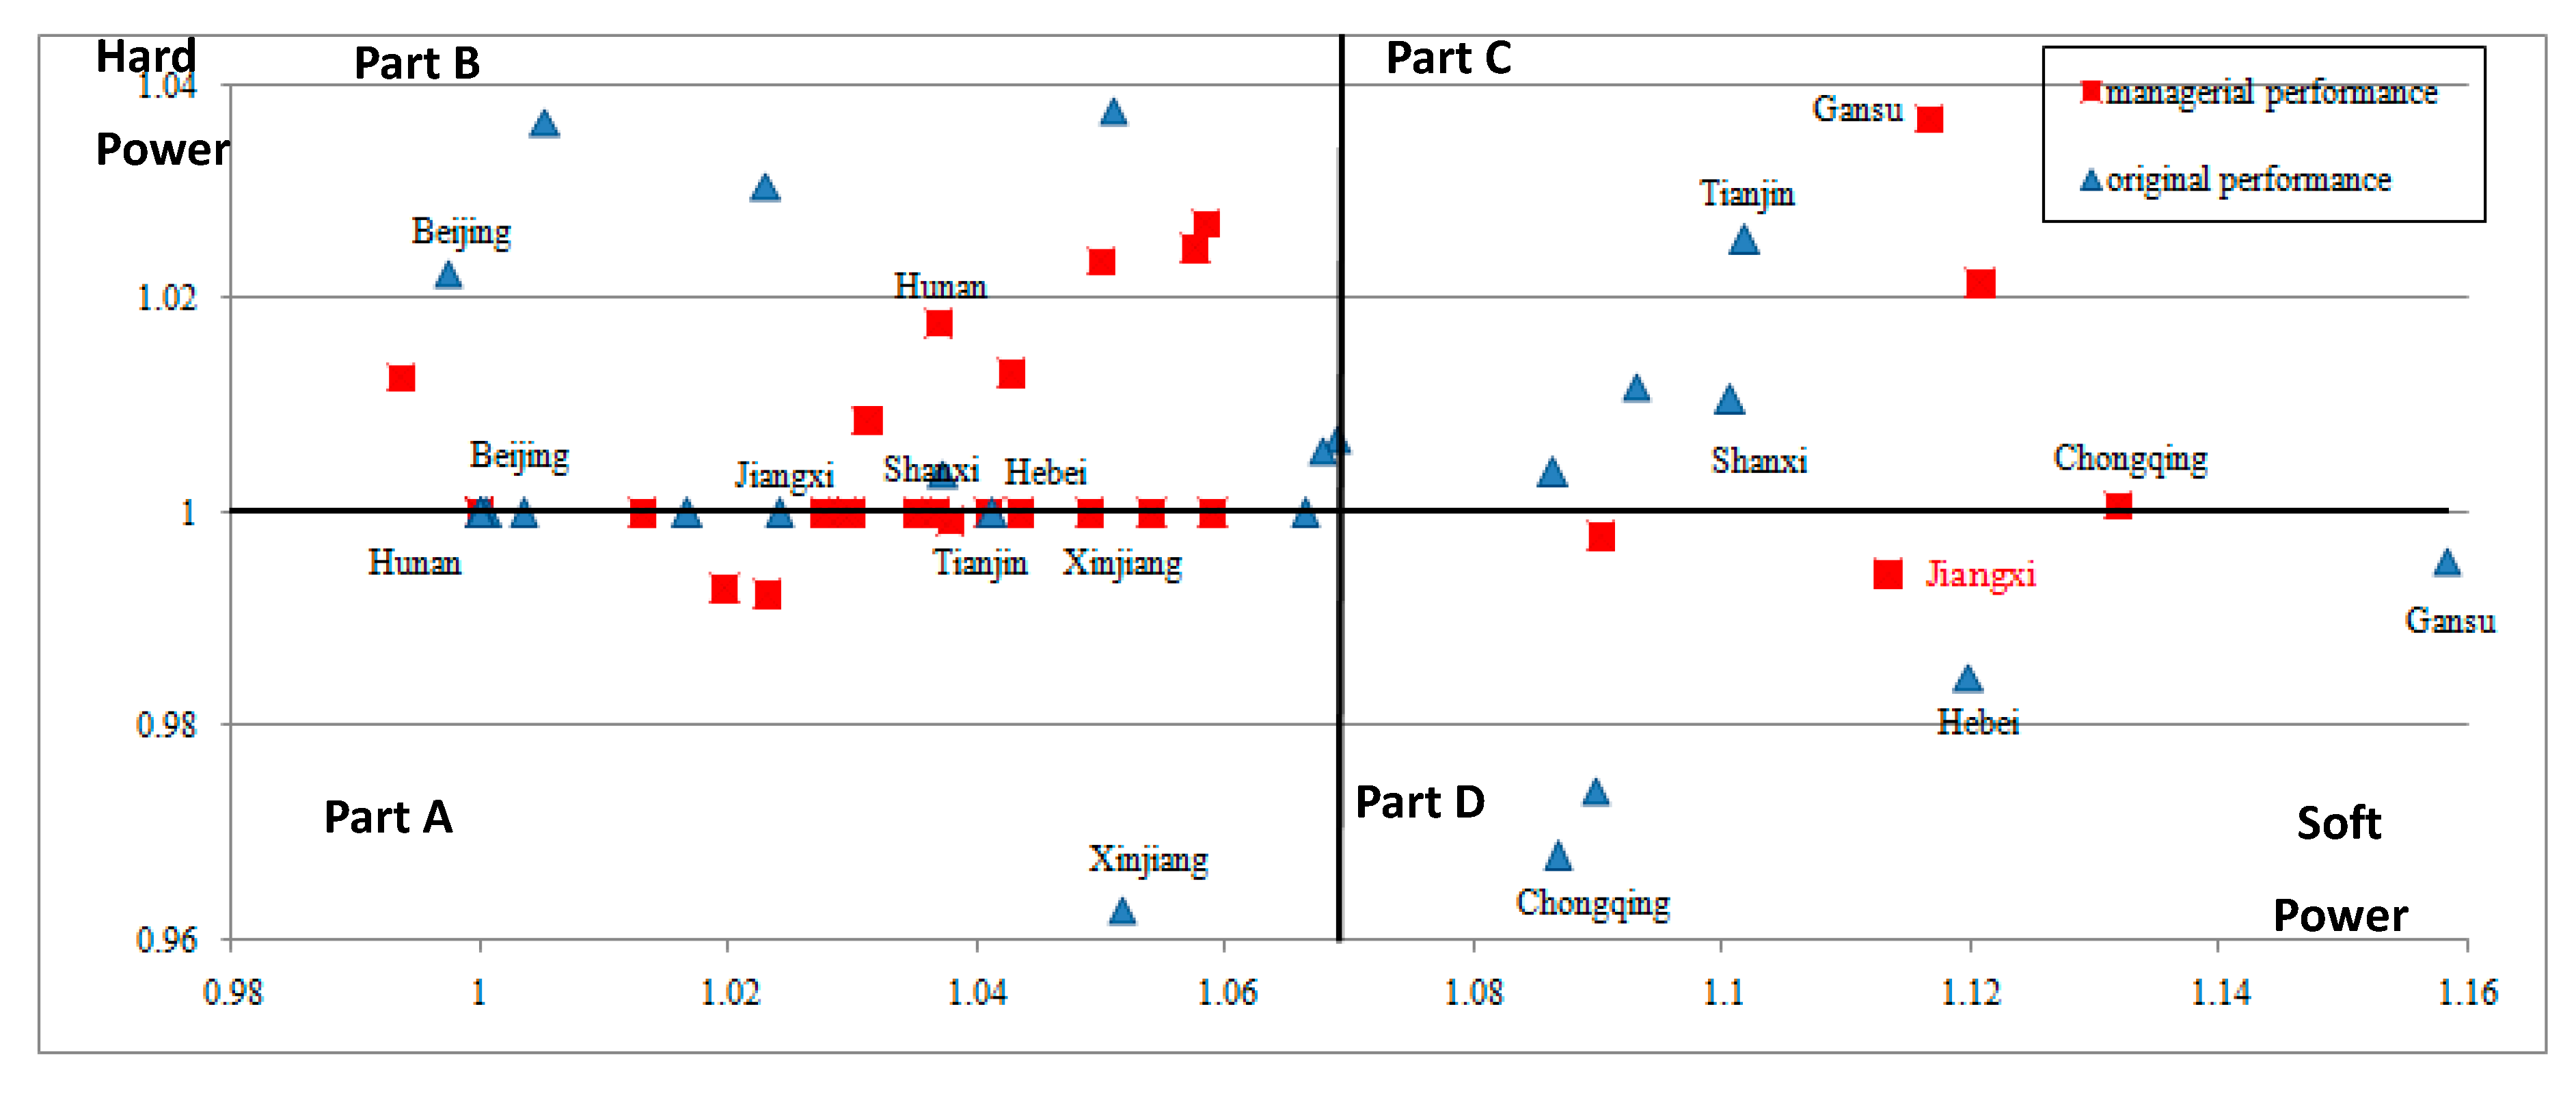
Applying the Malmquist decomposition method, the hard power (DTEC) is used as the vertical axis, and the soft power (DTC) is used as the horizontal axis to compare the provincial original performances versus managerial provincial performances (Figure 5). Based on the central lines of vertical axis and horizontal axis, the area is classified into four parts to express average conception. Part A is defined as lower hard power and lower soft power, Part B as higher hard power and lower soft power, Part C as higher hard power and higher soft power, and Part D as lower hard power and higher soft power. Square icons mean managerial performance, while triangle icons represent original performance considering resource endowment influences. First, the differences among provincial performance are lower when the recourse endowment influence is removed. This indicates that the extreme cases of provincial low-carbon economy performance (e.g., Beijing) are because of the recourse endowment influences. Second, most of the provinces (77.4%) are in Part B, indicating that the resource endowment influences restrain the hard power of some provincial performances (such as Xinjiang). Third, only five provinces are in Parts C and D, indicating that their real soft power is weaker than their presentation and suggesting that the original performance evaluation did not account for free riding, and misrepresented the status of some provinces (e.g., Gansu) as coordination.
From the provincial perspective, the top three advantaged provinces are constrained by resource endowment influence. The managerial performance in Jiangxi increases when eliminating the constraint of resource endowment influence for soft power, whereas the managerial performances in Chongqing and Hunan increase by eliminating the constraints on hard power. In the original results, Tianjin, Shanxi, and Hebei have the advantage of soft power in low-carbon economy performance. However, this advantage arises from their superior resource endowments. The three provinces have similar managerial performance results of stable hard power and lower soft power.
5.2. Weighted Analysis of Resource Factors for the Low-Carbon Economy
The preceding analysis reveals that the low-carbon economy performance in China is affected by the hard power and soft power of input resources. The following weighted analysis focuses on the contribution of each resource factor. As in the previous analysis, the time-series results from 1997 to 2014 are divided into two stages on the basis of the trends in managerial performance. In the first stage (1997–2007), the performance exhibits three fluctuations. In the second stage (2008–2014), the performance relatively flattens with an extreme increase in 2014, making the performance of 2014 the best one during our study period. Therefore, this paper selected data from the three periods of 1997–2007, 2008–2014, and 2014 to compare the different contributions of factors. The evaluation factors are human capital stock, energy consumption, the export rate, physical capital stock, and carbon emission. Their contributions differ in performance evaluation.
The greatest contribution comes from the physical capital (51.8%). The contribution rate increases from the first stage (49.5%) to the second stage (54.1%), reaching 64.6% at the end of the study. It is necessary to consider the intertemporal effect of the physical capital to consider its sustainable profit. The contribution of carbon emission comes second (13.2%). From the time-series perspective, the decreasing trend of carbon emission proves the performance improvement of the low-carbon economy. The declining trend of the export rate expresses the inefficiency of the openness in China. Although many openness policies support issues such as Free Trade Zone, efficiency is more important in practice than formalism. This also proves the urgency to implement “One Belt, One Road” which is a Chinese national strategies focusing on connectivity and cooperation among countries primarily between China and the rest of Eurasia.
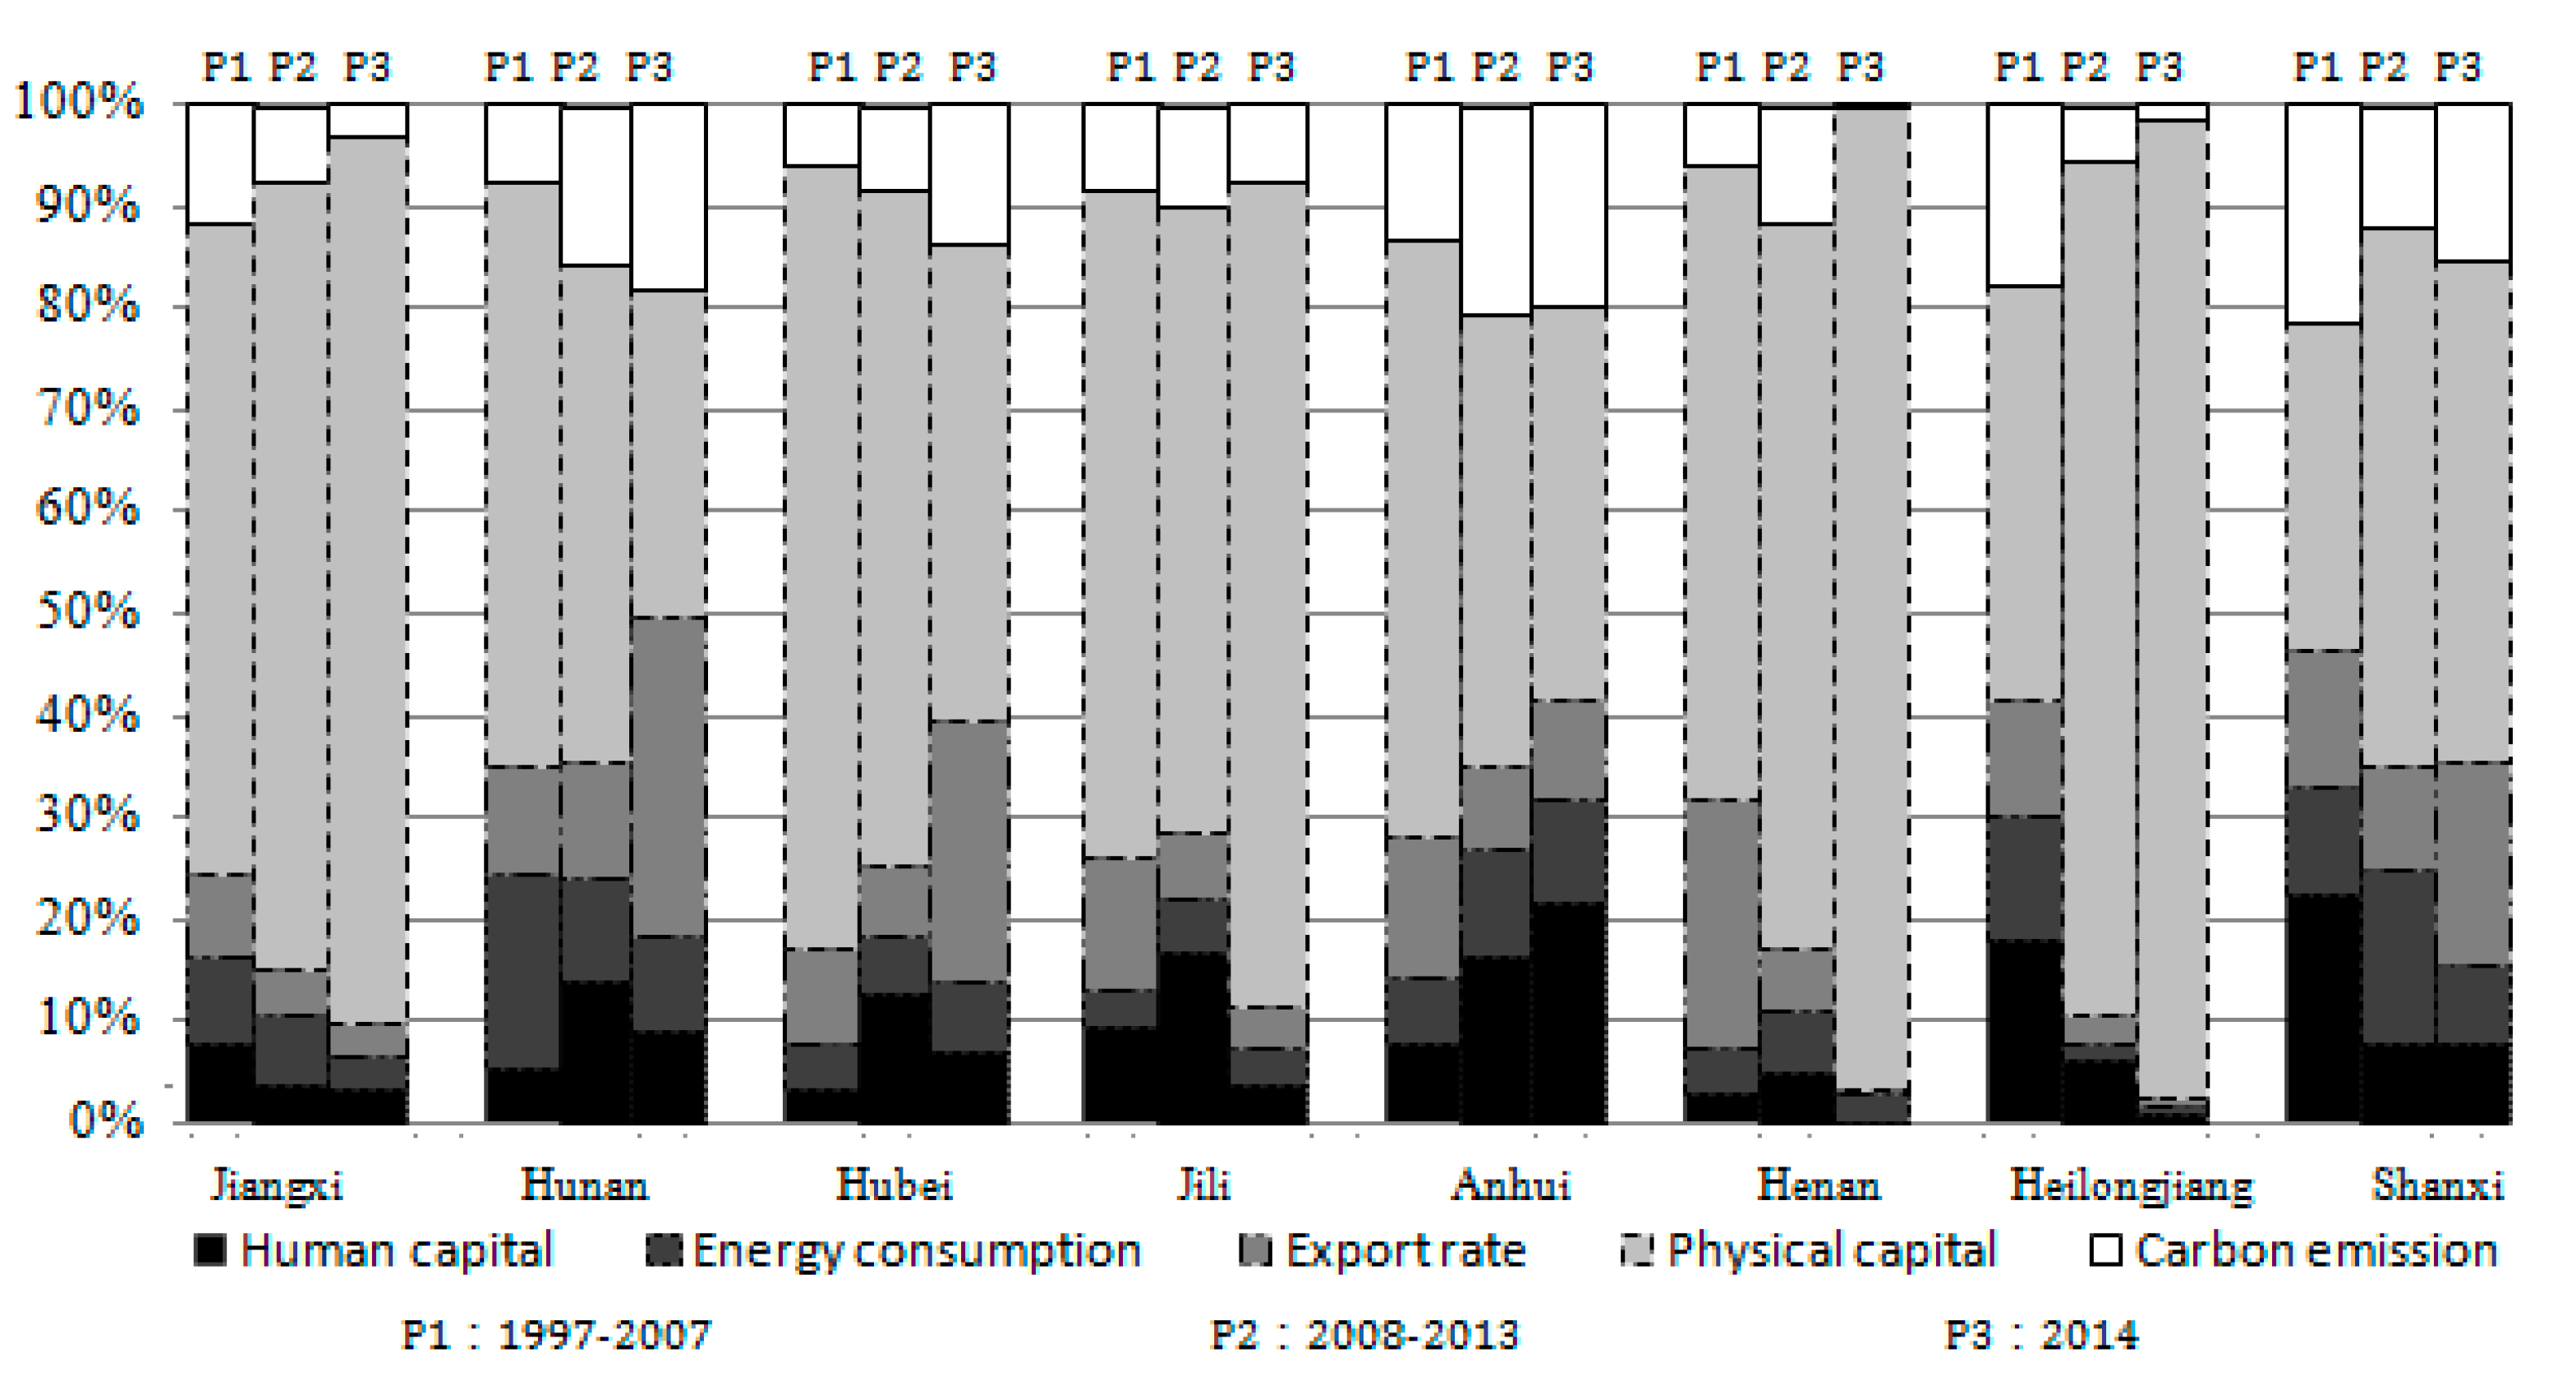
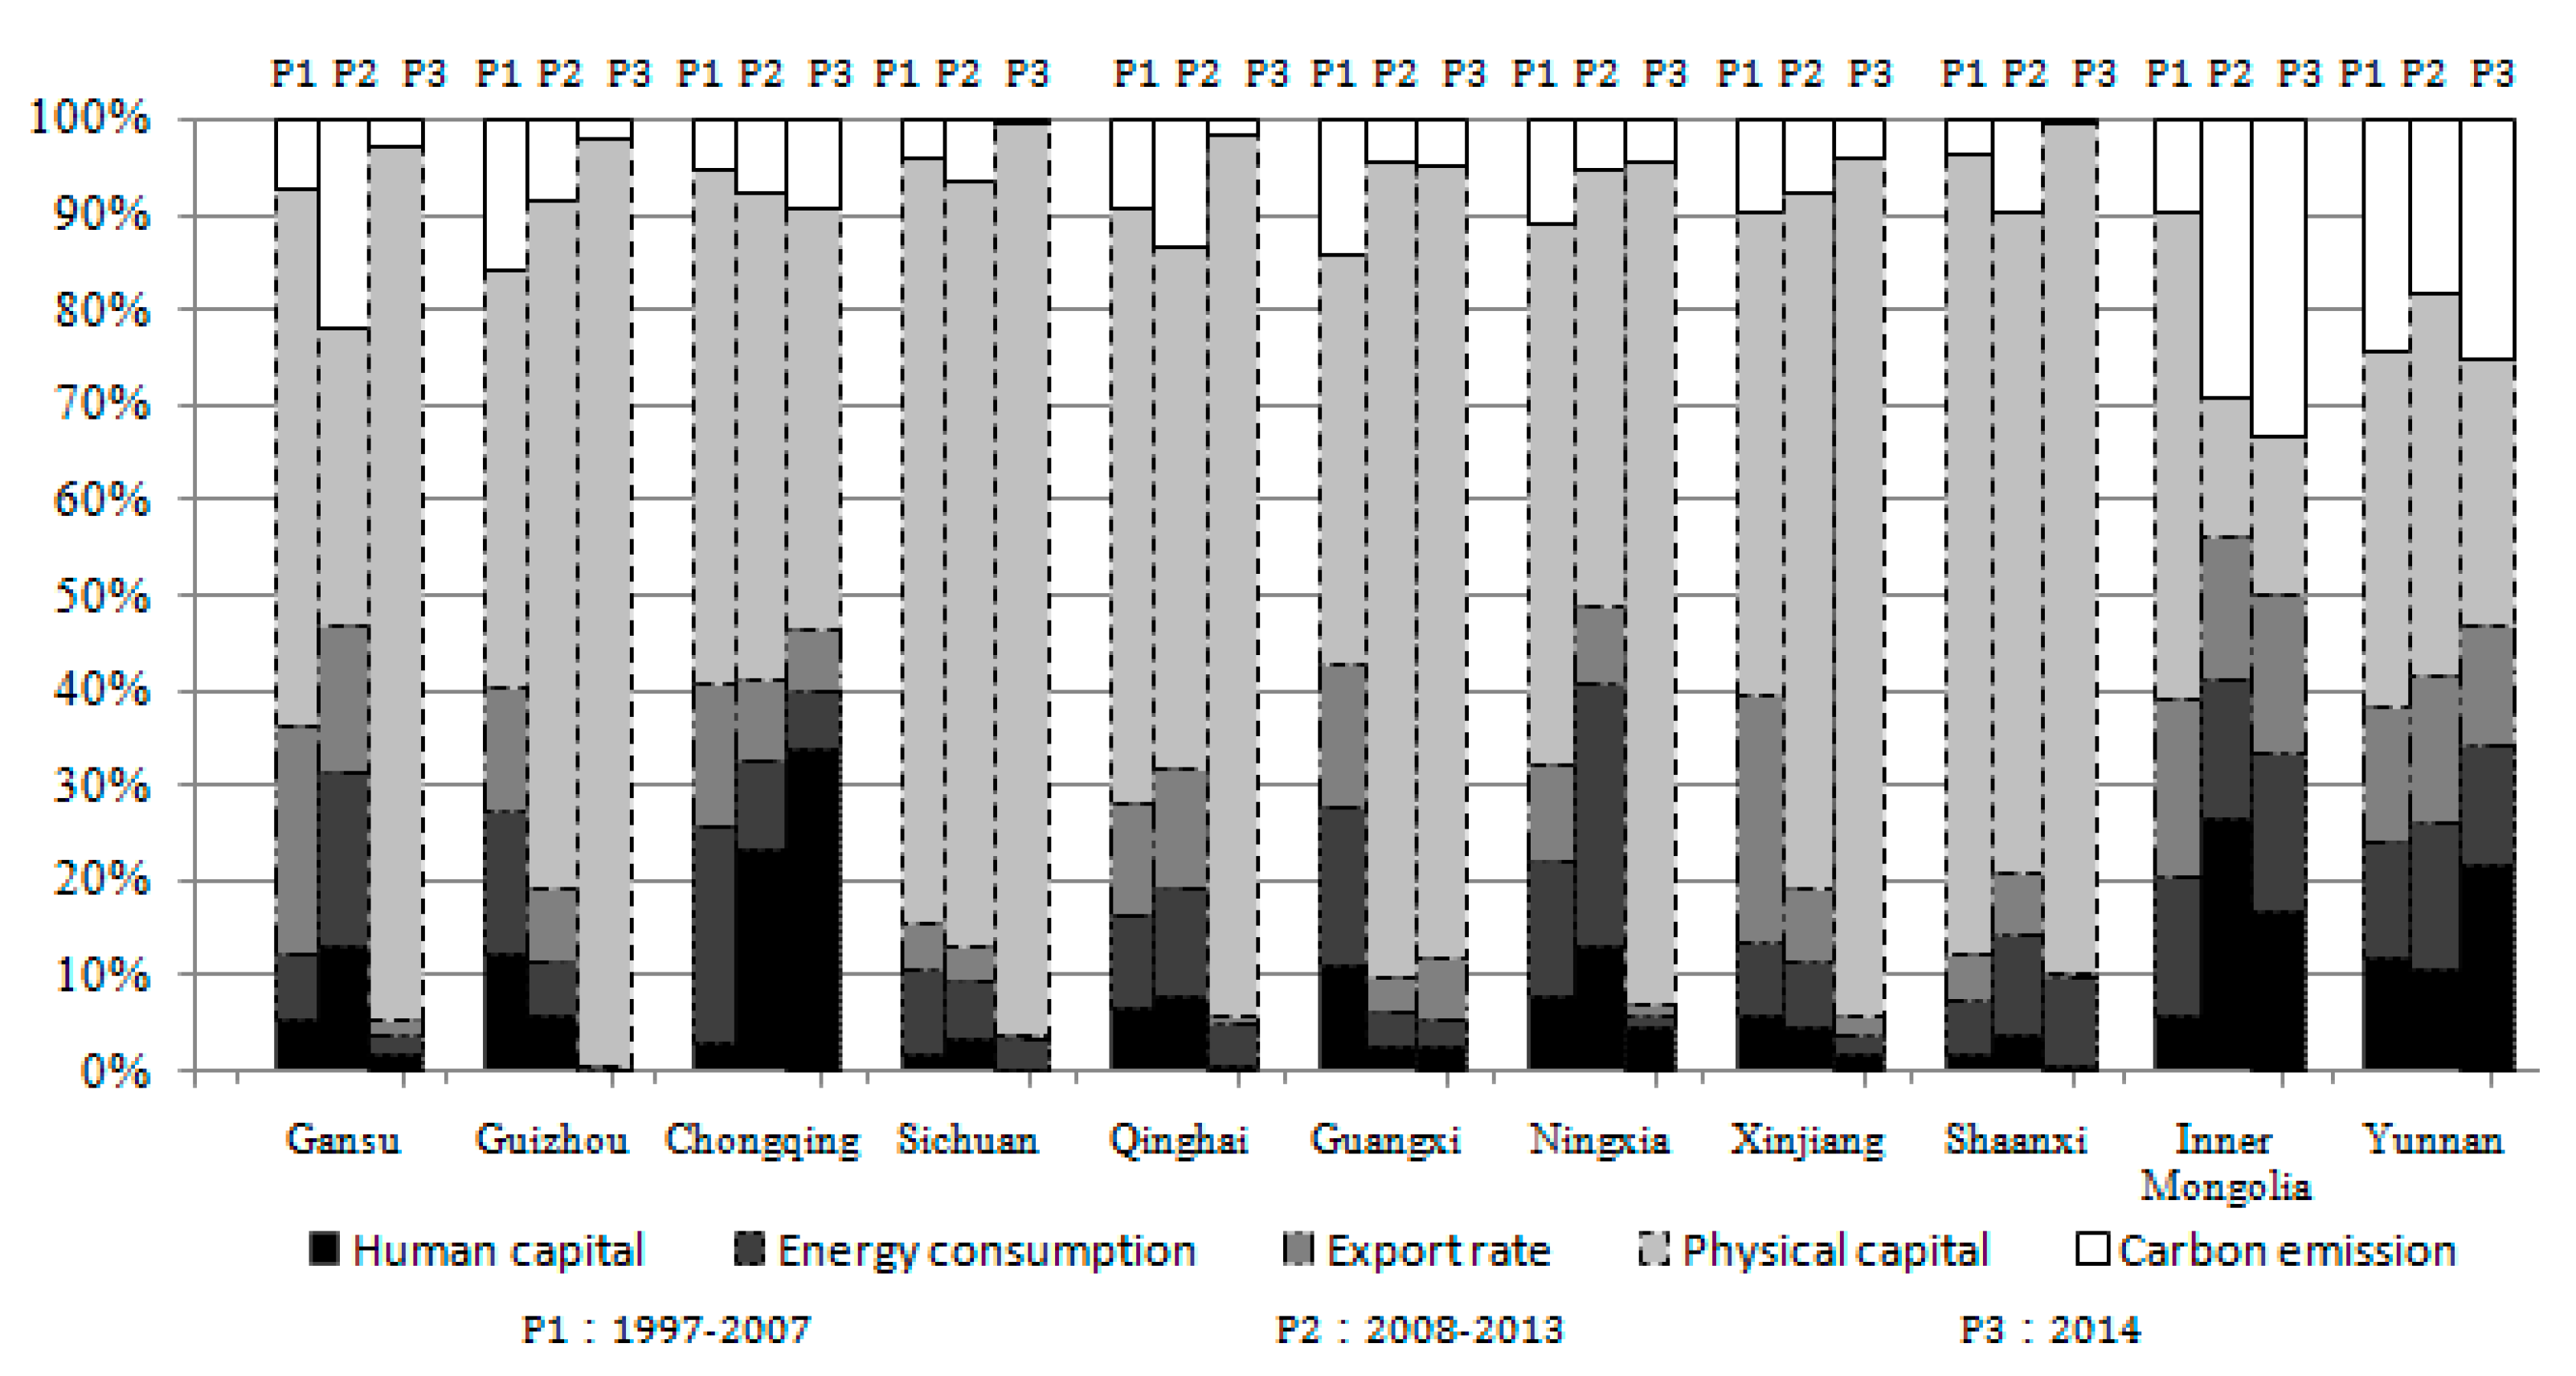
The contributions of each province are expressed from a regional perspective (eastern region, Figure 6; central region, Figure 7; western region, Figure 8). The cumulative percentages of the factors’ contributions are plotted in a cumulative histogram ranked from left to right, indicating data for 1997–2007, 2008–2014, and 2014. The provinces are ranked by managerial performance. From the regional perspective, the contribution rate of physical capital is decreasing from the central region and the western region to the eastern region. However, the regional trend of carbon emission is opposite to that of physical capital. Compared with the western region (8.6%), the eastern region has a strong advantage of human capital contribution (17.2%). This suggests that the economic performance in the eastern region is changing from investment-driven to low-carbon-driven and human-driven.
For the eastern provinces, the contribution of physical capital (41.3%) provides an advantage in a low-carbon economy, with human capital ranking second. Carbon emission and energy consumption fall behind, although their contributions are higher than those of the central and western regions. The highest performances in the eastern region (e.g., Shandong) benefit from the increasing contribution of physical capital. This indicates that physical capital is strongly correlated with performance. The Yangtze River Delta, the Pearl River Delta, and the Bohai Economic Rim have developed with the new industrialization. Therefore, the contribution of physical capital stock is advantageous. However, many eastern provinces have begun to turn toward human-driven or low-carbon-driven economies. For example, the greatest contribution of Hainan is carbon emission (31.3%), with a trend increasing from 30.6% in the first stage to 41.9% in the second stage. Beijing exhibits a similar situation, with a carbon emission contribution of 33.3% in 2014. Shanghai stands out for its high contribution of human capital (38.9%). The contribution rate became 57.5% in 2014, indicating Shanghai is typically human-driven in the low-carbon economy development.
In the central provinces, the contribution of physical capital provides an absolute advantage in a low-carbon economy, much higher than in the eastern and central regions, whereas that of energy consumption is relatively lower. Energy consumption and human capital have the lowest contributions. Over the entire period, the maximum fluctuation is observed in energy consumption, whose contribution decreased from 13% to 7%. By contrast, the change in contribution for physical capital stock increased from 57.0% to 63.1%. This substitution is influenced by the new industrialization. However, the reverse (from low-carbon-driven to investment-driven) violates the development of a low-carbon economy. From a provincial perspective, Jiangxi, Hunan, and Hubei, which border the western region, have an absolute advantage in low-carbon economy performance. Moreover, Hunan and Hubei have a sustainable trend of carbon emission contribution. Hunan in particular, ranking second in managerial performance in the central region, demonstrates an increasing trend of carbon emission from 7.5% at the first stage to 15.3% at the second stage. Subsequently, the contribution rate became 18.6% in 2014. Anhui (16.8%) and Shanxi (16.5%), which border the eastern region, have higher carbon emission contribution rates because of their geographical influence.
For the western region, the contribution of physical capital provides an absolute advantage, but the trend decreases slightly, whereas the contributions of human capital and carbon emission contrast with that of physical capital, meaning that they have a lower contribution and increasing trend. This is in accordance with China overall. The contribution of the export rate decreases from 14.3% in the first stage to 9.4% in the second stage, and even falls to 4.4% in 2014. This results in the openness contribution falling behind the other contributions. It is necessary, therefore, to institute new policy support to stimulate openness, such as “One Belt, One Road”. From the provincial perspective, most provinces have an absolute advantage in the contribution of physical capital, such as Sichuan (80.6%), Shaanxi (76.9%), and Guangxi (64.4%), whereas Inner Mongolia and Yunnan differ from other provinces in the western region by having high contributions of carbon emissions and human capital. Inner Mongolia, as a new representative of the western region, has the advantages of a lower consumption level, greater energy resources, and lower environmental thresholds. However, its contribution rate of carbon mission increases from 9.5% in the first stage to 29.3% in the second stage, and that of human capital from 5.9% in the first stage to 26.7% in the second stage. This indicates that economic development in Inner Mongolia has become low-carbon-driven and human-driven rather than the traditional investment-driven.
6. Conclusions
This pioneering study examines the managerial performance of the low-carbon economy with the intertemporal effect of capital among the Chinese provinces. This paper proposes an expanded dynamic Malmquist model with intertemporal product feasible sets as the reference. Using a three-stage methodology, this study incorporated a Tobit model with time shift influence to eliminate the resource endowment influence to obtain the managerial performance. As expected, in a time-series perspective, the resource endowment restrained the development of a low-carbon economy in China. This finding is consistent with those of previous studies on economic sustainability [41]. Therefore, this study provides valuable complementary research that empirically clarifies regional managerial performances of the low-carbon economy. Furthermore, this study establishes a critical bridge between the TFP of the low-carbon economy and the intertemporal effect with sustainability expectations, although many previous studies have linked the low-carbon economy to its extrinsic outcomes, such as profits or financial performance.
Our main findings are as follows. First, soft power (DTC) is a primary determinant in the managerial performance of the low-carbon economy. Nevertheless, hard power (DTEC) substantially contributed to the performance in the early years. Second, the regional features of the managerial performance are obvious compared with the original performance. The diversity of managerial performance in the eastern region is smallest, and that in western region is the largest. Third, the greatest contribution of performance in China comes from physical capital, followed by carbon emission, which exhibits an increasing trend. Although many openness policies support the issue (such as the Free Trade Zone), the efficiency is more important than the formalism.
The empirical results provide preliminary evidence of the low-carbon economy performance bottlenecks, which constitute a nascent yet emerging field that has considerable potential for future research. For example, Tianjin and Hebei should emphasize the optimal allocation of their own resources. Jiangxi and Hunan, by contrast, should focus on the perfection of the resources endowments. On the basis of the results, we propose the following suggestions:
- (1)
- Optimizing industrial structures for the improvement of carbon productivity. The development of a low-carbon economy relies on the optimization of industrial structures. This indicates that policy supports for the low-carbon economy are necessary to increase the value of products. Meanwhile, the industrial internal update should be improved according the regional resource endowment of low-carbon economy performance. For example, industries in the western region should be encouraged to switch from high-energy to low-carbon consumption. By contrast, in the central region, integrating the development of production services and manufacturing would be more effective. In the eastern region, internet industrialization and intelligent industrialization would keep the regional advantage of low-carbon economy.
- (2)
- Optimizing the energy structure for the differentiation strategy of carbon emission. Most developed countries consider energy structure optimization to be the future direction of a low-carbon economy. For example, according to the city government announcement, Santiago, U.S., promised to realize 100% renewable energy sources within 20 years. By contrast, carbon reduction while stabilizing economic growth is suitable for China. A feasible path for China also involves the optimization of energy consumption structures. From the empirical results, the regional differentiation of carbon emission performance is obvious; the provinces with low managerial performance should adjust their own resource endowment structures according to the experience of the more advantaged provinces. For the provinces with high managerial performance, future policy support for renewable energy is crucial.
- (3)
- Improving technical innovation abilities to promote soft power. Soft power is the driving force of low-carbon performance improvement. Thus, innovations in low-carbon technology are crucial in carbon reduction. However, for the optimal allocation of resources, the construction of an innovation platform must be the accumulation of multilateral forces. The dominance of innovative enterprises should be established, and the perfection of the innovation system, should become a priority. Moreover, a cooperative alliance among enterprises, universities, and research institutes should be established and receive effective guidance.
This study demonstrates that the intertemporal effect is applicable to understanding the managerial performance of a low-carbon economy and provides an understanding of economic sustainability development in general. The empirical examination of the managerial performance in 30 Chinese provinces reveals that soft power can provide an in-depth understanding of performance improvement.
However, several limitations of this study should be addressed in the future. First, the depreciation rate of 10.96% lacks of provincial characteristics, we will use the province-specific depreciation rates [64] to calculate the physical capital stock. Second, the selection of resource endowments was arbitrary; a test of the correlation between the resource endowments and the evaluation factors would enhance the precision of the proposed model. Third, this study considered the intertemporal effect instead of the long-term effect of physical capital stock and the sustainable influence of dynamic factors. Further development and evidence from additional extensions of the Malmquist model are required. Forth, robustness tests are necessary for the stability of TFPs and their decomposed efficiency indices. Bootstrap is one of important methods to test the robustness of the results.
Acknowledgments
This study was supported by a research grant awarded by the Social Science Fund Project of Beijing (16YJC049), the Scientific Project of Beijing Education Commission (SM201710017001), and the Social Science Fund Project of Beijing (16GLB019).
Author Contributions
Zhao Xinna contributed to design the study and drafted the manuscript. Zhong Chongwen participated in the study and interpreted some of the results and supervised the whole progress of this study. Both of authors wrote the body of the paper and read and approved the final manuscript.
Conflicts of Interest
The authors declare no conflict of interest.
References
- Wu, D. Discussion on the distinction between haze and frog and analysis and processing of data. Environ. Chem. 2008, 3, 327–330. [Google Scholar]
- Li, K.; Lin, B. Economic growth model, structural transformation, and green productivity in China. Appl. Energy 2017, 187, 489–500. [Google Scholar] [CrossRef]
- Kondyli, J. Measurement and Evaluation of Sustainable Development: A Composite Indicator for the Islands of the North Aegean Region, Greece. Environ. Impact Assess. Rev. 2010, 30, 347–356. [Google Scholar] [CrossRef]
- Reilly, M.J. Green growth and the efficient use of natural resources. Energy Econ. 2012, 34, 85–93. [Google Scholar] [CrossRef]
- Krugman, P. The myth of Asia’s miracle. Foreign Aff. 1994, 73, 62–78. [Google Scholar] [CrossRef]
- Hu, A. Economy growth depends on the increasing of total factor productivity. Policy 2003, 1, 29–30. [Google Scholar]
- Zheng, X. Again knowledge of total factor productivity. J. Quant. Tech. Econ. 2007, 24, 3–11. [Google Scholar]
- Li, X.; Yang, X.; Wang, Y. Does international trade improve the carbon productivity in China’s manufacturing? J. Environ. Econ. 2016, 2, 8–24. [Google Scholar]
- Färe, R.; Grosskopf, S.; Lindgren, B.; Roos, P. Productivity changes in Swedish pharmacies 1980–89: A non-parametric Malmquist approach. J. Product. Anal. 1992, 3, 85–101. [Google Scholar] [CrossRef]
- Charnes, A.; Cooper, W.W.; Rhodes, E. Measuring the efficiency of decision making units. Eur. J. Oper. Res. 1978, 2, 429–435. [Google Scholar] [CrossRef]
- Hoekstra, R.; van den Bergh, J.C.J.M. Comparing structural decomposition analysis and index. Energy Econ. 2003, 25, 39–64. [Google Scholar] [CrossRef]
- Kennedy, C.; Steinberger, J.; Gasson, B.; Hansen, Y.; Hillman, T.; Havranek, M.; Pataki, D.; Phdungsilp, A.; Ramaswami, A.; Villalba, G. Methodology for inventorying greenhouse gas emissions from global cities. Energy Policy 2010, 38, 4828–4837. [Google Scholar] [CrossRef]
- Arabi, B.; Munisamy, S.; Emrouznejad, A.; Shadman, F. Power industry restructuring and eco-efficiency changes: A new slacks-based model in Malmquist-Luenberger index measure. Energy Policy 2014, 68, 132–145. [Google Scholar] [CrossRef]
- Holtz-Eakin, D.; Selden, T.M. Stoking the fires? CO2 emissions and economic growth. J. Public Econ. 1995, 57, 85–101. [Google Scholar] [CrossRef]
- Oh, I.; Wehrmeyer, W.; Mulugetta, Y. Decomposition analysis and mitigation strategies of CO2 emissions from energy consumption in South Korea. Energy Policy 2010, 38, 364–377. [Google Scholar] [CrossRef]
- He, F.; Zhang, Q.; Lei, J.; Fu, W.; Xu, X. Energy efficiency and productivity change of China’s iron and steel industry: Accounting for undesirable outputs. Energy Policy 2013, 54, 204–213. [Google Scholar] [CrossRef]
- Hu, J.-L.; Wang, S.-C. Total-factor energy efficiency of regions in China. Energy Policy 2006, 17, 3206–3217. [Google Scholar] [CrossRef]
- Liu, X. On decarburization of industrial structure and international comparison among cities. Product. Res. 2010, 4, 199–202. [Google Scholar]
- Lin, B.; Sun, C. Evaluating carbon dioxide emissions in international trade of China. Energy Policy 2010, 38, 613–621. [Google Scholar] [CrossRef]
- Zhao, R.; Su, H.; Chen, X.; Yu, Y. Commercially available materials selection in sustainable design: An integrated multi-attribute. Sustainability 2016, 8, 79–93. [Google Scholar] [CrossRef]
- Pacala, S.; Socolow, R. Stabilization wedges: Solving the climate problem for the next 50 years with current technologies. Science 2004, 305, 968–972. [Google Scholar] [CrossRef] [PubMed]
- Chen, W. The costs of mitigating carbon emissions in China: Findings from China Markal-macro modeling. Energy Policy 2005, 33, 885–896. [Google Scholar] [CrossRef]
- Oh, D. A global Malmquist-Luenberger productivity index. J. Product. Anal. 2010, 34, 183–197. [Google Scholar] [CrossRef]
- Li, L.; Fan, F.; Ma, L.; Tang, Z. Energy utilization evaluation of carbon performance in public projects by FAHP and cloud model. Sustainability 2016, 8, 630–647. [Google Scholar] [CrossRef]
- Guo, Y.; Li, J.; Xia, D.; Sun, B. Dynamic changes of carbon dioxide emissions in six provinces of central China. Res. Environ. Sci. 2016, 2, 1279–1287. [Google Scholar]
- Herrala, R.; Goel, R.K. Global CO2 efficiency: Countries estimates using a stochastic cost frontier. Energy Policy 2012, 45, 762–770. [Google Scholar] [CrossRef]
- Lorek, S.; Spangenberg, H.J. Sustainable consumption within a sustainable economy-beyond green growth and green economies. J. Clean. Prod. 2014, 63, 33–44. [Google Scholar] [CrossRef]
- Chen, S. Evaluation of low carbon transformation process for Chinese provinces. Econ. Res. J. 2012, 8, 32–44. [Google Scholar]
- Lilin, Z.; Qigui, Z. Re-estimatio of total factor productivity in China accounting for the energy and environment factors. Econ. Res. J. 2013, 30, 9–17. [Google Scholar]
- Liangke, X. How human capital and R&D investments influence TFP. J. Quant. Tech. Econ. 2010, 4, 78–94. [Google Scholar]
- Kander, A.; Malanima, P. The energy-capital relation—Sweden 1870–2000. Struct. Chang. Econ. Dyn. 2007, 18, 291–305. [Google Scholar] [CrossRef]
- Dou, X. Low carbon-economy development: China’s pattern and policy selection. Energy Policy 2013, 63, 1013–1020. [Google Scholar] [CrossRef]
- Foxon, J.T. A coevolutionary framework for analysing a transition to a sustainable low carbon economy. Ecol. Econ. 2011, 70, 2258–2267. [Google Scholar] [CrossRef]
- Solow, M.R. A contribution to the theory of economic growth. Q. J. Econ. 1956, 70, 65–94. [Google Scholar] [CrossRef]
- Lei, M.; Yu, X. Analysis of Low carbon economy growth and dynamic effect mechanism. Econ. Sci. 2015, 2, 44–57. [Google Scholar]
- Ramakrishnan, R. A multi-factor efficiency perspective to the relationships among world GDP: Energy consumption and carbon dioxide emission. Technol. Forecast. Soc. Chang. 2006, 73, 483–494. [Google Scholar]
- Ürge-Vorsatz, D.; Kelemen, A.; Tirado-Herrero, S.; Thomas, S.; Thema, J.; Mzavanadze, N.; Hauptstock, D.; Suerkemper, F.; Teubler, J.; Gupta, M.; et al. Measuring multiple impacts of low-carbon energy options in a green economy context. Appl. Energy 2016, 179, 1409–1426. [Google Scholar] [CrossRef]
- Mandil, C. Tracking Industrial Energy Efficiency and CO2 Emissions; International Energy Agency: Paris, France, 2007. [Google Scholar]
- Meng, F.; Su, B.; Thomson, E.; Zhou, D.; Zhou, P. Measuring China’s regional energy and carbon emission efficiency with DEA models: A survey. Appl. Energy 2016, 183, 1–21. [Google Scholar] [CrossRef]
- Pastor, J.T.; Lovell, C.A.K. A global Malmquist productivity index. Econ. Lett. 2005, 88, 266–271. [Google Scholar] [CrossRef]
- Lamdany, R. IMF Performance in the Run-Up to the Financial and Economic Crisis: IMF Surveillance in 2004-07; International Monetary Fund: Washington, DC, USA, 2011; p. 5. [Google Scholar]
- Tone, K.; Tsutsui, M. Tuning regression results for use in multi-stage data adjustment approach of DEA. J. Oper. Res. Soc. Jpn. 2009, 52, 76–85. [Google Scholar]
- Fried, O.H.; Schnidt, S.S.; Yaisawarng, S. Incorporating the operating environment into a nonparametric measure of technical efficiency. J. Product. Anal. 1999, 12, 249–267. [Google Scholar] [CrossRef]
- Simar, L.; Wilson, W.P. Estimation and inference in two-stage, semi-parametric models of production processes. J. Econom. 2007, 136, 31–46. [Google Scholar] [CrossRef]
- Gimenez, V.S.; Prior, D.; Thieme, C. Technical efficiency, managerial efficiency and objective-setting in the educational system: an international comparison. J. Oper. Res. Soc. 2007, 58, 996–1007. [Google Scholar] [CrossRef]
- Banker, D.R.; Natarajan, R. Evaluating contextual variables affecting productivity using data envelopment analysis. Oper. Res. 2008, 56, 48–58. [Google Scholar] [CrossRef]
- Shang, J.-K.; Hung, W.-T; Wang, F.-C. Service outsourcing and hotel performance: Three-stage DEA analysis. Appl. Econ. Lett. 2008, 15, 1053–1057. [Google Scholar] [CrossRef]
- Tsutsui, M.; Goto, M. A multi-division efficiency evaluation of U.S. electric power companies using a weighted slacks-based measure. Socio-Econ. Plan. Sci. 2009, 43, 201–208. [Google Scholar] [CrossRef]
- Malmquist, S. Index numbers and indifference surfaces. Trabajos de Estadistica Y de Investigacion Operativa 1953, 4, 209–242. [Google Scholar] [CrossRef]
- Tone, K.; Tsutsui, M. Dynamic DEA with network structure: A slacks-based measure approach. Omega 2014, 42, 124–131. [Google Scholar]
- Färe, R.; Grosskopf, S; Norris, M.; Zhongyang, Z. Productivity growth, technical progress, and efficiency change in industrialized countries. Am. Econ. Rev. 1994, 84, 66–83. [Google Scholar]
- Cooper, W.W.; Seiford, M.W.; Tone, K. Data Envelopment Analysis: A Comprehensive Text with Model, Applications, References and DEA-Solver Software, 2nd ed.; Springer: New York, NY, USA, 2007; p. 376. [Google Scholar]
- Jondrow, J.; Lovell, C.A.K.; Materov, I.; Schmidt, P. On the estimation of technical inefficiency in the stochastic frontier production function model. J. Econ. 1982, 19, 233–238. [Google Scholar] [CrossRef]
- Ayres, R.U.; Warr, B. Accounting for growth: The role of physical work. Struct. Chang. Econ. Dyn. 2005, 16, 181–209. [Google Scholar] [CrossRef]
- Kander, A.; Malanima, P.; Warde, P. Power to the People: Energy in Europe over the Last Five Centuries; Princeton University Press: Princeton, NJ, USA, 2014. [Google Scholar]
- Martínez, C.I.P. Energy efficiency development in German and Colombian non-energy-intensive sectors: A non-parametric analysis. Energy Effic. 2011, 4, 115–131. [Google Scholar] [CrossRef]
- Warr, B.; Ayres, R.U. Useful work and information as drivers of economic growth. Ecol. Econ. 2012, 73, 93–102. [Google Scholar] [CrossRef]
- He, D. Correlation analysis among investment flow, structural adjustment and upgrade. Econ. Res. J. 2001, 11, 45–51. [Google Scholar]
- Hou, R. An analysis of investment results in fixed assets and its hysteresis effect. J. Quant. Tech. Econ. 2002, 19, 13–16. [Google Scholar]
- Kander, A.; Jiborn, M.; Moran, D.D.; Wiedmann, T.O. National greenhouse-gas accounting for effective climate policy on international trade. Nat. Clim. Chang. 2015, 5, 431–435. [Google Scholar] [CrossRef]
- Kander, A.; Warde, P.; Henriques, S.T.; Nielsen, H.; Kulionis, V.; Hagen, S. International trade and energy intensity during European industrialization, 1870–1935. Ecol. Econ. 2017, 139, 33–44. [Google Scholar] [CrossRef]
- Zhao, Q.; Zhang, C. Foreign direct investment and China’s technical efficiency improvement: an empirical analysis based on stochastic frontiers production model. World Econ. Study 2009, 6, 61–67. [Google Scholar]
- Shan, H. Reestimating the capital stock of China: 1952–2006. J. Quant. Tech. Econ. 2008, 10, 17–31. [Google Scholar]
- Wu, Y. China’s capital stock series by region and sector. Front. Econ. China 2016, 1, 156–172. [Google Scholar]
Figure 1.
Managerial low-carbon economy performance versus original low-carbon economy performance. TFP-M: managerial total-factor productivity; TFP-O: original total-factor productivity.
Figure 1.
Managerial low-carbon economy performance versus original low-carbon economy performance. TFP-M: managerial total-factor productivity; TFP-O: original total-factor productivity.
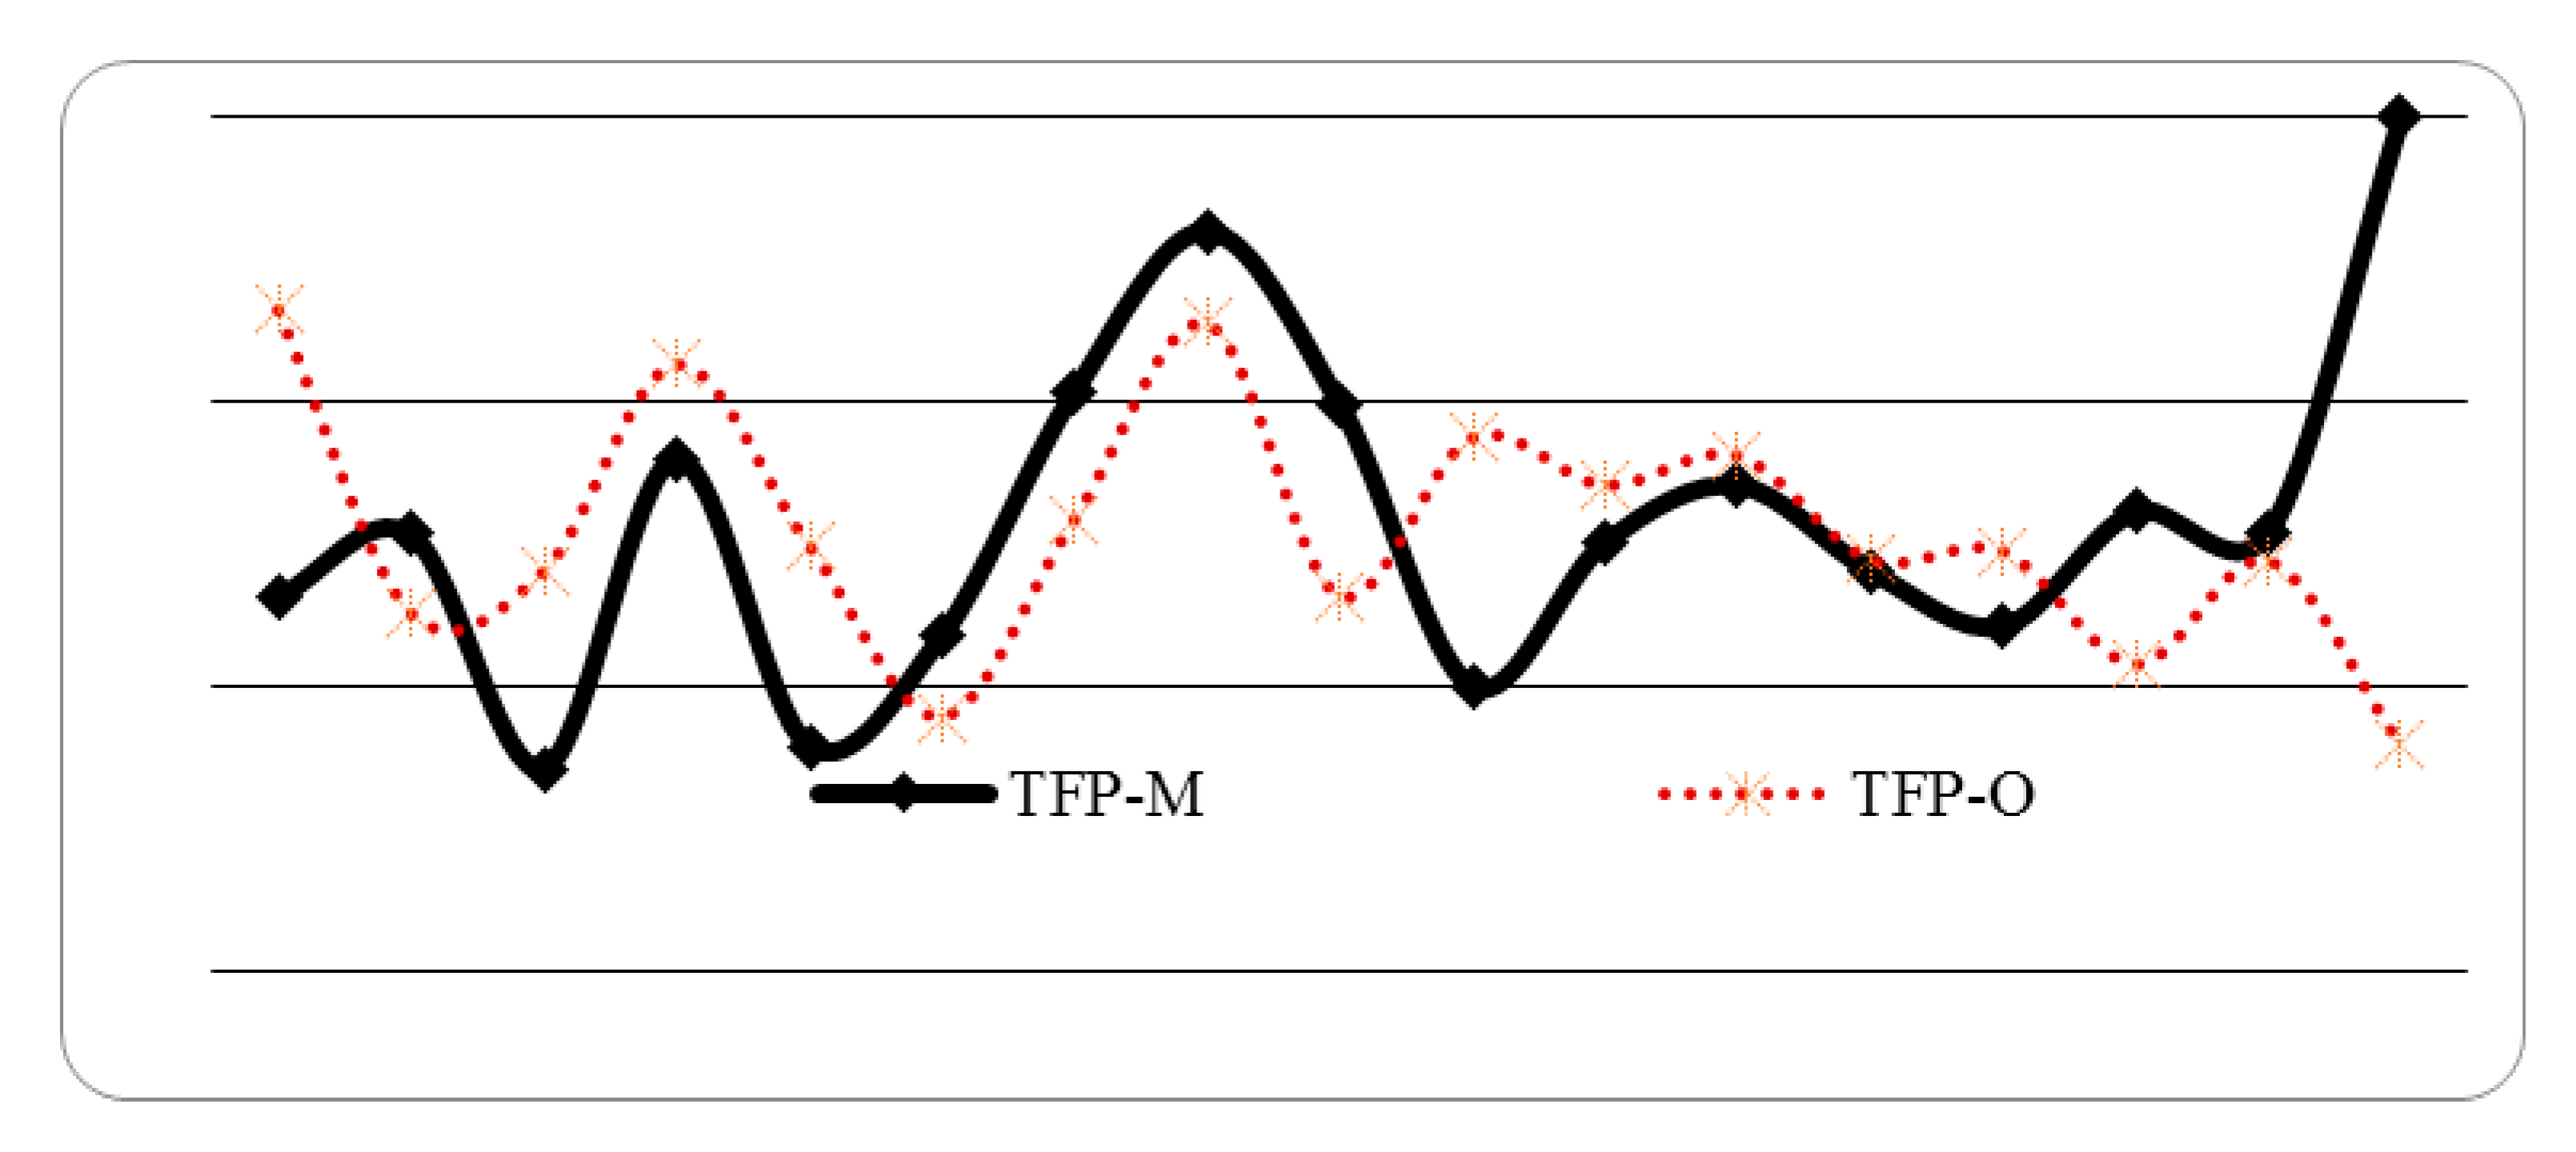
Figure 2.
Decomposed managerial performance of low-carbon economy in China. DTEC: dynamic technical efficiency change; DTC: dynamic technology change.
Figure 2.
Decomposed managerial performance of low-carbon economy in China. DTEC: dynamic technical efficiency change; DTC: dynamic technology change.
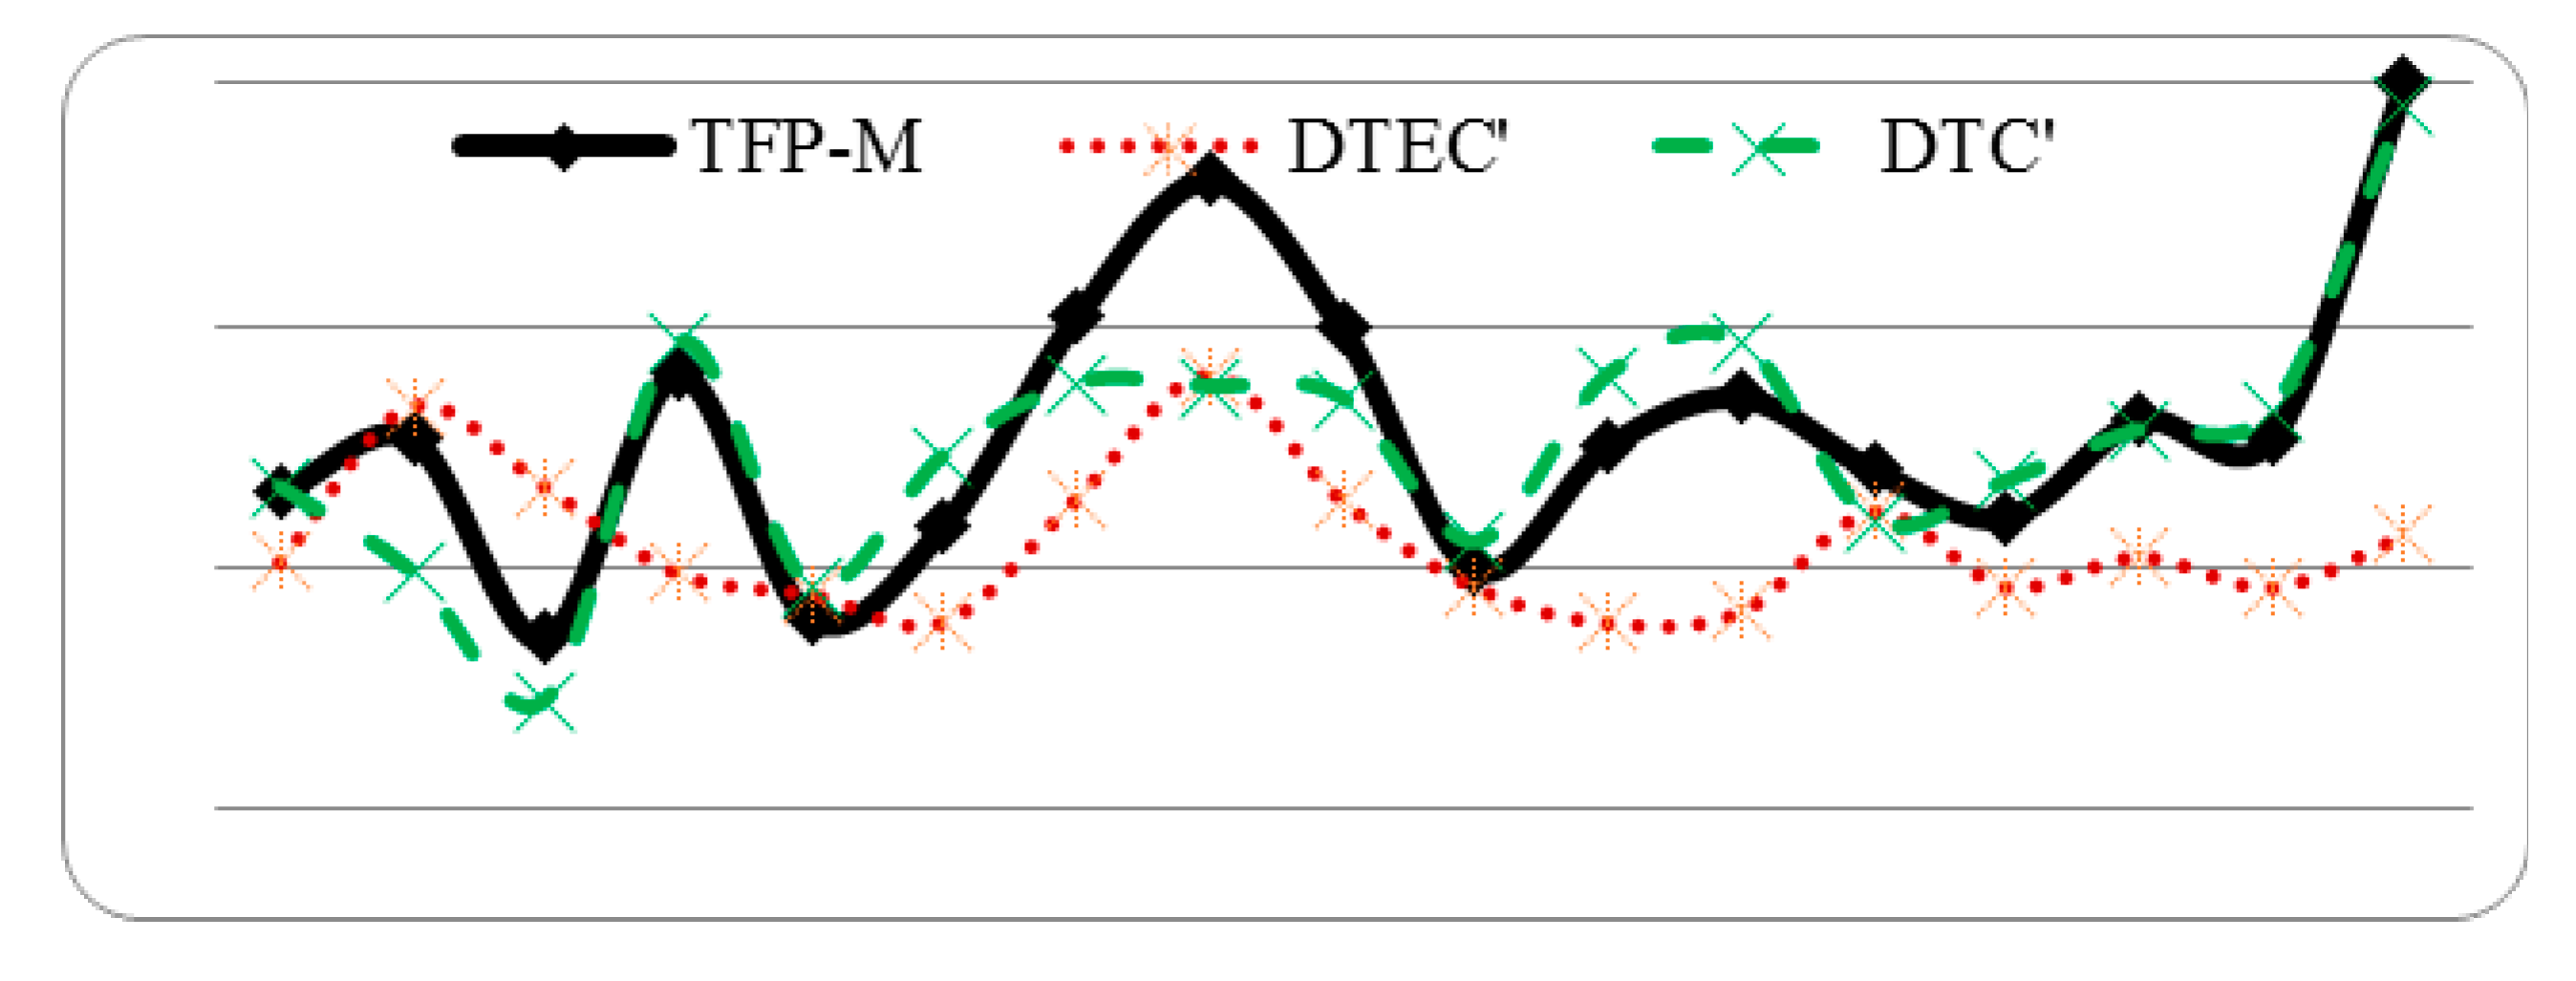
Figure 3.
Provincial managerial performance versus provincial original performance.
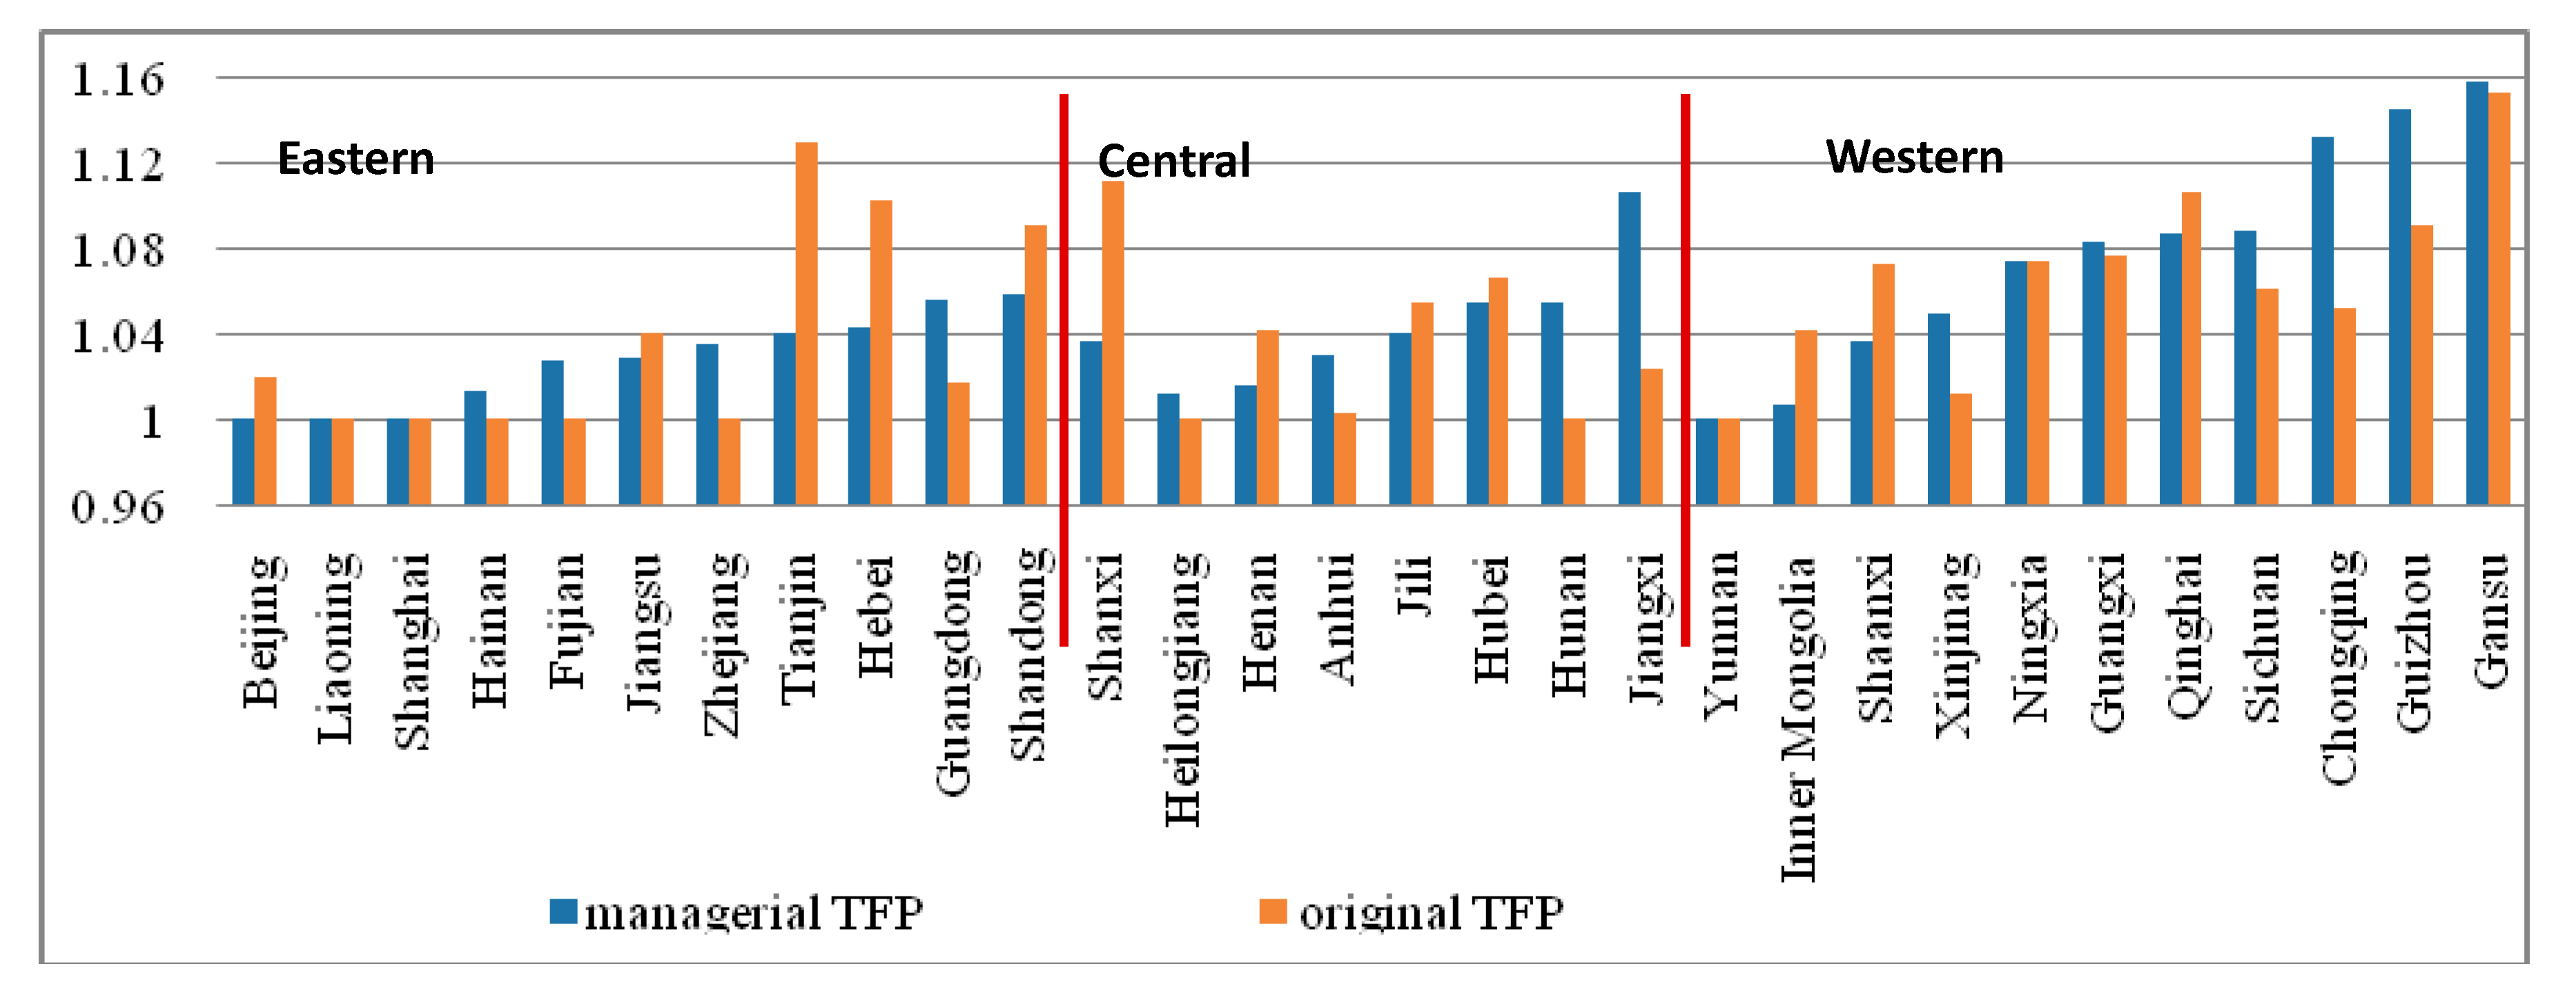
Figure 4.
(a) Regional managerial performance; (b) Regional original performance. DPTC: dynamic pure technical efficiency change; DSEC: dynamic scale efficiency change.
Figure 4.
(a) Regional managerial performance; (b) Regional original performance. DPTC: dynamic pure technical efficiency change; DSEC: dynamic scale efficiency change.

Figure 5.
Decomposing managerial performance versus original performance.

Figure 6.
Factors contributing to managerial low-carbon economy performance in the eastern region. P1: period 1; P2: period 2; P3: period 3.
Figure 6.
Factors contributing to managerial low-carbon economy performance in the eastern region. P1: period 1; P2: period 2; P3: period 3.
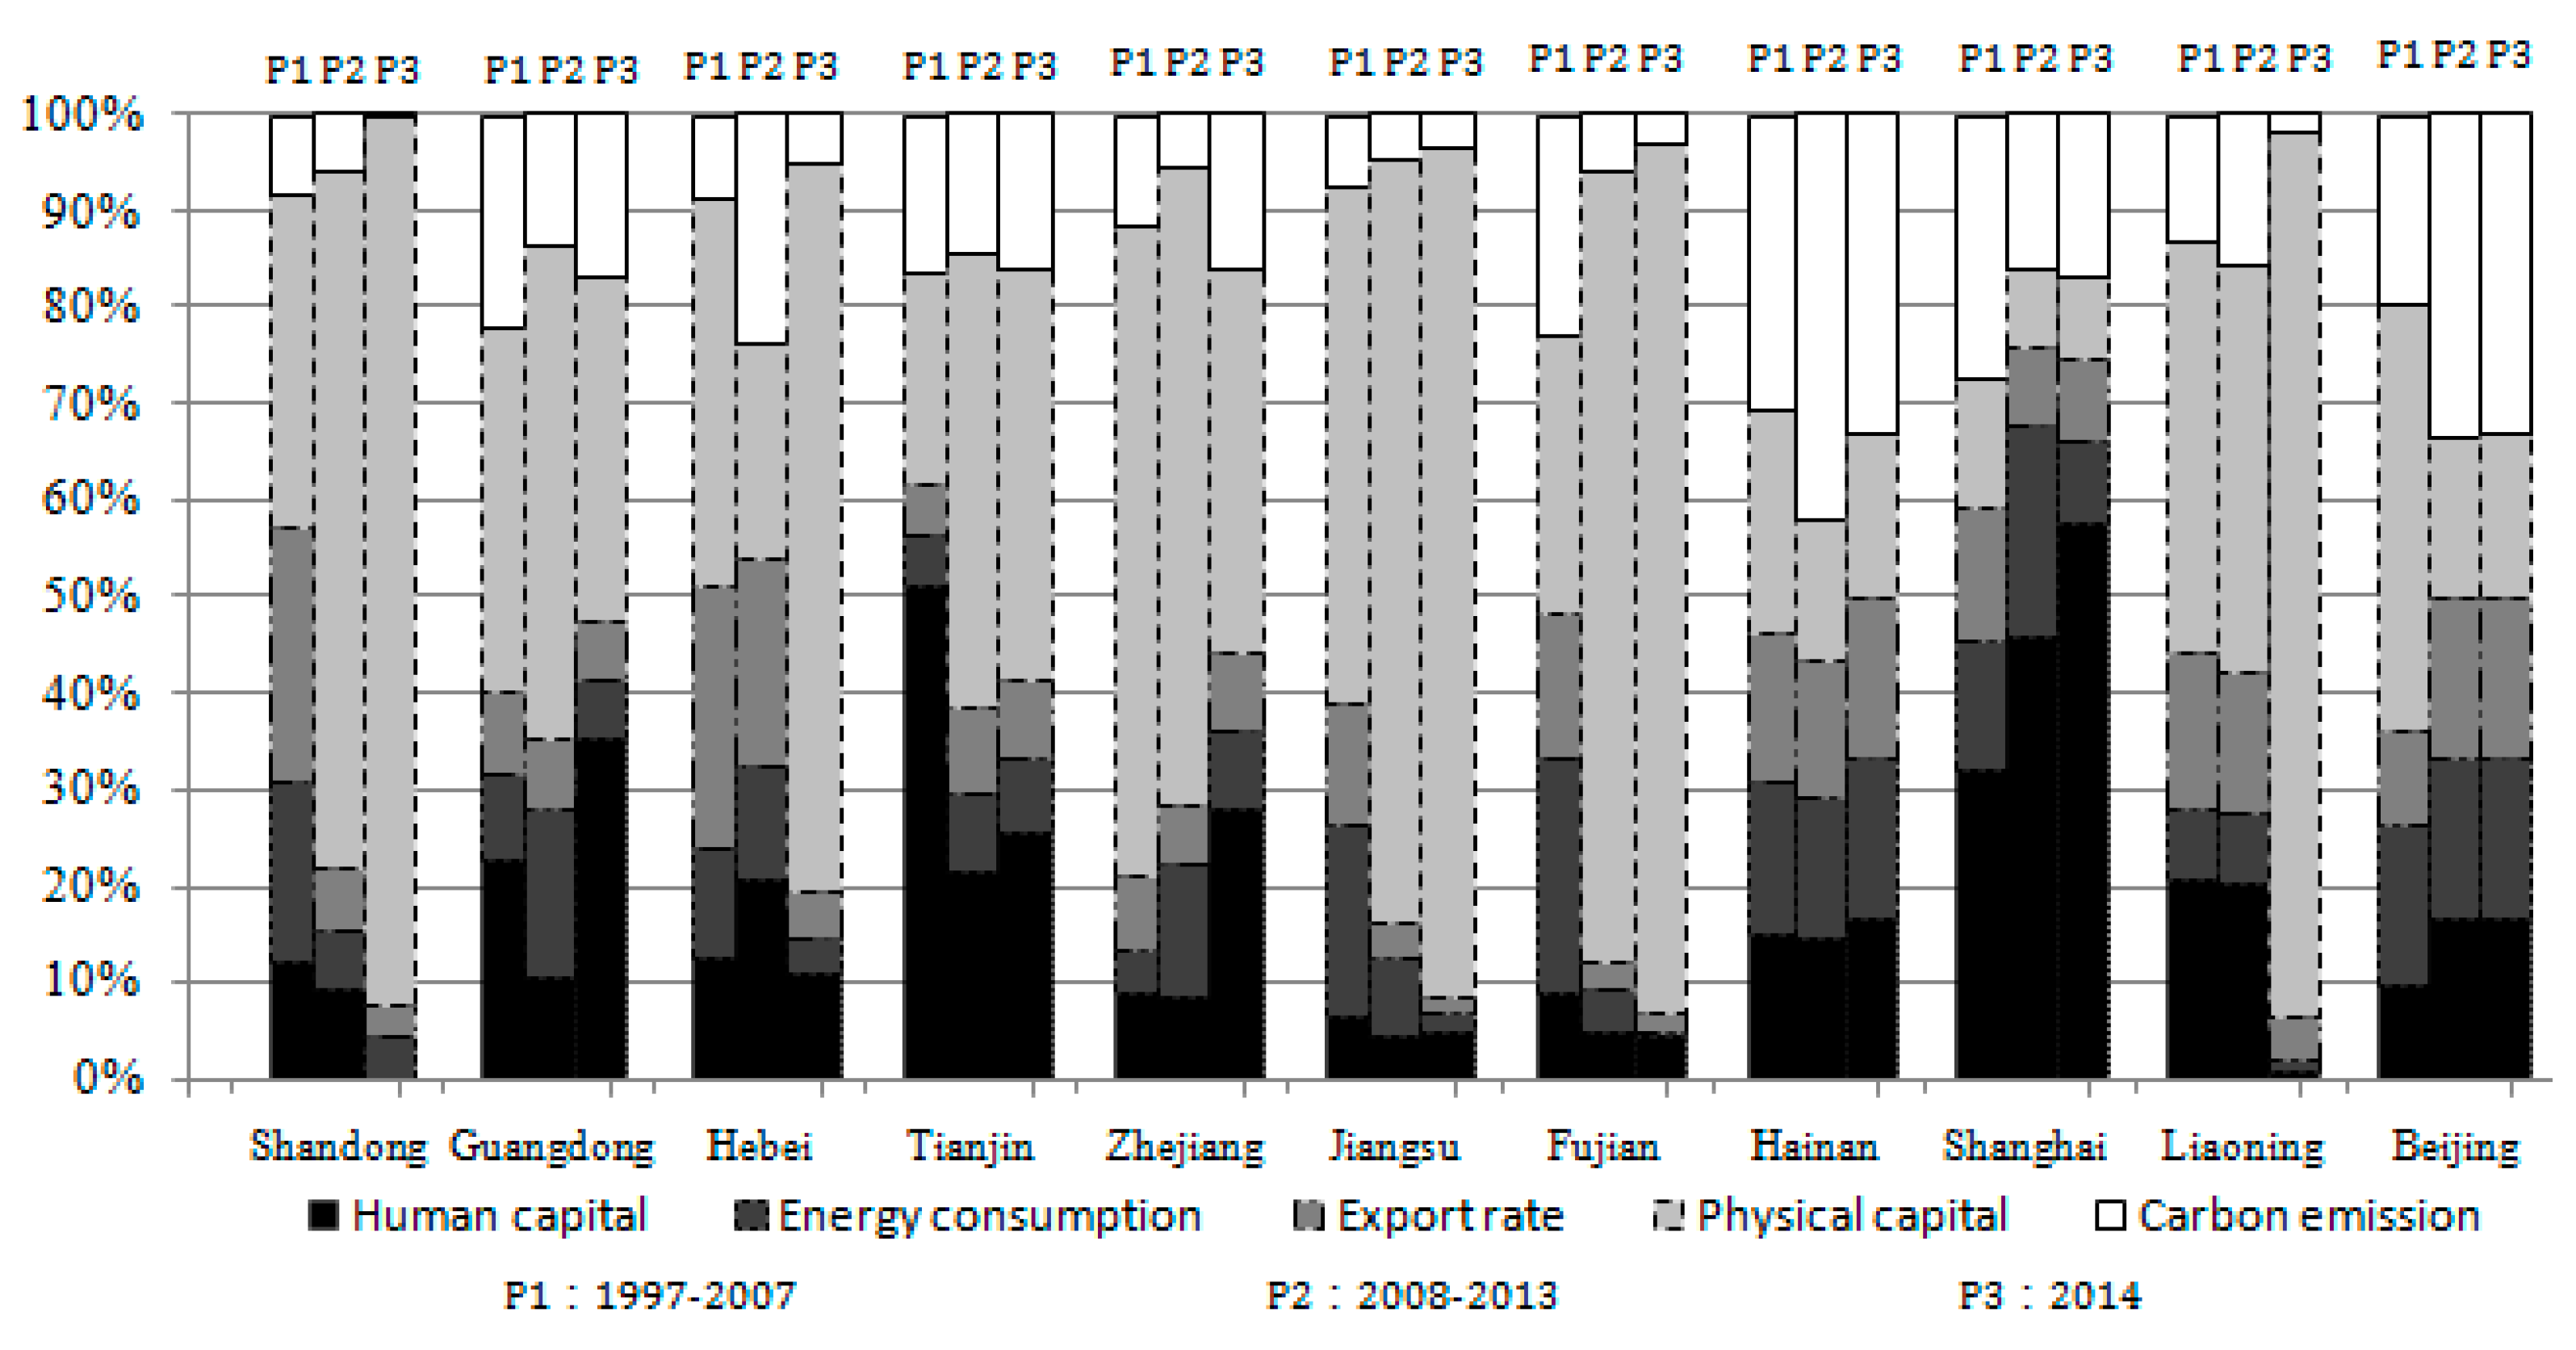
Figure 7.
Factors contributing to managerial low-carbon economy performance in the central region.

Figure 8.
Factors contributing to managerial low-carbon economy performance in the western region.


Table 1.
Data expression.
| Factors | Unit | Sample | Average | Standard Deviation | Minimum | Maximum |
|---|---|---|---|---|---|---|
| Human capital stock | score/per-capita | 540 | 8.567 | 1.078 | 5.930 | 13.329 |
| Energy consumption | ton of standard coal/per-capita | 540 | 2.423 | 1.513 | 0.065 | 7.947 |
| Export rate | % | 540 | 15.7 | 18.5 | 1.5 | 86.4 |
| Physical capital stock | ten thousand yuan/per-capita | 540 | 1.573 | 1.998 | 0.030 | 13.272 |
| Carbon emission | tons/per-capita | 540 | 1353.874 | 1413.733 | 1.404 | 7896.442 |
| Gross Domestic Product (GDP) | yuan/per-capita | 540 | 22,473.797 | 19,595.437 | 2199.173 | 103,684.245 |
Table 2.
Identified resource endowment variables.
| Human Capital Stock | Energy Consumption | Export Rate | Physical Capital Stock | GDP | Carbon Emission | |
|---|---|---|---|---|---|---|
| Fiscal Expenditure | * | * | * | * | * | * |
| CPI | * | * | ||||
| PPI | * | * | * | |||
| Application Rate of fixed assets | * | |||||
| Railway Mileage | * | * | ||||
| Highway Mileage | * | * | ||||
| Wage | * | |||||
| Freight Turnover | * | * | ||||
| Passenger Turnover | * | * | ||||
| Electric rate | * | * | ||||
| R&D Expenditure | * | * | * | * | * | |
| R&D Staff | * |
* The resource endowments have an impact on the evaluation variable; R&D: Research and Development. CPI: consumer price index; PPI: producer price index.
© 2017 by the authors. Licensee MDPI, Basel, Switzerland. This article is an open access article distributed under the terms and conditions of the Creative Commons Attribution (CC BY) license (http://creativecommons.org/licenses/by/4.0/).
Share and Cite
MDPI and ACS Style
Zhao, X.; Zhong, C. Low Carbon Economy Performance Analysis with the Intertemporal Effect of Capital in China. Sustainability 2017, 9, 853. https://doi.org/10.3390/su9050853
AMA Style
Zhao X, Zhong C. Low Carbon Economy Performance Analysis with the Intertemporal Effect of Capital in China. Sustainability. 2017; 9(5):853. https://doi.org/10.3390/su9050853
Chicago/Turabian StyleZhao, Xinna, and Chongwen Zhong. 2017. "Low Carbon Economy Performance Analysis with the Intertemporal Effect of Capital in China" Sustainability 9, no. 5: 853. https://doi.org/10.3390/su9050853
Note that from the first issue of 2016, this journal uses article numbers instead of page numbers. See further details here.