
Assessment of Comprehensive Effects and Optimization of a Circular Economy System of Coal Power and Cement in Kongtong District, Pingliang City, Gansu Province, China


Abstract
:1. Introduction
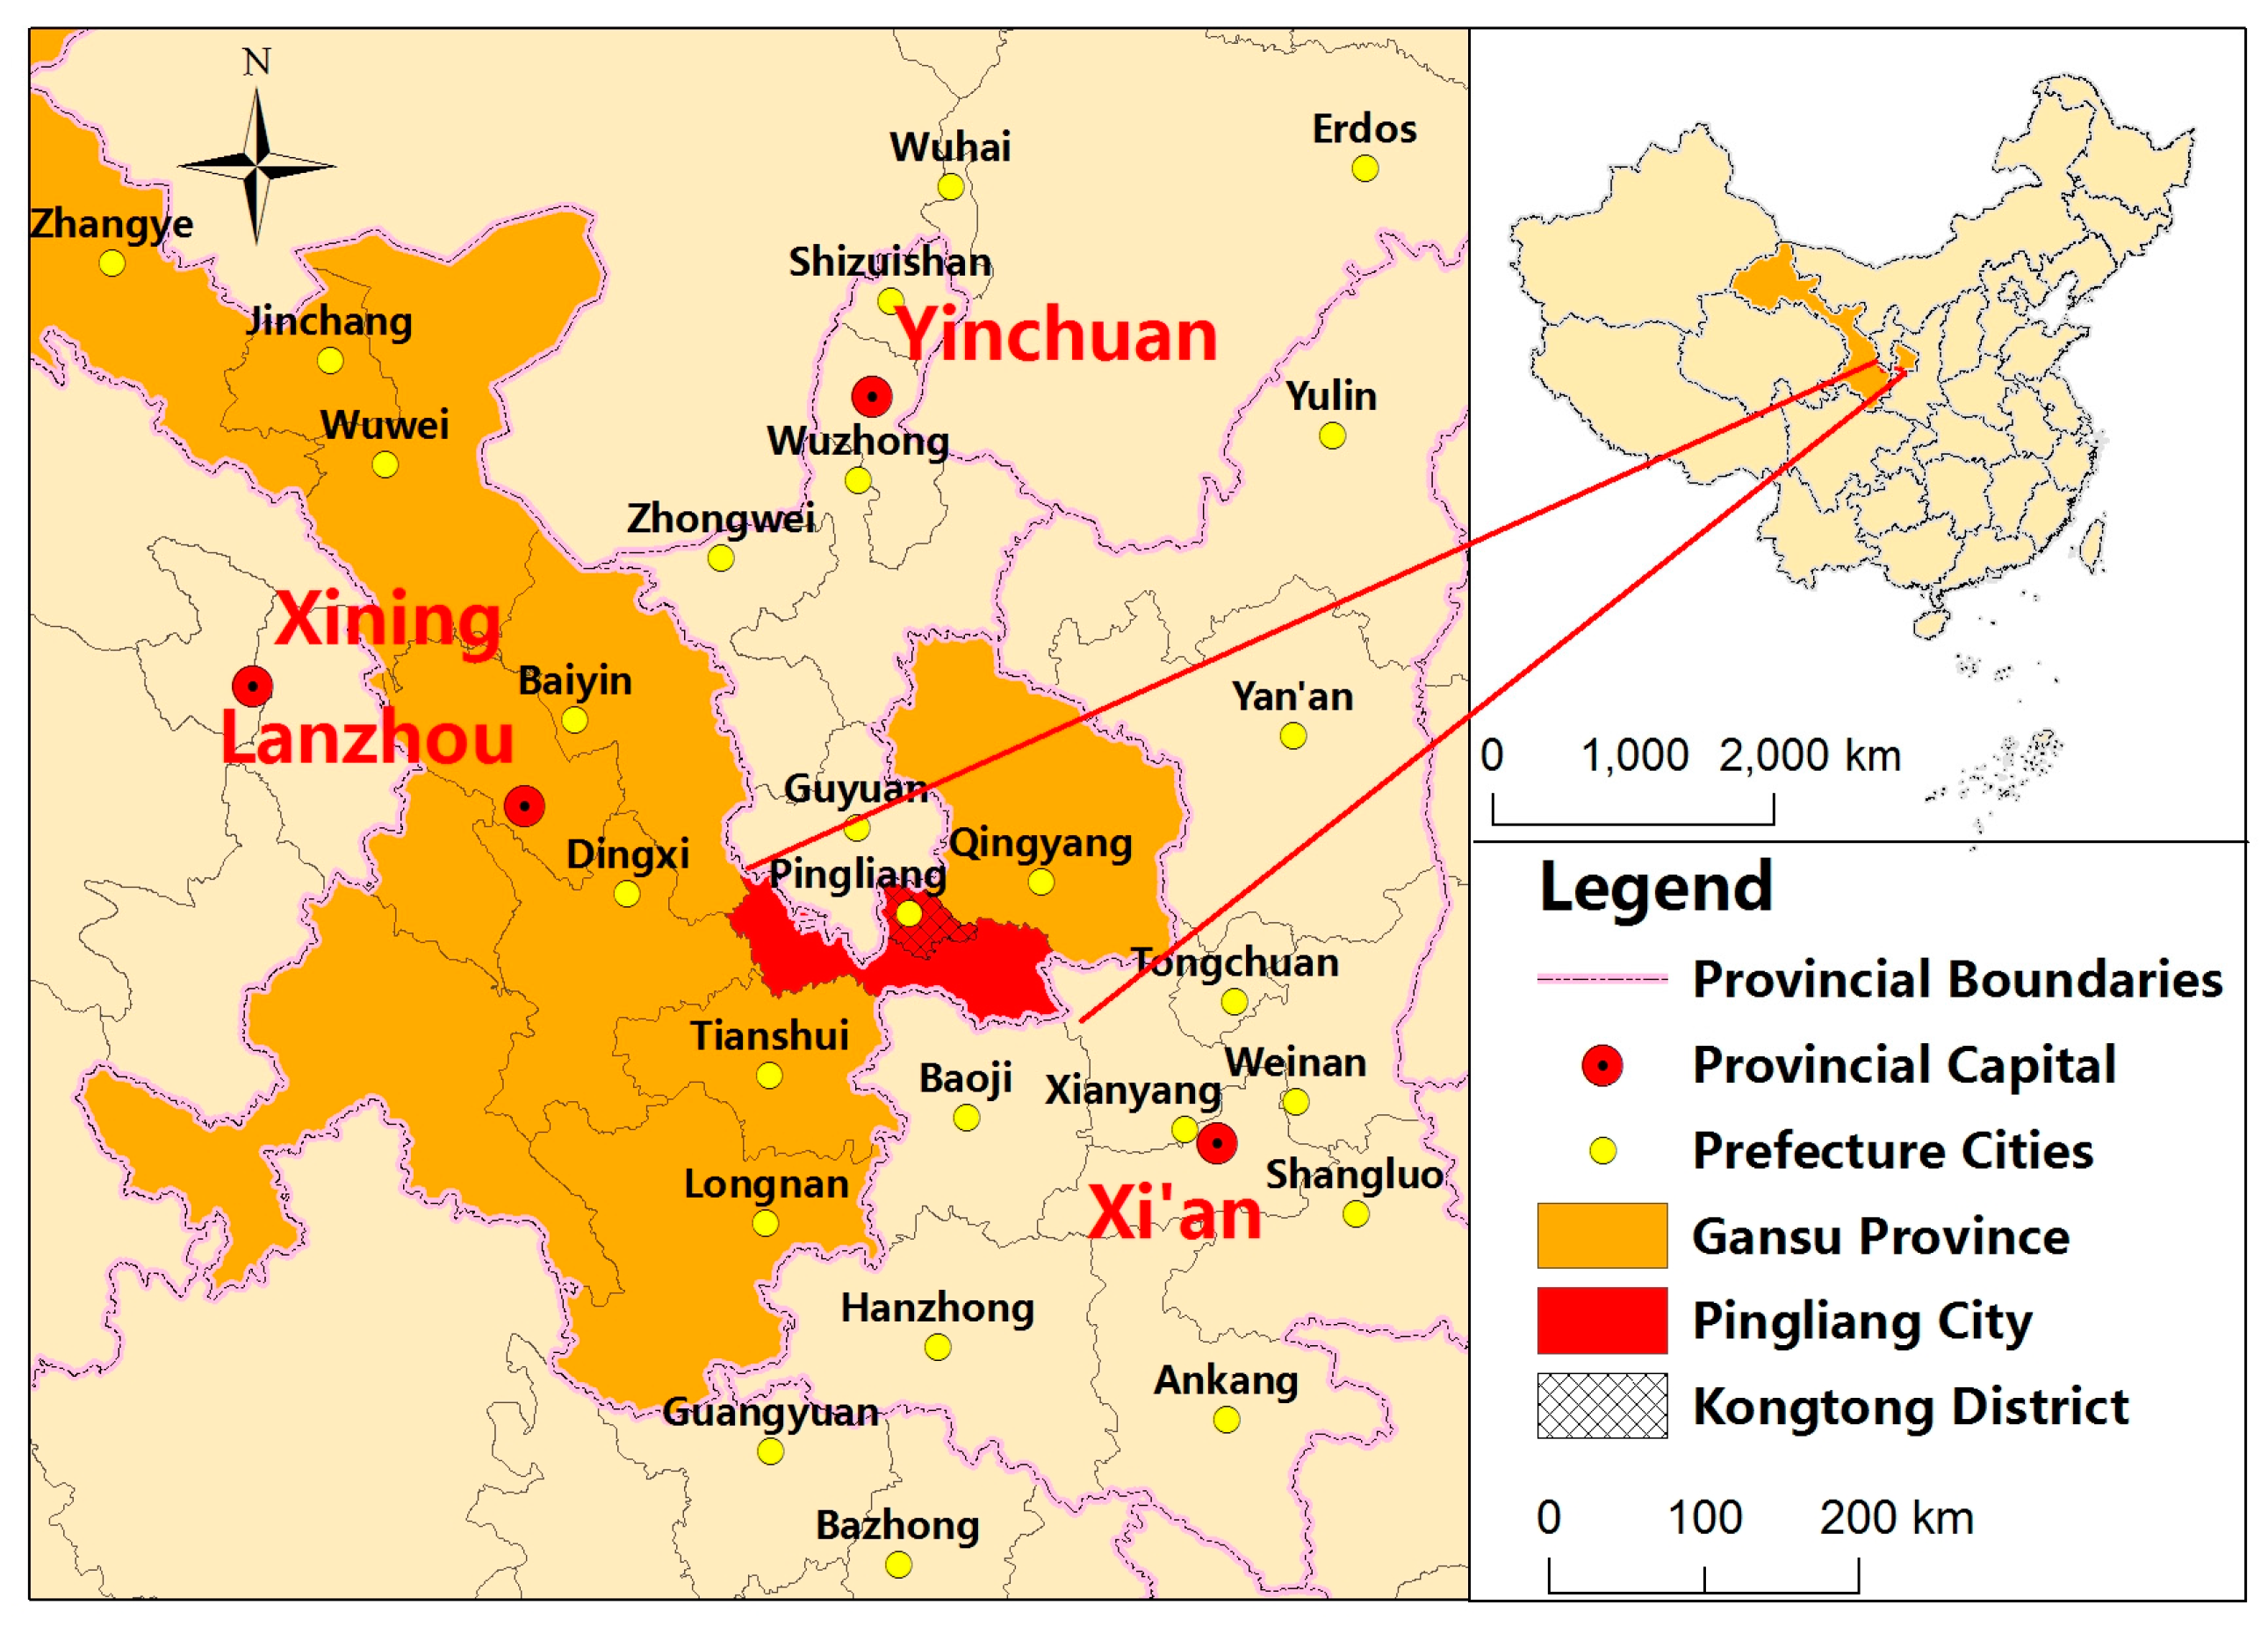
2. Case Study
2.1. Successes Achieved by a CE System of Coal Power and Cement
2.1.1. Circular Utilization of Solid Waste between Coal Power Plants and Building Materials Industries
2.1.2. Utilization of Waste Heat and Height Difference Potential in Cement Plants
2.1.3. Combined Heat and Power Generation and Reclaimed Water Utilization
2.1.4. Taking Municipal Waste as Alternative Fuels for Cement Manufacture
2.2. Market Risks the CE System of Coal Power and Cement May Face
3. Methodology and Data Sources
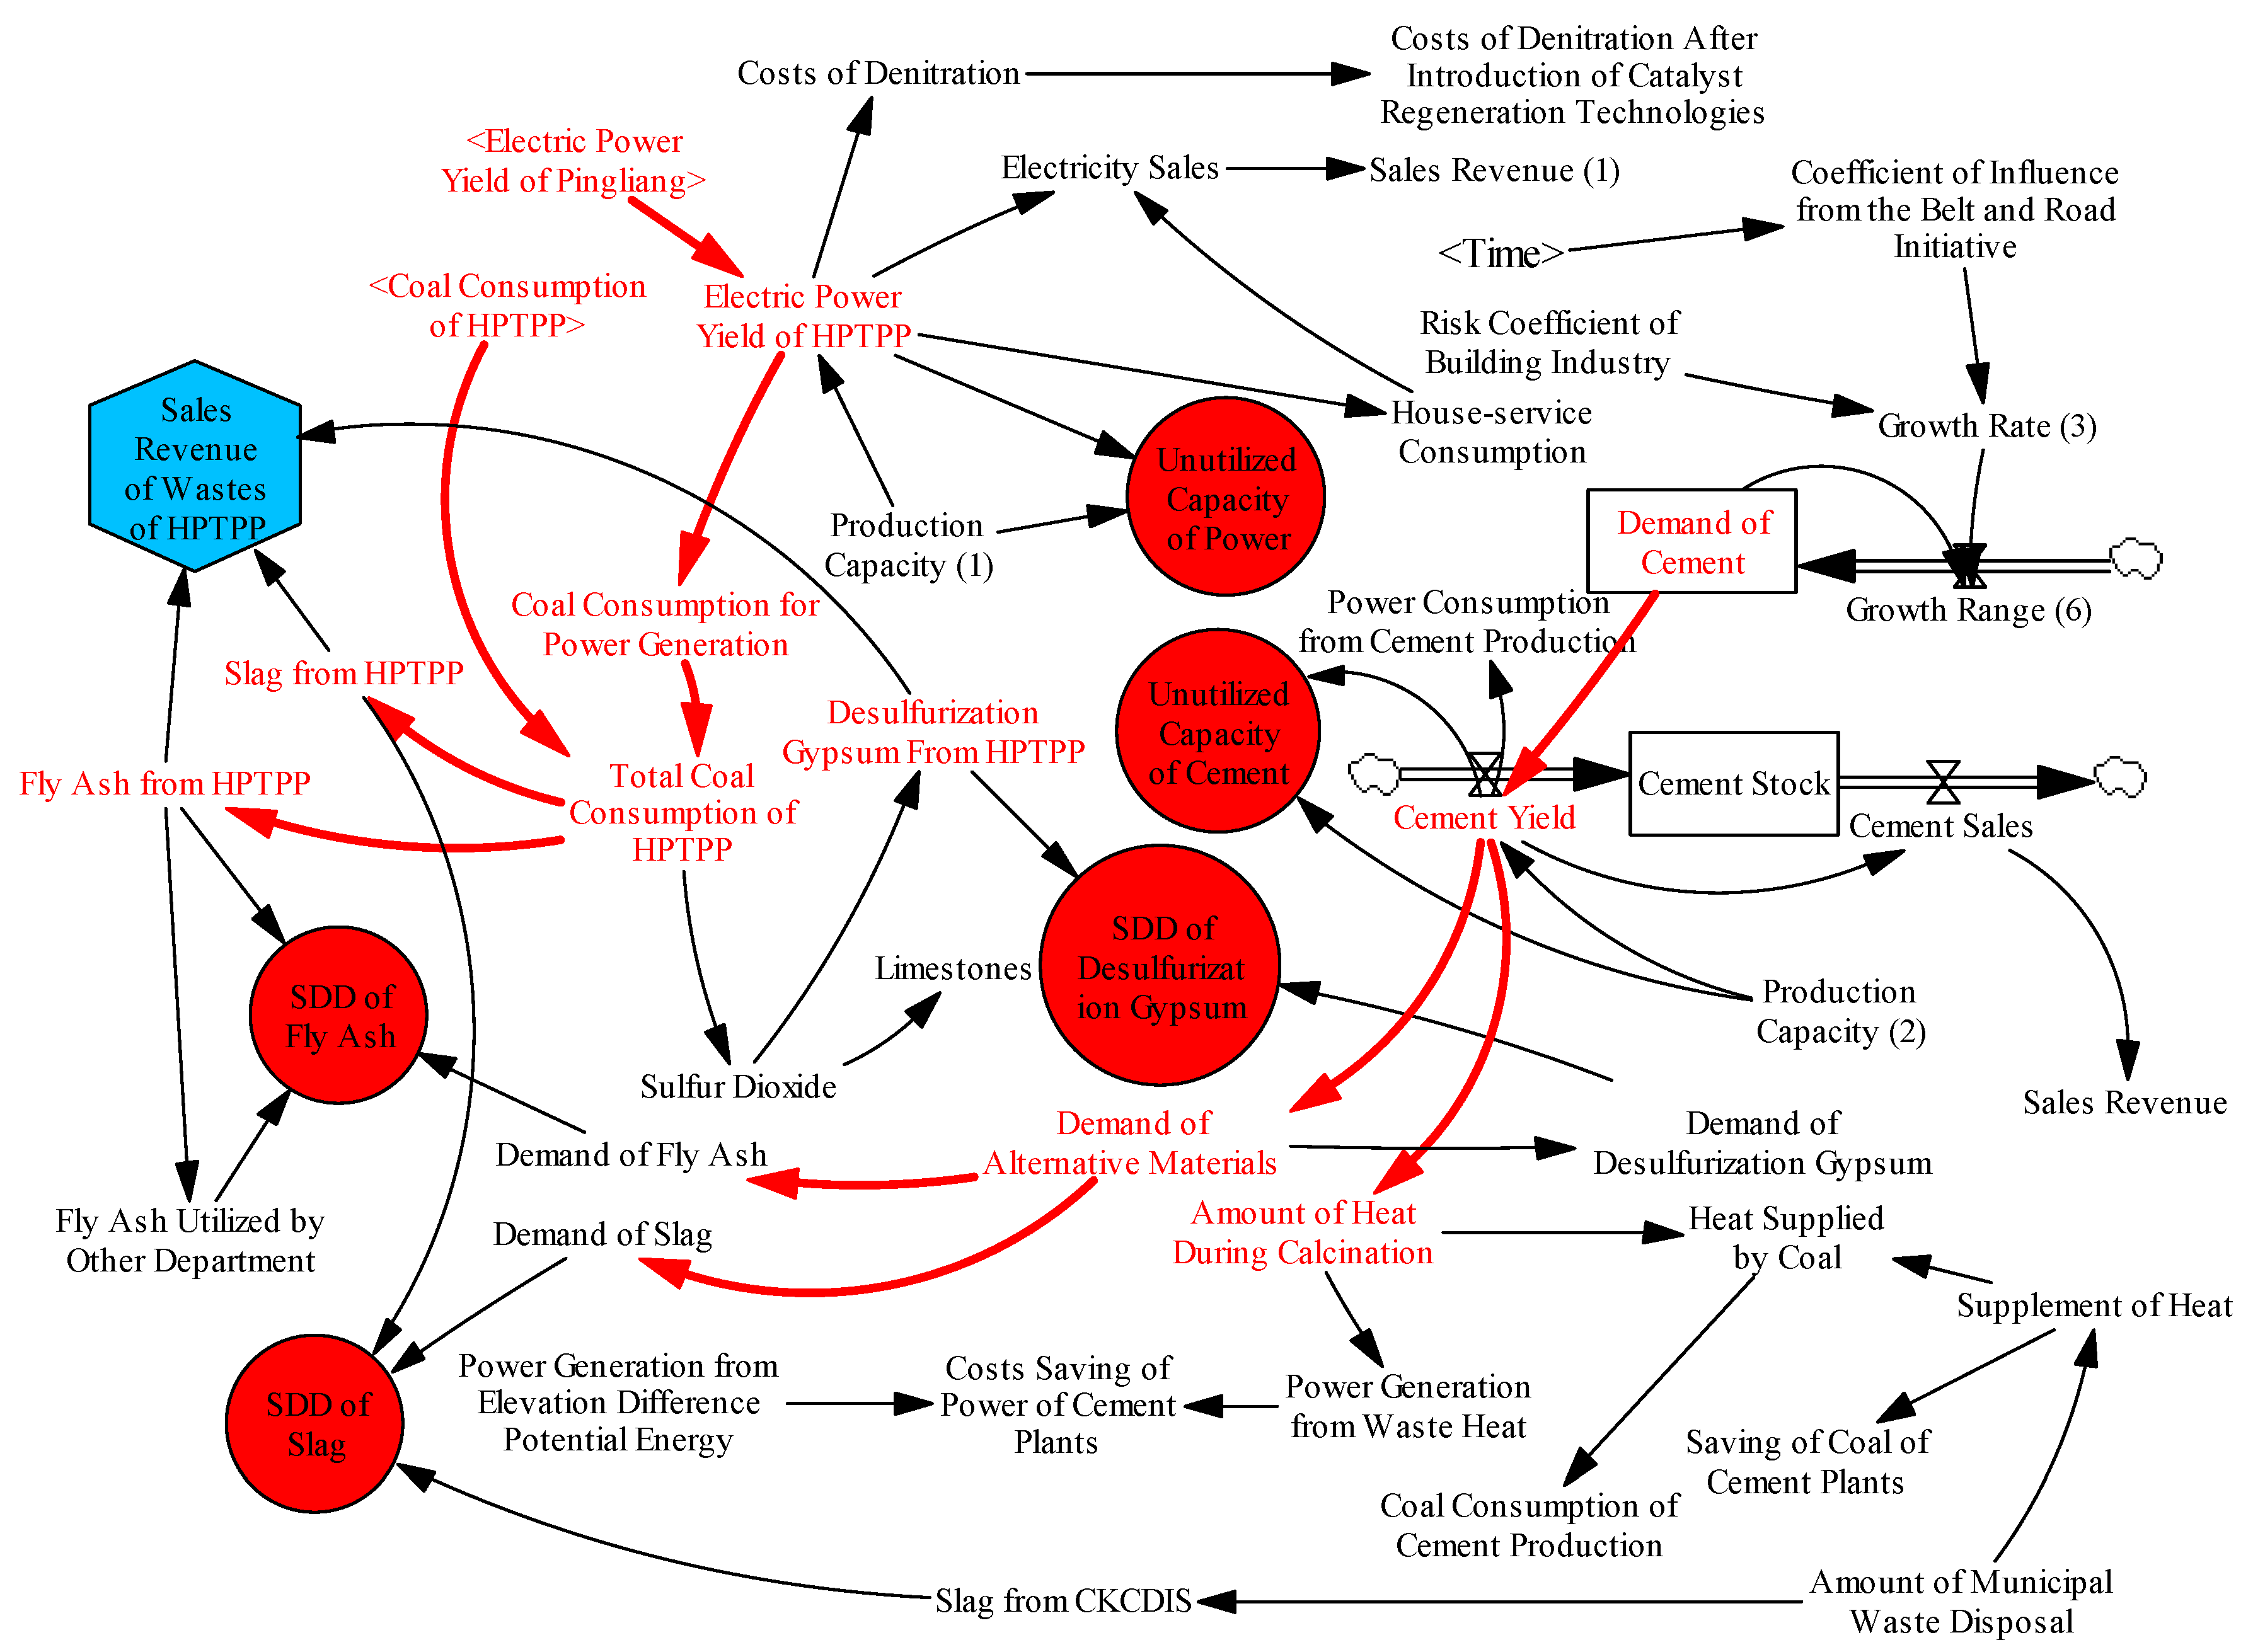
4. Model Description
4.1. Sub-System of Operation Structure
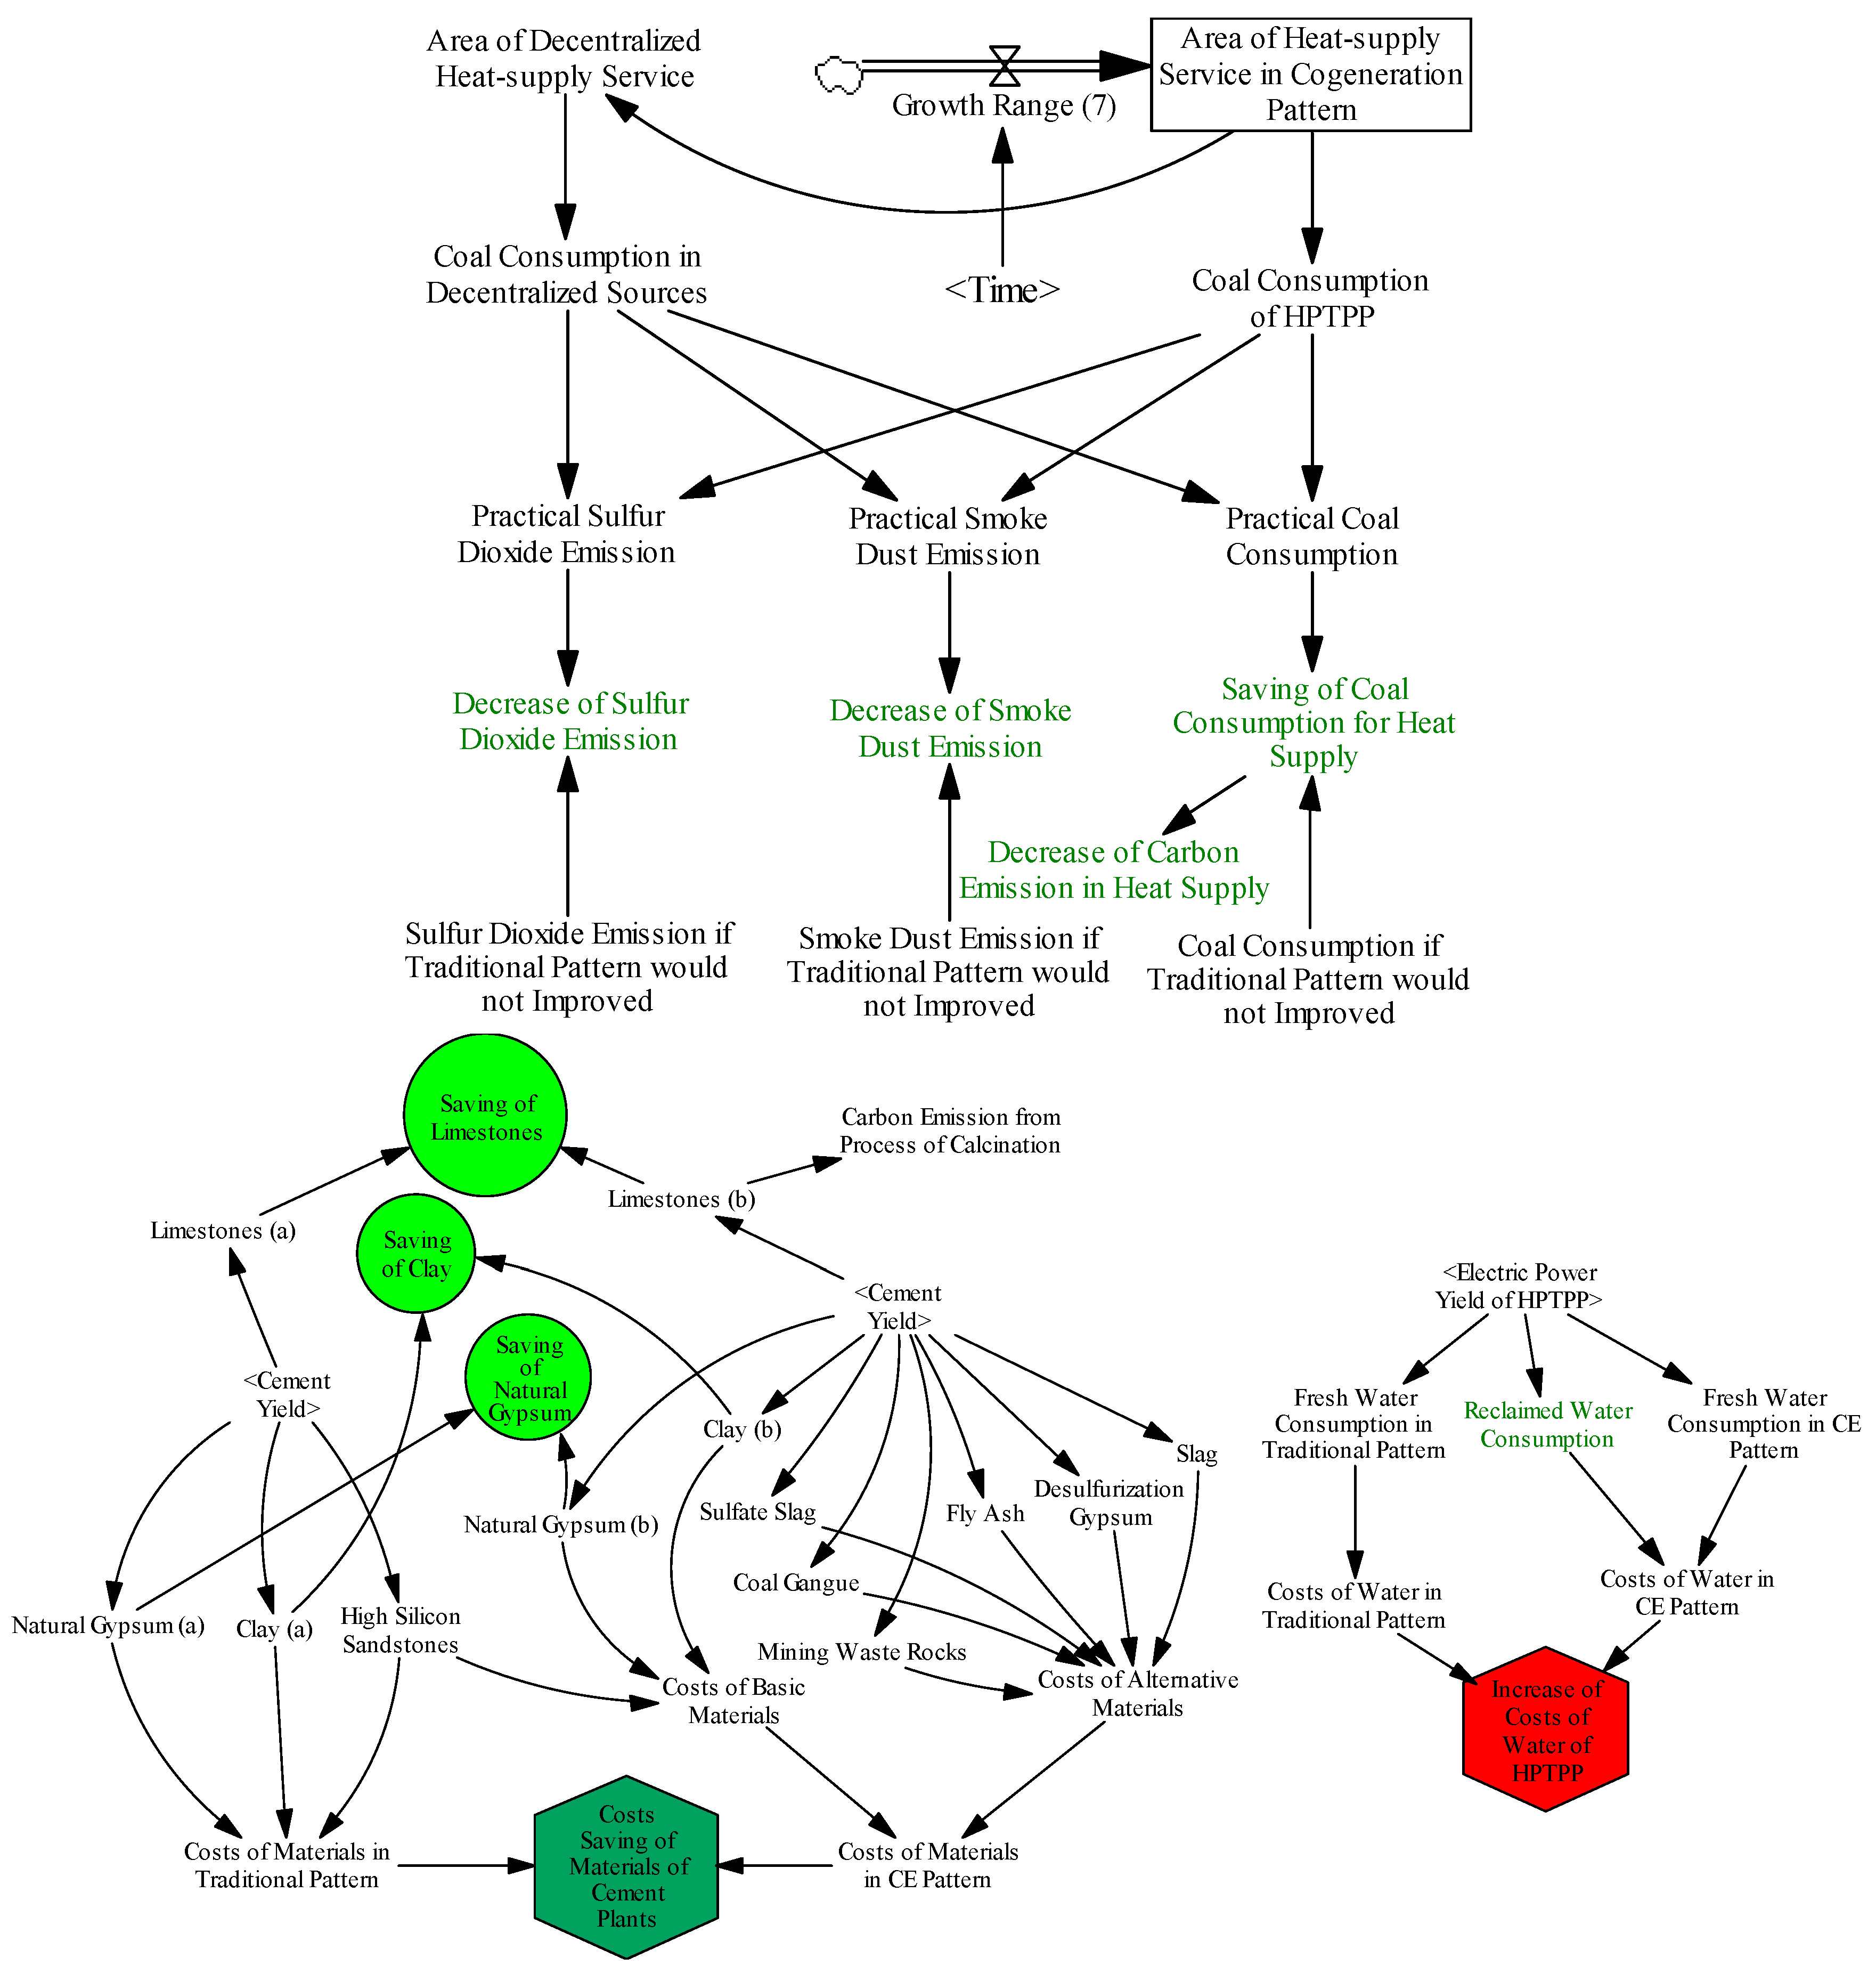
4.2. Sub-System of Ecological and Economic Effects
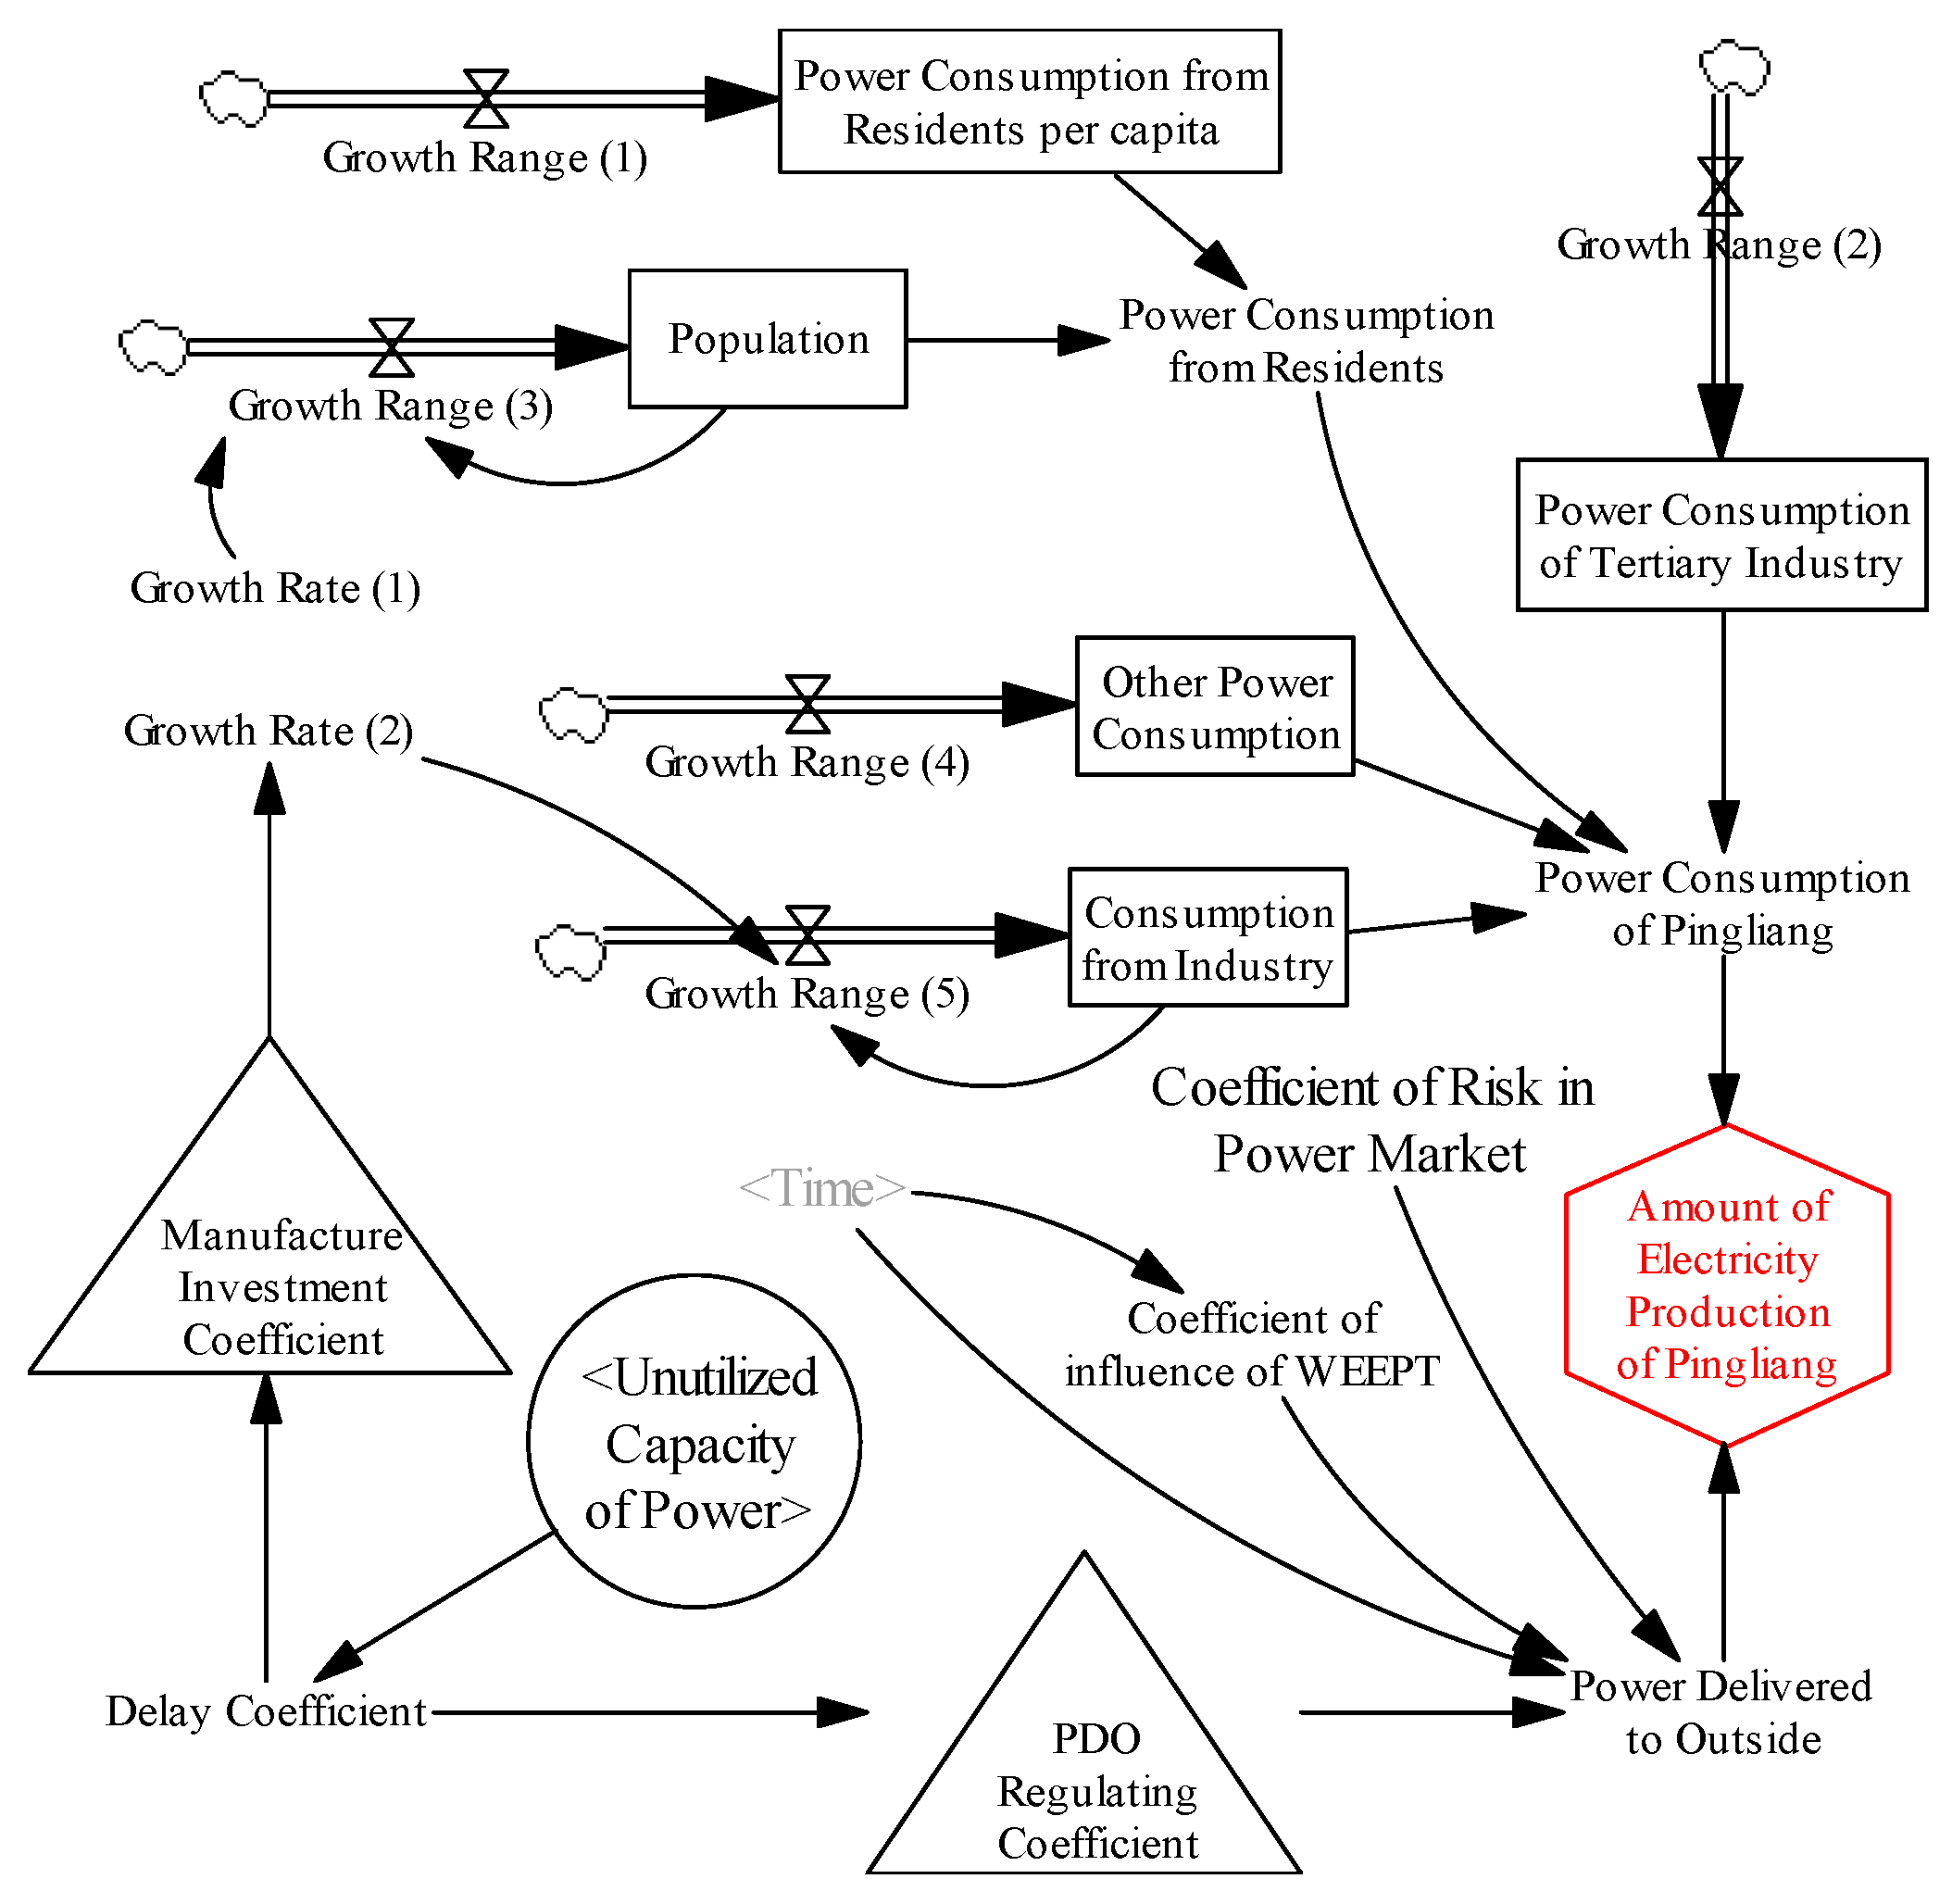
4.3. Sub-System of Market Demand
4.3.1. Sub-System of Market Risks and Solutions Already Taken
4.3.2. Sub-System of Demand of Municipal Heat
5. Results and Analysis
5.1. Analysis on Ecological Effects
5.2. Analysis on Economic Effects
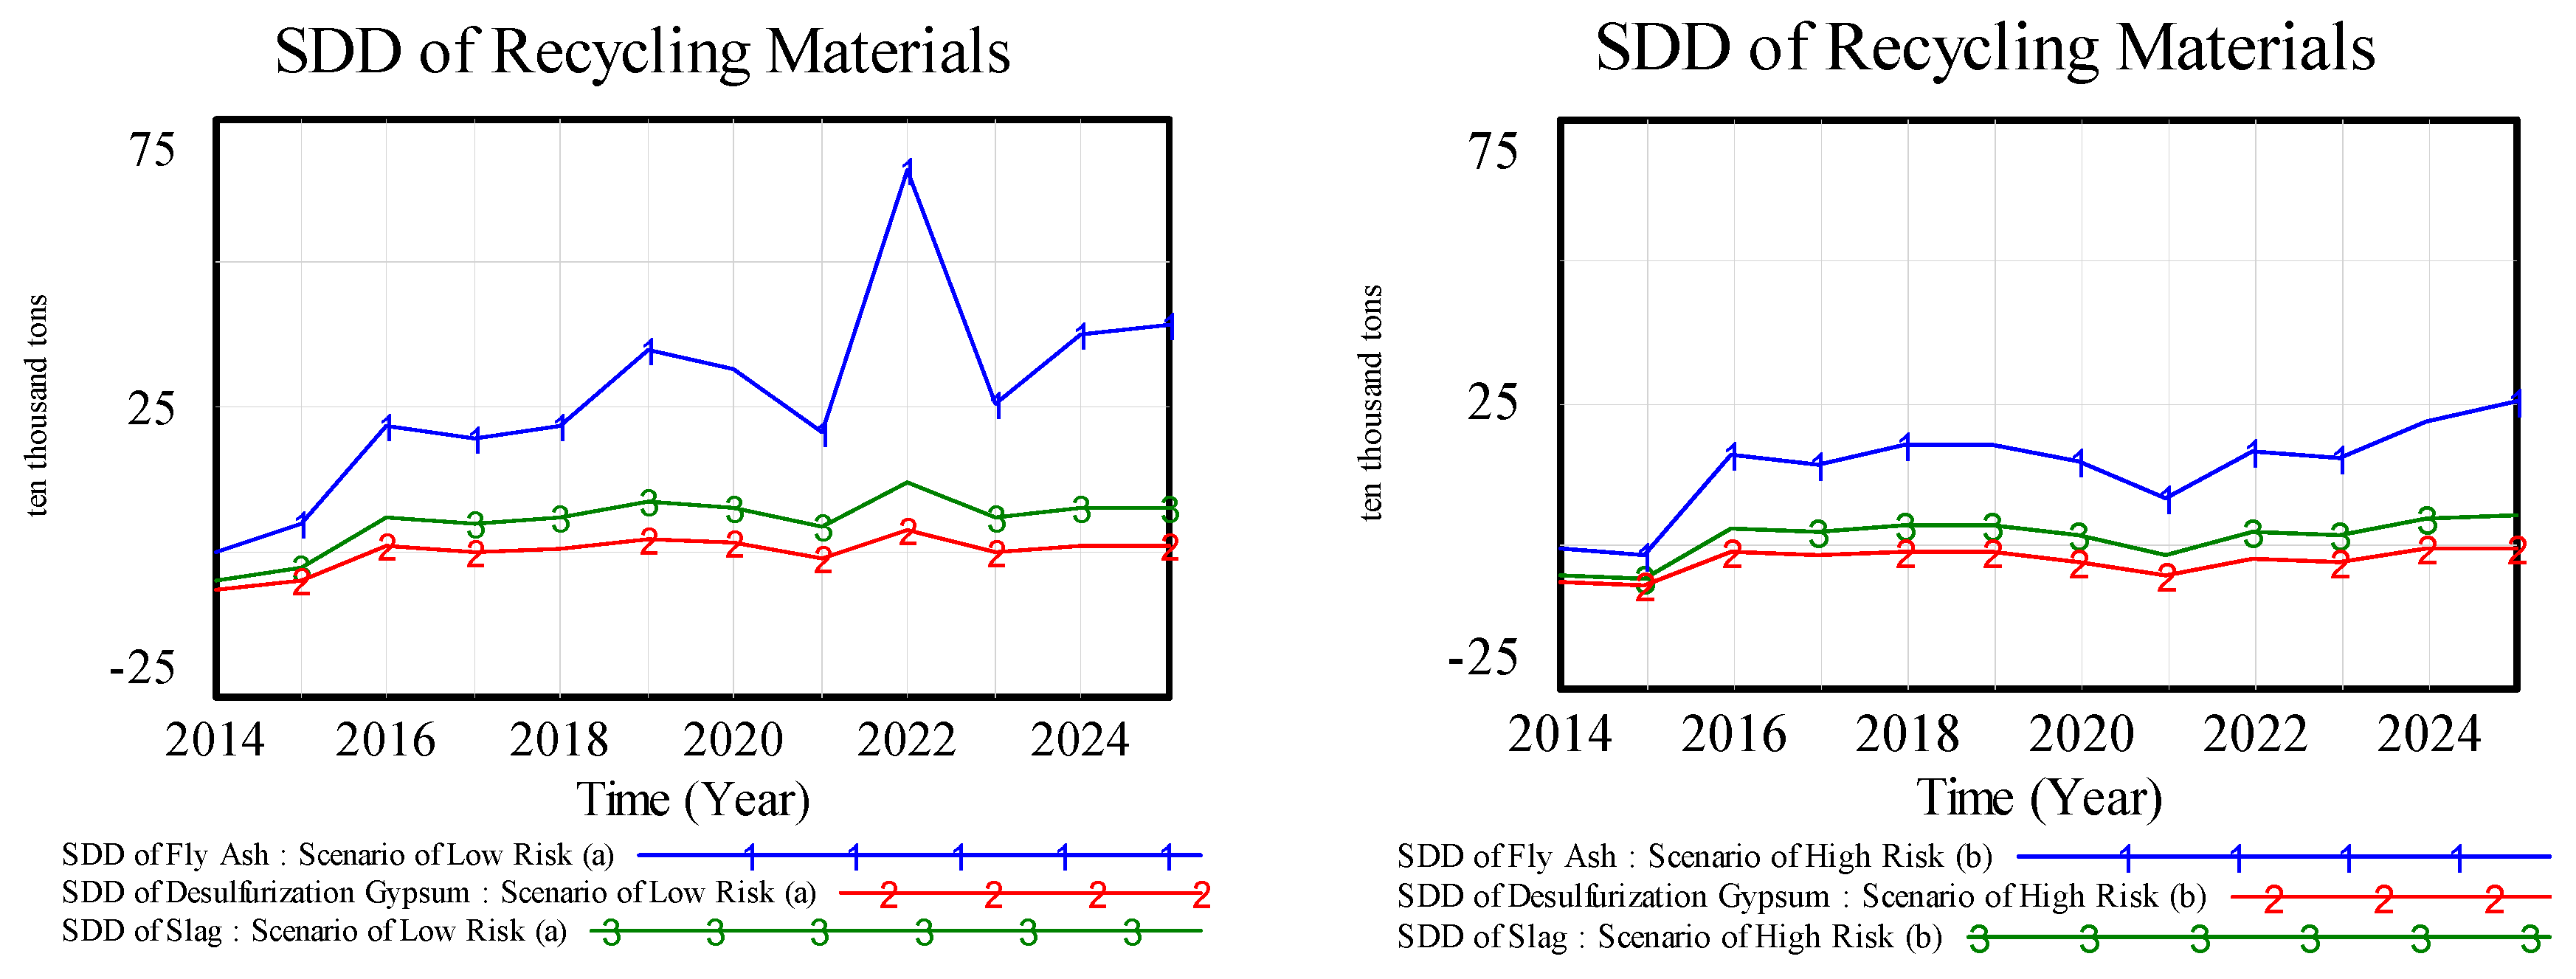
5.3. Analysis of Supply and Demand Conflicts of Recycling Wastes
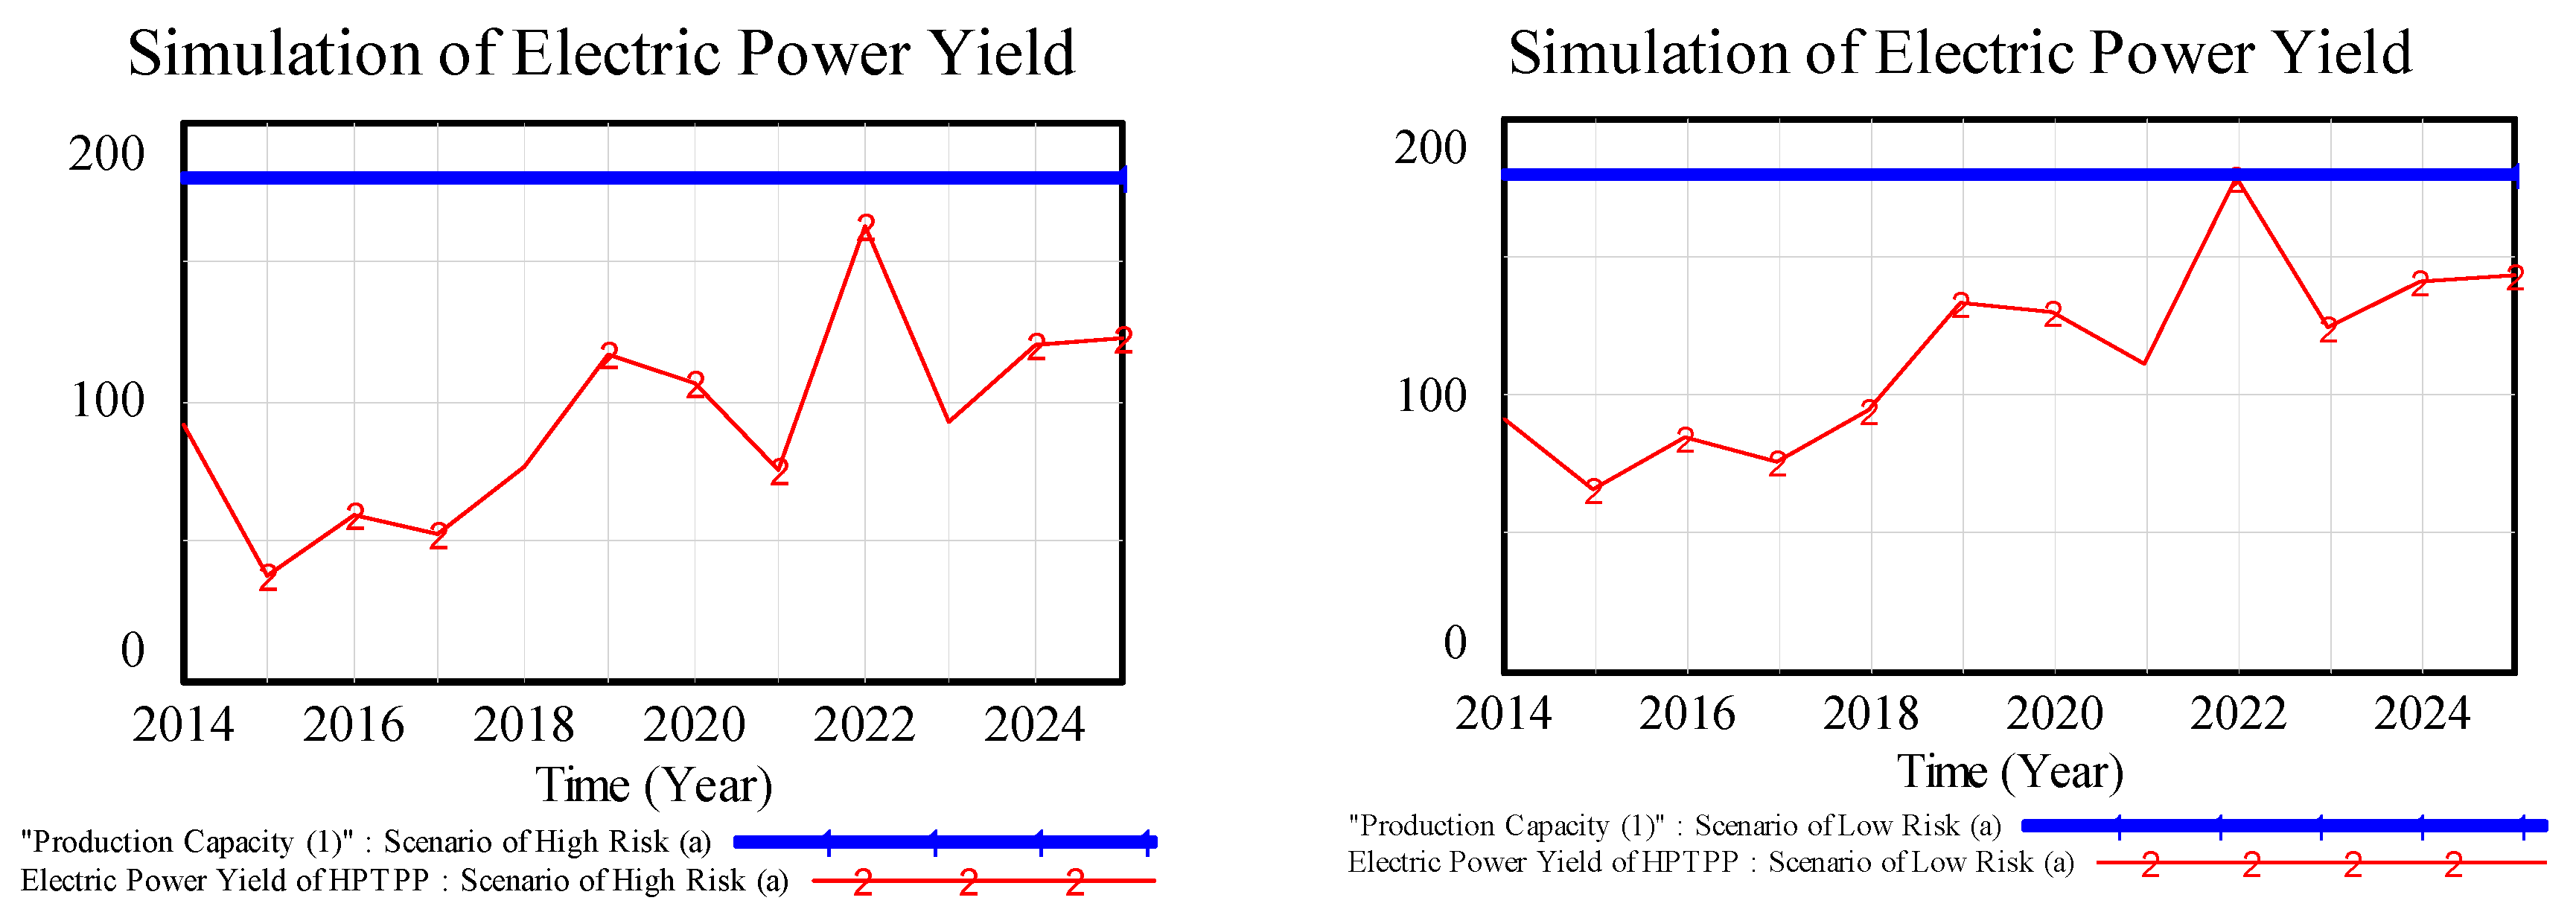
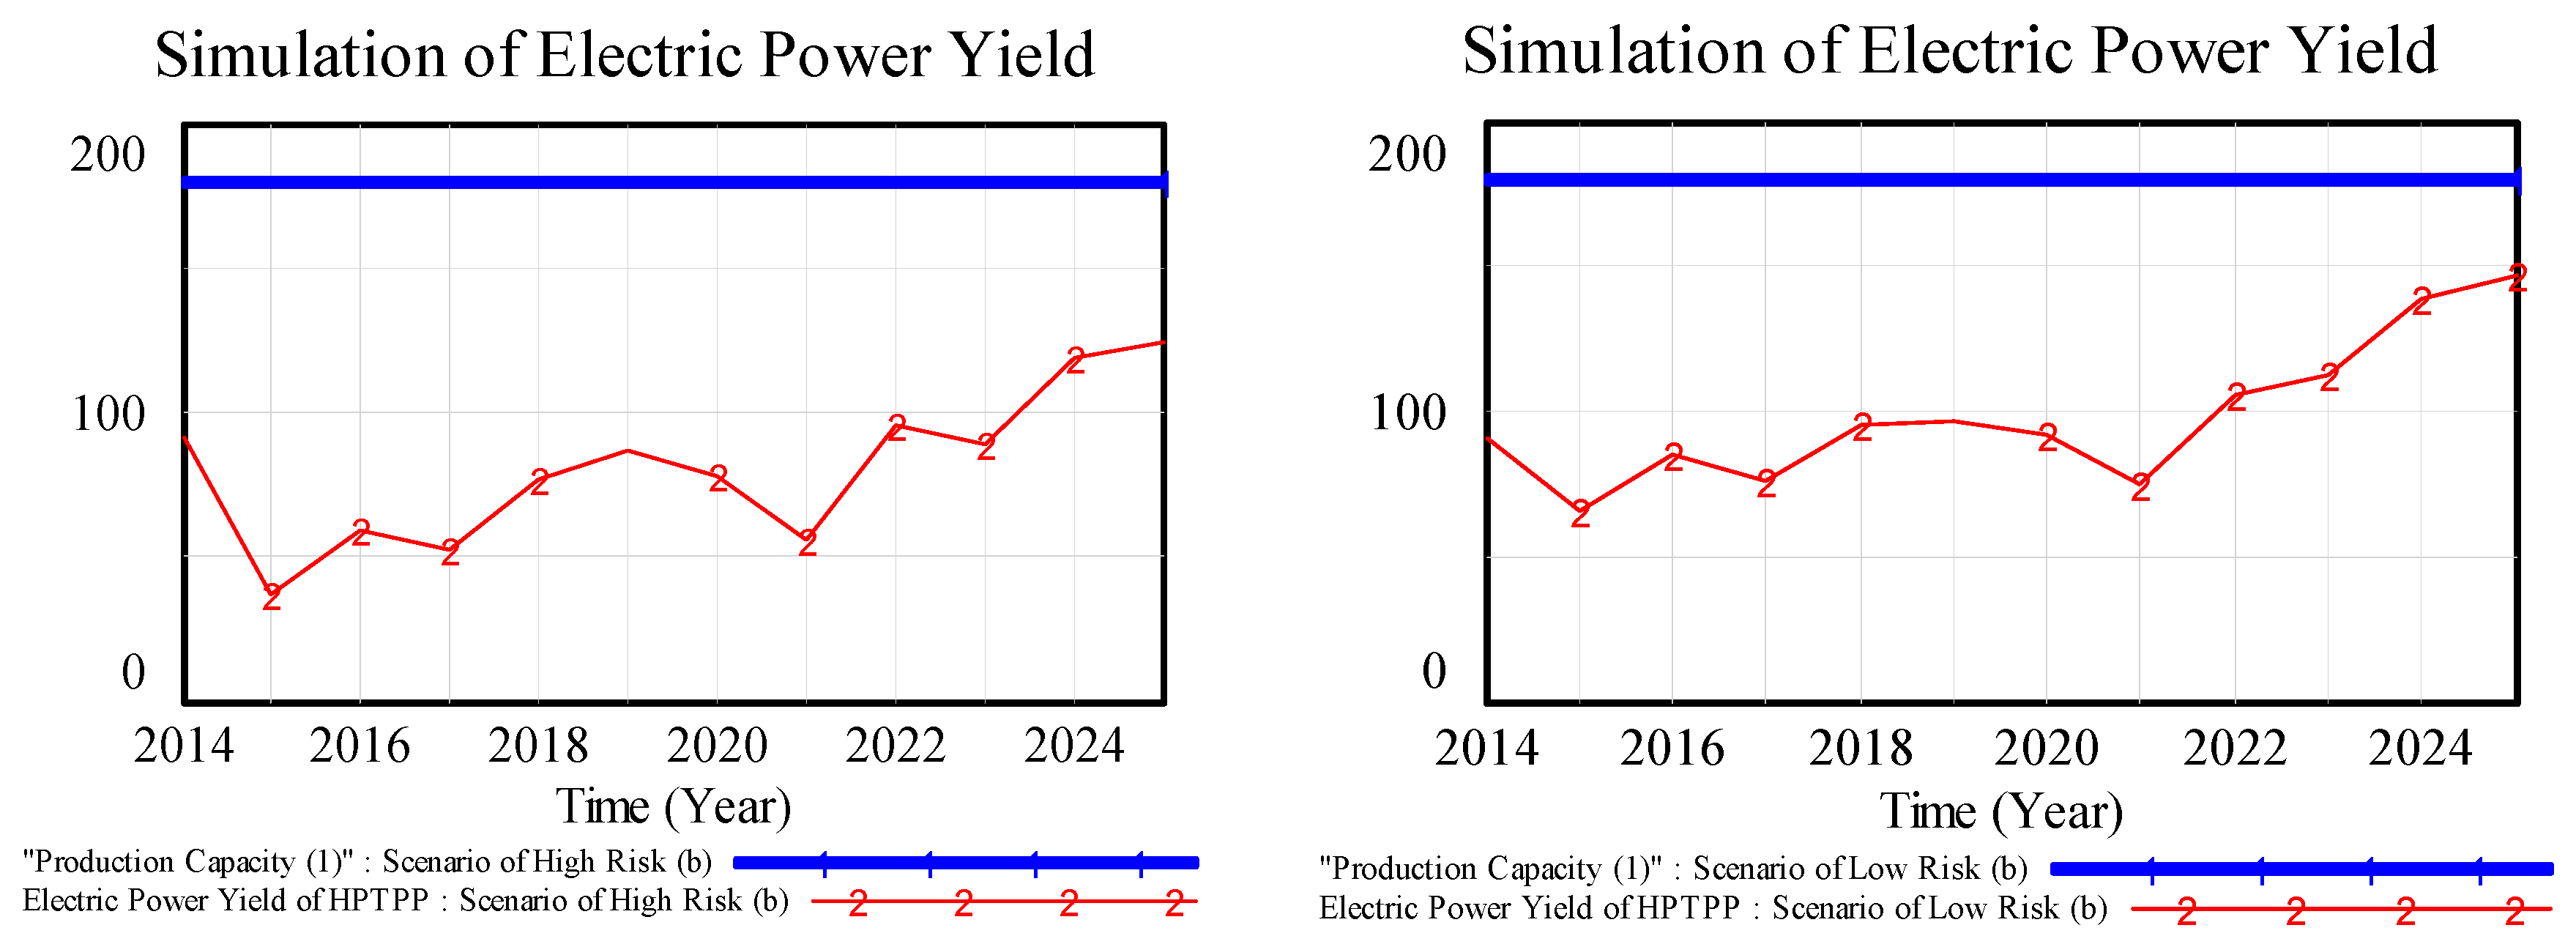
5.4. Analysis on Market Risks
6. Optimization Measures of Industrial Symbiosis System
6.1. Improving Waste-Heat Utilization of Coal Power Plant
6.2. Extending Categories of Alternative Raw Materials and Fuels for Cement Production
6.3. Promoting the Local Demand of Power through Introduction of Enterprises with High Power-Dependence
6.4. Optimizing the Denitration Equipment of HPTPP
6.5. Further Extending the CE System
7. Discussion and Conclusions
- (1)
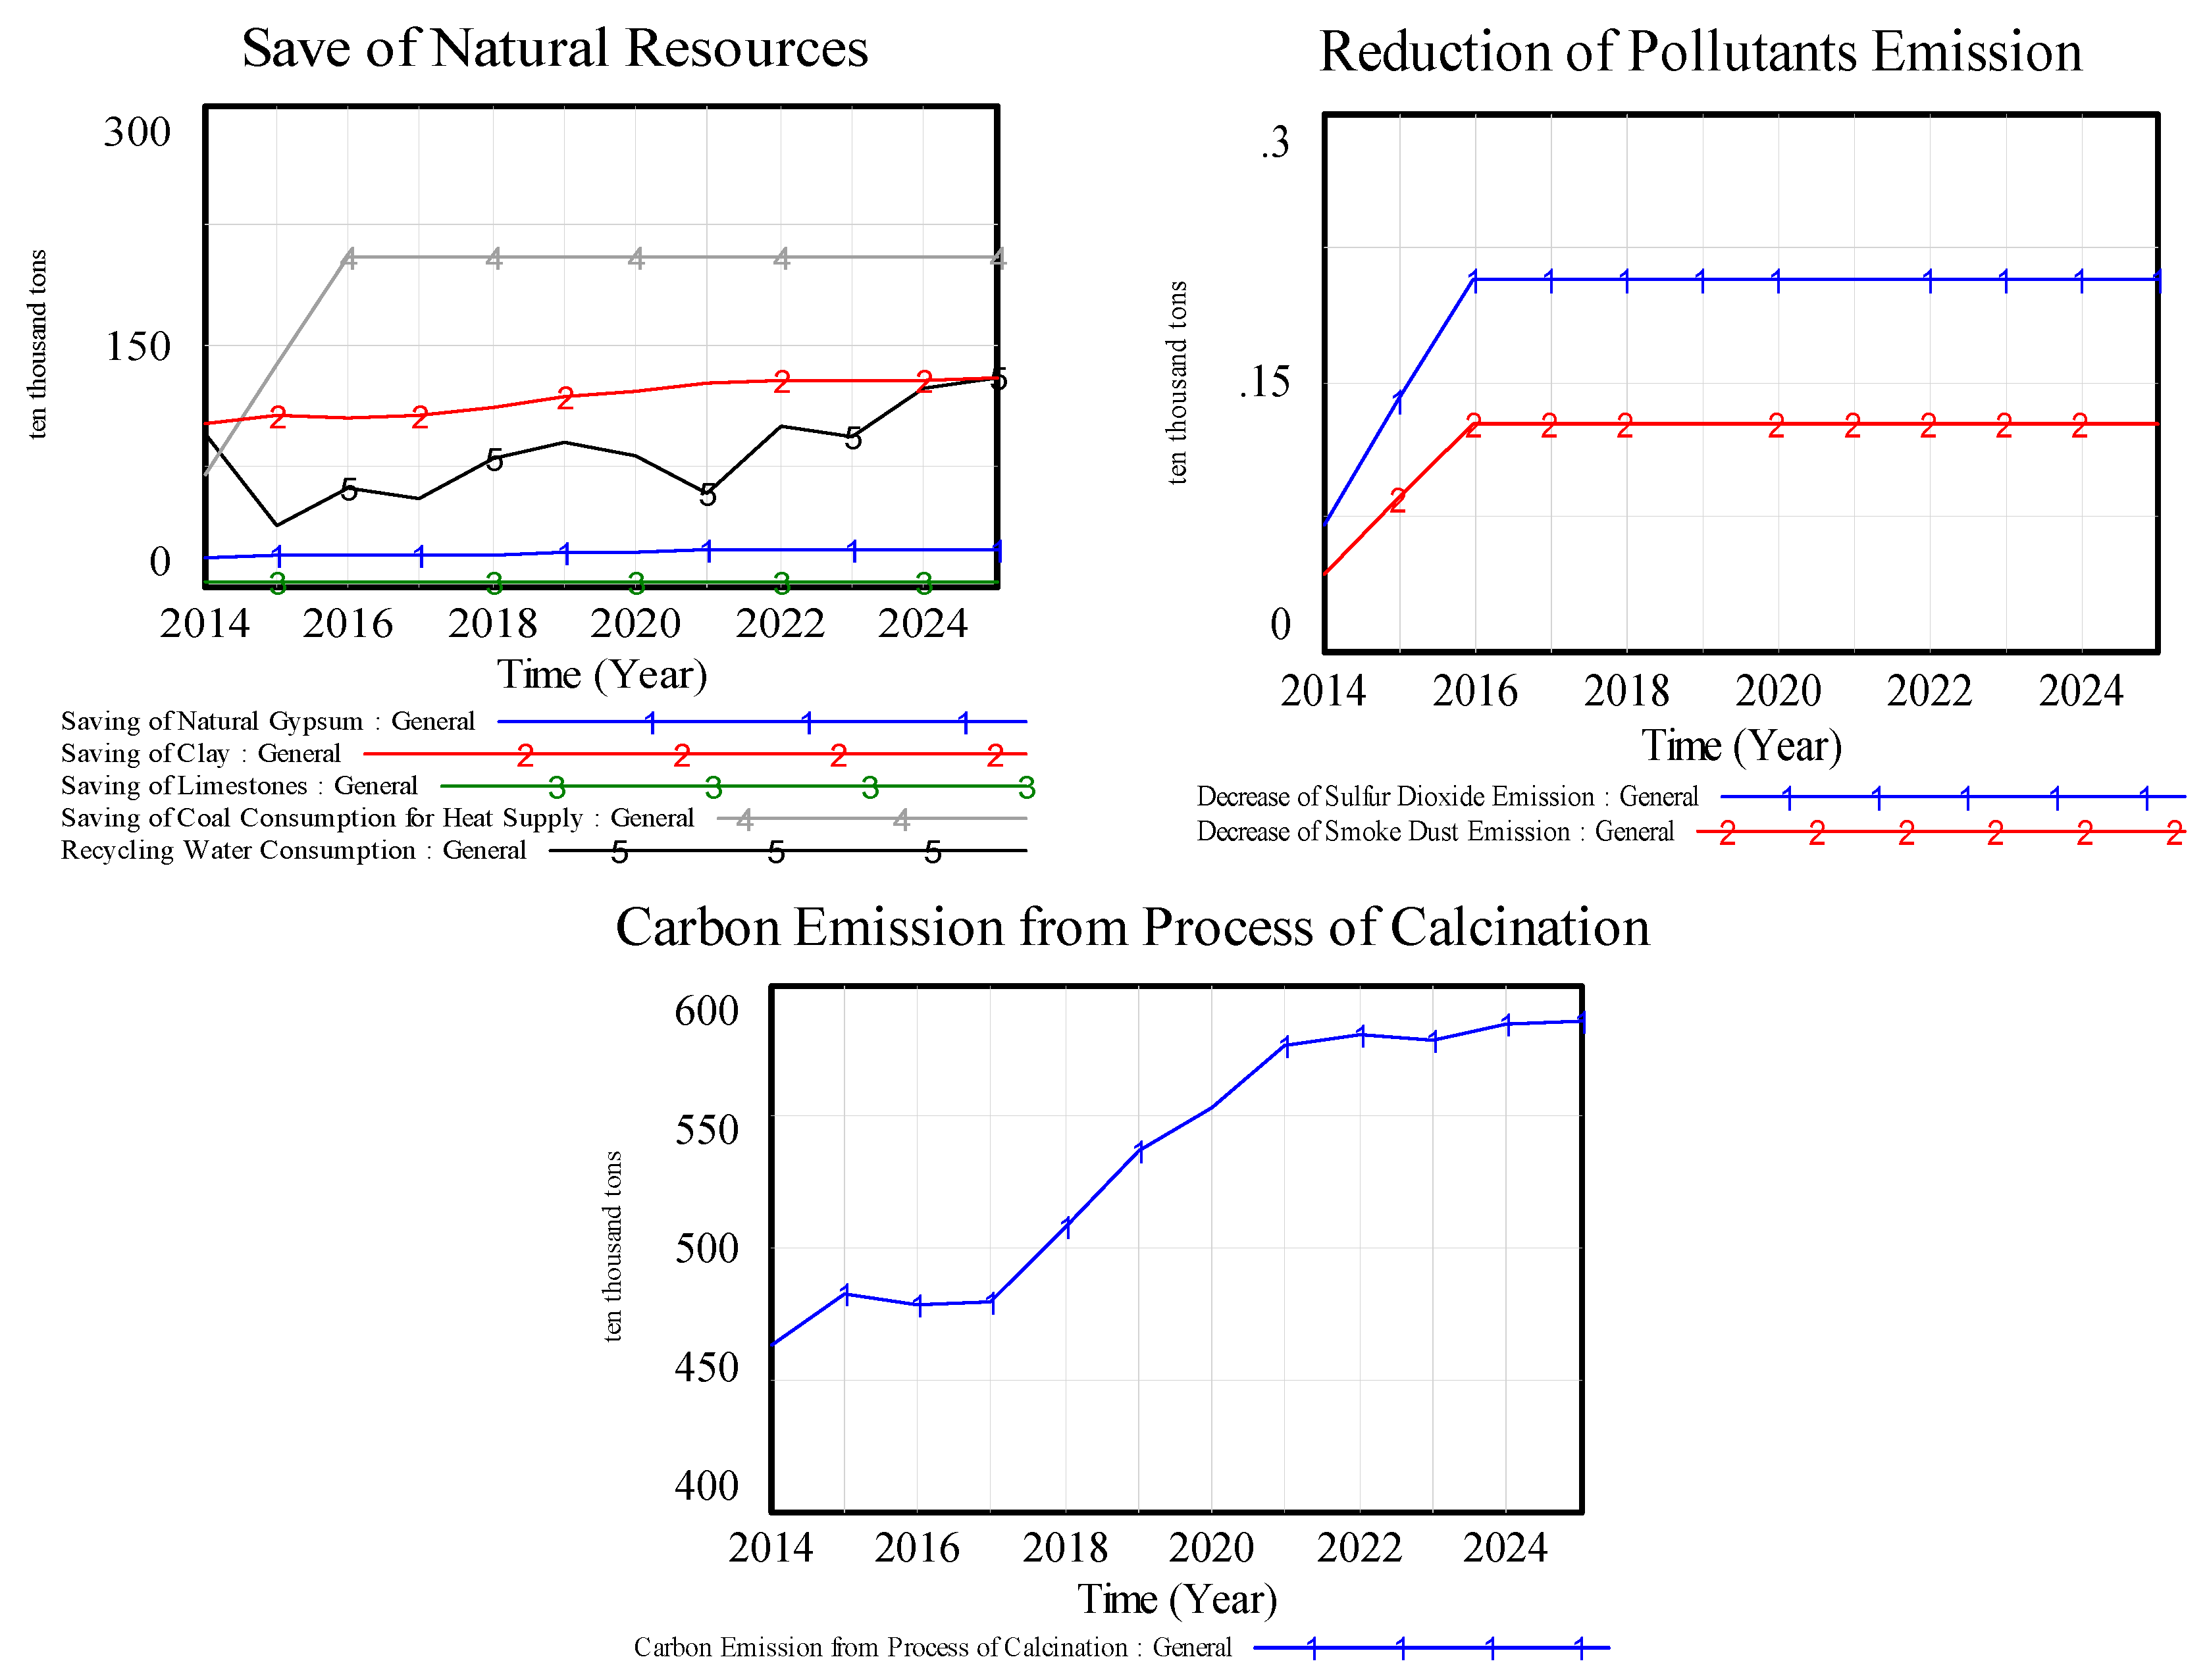
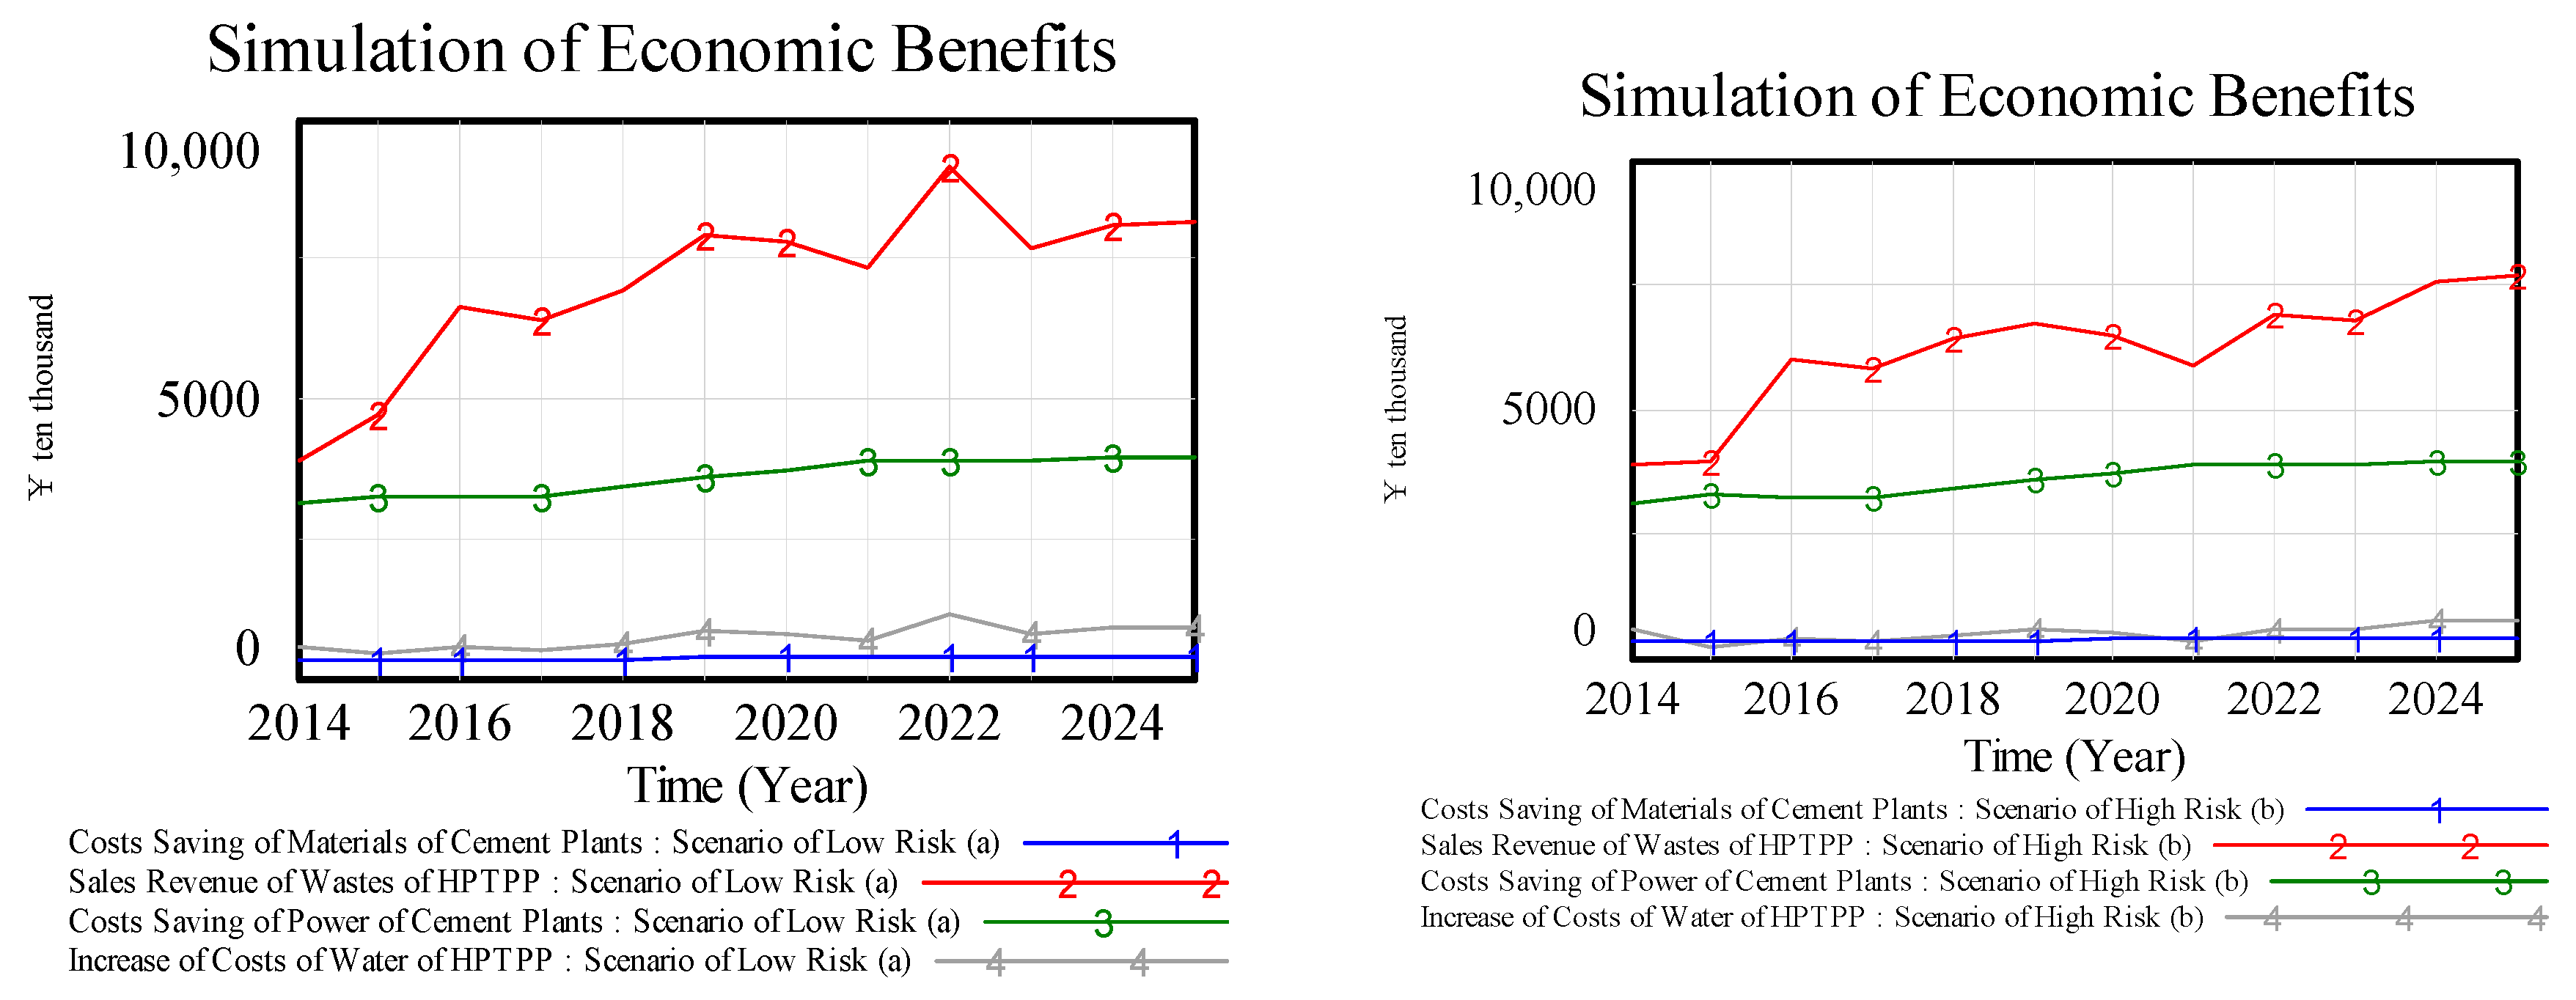
- The simulation results show that through the efficient eco-design of the supply chain, the recycling of solid waste and waste heat can create huge benefits for the coal power and cement plants. The sales revenue of solid waste from the HPTPP can reach over RMB 80 million per year at the highest level. Waste heat and height difference energy power generation can make up 30% of power consumption of cement plants, and these benefits drive enterprises to positively develop or introduce advanced technology. Meanwhile, the CE system can also contribute to the sustainable development of Kongtong through saving mineral resources, reducing carbon emissions, and improving air quality. During 2014–2025, an accumulated total of 14.11 million t of natural gypsum and 22.67 million t of coal can be saved; as well as reductions in SO2 and dust will reach 22.8 and 13.9 thousand t, respectively.
- (2)
- For industrial symbiosis based on the coal power industry, market risks caused by macroeconomics and the tendency of the national energy policy towards clean energy are considered negative factors. Over capacity and heavy losses of upstream enterprises, the serious SDD of recycling waste may further result in the collapse of a CE system. The sustainable development of CE cannot be separated from effective macro regulation, including the reasonable distribution of industrial symbiosis. Supportive projects, such as China’s WEETP and policies of promoting industrial spatial transfer, are crucial in assisting the stability of the CE system of coal power and cement. The introduction of enterprises with intensive uses of power is a feasible way of stimulating local power consumption.
- (3)
- Optimization measures can theoretically further improve the ecological and economic effects. In the future, the heat efficiency of coal power plants, the carbon emission reduction in the cement production process, and the optimization of the denitration equipment are important optimization elements which need to be further studied.
- (4)
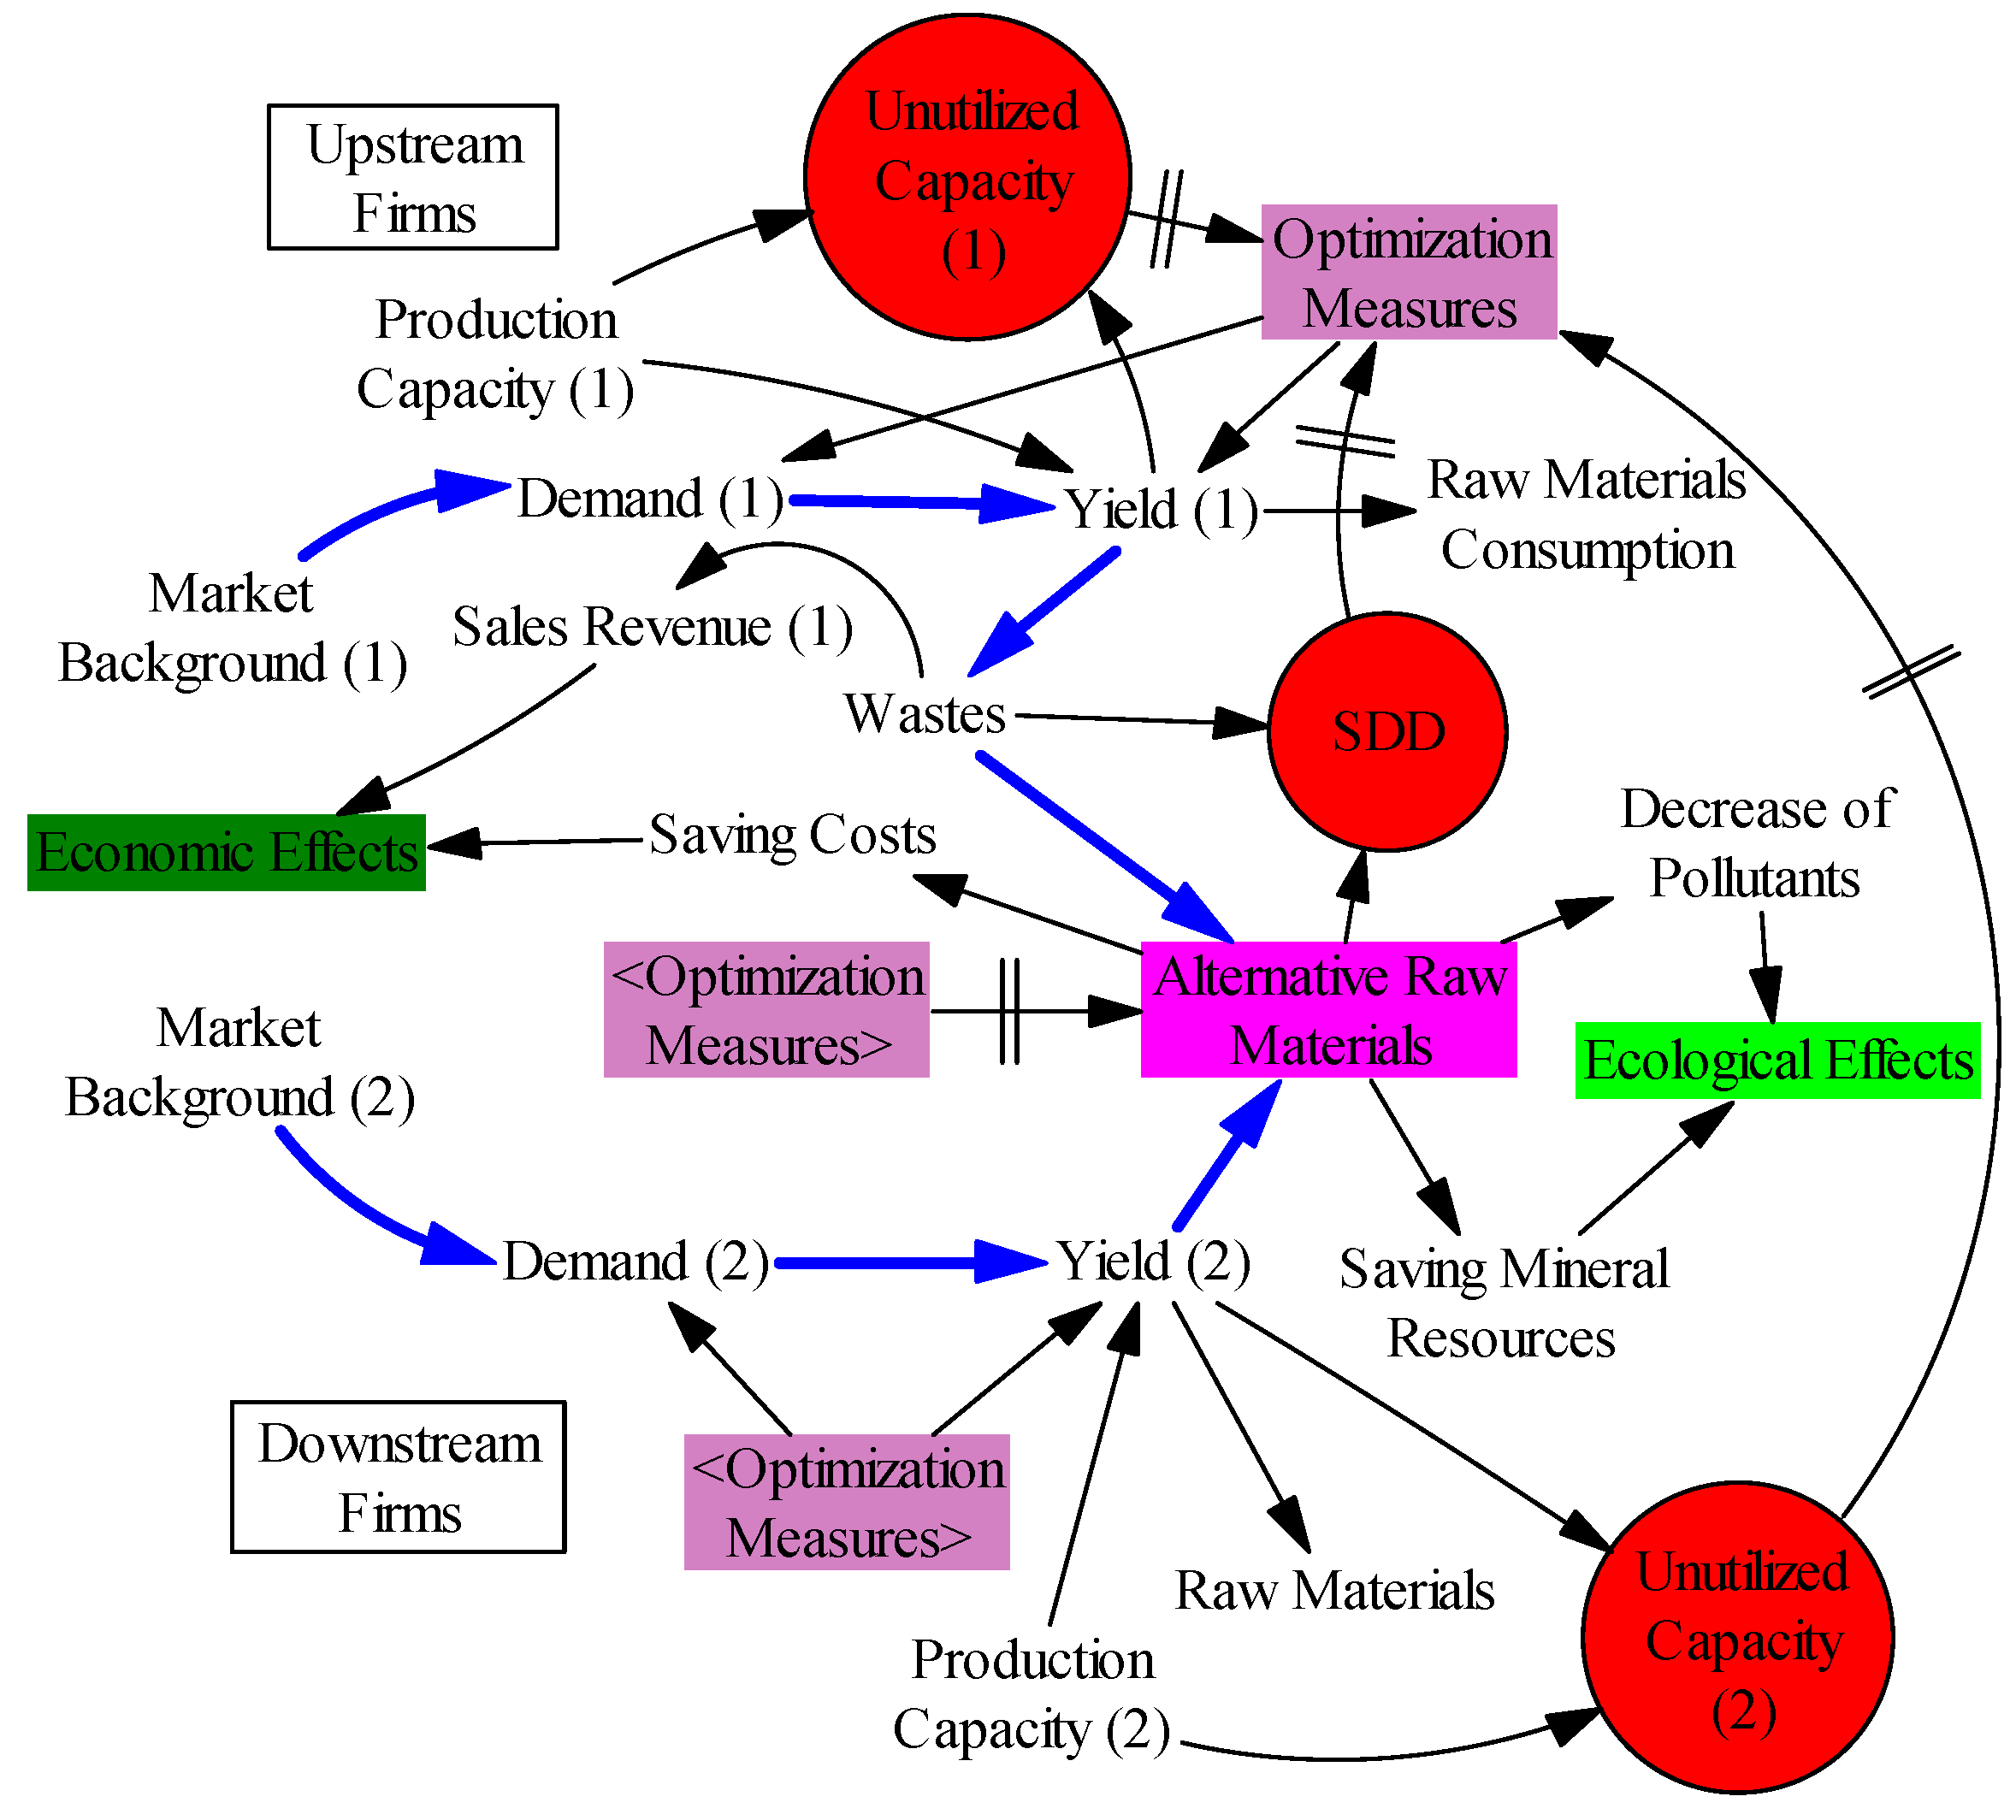
- The SD method has high application value in the field of CE research as it can help researchers understand complicated causal associations in the production process of industrial symbiosis and simulate future scenarios through friendly visualization.
- (5)
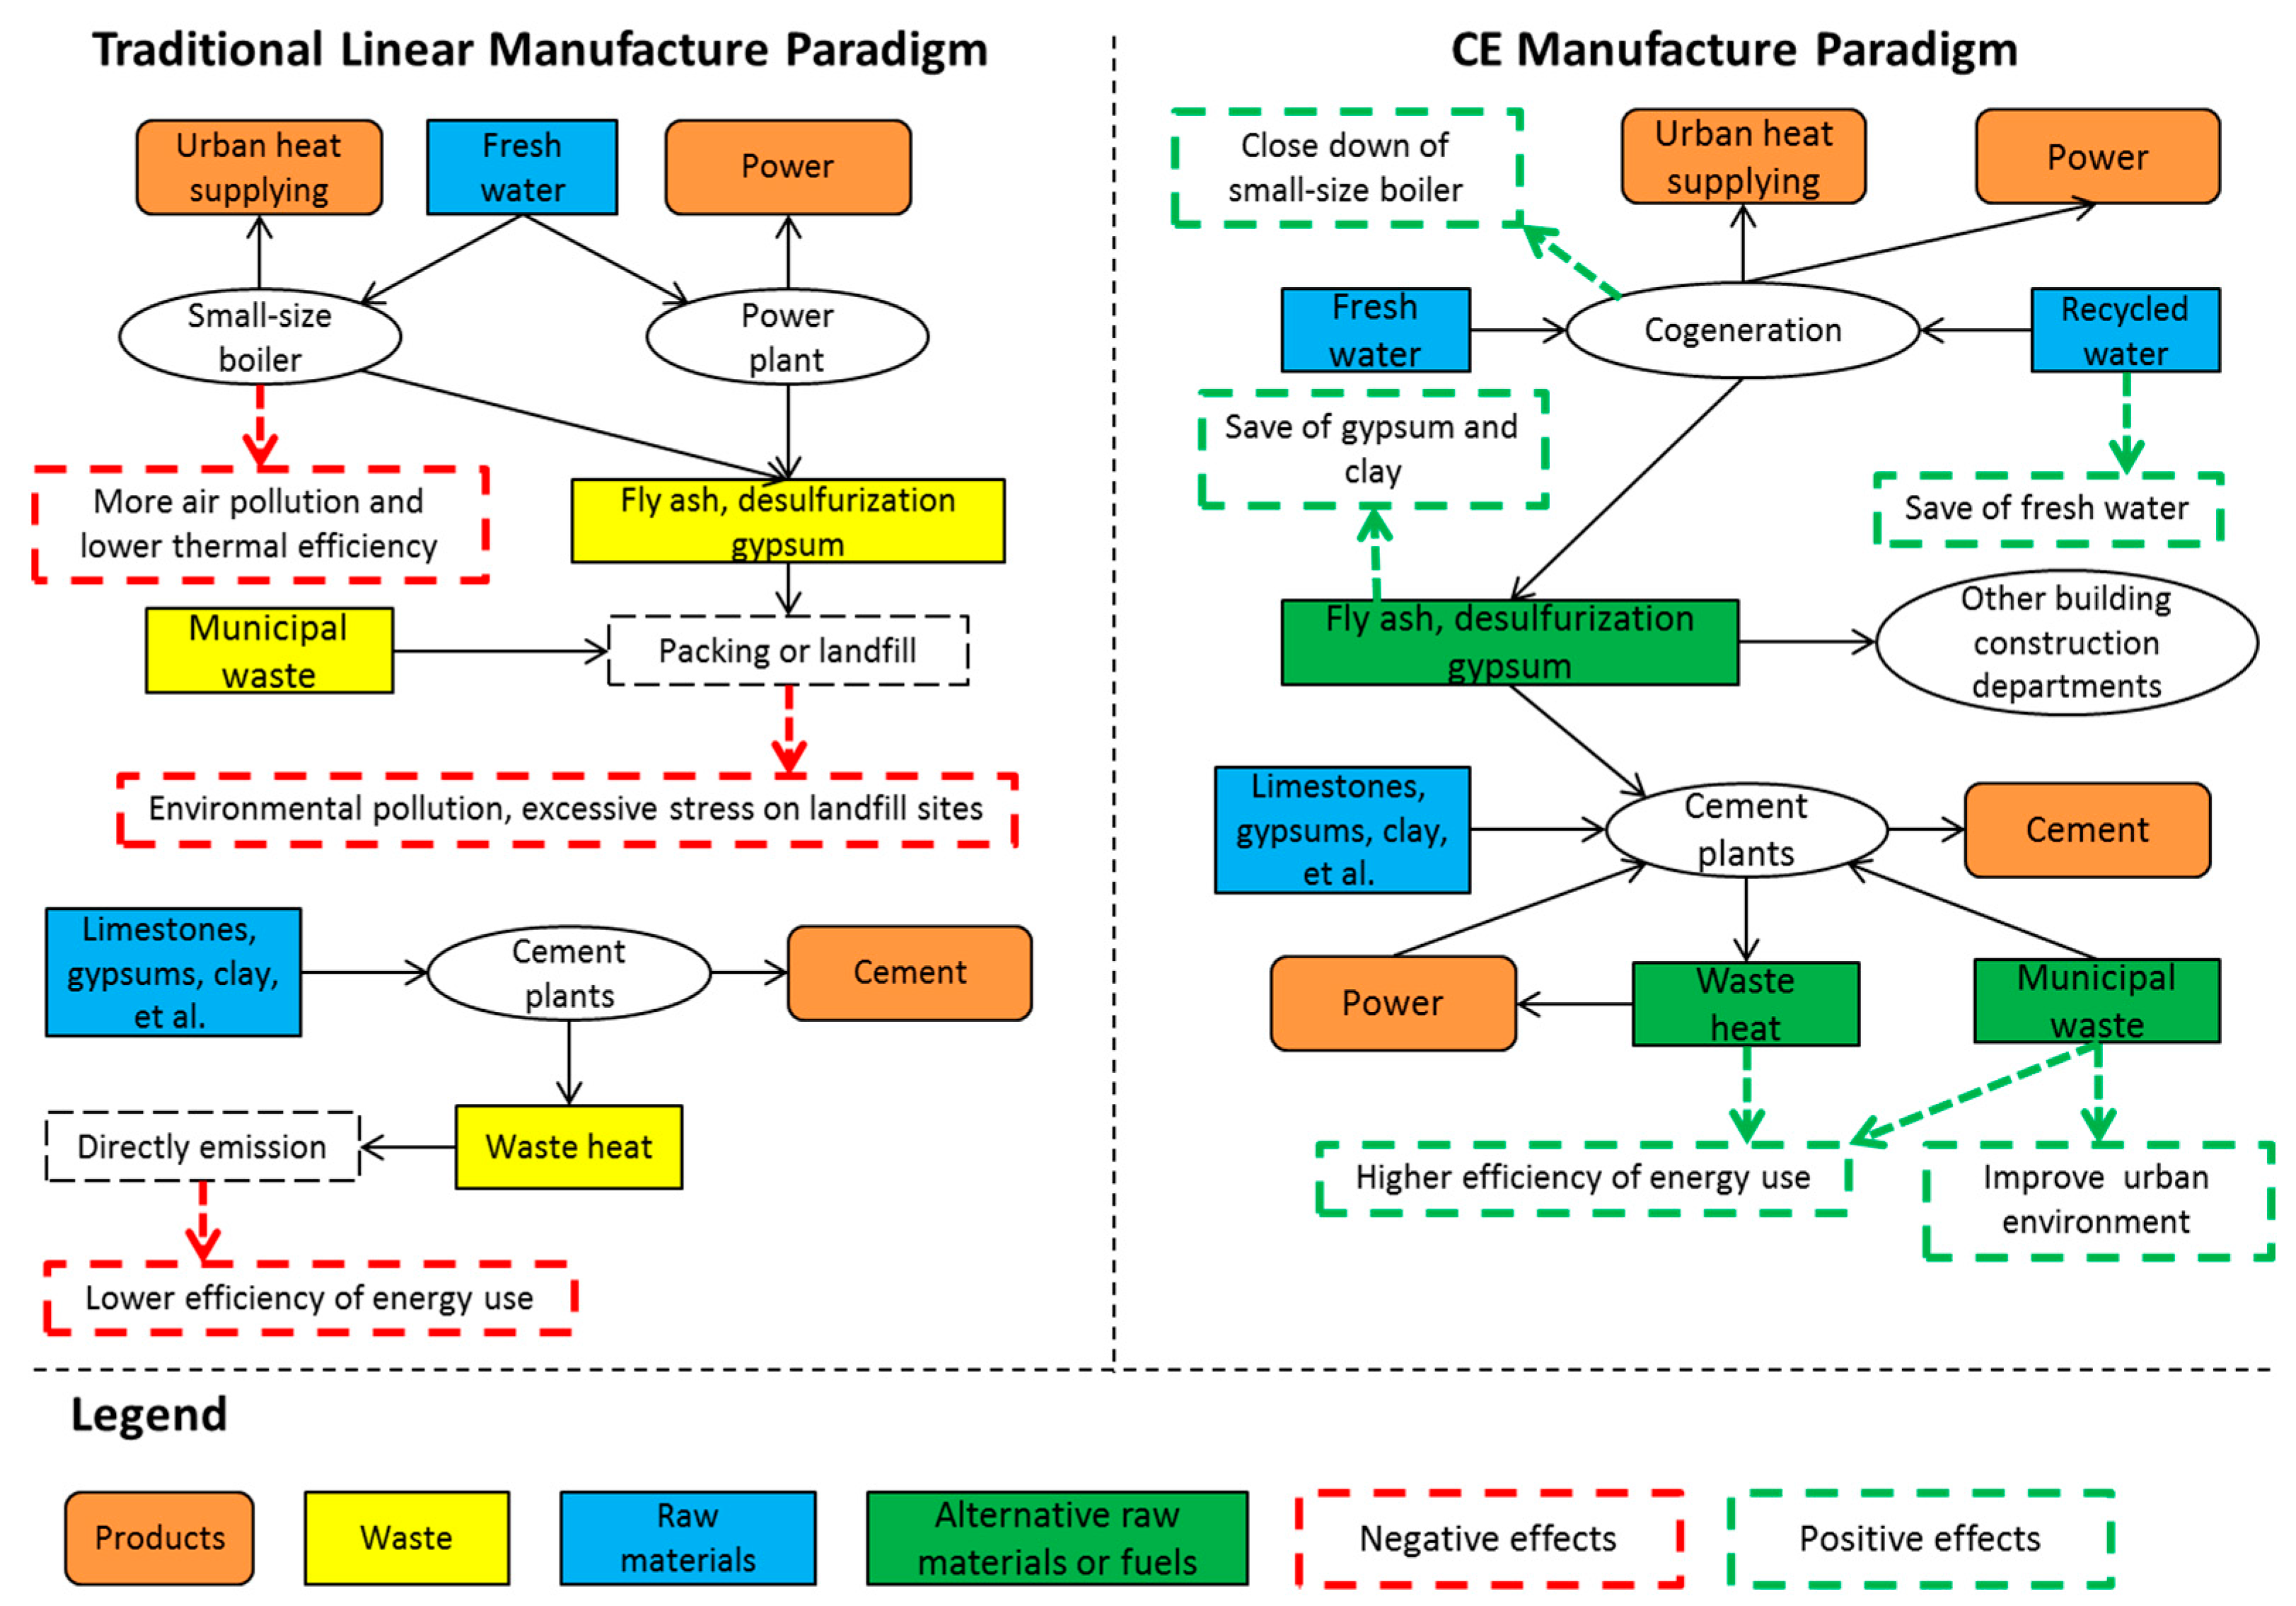
- The experiences of CE development in Kongtong can be used as a reference for regions with similar industrial structures. Combining cement plants with advanced technology is an effective path to solve the problems of fly ash and desulfurization gypsum pollution and excessive stress on landfill sites.
Acknowledgments
Author Contributions
Conflicts of Interest
References
- Su, B.W.; Heshmati, A.; Geng, Y.; Yu, X.M. A review of the circular economy in China: Moving from rhetoric to implementation. J. Clean. Prod. 2013, 42, 215–227. [Google Scholar] [CrossRef]
- Wang, J.N. Circular Economy is a Strategy Choice for Environmental Protection in the 21st Century. Res. Environ. Sci. 2002, 15, 34–37. [Google Scholar] [CrossRef]
- Moreno, M.; De los Rios, C.; Rowe, Z.; Charnley, F. A Conceptual Framework for Circular Design. Sustainability 2016, 8. [Google Scholar] [CrossRef]
- Andersen, M.S. An introductory note on the environmental economics of the circular economy. Sustain. Sci. 2007, 2, 133–140. [Google Scholar] [CrossRef]
- Lu, X; Chen, X.P. A review of circular economy. Chin. J. Popul. Res. Environ. 2014, 24, 204–208. [Google Scholar]
- European Environment Agency. Circular Economy in Europe: Developing the Knowledge Base. 2016. Available online: http://www.eea.europa.eu/publications (accessed on 11 July 2016).
- McKinsey Center for Business and Environment. Growth Within: A Circular Economy Vision for a Competitive Europe. 2015. Available online: http://www.mckinsey.com/business-functions/sustainability-and-resource-productivity/our-insights (accessed on 13 July 2016).
- Kovanda, J. Incorporation of recycling flows into economy-wide material flow accounting and analysis: A case study for the Czech Republic. Resour. Conserv. Recycl. 2014, 92, 78–84. [Google Scholar] [CrossRef]
- Wu, H.Q.; Shi, Y.; Xia, Q.; Zhu, W.D. Effectiveness of the policy of circular economy in China: A DEA-based analysis for the period of 11th five-year-plan. Resour. Conserv. Recycl. 2014, 83, 163–175. [Google Scholar] [CrossRef]
- Guo, F.Y.; Lo, K.; Tong, L.J. Eco-Efficiency Analysis of Industrial Systems in the Songhua River Basin: A Decomposition Model Approach. Sustainability 2016, 8. [Google Scholar] [CrossRef]
- Geng, Y.; Doberstein, B. Developing the circular economy in China: Challenges and opportunities for achieving ‘leapfrog development’. Int. J. Sustain. Dev. World Ecol. 2008, 15, 231–239. [Google Scholar] [CrossRef]
- Liu, D.H.; Li, H.Y.; Wang, W.G.; Dong, Y.C. Constructivism scenario evolutionary analysis of zero emission regional planning: A case of Qaidam Circular Economy Pilot Area in China. Int. J. Prod. Econ. 2012, 140, 341–356. [Google Scholar] [CrossRef]
- Liu, Q.; Li, H.M.; Zuo, X.L.; Zhang, F.F.; Wang, L. A survey and analysis on public awareness and performance for promoting circular economy in China: A case study from Tianjin. J. Clean. Prod. 2009, 17, 265–270. [Google Scholar] [CrossRef]
- Li, Y.Z.; Ma, C.Y. Circular economy of a papermaking park in China: A case study. J. Clean. Prod. 2015, 92, 65–74. [Google Scholar] [CrossRef]
- Ekincioglu, O.; Gurgun, A.P.; Engin, Y.; Tarhan, M.; Kumbaracibasi, S. Approaches for sustainable cement production—A case study from Turkey. Energy Build. 2013, 66, 136–142. [Google Scholar] [CrossRef]
- Oh, D.Y.; Noguchi, T.; Kitagaki, R.; Park, W.J. CO2 emission reduction by reuse of building material waste in the Japanese cement industry. Renew. Sustain. Energy Rev. 2014, 38, 796–810. [Google Scholar] [CrossRef]
- Schneider, M.; Romer, M.; Tschudin, M.; Bolio, H. Sustainable cement production-present and future. Cem. Concr. Res. 2011, 41, 642–650. [Google Scholar] [CrossRef]
- Supino, S.; Malandrino, O.; Testa, M.; Sica, D. Sustainability in the EU cement industry: The Italian and German experiences. J. Clean. Prod. 2016, 112, 430–442. [Google Scholar] [CrossRef]
- Wubbeke, J.; Heroth, T. Challenges and political solutions for steel recycling in China. Resour. Conserv. Recycl. 2014, 87, 1–7. [Google Scholar] [CrossRef]
- Zhang, L.; Cai, Z.J.; Yang, J.M.; Yuan, Z.W.; Chen, Y. The future of copper in China—A perspective based on analysis of copper flows and stocks. Sci. Total Environ. 2015, 536, 142–149. [Google Scholar] [CrossRef] [PubMed]
- Ma, S.J.; Hu, S.Y.; Chen, D.J.; Zhu, B. A case study of a phosphorus chemical firm’s application of resource efficiency and eco-efficiency in industrial metabolism under circular economy. J. Clean. Prod. 2015, 87, 839–849. [Google Scholar] [CrossRef]
- Van Buren, N.; Demmers, M.; van der Heijden, R.; Witlox, F. Towards a Circular Economy: The Role of Dutch Logistics Industries and Governments. Sustainability 2016, 8. [Google Scholar] [CrossRef]
- Eckelman, M.J.; Chertow, M.R. Life cycle energy and environmental benefits of a US industrial symbiosis. Int. J. Life Cycle Assess. 2013, 18, 1524–1532. [Google Scholar] [CrossRef]
- Jacobsen, N.B. Industrial symbiosis in Kalundborg, Denmark—A quantitative assessment of economic and environmental aspects. J. Ind. Ecol. 2006, 10, 239–255. [Google Scholar] [CrossRef]
- Shi, L.; Yu, B. Eco-Industrial Parks from Strategic Niches to Development Mainstream: The Cases of China. Sustainability 2014, 6, 6325–6331. [Google Scholar] [CrossRef]
- International Energy Agency. World Energy Statistics 2016. 2016. Available online: http://www.iea.org/bookshop/723-World_Energy_Statistics_2016 (accessed on 22 December 2016).
- Li, H.Q.; Bao, W.J.; Xiu, C.H.; Zhang, Y.; Xu, H.B. Energy conservation and circular economy in China’s process industries. Energy 2010, 35, 4273–4281. [Google Scholar] [CrossRef]
- Greenpeace. Research on Overcapacity and Investment Bubble of Coal Power Industry in China. 2015. Available online: http://www.greenpeace.org.cn/coal-power-overcapacity-and-investment-bubble (accessed on 17 February 2016). (In Chinese).
- Jia, R.X.; Liu, Y. China’s power structure and its spatial optimization. Resour. Sci. 2003, 25, 14–19. [Google Scholar]
- Zhong, Y.G.; Jia, X.Q.; Qian, Y. System Dynamics; China Sciences Publishing & Media Ltd.: Beijing, China, 2013; pp. 3–9. (In Chinese) [Google Scholar]
- Jahangirian, M.; Eldabi, T.; Naseer, A.; Stergioulas, L.K.; Young, T. Simulation in manufacturing and business: A review. Eur. J. Oper. Res. 2010, 203, 1–13. [Google Scholar] [CrossRef]
- Mallick, R.B.; Radzicki, M.J.; Zaumanis, M.; Frank, R. Use of system dynamics for proper conservation and recycling of aggregates for sustainable road construction. Resour. Conserv. Recycl. 2014, 86, 61–73. [Google Scholar] [CrossRef]
- Xu, J.P.; Li, X.F.; Wu, D.S.D. Optimizing Circular Economy Planning and Risk Analysis Using System Dynamics. Hum. Ecol. Risk Assess. 2009, 15, 316–331. [Google Scholar] [CrossRef]
- Zhao, W.; Ren, H.; Rotter, V.S. A system dynamics model for evaluating the alternative of type in construction and demolition waste recycling center—The case of Chongqing, China. Resour. Conserv. Recycl. 2011, 55, 933–944. [Google Scholar] [CrossRef]
- Mi, G.F.; Zhao, T. Evaluation and prediction of carbon emissions from coal power enterprises in China. Resour. Sci. 2012, 34, 1825–1831. [Google Scholar]
- Gartner, E.; Hirao, H. A review of alternative approaches to the reduction of CO2 emissions associated with the manufacture of the binder phase in concrete. Cem. Concr. Res. 2015, 78, 126–142. [Google Scholar] [CrossRef]


© 2017 by the authors. Licensee MDPI, Basel, Switzerland. This article is an open access article distributed under the terms and conditions of the Creative Commons Attribution (CC BY) license (http://creativecommons.org/licenses/by/4.0/).
Share and Cite
Dong, S.; Wang, Z.; Li, Y.; Li, F.; Li, Z.; Chen, F.; Cheng, H. Assessment of Comprehensive Effects and Optimization of a Circular Economy System of Coal Power and Cement in Kongtong District, Pingliang City, Gansu Province, China. Sustainability 2017, 9, 787. https://doi.org/10.3390/su9050787
Dong S, Wang Z, Li Y, Li F, Li Z, Chen F, Cheng H. Assessment of Comprehensive Effects and Optimization of a Circular Economy System of Coal Power and Cement in Kongtong District, Pingliang City, Gansu Province, China. Sustainability. 2017; 9(5):787. https://doi.org/10.3390/su9050787
Chicago/Turabian StyleDong, Suocheng, Zhe Wang, Yu Li, Fujia Li, Zehong Li, Feng Chen, and Hao Cheng. 2017. "Assessment of Comprehensive Effects and Optimization of a Circular Economy System of Coal Power and Cement in Kongtong District, Pingliang City, Gansu Province, China" Sustainability 9, no. 5: 787. https://doi.org/10.3390/su9050787
APA StyleDong, S., Wang, Z., Li, Y., Li, F., Li, Z., Chen, F., & Cheng, H. (2017). Assessment of Comprehensive Effects and Optimization of a Circular Economy System of Coal Power and Cement in Kongtong District, Pingliang City, Gansu Province, China. Sustainability, 9(5), 787. https://doi.org/10.3390/su9050787