
The Impact of Education and R&D Investment on Regional Economic Growth


1
Department of Agricultural Economics and Rural Development, Seoul National University, Seoul 08826, Korea
2
School of Public Policy and Leadership, Greenspun College of Urban Affairs, University of Nevada, Las Vegas, NV 89154, USA
*
Author to whom correspondence should be addressed.
Sustainability 2017, 9(5), 676; https://doi.org/10.3390/su9050676
Submission received: 11 February 2017
/
Revised: 20 April 2017
/
Accepted: 20 April 2017
/
Published: 25 April 2017
(This article belongs to the Section Sustainable Urban and Rural Development)
Abstract
:The purpose of this paper is to examine the impact of education and R&D investment on regional economic growth in South Korea. We develop a simultaneous model of production, human capital accumulation, migration, population and physical capital investment of two regions: the Seoul Metropolitan Area and the rest of Korea. We decompose the regional growth path into a quality path and a quantity path to identify how regional economies grow and run simulations to evaluate alternative policies in terms of effectiveness and adaptability. The impact of education and R&D investment on regional growth in the rest of Korea is only 22.3% of that in the Seoul Metropolitan Area due to lower elasticity values of young in-migrants with respect to the investment in the rest of Korea. An enhanced efficiency of regional human capital accumulation is effective and adaptable to alleviate regional economic disparity.
1. Introduction
As reported by the TIMES of London in 2010, universities in Scotland would confront a brain drain unless the investment on higher education is properly addressed. Brain drain, a term commonly used to refer to the loss of highly educated people who leave an area in search of appropriate jobs or further education, has also been a long-standing problem in South Korea with migration from the rest of Korea (ROK) to the Seoul Metropolitan Area (SMA). Korea is composed of seven metro cities and nine provinces; two metro cities and a single province comprise the SMA, while five other metro cities and eight other provinces comprise the ROK. The Neoclassical school of thought argues that human capital tends to flow into labor-scarce regions while capital moves to capital-scarce regions due to the advantage of higher marginal revenue of the factors, eventually leading to economic convergence between regions. In contrast, Lucas (2002) showed that capital does not flow to capital-scarce regions because marginal revenue of labor is still higher in capital abundant regions [1]. Rather, capital tends to move into labor-abundant/capital-scarce regions where capital price is over 3.3 times thanks to externality of human capital in leading regions. This pattern was attributed to human capital externalities, suggesting economic divergence. In addition, in Korea, capital has concentrated in the SMA. In addition, since the early 1960s, the national government of Korea has focused on an efficiency-oriented economic development policy in the SMA, resulting in the ROK lagging far behind the SMA [2]. Starting in the 1980s, regulatory policies have been implemented to control excessive investment in the SMA, including high residence tax in the major cities within the SMA and establishment of a growth management system (greenbelt) around the SMA. The government has focused on allocating more resources to the ROK’s higher education institutions (HEIs) and developing industrial parks in the ROK since the 1990s. Despite these efforts of the Korean government, human capital, as well as financial capital, is concentrated in the SMA. For example, the Korean Graduates Occupational Mobility Survey (2008) showed that 80.2% of students originally from the ROK who moved to the SMA for post-secondary education, entered employment status in the SMA after graduating from university. In contrast, only 17.1% of students originally from the SMA who graduated from the ROK remained in the ROK for economic activities. According to the 2010 national account statistics, the SMA has 48.0% of the total population and 52.7% of the prime working age population (25–49 years old age cohort), occupying 11.9% of the national total land area. In addition, 63.8% of workers in Korea with a master or higher degree were SMA residents. The SMA accounted for 48.8% of the GDP in South Korea. Even the Korean government’s policy to expand investment in the ROK’s HEIs and industrial parks since the 1990s failed to narrow the regional economic disparity between the SMA and the ROK. Consequently, it is worthwhile to identify how human capital accumulation and brain drain affect the regional disparity in terms of mobility of regional policymaking process.
The major focus of this paper is to analyze the impact of education and R&D investment on the ROK’s economic growth in South Korea. We develop a simultaneous model of production, human capital accumulation, migration, population and physical capital investment of two regions. We decompose the regional growth path into a “quality path” and a “quantity path”. The quality path is defined as the enhancement of labor productivities in the production process. The quantity path is described as expanded labor supply caused by the inflows of human capital to a region. We also run counterfactual simulations to evaluate three alternative policies by estimating effectiveness and adaptability: (1) a fiscal expansion of the investment; (2) an enhanced efficiency of regional human capital accumulation; and (3) an altered migration pattern from the investment. The main contribution of this paper is developing and applying a method to decompose the growth path. Quantity expansion of human capital has been found to have a bigger impact on regional income growth, whereas quality enhancement has shown a somewhat limited impact on regional income growth in both leading and lagging regions. However, this decomposition method also shows that quality improvement is more effective in lagging region than in leading region. While previous works have focused on the analysis of the overall effect of intellectual capital investments, distinguishing the two types of growth paths can be useful in identifying how lagging regions economically grow [3,4,5,6]. The rest of the paper is organized as follows. Our literature review in Section 2 comprises two major parts: In the first part, we assess the relation between human capital and regional economic growth. In the second part, we summarize the determinants of migration of human capital. Section 3 describes the data and the measurement scheme, methodology for empirical models and the policy simulations on how education and R&D investment affects regional economic growth and disparity. Section 4 presents conclusions and further agenda.
2. Literature Review
Endogenous growth theory shows that regions with better access to human capital grow cumulatively over time [7,8,9,10,11,12]. The new economic geography model provides evidence of substantial increasing returns to scale with relatively large urban populations due to the different degree of factor mobility [13,14]. In other words, highly educated workers tend to move to regions with larger market potentials, which is a fundamental driver of per capita income growth [13,15,16,17]. Such unbalanced growth is further amplified as investment flows into economically advanced areas [1]. Accumulated human capital in a region improves the marginal product of capital, which entirely eliminates the predicted return differentials. Two related questions arise: how does human capital affect regional economic growth and how is human capital accumulated in the regions? For the former, there have been various assessments of whether human capital performs better in economically leading regions or lagged regions. For the latter, the concentration and further accumulation of highly educated workforce are more evident in the regions with larger market potentials.
In the first part of the literature review, we examine how the uneven spatial distribution of human capital may further increase regional inequality in terms of labor productivity and economic growth [18,19,20]. The returns on human capital vary by regional capacity and endowment [21]. Aggregate returns to human capital investment are generally higher in regions with a shortage of human capital. This indicates that education investment policy might have a larger marginal impact when implemented in lagged regions. Thus, investment in human capital formation has been one of the key considerations for regional development policy in regions with lagging human capital [22,23]. In contrast, the existing literature concludes that human capital could contribute more to regional economic growth in leading regions [12,24,25]. The different perspectives can be traced back to the additional treatment of regions’ capacity to yield higher returns to human capital. Lopez-Bazo and Moreno showed the law of diminishing social returns to human capital accumulation in a region [21]. They argue regions with relatively lower human capital endowments would exhibit higher aggregate return. Other literature highlights the importance of a regions’ capacity, partly represented by the accumulation of human capital, which might yield technological innovation. Specifically, Crescenzi investigated European regions from 1990 to 2003 and estimated that the impact of innovation on regional economic development varied with regional conditions such as peripherality and educational attainment level [24]. Sterlacchini applied a “technology-gap” model of economic growth for 197 European NUTS-II regions aimed to test the rationale of Lisbon strategy, which is an economic development plan to make the EU “the most competitive and dynamic knowledge-based economy in the world capable of sustainable economic growth with more and better jobs and greater social cohesion” by 2010 [25]. R&D was found to be the only factor yielding regional economic growth beyond a certain threshold of GDP per capita (linked, for example, with Northern Europe). Nijkamp and Poot also showed that the lack of appropriate local conditions such as peripherality, education, large labor pool, and urbanization, impeded the adoption of diffused technological innovation [12]. Work on these issues is summarized as follows: Regions, where human capital was relatively scarce, exhibited the law of diminishing returns, which means so that lagged regions could achieve higher marginal benefits. In regions where human capital was abundant, technological efficiency and innovation were due to agglomeration economies, hence providing a better access to endogenous economic growth. According to new economic geography theory, regions endowed with insufficient financial, physical and human capital do seem to have limited ability to attract highly educated people.
In the second part, as empirically shown by many previous studies, human capital relocates with the aim of maximizing their utilities through migration. Among many potential factors, higher expected income had been mainly recognized as one of the most important factors to attract human capital to a region. Skill-biased technological change and professional jobs have incentivized migration to the regions while yielding lower wages for unskilled workers in the same regions [26,27,28,29]. Providing appropriate local employment opportunities is crucial to retaining top quality graduates, although college graduates tend to stay in a region if those graduates were born or attended high school in the same state [29]. In the process of the cumulative causation introduced by Massey [30], investing in HEIs is the prerequisite for sustainable regional economic growth to generate proper local employment opportunities. According to Anselin et al. [31], knowledge accumulated in regional establishments such as universities, research institutions, specialized agencies, and associated industries, not only stimulates basic research in regions but also attracts human capital to the regions. Specifically, managing universities is crucial to improving human capital performance and regional development [32]. When debating the importance of regional income and universities, Florida et al. [33] showed that consumer service amenities retain human capital in that region. This sector has been measured by consumer and personal service [34] and cultural sector [33,35]. Education subsidies were not found to accumulate human capital in an open economy system [36]. Other empirical studies found that physical capital formation [37], education quality [38,39], industrial structure [40] and agglomeration [41] served as major pulling factors to attract a well-educated worker. Land price [40,42] and living costs [38,40] negatively influenced concentration on human capital in regions. Finally, skilled workers tended to reside within metropolitan areas where they consistently performed creative activities thanks to agglomeration economies [43,44]. Some of the key factors found to be crucial for attracting the highly educated are the levels of HEIs’ R&D activities, the opportunities for professional jobs, and higher income. In short, there were two effective paths to accumulate human capital in a region: (1) knowledge and skill acquisition through investment; and (2) inflow of skills [45].
With respect to human capital and regional economic growth, Gennaioli et al. [46] employed an economic model combining human capital externalities, talent allocation between entrepreneurship and employment, and interregional labor migration with the aim to test the role of human capital in regional development. They found differentiated impacts between the quality of human capital (education attainment level) and total quantity (the number of people with certain levels of education attainment). While regional education as a means to expand the quantity of human capital in a region is a key factor for regional development, the bigger impact of enhanced human capital quality for regional development is evident. Enhancing quality of human capital in a region is primarily through education of employees, training for entrepreneurs, and regional externalities. Social returns to education for entrepreneurs through externalities are larger than that for employee education/training. Our approach also differentiates two paths: quality and quantity for regional growth. Recently, Hanushek et al. [47] tested the impact of knowledge capital of a state on varying GDP per capita among US states. In order to measure regional knowledge capital, authors combined cognitive skills measured by test scores with a traditional measure of human capital accumulation—education attainment level. Their findings clearly indicate that approximately 20–30% of GDP per capita variation among US states can be explained by varying levels of knowledge capital accumulation. Roughly equal shares of contribution were found between education attainment and cognitive skills. Quality of life is another important estimator for regional growth. However, interactive impact of quality of life and human capital on regional growth has been rarely investigated. Fan et al. [48] found reinforcing impact of these two factors for wage growth among US counties between 2000 and 2007. Both quality of life and human capital significantly stimulated economic growth and more importantly, the impact of human capital on regional growth was larger in counties with higher quality of life by attracting and retaining human capital into the counties.
To summarize, human capital can achieve higher marginal economic benefits in lagging regions. Knowledge embedded labor, however, tends to concentrate in leading regions with technological efficiency and innovation due to agglomeration economies. In this context, an important policy question is whether education and R&D expenditure [30,31] can boost lagging regions’ economic growth and thereby lead to regional convergence in the long run. We, therefore implement the following main working processes to compare the results between leading and lagged regions, respectively: (1) the effect of education and R&D investment on human capital formation and inflow of human capital; (2) the effect of human capital inflow on human capital formation; and (3) the effect of human capital on regional economic growth.
3. Analysis
3.1. Model and Variables
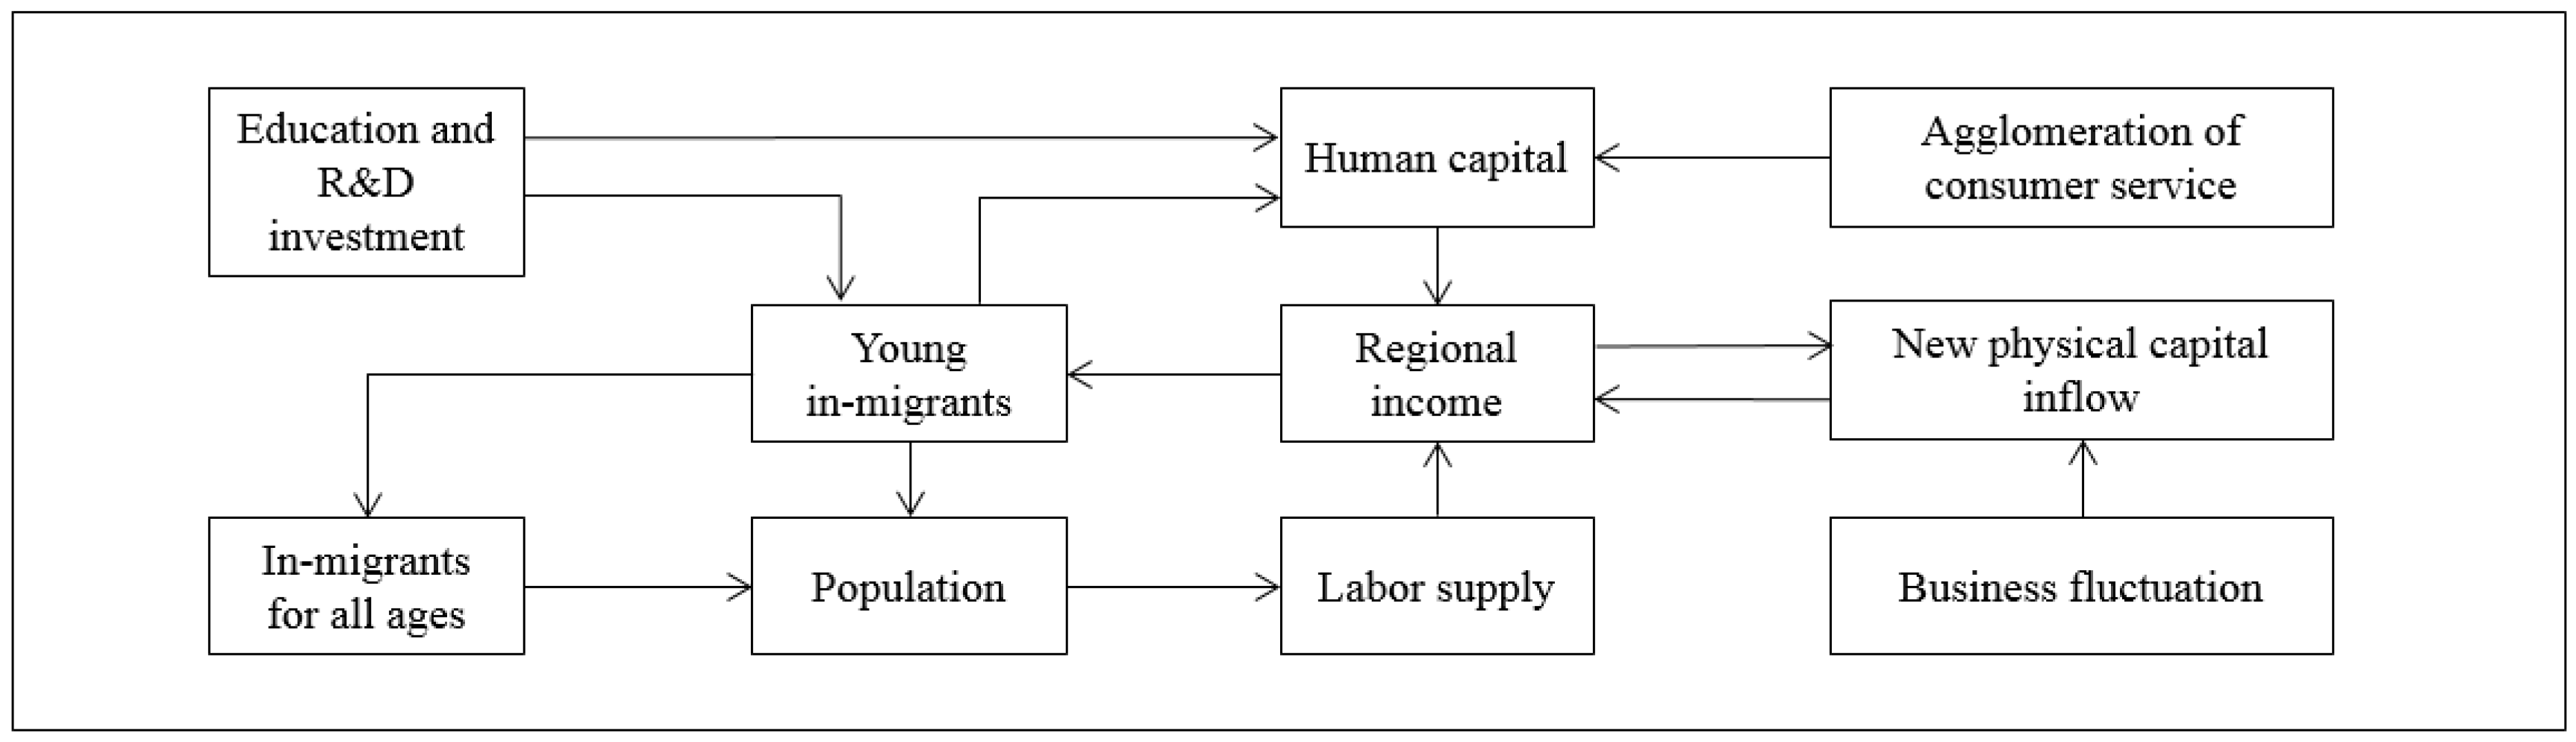
We capture the different contributions of education and R&D investment to the flow and to the accumulation of human capital in the ROK from the SMA in South Korea. Figure 1 illustrates our structural model with two endogenous paths from regional income to (1) young in-migrants; and (2) new physical capital inflow.
The variables related to human capital give rise to two measurement concerns. One is how to quantify the level of human capital. There are a few widely used measures: literacy rate [49], enrollment rate [50,51,52], average years of schooling [17,53,54], the number of individuals given level of education [55], educational facilities [56], labor income [57], and education expenditure [56,58,59]. Recent literature uses employment ratio to college graduates [60,61] and the share of working-age residents who completed university or college education [4]. We used the average schooling years of the labor force because this approach is very close to the indicator used by Lin [17], Psacharopoulos and Ariagada [53], and Barro and Lee [54]. Another measurement issue is which data to use as a proxy for the inflow of skilled workforce. Thanks to Korea’s data availability on age-cohorts, we were able to use the number of in-migrants aged between 20 and 34 to a region as a proxy of highly educated labor, as age-cohorts are frequently used for other empirical models [4]. This alternative approach is supported by the fact that young workers and graduates have similar migration patterns when seeking higher education, and this tends to promote regional and/or urban economic growth [38,62,63]. According to OECD Indicators 2012, the percentage of 25–34-year-olds in Korea that has attained at least upper secondary education is 98% in Korea compared to an average of 82% in OECD countries. Eighty percent of 25–63-year-olds in Korea have at least upper secondary education compared with an average of 74% in OECD countries. More importantly, the percentage of 25–34-year-olds in Korea is 65% compared to 38% of OECD average. In contrast, that of 25–64-year-olds is 40% in Korea whereas 31% in OECD. These figures show that at least in Korea, 20–34-years-olds account for the highest education levels in the labor force (see p. 8). Table 1 represents the variables used in this paper.
Our analysis starts with developing a log-linearized Cobb-Douglas regional production function shown in Equation (1). Human capital is a key variable for the production function subject to increasing returns to scale. Equation (2) estimates the effects on human capital accumulation from three variables: education and R&D investment, young in-migrants and consumer service amenities. The location quotient is used for consumer service variable (CS) with the employment in the following service sectors: accommodation and food services, education services and arts, sports, and recreation services. Labor supply is a function of regional population as shown in Equation (3). In Equation (4), we follow the approach by Tobin [64] for capital investment function. Thus, demand of physical capital flow is a function of the GRP, capital prices, interest rates, and stock prices. The inflow of young in-migrants to a region is a function of the ratio of expected per capita income in a destination to that in an origin and the educational investment in Equation (5). We include a conventional control variable, an expected income proposed by Todaro and Smith [38]. GRP per capita is calibrated by multiplying the probability of employment in a destination or in an origin region, and the ratio of the expected income in a destination to that in an origin represents expected income differential for migration decision. Equations (6) and (7) predict the number of in-migrants at age cohort below 19 and for all ages, respectively. Regional population is estimated by natural and social demographic changes based on the lagged population size of a region in Equation (8). In the last equation, physical capital stock is computed with capital investment and previous capital stock (see Equation (9)).
- Stylized production technology:
- Production factors:
- Migration:
- Population and physical capital stock formulawhere, in Equations (1)–(4), r = SMA or ROK, in Equations (5)–(9), for SMA region, i = 1, 2, 3, representing two major cities and one state within the SMA and j = 4, …, 16, representing five major cities and eight states within the ROK in Equations (5)–(9), for ROK region, i = 4, …, 16, representing five major cities and eight states within the ROK and j = 1, 2, 3, representing two major cities and one state within the SMA.
The data from the National Statistics of Korea and the Bank of Korea are available annually for the 16 cities and provinces from 1997 to 2009. South Korea had suffered from the 1997 Asian financial crisis and global financial crisis of 2008. From 1997 to 2008, Korea’s economy had been stabilized and grown steadily. Consequently, the selected time span for this study (1997–2009) is appropriate to capture the impact of education and R&D investment on regional economic growth. Our dataset covers the GRP, the number of labor force by education attainment, the number of migrants by age cohort, and the R&D expenditure of universities in partnerships with other enterprises or institutions. We pooled these original data with regard to two sub-regions, the SMA composed of two metropolitan areas and one province and the ROK composed of five metropolitan areas and eight provinces.
Table 2 presents descriptive statistical results. Overall, the mean values of most variables such as the GRP, production factors, education, and R&D investment, and population, are much higher in the SMA than in the ROK. Moreover, the number of young in-migrants from the ROK to the SMA is nine times higher than that from reverse flow. In contrast, the ROK had higher value for out-migrants for all ages, consumer service and death rate are higher than the SMA. Such an unbalanced regional structure will further aggravate human capital accumulation disparity between the two regions. Consequently, this largely restrains the ROK from human capital expansion.
3.2. Estimation and Simulation Results
Table 3 presents the estimation results of the proposed regression models. As shown in Model (1), the coefficients of the human capital (HC) are 2.767 (significant at 5%-level) in the SMA and 1.737 (significant at 10%-level) in the ROK. The regression estimate is interpreted as follows: for one percent change in the exogenous variable, the regional economic performance changes by the corresponding regression estimates, if when all other exogenous variables are held constant. From Model (1), the impact of human capital on regional economic performance is greater in an economically leading region, the SMA, than in the lagging region, the ROK, where both regions do not exhibit the law of diminishing returns. Model (2) shows that 1% increase in the education R&D investment (RD) causes 0.001% and 0.002% increase in human capital formation in the SMA and the ROK, respectively. This proves that the impact of the investment is higher in the lagging regions consistent with Rodriguez-Pose and Fratesi [22]. With one percent increase in the young in-migrants (IMY), the expected human capital accumulation is expected to increase by 0.006% in the SMA and by 0.011% in the ROK, respectively. The law of diminishing returns allows higher returns in the ROK as demonstrated by Lopez-Bazo and Moreno [21]. As a result, with higher young in-migrants to the SMA from the ROK, gap between the predicted human capital formations in the SMA and in the ROK grows bigger. Therefore, overall human capital formation in Korea decreases with the increasing young in-migrants to the SMA from the ROK. In Model (5), 1% increase in education and R&D investment in a region leads to 0.578% and 0.192% increase in young in-migrants to the SMA (from the ROK) and to the ROK (from the SMA), respectively. Additionally, when the expected per capita income ratio (REINC) increases by one percent, the logs of inflow of skilled workforce is likely to increase by 0.352 in the SMA and 0.035 in the ROK, while holding all other variables in the model constant. The coefficient for the ROK model is not statistically significant, whereas that for the SMA model is significant at 1% level. The conventional variables do not work in the ROK to induce highly educated people who favor the SMA endowed with sufficient financial, physical and human capital. Model (7) shows that overall in-migrants (IMA) more heavily rely on young in-migrants (IMY) than the other age groups (IMLT19 and IMOT35) for both regions. The coefficient for the SMA is 0.480, higher than that for the ROK, 0.408.
In short, it is difficult to find an answer to the question which region has greater overall effect of educational investment on regional income, in an aggregated manner. Labor elasticity of regional income, human capital elasticity of regional income and education and R&D investment elasticity of young in-migrants are higher in the SMA. In contrast, educational investment elasticity and young in-migrants elasticity of human capital accumulation are higher in the ROK. Therefore, we further decompose the regional growth path into a quality path and a quantity path. Analyzing effects from decomposed growth paths in each region enables to compare the overall effect of educational investment on regional income between the SMA and the ROK. Regional growth through quality path can be achieved by enhancing productivity of regional labor force in the following two ways: (1) directly investing in local human capital with targeted education and R&D investment in local regions; or (2) indirectly from in-migrants with higher level of human capital. Regional efforts to accumulate human capital are more closely associated with education and R&D investment policy since this approach is more likely to provide stable and expanded supply of locally grown human capital. Another way to promote regional growth is the quantity path by expanded supply of human capital through interregional labor migration. Regional development policy through quantity path targets to attract human capital to a region. However, for regions with limited endowments for economic activities, it is not viable and sustainable in the long run.
The quality path, as mentioned in Section 1, is defined as the path through enhancement of labor productivities in the production process. The quantity path is defined as the path through expanded labor supply induced by increased human capital in-migration. Specifically, for the direct quality path, the effect of the education investment on regional income is 0.0028 in the SMA and 0.0035 in the ROK (equivalent to the multiples of (a) and (d) in Figure 2). We measured another effect along indirect quality path through young in-migrants on income: 0.0096 in the SMA and 0.0037 in the ROK (equivalent to the multiples of (b), (c), and (d) in Figure 2), respectively. Total effect through quality path, the sum of direct and indirect effects, is 0.0124 in the SMA and 0.0072 in the ROK. For the quantity path, one effect is 0.2586 in the SMA and 0.0615 in the ROK (equivalent to the multiples of (b), (e), (f), and (g) in Figure 2). Another effect through a destination’s expected per capita income compared to origin is 0.0407 in the SMA and 0.0007 in the ROK (equivalent to the multiples of (b), (e), (f), (g), (h), (e), (f), and (g) in Figure 2). Total effect through quantity path is 0.2993 in the SMA and 0.0622 in the ROK. Therefore, the total gross effect of education and R&D investment along both paths on regional growth in the ROK is 0.0694, only 22.3% compared to the SMA, 0.3117. Endogenous regional growth path found in the SMA, which is not evident in the ROK, confirms that young people rarely move to the ROK even with much higher region income per capita in the ROK compared to that in the SMA. Specifically, the impact through the quantity path is greater in both regions than that through the quality path. The total effect through quality path in the ROK is 58.1% of that in the SMA, while the total effect through quantity path in the ROK is only 20.8% of that in the SMA. In Figure 2, quantity path is more effective than quality path for the two regions’ income growth. However, it is more effective to follow quality path to reduce interregional disparities.
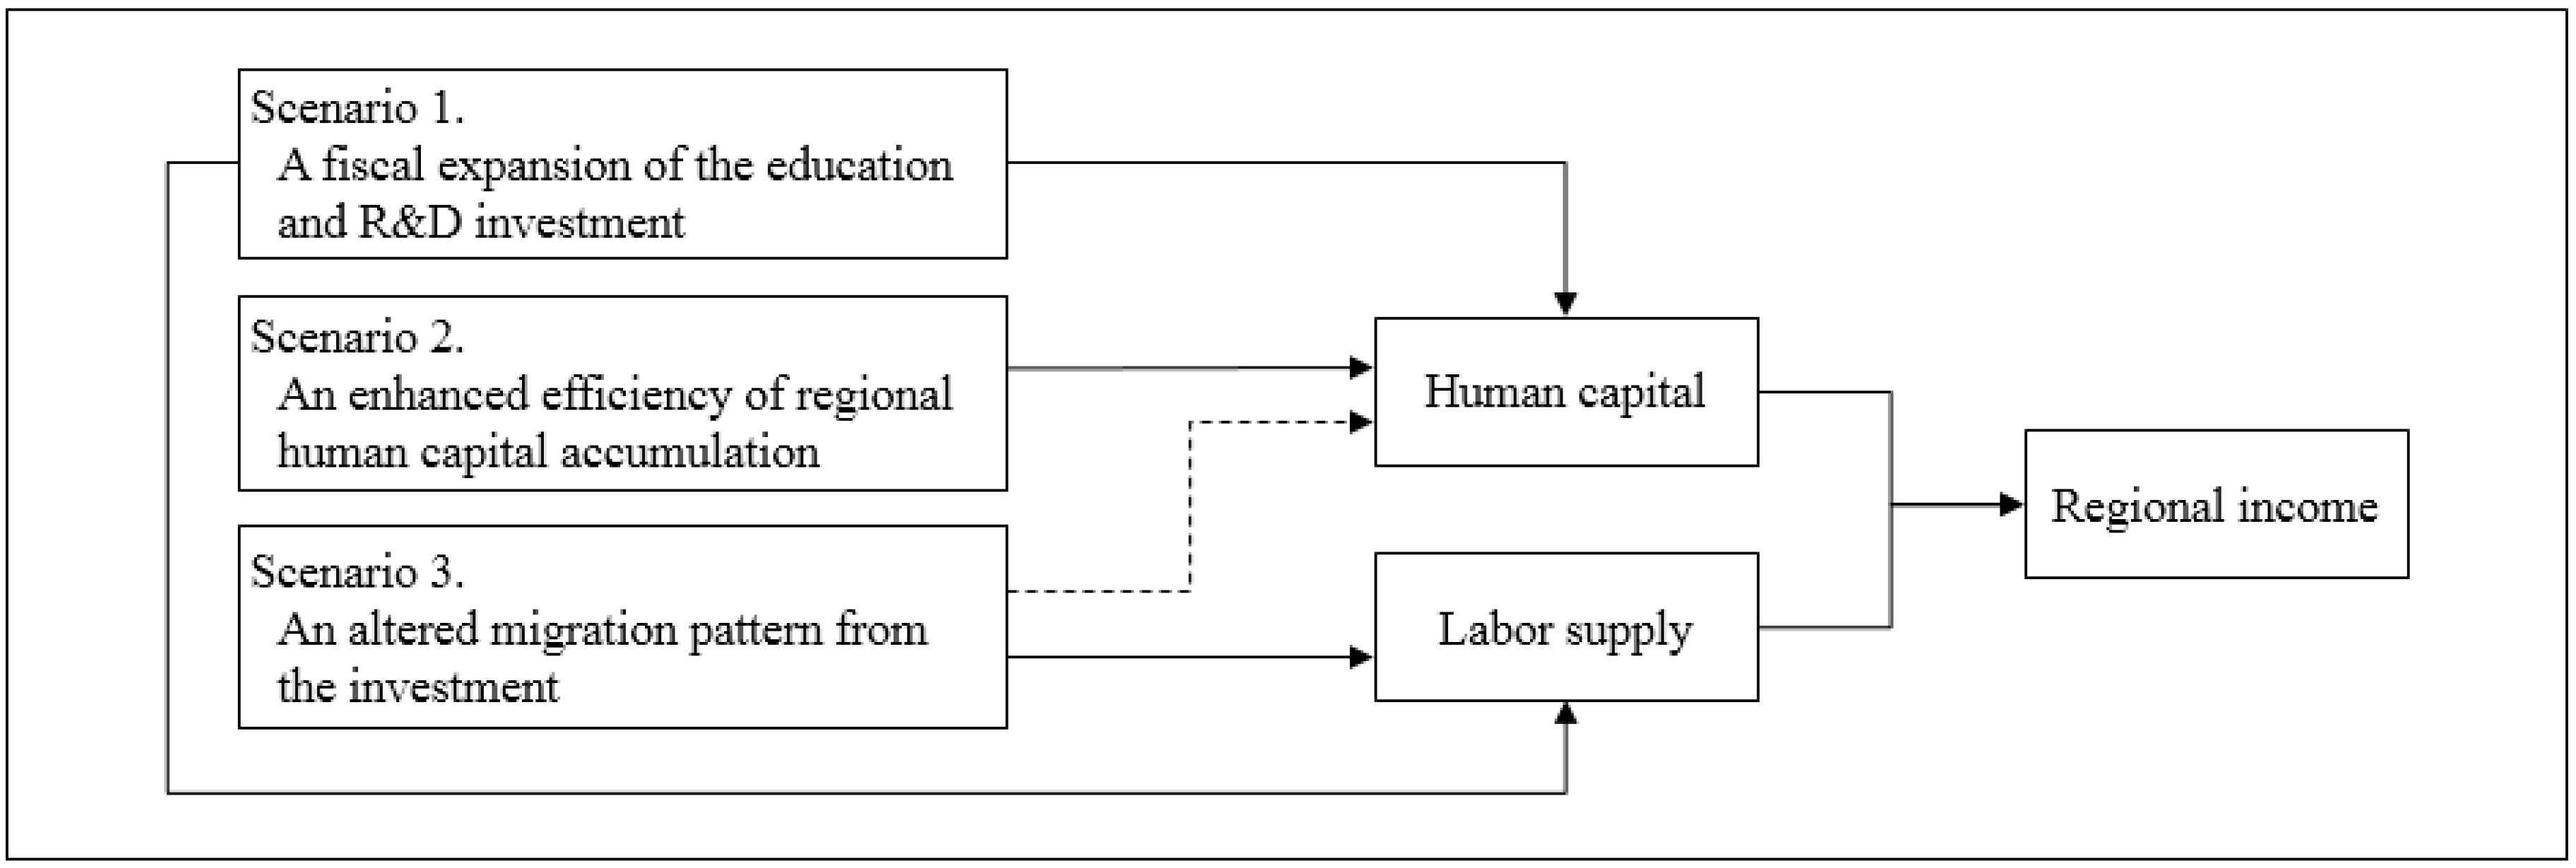
In this section, we run counterfactual simulations to evaluate three alternative policies in terms of effectiveness and adaptability. Education and R&D investment is the key variable for the simulations. Three alternatives for the counterfactual simulation are constructed with the varying growth rates of the educational investment-related factors: (1) the amount of education and R&D investment; (2) the elasticity of human capital accumulation with respect to investment; and (3) the elasticity of young in-migrants with respect to the investment in the ROK. These factors represent: (1) fiscal expansion of investment; (2) enhanced efficiency of regional human capital accumulation; and (3) altered migration pattern from investment, respectively, as illustrated in Figure 3. Expected impacts from investment expansion (Scenario 1 in Figure 3) can be directly enhanced through quality path (a) in Figure 2, or indirectly through paths (b)–(c) in Figure 2. Quantity of human capital (Scenario 3 in Figure 3) can be expanded along two paths in Figure 2: (b)–(e)–(f) and (b)–(e)–(f)–(g)–(h)–(e)–(f), respectively. In the simulations, there are at least five shocks to each alternative: 20%, 40%, 60%, 80% and 100% increase of coefficient along path (a) or path (b). In the baseline, there is no growth in these three factors. The growth of education and R&D investment simply follows the average of the 16 cities and provinces during the recent five years.
Table 4 shows the simulation results of the baseline scenario where the regional disparity does not narrow over time. The last row of Table 4 shows the changes in the ratio of the ROK compared to the SMA. Specifically, the growth rate is increasing until 2024, but the rate is decreasing after 2028. The regional gap between the SMA and the ROK is difficult to mitigate in the long run. The differences in the variable or elasticities between the baseline scenario and the counterfactual scenario are considered as a “shock” to the model. The simulation process is dynamic, in an annual recursive approach. For example, inflow of skilled labor is also adopted with lagged adjustments to expected per capita income ratio of Model (5) through the expanded size of population and labor, and the GRP of a region. This allows us to describe full development pathways by replicating the partial equilibrium conditions. The base and snapshot years for this analysis are 2009 and 2034, respectively, where the baseline scenario accounts for what would happen without any significant change over a 25-year period. The results from the counterfactual experiment for the ROK are compared with those for the SMA case for each period.
Table 5 demonstrates that Korea’s lagging regions (the ROK) would need at least 40% of the annual growth of education and R&D investments under Scenario 1 in order to catch up the GRP of the leading region (the SMA) within 20 years. Regional convergence can be obtained only if a huge amount of education and R&D investment is concentrated in the ROK. In Scenario 2, with 80% annual growth in the elasticity of human capital with respect to education and R&D investment in the ROK, it takes 17 years to reach the comparable level with the SMA’s per capita income (see Table 6). Table 7 shows the result of the last simulation of changes in the elasticity of young in-migrants with respect to investment under Scenario 3. Even when the ROK’s elasticity increases by 100% from the base year (2009), the ROK’s per capita income still lags behind that of the SMA by at least 3.88% in 2034. Korean central government’s expansion for education and R&D investment is largely limited due to intertemporal budget constraint. Expanding such investment by at least 40% annually for the next 20-year period is somewhat unrealistic and would be a great burden to Korean central government.
Among the three proposed scenarios, policy focusing on human capital quality enhancement (Scenario 2) has shown more significant impact than policy focusing on human capital quantity expansion (Scenario 3). Our approach can detect varying effects of education and R&D investment along two regional growth paths through long-term projections. Consequently, policymakers will be able to utilize proposed model framework to estimate long-term return on investment in policy development stage. The effects on per capita income ratio of ROK to SMA under existence of structural (involuntary) unemployment are summarized in Appendix A.
4. Conclusions
The purpose of this paper was to examine the impact of education and R&D investment on regional economic growth in South Korea. We develop a simultaneous model of production, human capital accumulation, migration, population and physical capital investment of the SMA and the ROK. We decomposed the regional growth path into a quality path and a quantity path to identify how regions economically grow and run simulations to evaluate alternative policies in terms of effectiveness and adaptability. The impact through the quantity path is greater in both the SMA and the ROK than those through quality path. The impact of educational investment on regional growth in the ROK is only 22.3% of that in the SMA due to lower elasticity of young in-migrants with respect to education investment in the ROK. The impact through quantity path is greater in both regions than that through quality path. The total effect through quality and quantity path is 58.1% and 20.8% in the ROK, compared to the SMA, respectively. Specifically, the impact through quantity path is greater in both regions than that through quality path. The total effects through quality path in the ROK is 58.1% of that in the SMA, while the total effects through quantity path in the ROK is only 20.8% of that in the SMA.
The highest priority should be placed on enhancing labor productivities with expanded government investment for education and R&D activities in a lagging region. Our analysis found that this was the most viable and efficient to reduce regional disparity in Korea. The effect of financing human capital formation varies depending on regional characteristics [21]. Local government should play a leading role to design and implement region-specific programs, while the central government’s role can be confined to providing funding, and administrating the allocation of resources across the sub-national regions. For example, local vocational education programs and region-specific systems to stimulate the formation of regional human capital could be effective.
With respect to changes in quality and quantity of regional human capital, our estimation results differ greatly from the calibration results by Gennaioli et al. [46] in that investment through the quantity path produces a larger impact than that through the quality path. Our models used aggregated regional investment for education and R&D activities through local universities. For this reason, it is impossible to distinguish how such investment has been allocated to specific activities such as worker training/education programs, education for entrepreneurs and so forth. Instead, the quality path shows limited impact on regional growth both in the SMA and in the ROK compared to quantity path’s role to bring in immediate impact, but the relative impact through quality path in the ROK is found to be bigger than that in the SMA. This implies that targeted investment along quality path such as education for entrepreneurs in the ROK can yield greater and more sustainable contributions to regional economic growth. The relative importance of regional human capital accumulation along quality path shown in Scenario 2 conforms to Hanushek et al. [47] in that providing adequate state-level policy support to improve the quality of education and raise human capital level would be more desirable. Moreover, the ROK as a lagging region in Korea expects a largely limited impact of investment along quantity path. The ROK has limited human capital in-migrants unlike cases such as among U.S. states where the flows of human capital are much more frequent. Though this study does not directly control varying quality of life among study areas, findings from Fan et al. [48] provide supplementary policy implications. Limited impact on regional growth through the quantity path, especially in the ROK, can be reinforced when combined with supplementary policies to enhance quality of life in the lagging region. This is a sustainable path for the ROK in the long run since the ROK generally has higher quality of life-based on natural amenities compared to that in the SMA. Therefore, community development policies can stimulate the reinforcing impact of human capital and quality of life in the ROK along quantity path in the long run, while the focus of education and R&D investment policy should be on local human capital accumulation along quality path. For example, the rural and regional policy of Norwegian government aims to implement a decentralized education structure to develop attractive local education opportunities [65]. Universities and polytechnic colleges in Helsinki are trying to invite outstanding researchers to foster younger students who are domiciled in the region though this is not regional policy. Korea’s local universities have continued to recruit excellent personnel who are domiciled in the region and give incentives to get a job in the region since 2015.
A few points need to be mentioned regarding the prospect of future research. First, the analysis should be recalibrated to account for current underemployment trends. The stylized production function used in this paper assumed full employment which means that labor demand follows labor supply. Additionally, we considered structural or involuntary unemployment condition as well. Adopting an increasing divergence between the unemployment and the underemployment rate, or using labor hours may provide more accurate method to estimate labor demand since the beginning of the great recession [66]. A second modification is to capture the different levels of complementarity between capital and educational investment, or between education and technology progress introduced by Lin [17]. These relationships could differ across regions. This heterogeneity could shed light on concrete policies of technical progress and physical capital as well as human capital accumulation. Third, it would be useful to develop a migration model for highly educated workers’ migration decisions which can be influenced by various other factors such as job availability, local labor market characteristics and regionally unique amenities. Our migration model mainly focused on the role of education and R&D investment and pecuniary benefit in measuring the relative regional income compared to origin as Todaro’s model [38]. The migration function could be extended to better explain a behavioral channel of brain drain in a stochastic framework. Finally, we did not include the economic agents—two regional households and one national (central) government. It would be interesting to measure the changes in reduced demands for intermediate or final goods in many developed countries facing sluggish growth or aging population. This could allow the number of in-migrants to be more accurately calibrated.
Author Contributions
Youngjin Woo and Euijune Kim conceived and designed the research; Youngjin Woo undertook the primary research and analysis of the data and was the main author of Section 3 and Section 4; Euijune Kim was the main author of Section 1; Jaewon Lim was the main author of Section 2; and all authors read and approved the final manuscript.
Conflicts of Interest
The authors declare no conflict of interest.
Appendix A. Quantitative Analysis of Education and R&D Investment
Besides the counterfactual simulations as shown in Table 5, Table 6 and Table 7, we perform an additional quantitative exercise of education and R&D investment on regional growth taking into account an existence of structural (involuntary) unemployment based on Scenario 2. That is, the average unemployment rates of the recent five years (2011 to 2015) by region are used in the model in order to relax the full employment assumption. This simulation shows that it takes 16 years for the ROK to reach the comparable level with the SMA’s per capita income with 80% annual growth in the elasticity of human capital with respect to education R&D investment in the ROK.

Table A1.
Per capita income ratio of ROK to SMA under actual unemployment rate (unit: %).
| Year | 0 | 20 | 40 | 60 | 80 | 100 |
|---|---|---|---|---|---|---|
| 2016 | 88.37 | 89.27 | 90.18 | 91.10 | 92.04 | 92.98 |
| 2017 | 88.77 | 89.71 | 90.65 | 91.61 | 92.57 | 93.55 |
| 2018 | 89.28 | 90.24 | 91.22 | 92.20 | 93.20 | 94.20 |
| 2019 | 89.79 | 90.78 | 91.78 | 92.79 | 93.82 | 94.85 |
| 2020 | 90.26 | 91.28 | 92.31 | 93.35 | 94.41 | 95.47 |
| 2021 | 90.73 | 91.77 | 92.83 | 93.90 | 94.98 | 96.08 |
| 2022 | 91.19 | 92.26 | 93.34 | 94.43 | 95.54 | 96.67 |
| 2023 | 91.63 | 92.72 | 93.83 | 94.96 | 96.09 | 97.25 |
| 2024 | 92.06 | 93.18 | 94.32 | 95.47 | 96.63 | 97.81 |
| 2025 | 92.49 | 93.63 | 94.79 | 95.97 | 97.16 | 98.37 |
| 2026 | 92.90 | 94.07 | 95.26 | 96.46 | 97.68 | 98.91 |
| 2027 | 93.30 | 94.50 | 95.71 | 96.94 | 98.18 | 99.44 |
| 2028 | 93.70 | 94.92 | 96.15 | 97.40 | 98.67 | 99.96 |
| 2029 | 94.08 | 95.32 | 96.58 | 97.86 | 99.16 | 100.47 † |
| 2030 | 94.46 | 95.72 | 97.01 | 98.31 | 99.63 | 100.97 † |
| 2031 | 94.82 | 96.11 | 97.42 | 98.75 | 100.10 † | 101.46 † |
| 2032 | 95.18 | 96.49 | 97.82 | 99.17 | 100.55 † | 101.94 † |
| 2033 | 95.52 | 96.86 | 98.21 | 99.59 | 100.99 † | 102.41 † |
| 2034 | 95.85 | 97.21 | 98.59 | 100.00 † | 101.42 † | 102.86 † |
| 2035 | 96.18 | 97.56 | 98.96 | 100.39 † | 101.84 † | 103.31 † |
| 2036 | 96.49 | 97.89 | 99.32 | 100.77 † | 102.24 † | 103.74 † |
| 2037 | 96.78 | 98.21 | 99.66 | 101.14 † | 102.64 † | 104.16 † |
| 2038 | 97.07 | 98.52 | 99.99 | 101.49 † | 103.01 † | 104.56 † |
| 2039 | 97.34 | 98.81 | 100.31 † | 101.83 † | 103.38 † | 104.95 † |
| 2040 | 97.59 | 99.08 | 100.61 † | 102.15 † | 103.72 † | 105.32 † |
Note: † indicates the ROK’s maximum attainable per capita income ratio compared with the SMA for each year under the given scenarios.
References
- Lucas, R.E. Lectures on Economic Growth; Harvard University Press: Cambridge, MA, USA, 2002; pp. 65–67. [Google Scholar]
- Chang, H.J. The Political Economy of Industrial Policy in Korea. Camb. J. Econ. 1993, 17, 131–157. [Google Scholar] [CrossRef]
- Di Maria, C.; Stryszowski, P. Migration, Human Capital Accumulation and Economic Development. J. Dev. Econ. 2009, 90, 306–313. [Google Scholar] [CrossRef]
- Di Maria, C.; Lazarova, E.A. Migration, Human Capital Formation, and Growth: An Empirical Investigation. World. Dev. 2012, 40, 938–955. [Google Scholar] [CrossRef]
- Lim, J.; Lee, C.; Kim, E. Contributions of Human Capital Investment Policy to Regional Economic Growth: An Interregional CGE Model Approach. Ann. Reg. Sci. 2015, 55, 269–287. [Google Scholar] [CrossRef]
- Benneworth, P.; Herbst, M. The City as a Focus for Human Capital Migration: Towards a Dynamic Analysis of University Human Capital Contributions. Eur. Plan. Stud. 2015, 23, 452–474. [Google Scholar] [CrossRef]
- Becker, G.S. Investment in Human Capital: A Theoretical Analysis. J. Political Econ. 1962, 70, 9–49. [Google Scholar] [CrossRef]
- Romer, P.M. Increasing Returns and Long-run Growth. J. Political Econ. 1986, 94, 1002–1037. [Google Scholar] [CrossRef]
- Lucas, R.E. On the Mechanics of Economic Development. J. Monet. Econ. 1988, 22, 3–42. [Google Scholar] [CrossRef]
- Grossman, G.M.; Helpman, E. Quality Ladders in the Theory of Growth. Rev. Econ. Stud. 1991, 58, 43–61. [Google Scholar]
- Aghion, P.; Howitt, P.A. Model of Growth through Creative Destruction. Econometrica 1992, 60, 323–351. [Google Scholar] [CrossRef]
- Nijkamp, P.; Poot, J. Spatial Perspectives on New Theories of Economic Growth. Ann. Reg. Sci. 1998, 32, 7–37. [Google Scholar] [CrossRef]
- Krugman, P. Increasing Returns and Economic Geography. J. Political Econ. 1997, 99, 483–499. [Google Scholar] [CrossRef]
- Fujita, M.; Krugman, P.; Mori, T. On the Evolution of Hierarchical Urban Systems. Eur. Econ. Rev. 1999, 43, 209–251. [Google Scholar] [CrossRef]
- Hanson, G.H. Market Potential, Increasing Returns and Geographic Concentration. J. Int. Econ. 2005, 67, 1–24. [Google Scholar] [CrossRef]
- Head, K.; Mayer, T. Gravity, Market Potential and Economic Development. J. Econ. Geogr. 2010, 11, 281–294. [Google Scholar] [CrossRef]
- Lin, T.C. Education, Technical Progress, and Economic Growth: The Case of Taiwan. Econ. Educ. Rev. 2003, 22, 213–220. [Google Scholar] [CrossRef]
- Cheshire, P.; Magrini, S. Endogenous Processes in European Regional Growth: Convergence and Policy. Growth Chang. 2002, 31, 455–479. [Google Scholar] [CrossRef]
- Fingleton, B.; Lopez-Bazo, E. Empirical Growth Models with Spatial Effects. Pap. Reg. Sci. 2003, 85, 177–198. [Google Scholar] [CrossRef]
- Fingleton, B. Regional Economic Growth and Convergence: Insights from a Spatial Econometric Perspective. In Advances in Spatial Econometrics; Anselin, L., Florax, R., Rey, S., Eds.; Springer: New York, NY, USA, 2004; pp. 397–432. [Google Scholar]
- López-Bazo, E.; Moreno, R. Regional Heterogeneity in the Private and Social Returns to Human Capital. Spat. Econ. Anal. 2007, 2, 23–44. [Google Scholar] [CrossRef]
- Rodriguez-Pose, A.; Fratesi, U. Between Development and Social Policies: The Impact of European Structural Funds in Objective 1 Regions. Reg. Stud. 2004, 38, 97–113. [Google Scholar] [CrossRef]
- Šlaus, I.; Jacobs, G. Human Capital and Sustainability. Sustainability 2011, 3, 97–154. [Google Scholar] [CrossRef]
- Crescenzi, R. Innovation and Regional Growth in the Enlarged Europe: The Role of Local Innovative Capabilities, Peripherality, and Education. Growth Chang. 2005, 36, 471–507. [Google Scholar] [CrossRef]
- Sterlacchini, A. R&D, Higher Education and Regional Growth: Uneven Linkages among European Regions. Res. Policy 2008, 37, 1096–1107. [Google Scholar]
- Costa, D.L.; Kahn, M.E. Power Couples: Changes in the Locational Choice of the College Educated, 1940–1990. Q. J. Econ. 2000, 115, 1287–1315. [Google Scholar] [CrossRef]
- Schachter, J.P.; Franklin, R.S.; Perry, M.J. Migration and Geographic Mobility in Metropolitan and Non-Metropolitan America: 1995 to 2000; Census 2000 Special Reports, CENSR-12; US Census Bureau: Washington, DC, USA, 2003. [Google Scholar]
- Eggert, W.; Krieger, T.; Meiet, V. Education, Unemployment and Migration. J. Public Econ. 2010, 94, 354–362. [Google Scholar] [CrossRef]
- Gottlieb, P.D.; Joseph, G. College-to-work Migration of Technology Graduates and Holders of Doctorates within the United States. J. Reg. Sci. 2006, 46, 627–649. [Google Scholar] [CrossRef]
- Massey, D.S. Social Structure, Household Strategies, and the Cumulative Causation of Migration. Popul. Index 1990, 56, 3–26. [Google Scholar] [CrossRef] [PubMed]
- Anselin, L.; Varga, A.; Acs, Z. Geographical Spillovers and University Research: A Spatial Econometric Perspective. Growth Chang. 2002, 31, 501–515. [Google Scholar] [CrossRef]
- Dumitrascu, O.; Ciudin, R. Modeling Factors with Influence on Sustainable University Management. Sustainability 2015, 7, 1483–1502. [Google Scholar] [CrossRef]
- Florida, R.; Mellander, C.; Stolarick, K. Inside the Black Bow of Regional Development-Human Capital, the Creative Class and Tolerance. J. Econ. Geogr. 2008, 8, 615–649. [Google Scholar] [CrossRef]
- Glaeser, E.L.; Kolko, J.; Saiz, A. Consumer City. J. Econ. Geogr. 2001, 1, 27–50. [Google Scholar] [CrossRef]
- Florida, R. The Economic Geography of Talent. Ann. Assoc. Am. Geogr. 2002, 92, 743–755. [Google Scholar] [CrossRef]
- Beine, M.; Docquier, F.; Rapoport, H. Brain Drain and Economic Growth: Theory and Evidence. J. Dev. Econ. 2001, 64, 275–289. [Google Scholar] [CrossRef]
- Acemoglu, D. A Microfoundation for Social Increasing Returns in Human Capital Accumulation. Q. J. Econ. 1996, 111, 779–804. [Google Scholar] [CrossRef]
- Todaro, M.P.; Smith, S.C. Economic Development; Pearson Education Limited: Harlow, UK, 1985; pp. 337–346. [Google Scholar]
- Lazzeretti, L.; Tavoletti, E. Higher Education Excellence and Local Economic Development: The Case of the Entrepreneurial University of Twente. Eur. Plan. Stud. 2005, 13, 475–493. [Google Scholar] [CrossRef]
- Moretti, E. Workers’ Education, Spillovers and Productivity: Evidence from Plant-level Production Functions. Am. Econ. Rev. 2004, 94, 656–690. [Google Scholar] [CrossRef]
- Berry, C.R.; Glaeser, E.L. The Divergence of Human Capital Levels across Cities. Pap. Reg. Sci. 2005, 84, 407–444. [Google Scholar] [CrossRef]
- Gabriel, S.A.; Rosenthal, S.S. Quality of the Business Environment Versus Quality of Life: Do Firms and households Like the Same Cities? Rev. Econ. Stat. 2004, 86, 438–444. [Google Scholar] [CrossRef]
- Waldorf, B.S. Is Human Capital Accumulation a Self-Propelling Process? Comparing Educational Attainment Levels of Movers and Stayers. Ann. Reg. Sci. 2009, 43, 323–344. [Google Scholar] [CrossRef]
- Breschi, S.; Lenzi, C. Spatial Patterns of Inventors’ Mobility: Evidence on US Urban Areas. Pap. Reg. Sci. 2010, 89, 235–250. [Google Scholar] [CrossRef]
- Timmermans, B.; Boschma, R. The Effect of Intra- and Inter-Regional Labor Mobility on Plant Performance in Denmark: The Significance of Related Labour Inflows. J. Econ. Geogr. 2014, 14, 289–311. [Google Scholar] [CrossRef]
- Gennaioli, N.; LaPorta, R.; Lopez-de-Silanes, F.; Shleifer, A. Human Capital and Regional Development. Q. J. Econ. 2013, 128, 105–164. [Google Scholar] [CrossRef]
- Hanushek, E.A.; Ruhose, J.; Woessmann, L. Human Capital Quality and Aggregate Income Differences: Development Accounting for US States; No. w21295; National Bureau of Economic Research: New York, NY, USA, 2015. [Google Scholar]
- Fan, Q.; Goetz, S.J.; Liang, J. The Interactive Effects of Human Capital and Quality of Life on Economic Growth. Appl. Econ. 2016, 48, 5186–5200. [Google Scholar] [CrossRef]
- Hicks, J.R. Economics of Education: Research and Studies; Pergamum Press: Oxford, UK; New York, NY, USA, 1985. [Google Scholar]
- Barro, R.J. Economic Growth in a Cross Section of Countries. Q. J. Econ. 1991, 106, 407–433. [Google Scholar] [CrossRef]
- Mankiw, N.G.; Romer, D.; Weil, D.N. A Contribution to the Empirics of Economic Growth. Q. J. Econ. 1992, 107, 407–437. [Google Scholar] [CrossRef]
- Benhabib, J.; Spiegel, M. The Role of Human Capital in Economic Development: Evidence from Aggregate Cross-country and Regional U.S. Data. J. Monet. Econ. 1994, 34, 143–173. [Google Scholar] [CrossRef]
- Psacharopoulos, G. The Educational Attainment of the Labour Force: An International Comparison; Education and Training Series: Discussion Paper, Report EDT 38, Research Division; World Bank: Washington, DC, USA, 1986; pp. 23–27. [Google Scholar]
- Barro, R.J.; Lee, J.W. International Comparisons of Educational Attainment. J. Monet. Econ. 1993, 32, 363–394. [Google Scholar] [CrossRef]
- Tallman, E.; Wang, P. Human Capital and Endogenous Growth Evidence from Taiwan. J. Monet. Econ. 1994, 34, 101–124. [Google Scholar] [CrossRef]
- Kim, M.S. Human Capital and Economic Growth. Korean Reg. Stud. 1997, 13, 15–25. (In Korean) [Google Scholar]
- Mulligan, C.; Sala-i-Martin, X. Measuring Aggregate Human Capital. J. Econ. Growth 1995, 5, 215–252. [Google Scholar] [CrossRef]
- Kendrick, J.W. The Formation and Stocks of Total Capital; National Bureau of Economic Research, Columbia University Press: New York, NY, USA; London, UK, 1976; pp. 52–64. [Google Scholar]
- Shim, J.H. Accumulation of Human Capital and Economic Growth: Focused on Lucas’ Endogenous Growth Model. Res. Ind. Econ. 2000, 13, 193–208. (In Korean) [Google Scholar]
- Ciccone, A.; Hall, R.E. Productivity and the Density of Economic Activity. Am. Econ. Rev. 1993, 86, 54–70. [Google Scholar]
- Karlsson, C.; Pettersson, L. Regional Productivity and Accessibility to Knowledge and Dense Markets; CESIS Working Paper Series 32; KTH Stockholm: Stockholm, Sweden, 2005. [Google Scholar]
- Alston, M. You don’t want to be a Check-out Chick All Your Life: The Out-migration of Young People from Australia’s Small Rural Towns. Aust. J. Soc. Issues 2004, 39, 299–313. [Google Scholar] [CrossRef]
- Lehmer, F.; Ludsteck, J. The Returns to Job Mobility and Inter-regional Migration: Evidence from Germany. Pap. Reg. Sci. 2011, 90, 549–572. [Google Scholar] [CrossRef]
- Tobin, J. A General Equilibrium Approach to Monetary Theory. J. Money Credit Bank. 1969, 1, 15–29. [Google Scholar] [CrossRef]
- Norwegian Ministry of Local Government and Regional Development. On Rural and Regional Policy; Report No. 13 to the Storting (2012–2013), H-2295 E; Norwegian Ministry of Local Government and Regional Development: Oslo, Norway, 2013. Available online: https://www.regjeringen.no/en/dokumenter/on-rural-regional-policy/id732583/ (accessed on 22 February 2017).
- Bell, D.; Blanchflower, D. Underemployment in the UK Revisited. Natl. Inst. Econ. Rev. 2013, 224, 8–22. [Google Scholar] [CrossRef]
Figure 1.
Model flows.

Figure 2.
Quality and quantity paths of education and R&D investment. Note: ° significant at 0.2, * significant at 0.1, ** significant at 0.05, *** significant at 0.01. ----- indicates calculation for the variable of expected per capita income of destination regions compared to origin region of traditional migration model [38].
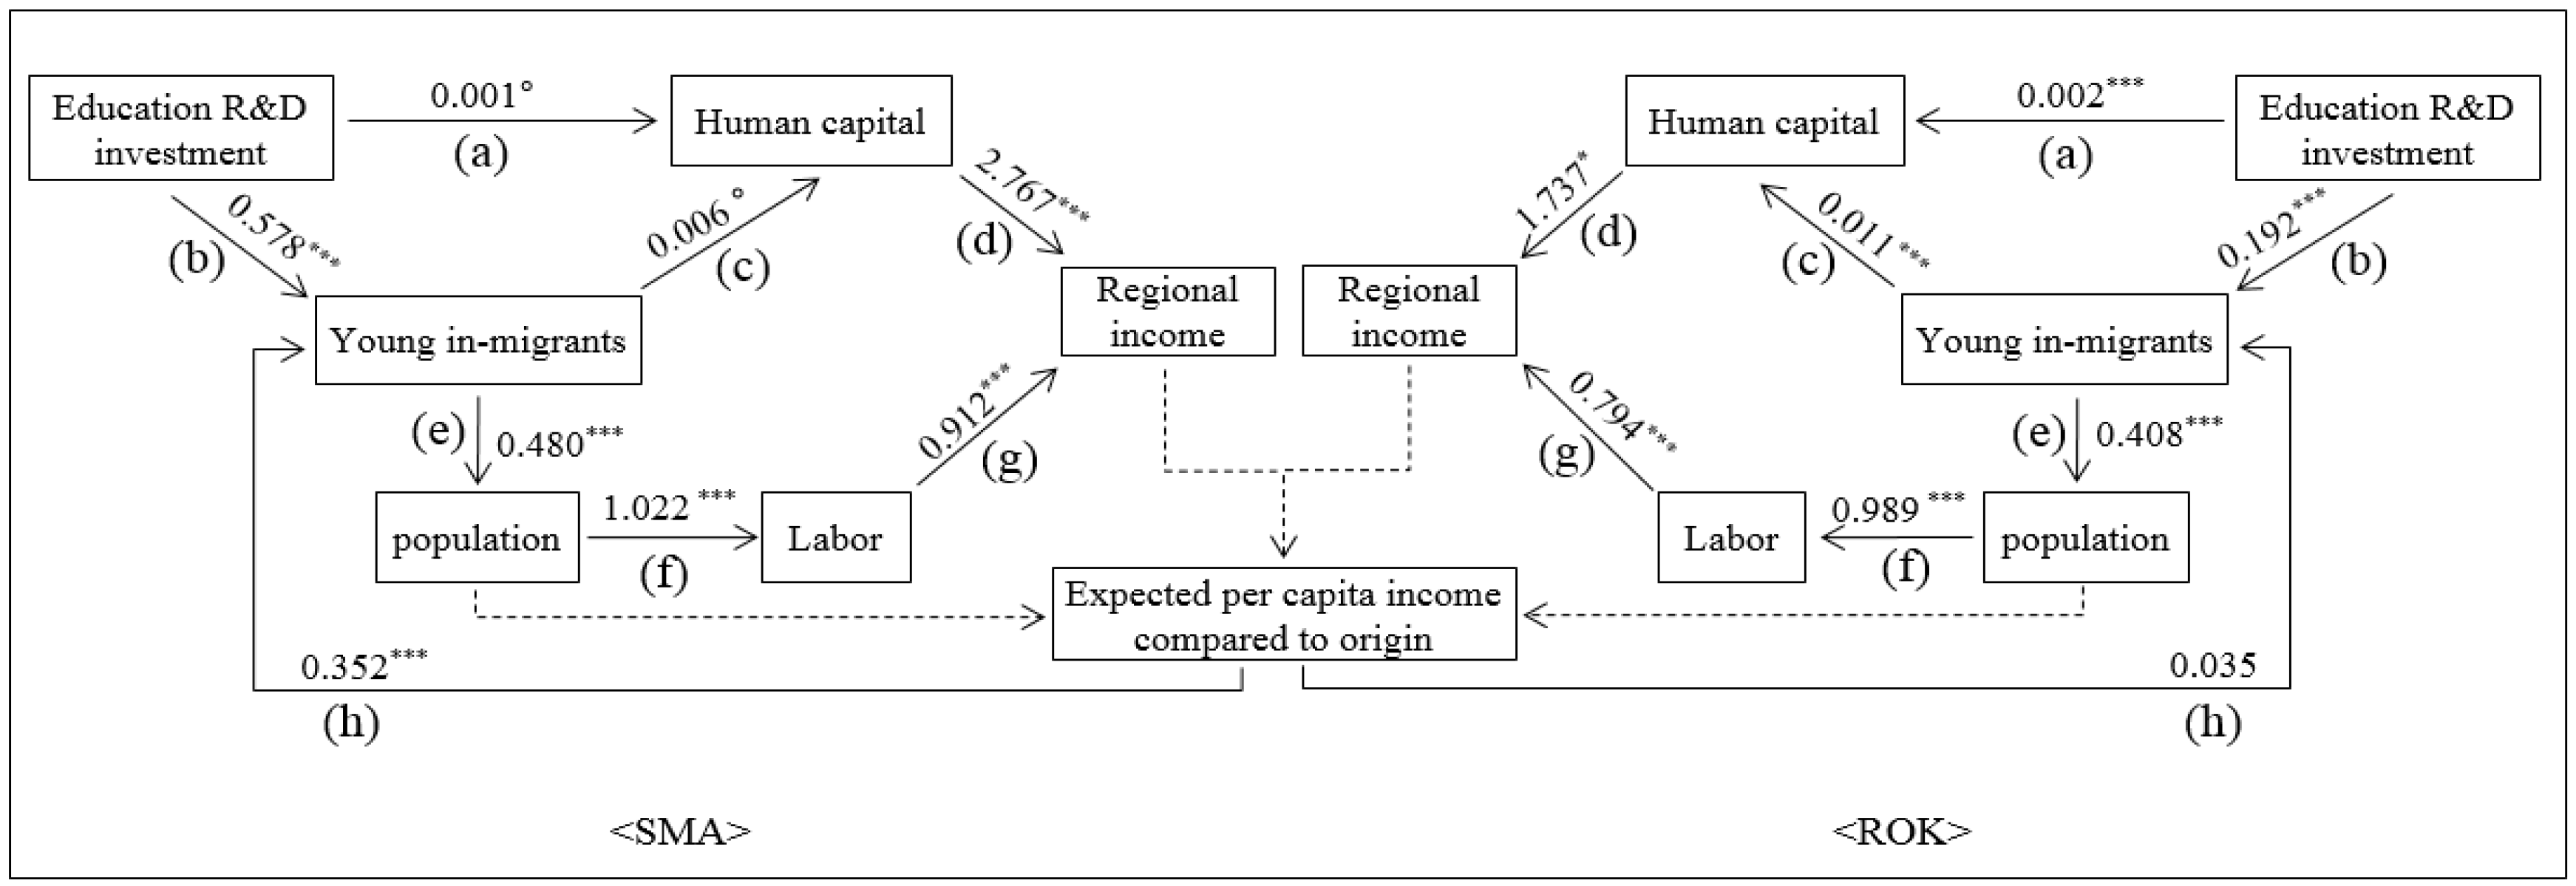
Figure 3.
Three scenarios with financial resources or efficiency changes of the investment. Note: The solid and the dotted lines mean direct and indirect effect, respectively.
Figure 3.
Three scenarios with financial resources or efficiency changes of the investment. Note: The solid and the dotted lines mean direct and indirect effect, respectively.

Table 1.
Variable descriptions.
| Name | Definition |
|---|---|
| Regional Economic Performance | |
| Y | Gross regional production (GRP) |
| L | Labor inputs |
| K | Physical capital stock |
| HC | The average number of schooling years for university graduated workers |
| Human Capital Accumulation | |
| RD | R&D expenditure to universities from universities, companies, and governments |
| IMY | Number of in-migrants for age cohort 20–34 |
| CS | The level of consumer service amenities (measured by Location Quotient) |
| Physical Capital Flow | |
| KF | Demand for new physical capital flow |
| CP | Physical capital prices |
| IR | Three years of corporate bond yield rate (AA-grade) |
| SP | Average annual stock price |
| Determinant for Young In-Migrants | |
| REINC | Ratio of expected per capita income in a destination to that in an origin |
| IMLT19 | Number of in-migrants for age cohort below 19 |
| IMOT35 | Number of in-migrants for age cohort over 35 |
| IMA | Number of in-migrants for all ages |
| IOA | Number of out-migrants for all ages |
| Labor Supply | |
| POP | Total population |
| BP | Total Birth |
| DP | Total Death |
| IMA | Number of in-migrants for all ages |
| OMA | Number of out-migrants for all ages |
| Other Variables | |
| Regional dummies | R1, R2, R3, R4, R5 |
| FC | 1 after financial crisis, 0 before |
Table 2.
Descriptive statistics for the variables.
| SMA | ROK | |||||||
|---|---|---|---|---|---|---|---|---|
| Mean | SD | Min | Max | Mean | SD | Min | Max | |
| Y | 120.25 | 67.74 | 25.09 | 222.01 | 29.82 | 14.69 | 4.90 | 66.55 |
| L | 3.52 | 3.52 | 1.00 | 5.54 | 0.89 | 0.39 | 0.24 | 1.79 |
| K | 270.37 | 198.08 | 38.47 | 704.18 | 87.64 | 55.18 | 7.94 | 268.78 |
| HC | 15.38 | 0.14 | 15.13 | 15.61 | 15.30 | 0.14 | 14.92 | 15.55 |
| RD | 0.38 | 0.38 | 0.03 | 1.47 | 0.07 | 0.05 | 0.01 | 0.25 |
| IMY | 0.09 | 0.05 | 0.02 | 0.15 | 0.01 | 0.01 | 0.00 | 0.03 |
| CS | 0.98 | 0.12 | 0.73 | 1.18 | 1.10 | 0.37 | 0.34 | 2.03 |
| KF | 34.48 | 19.22 | 8.07 | 68.13 | 9.03 | 0.73 | 0.45 | 3.32 |
| CP | 99.40 | 5.83 | 88.84 | 107.56 | 99.41 | 5.79 | 88.84 | 107.56 |
| IR | 7.60 | 3.21 | 4.68 | 15.10 | 7.57 | 3.15 | 4.68 | 15.10 |
| SP | 964.68 | 401.06 | 406.07 | 1712.46 | 966.53 | 397.52 | 406.0 | 1712.46 |
| REINC | 5.44 | 5.30 | 0.44 | 28.76 | 0.41 | 0.39 | 0.03 | 2.27 |
| IMLT19 | 3.04 | 2.26 | 0.20 | 11.28 | 2.75 | 2.20 | 0.20 | 12.54 |
| IMOT35 | 4.43 | 3.28 | 0.27 | 16.24 | 4.33 | 3.49 | 0.23 | 19.94 |
| IMA | 14.56 | 10.33 | 1.00 | 41.96 | 11.88 | 8.89 | 0.83 | 46.93 |
| POP | 7626.19 | 3616.06 | 2445.61 | 11460.61 | 1957.99 | 840.63 | 527.59 | 3851.31 |
| BP | 0.92 | 0.06 | 0.88 | 0.99 | 0.87 | 0.09 | 0.71 | 0.99 |
| DP | 0.40 | 0.03 | 0.38 | 0.43 | 0.55 | 0.21 | 0.01 | 0.82 |
| OMA | 2.68 | 3.56 | −7.13 | 20.35 | 14.56 | 10.33 | 1.00 | 41.96 |
| R1 | 0.33 | 0.48 | 0.00 | 1.00 | ||||
| R2 | 0.33 | 0.48 | 0.00 | 1.00 | ||||
| R3 | 0.38 | 0.49 | 0.00 | 1.00 | ||||
| R4 | 0.08 | 0.27 | 0.00 | 1.00 | ||||
| R5 | 0.41 | 0.39 | 0.03 | 2.27 | ||||
| FC | 0.92 | 0.27 | 0.00 | 1.00 | ||||
Note: Unit is $1000 US dollars for Y, K, RD and KF; a million persons for L, IMT, IMLT19, IMOT35, IMA, OMA and POP; years for HC, index for SS and CP; percent for IR; stock price index for SP; ratio for REINC; and hundred persons for BP and DP.
Table 3.
Estimation results.
| SMA | ROK | ||||
|---|---|---|---|---|---|
| (1) Dependent variable: Y | |||||
| Intercept | −6.727 * | (3.670) | Intercept | −4.250 ° | (2.771) |
| L | 0.904 *** | (0.033) | L | 0.794 *** | (0.031) |
| K | 0.223 *** | (0.015) | K | 0.331 *** | (0.021) |
| HC | 2.767 ** | (1.459) | HC | 1.737 * | (1.009) |
| R1 | −0.226 *** | (0.017) | FC | −0.091 ** | (0.038) |
| R3 | −0.163 *** | (0.022) | |||
| R4 | 0.847 *** | (0.045) | |||
| R-square | 0.999 | R-square | 0.962 | ||
| (2) Dependent variable: HC | |||||
| Intercept | 2.621 *** | (0.021) | Intercept | 2.561 *** | (0.020) |
| RD | 0.001 ° | (0.001) | RD | 0.002 *** | (0.001) |
| IMY | 0.006 ° | (0.012) | IMY | 0.011 *** | (0.002) |
| CS | 0.018 *** | (0.001) | CS | 0.018 *** | (0.002) |
| R4 | 0.028 *** | (0.004) | |||
| R-square | 0.852 | R-square | 0.358 | ||
| (3) Dependent variable: L | |||||
| Intercept | −1.128 *** | (0.181) | Intercept | −0.635 *** | (0.147) |
| POP | 1.022 *** | (0.012) | POP | 0.989 *** | (0.010) |
| R-square | 0.995 | R-square | 0.983 | ||
| (4) Dependent variable: KF | |||||
| Intercept | −0.497 | (2.681) | Intercept | 2.954 ° | (1.934) |
| Y | 1.128 *** | (0.030) | Y | 0.968 *** | (0.023) |
| CP | −0.555 | (0.502) | CP | −0.816 | (0.363) |
| IR | 0.112 * | (0.064) | IR | 0.064 ° | (0.046) |
| SP | −0.086 | (0.071) | SP | 0.015 | (0.051) |
| R2 | −0.575 *** | (0.047) | R3 | −0.224 *** | (0.026) |
| R-square | 0.981 | R-square | 0.930 | ||
| Observation | 39 | Observation | 169 | ||
| (5) Dependent variable: IMY | |||||
| Intercept | 1.308 *** | (0.340) | Intercept | 6.048 *** | (0.524) |
| RD | 0.578 *** | (0.027) | RD | 0.192 *** | (0.047) |
| REINC | 0.352 *** | (0.094) | REINC | 0.035 | (0.153) |
| R4 | −0.989 *** | (0.202) | |||
| R5 | 0.562 *** | (0.142) | |||
| R-square | 0.516 | R-square | 0.157 | ||
| (6) Dependent variable: IMLT19 | |||||
| Intercept | 0.294 ** | (0.103) | Intercept | 0.487 *** | (0.115) |
| IMOT35 | 0.919 *** | (0.013) | IMOT35 | 0.886 *** | (0.014) |
| R-square | 0.912 | R-square | 0.886 | ||
| (7) Dependent variable: IMA | |||||
| Intercept | 1.053 *** | (0.003) | Intercept | 1.078 *** | (0.004) |
| IMLT19 | 0.206 *** | (0.002) | IMLT19 | 0.228 *** | (0.002) |
| IMY | 0.480 *** | (0.002) | IMY | 0.408 *** | (0.003) |
| IMOT35 | 0.314 *** | (0.001) | IMOT35 | 0.365 *** | (0.002) |
| R-square | 0.999 | R-square | 0.999 | ||
| Observation | 507 | Observation | 507 | ||
Note: *** significant at 1% level; ** significant at 5% level; * significant at 10% level; ° significant at 15% level. Value in parentheses indicates standard error of the coefficient.
Table 4.
SMA’s and ROK’s per capita income (unit: thousand US dollars).
| 2010 | 2011 | 2012 | 2013 | 2014 | 2015 | 2016 | 2017 | 2018 | 2019 | 2020 | 2021 | 2022 | |
| SMA | 18.80 | 19.12 | 19.41 | 19.69 | 19.97 | 20.23 | 20.50 | 20.75 | 21.00 | 21.24 | 21.48 | 21.71 | 21.94 |
| ROK | 17.79 | 18.07 | 18.34 | 18.60 | 18.86 | 19.12 | 19.37 | 19.62 | 19.87 | 20.11 | 20.35 | 20.59 | 20.82 |
| Ratio | 94.61 | 94.52 | 94.48 | 94.48 | 94.48 | 94.50 | 94.53 | 94.57 | 94.62 | 94.68 | 94.75 | 94.82 | 94.89 |
| Change of ratio | −0.10 | −0.04 | 0.00 | 0.00 | 0.02 | 0.03 | 0.04 | 0.05 | 0.06 | 0.07 | 0.07 | 0.07 | |
| 2023 | 2024 | 2025 | 2026 | 2027 | 2028 | 2029 | 2030 | 2031 | 2032 | 2033 | 2034 | ||
| SMA | 22.17 | 22.39 | 22.61 | 22.83 | 23.04 | 23.25 | 23.46 | 23.67 | 23.88 | 24.09 | 24.30 | 24.51 | - |
| ROK | 21.06 | 21.28 | 21.51 | 21.74 | 21.96 | 22.18 | 22.40 | 22.61 | 22.83 | 23.04 | 23.26 | 23.47 | - |
| Ratio | 94.97 | 95.06 | 95.14 | 95.22 | 95.30 | 95.39 | 95.46 | 95.53 | 95.60 | 95.66 | 95.71 | 95.74 | - |
| Change of ratio | 0.08 | 0.09 | 0.08 | 0.08 | 0.08 | 0.09 | 0.07 | 0.07 | 0.07 | 0.06 | 0.05 | 0.03 | - |
Table 5.
Per capita income ratio of ROK to SMA in Scenario 1 (unit: %).
| Year | 0 | 20 | 40 | 60 | 80 | 100 |
|---|---|---|---|---|---|---|
| 2010 | 94.61 | 94.80 | 94.96 | 95.09 | 95.21 | 95.32 |
| 2011 | 94.52 | 94.83 | 95.09 | 95.31 | 95.51 | 95.69 |
| 2012 | 94.48 | 94.92 | 95.28 | 95.60 | 95.88 | 96.12 |
| 2013 | 94.48 | 95.05 | 95.52 | 95.92 | 96.28 | 96.59 |
| 2014 | 94.48 | 95.18 | 95.75 | 96.25 | 96.67 | 97.05 |
| 2015 | 94.50 | 95.32 | 96.00 | 96.58 | 97.08 | 97.52 |
| 2016 | 94.53 | 95.48 | 96.27 | 96.93 | 97.50 | 97.99 |
| 2017 | 94.57 | 95.65 | 96.54 | 97.28 | 97.92 | 98.46 |
| 2018 | 94.62 | 95.83 | 96.82 | 97.64 | 98.34 | 98.93 |
| 2019 | 94.68 | 96.02 | 97.11 | 98.01 | 98.76 | 99.38 |
| 2020 | 94.75 | 96.21 | 97.40 | 98.38 | 99.18 | 99.83 |
| 2021 | 94.82 | 96.41 | 97.70 | 98.74 | 99.59 | 100.25 † |
| 2022 | 94.89 | 96.62 | 98.00 | 99.11 | 99.99 | 100.66 † |
| 2023 | 94.97 | 96.83 | 98.31 | 99.48 | 100.38 † | 101.04 † |
| 2024 | 95.06 | 97.04 | 98.62 | 99.84 | 100.75 † | 101.40 † |
| 2025 | 95.14 | 97.26 | 98.92 | 100.19 † | 101.11 † | 101.72 † |
| 2026 | 95.22 | 97.48 | 99.23 | 100.54 † | 101.45 † | 102.00 † |
| 2027 | 95.30 | 97.69 | 99.53 | 100.87 † | 101.77 † | 102.24 † |
| 2028 | 95.39 | 97.91 | 99.82 | 101.20 † | 102.06 † | 102.44 † |
| 2029 | 95.46 | 98.12 | 100.12 † | 101.51 † | 102.33 † | 102.59 † |
| 2030 | 95.53 | 98.32 | 100.40 † | 101.81 † | 102.56 † | 102.69 † |
| 2031 | 95.60 | 98.52 | 100.68 † | 102.09 † | 102.76 † | 102.73 † |
| 2032 | 95.66 | 98.72 | 100.94 † | 102.35 † | 102.93 † | 102.73 † |
| 2033 | 95.71 | 98.90 | 101.20 † | 102.58 † | 103.06 † | 102.67 † |
| 2034 | 95.74 | 99.07 | 101.43 † | 102.80 † | 103.15 † | 102.55 † |
Note: † indicates the ROK’s maximum attainable per capita income ratio compared with the SMA for each year under the given scenarios.
Table 6.
Per capita income ratio of ROK to SMA in Scenario 2 (unit: %).
| Year | 0 | 20 | 40 | 60 | 80 | 100 |
|---|---|---|---|---|---|---|
| 2010 | 94.61 | 95.51 | 96.43 | 97.34 | 98.27 | 99.21 |
| 2011 | 94.52 | 95.44 | 96.38 | 97.33 | 98.29 | 99.25 |
| 2012 | 94.48 | 95.43 | 96.39 | 97.36 | 98.34 | 99.33 |
| 2013 | 94.48 | 95.45 | 96.43 | 97.42 | 98.43 | 99.44 |
| 2014 | 94.48 | 95.47 | 96.48 | 97.49 | 98.51 | 99.55 |
| 2015 | 94.50 | 95.51 | 96.53 | 97.57 | 98.61 | 99.67 |
| 2016 | 94.53 | 95.56 | 96.60 | 97.66 | 98.72 | 99.80 |
| 2017 | 94.57 | 95.62 | 96.68 | 97.75 | 98.84 | 99.94 |
| 2018 | 94.62 | 95.69 | 96.77 | 97.86 | 98.96 | 100.08 † |
| 2019 | 94.68 | 95.77 | 96.86 | 97.97 | 99.10 | 100.24 † |
| 2020 | 94.75 | 95.85 | 96.96 | 98.09 | 99.24 | 100.39 † |
| 2021 | 94.82 | 95.94 | 97.07 | 98.22 | 99.38 | 100.56 † |
| 2022 | 94.89 | 96.03 | 97.18 | 98.35 | 99.53 | 100.72 † |
| 2023 | 94.97 | 96.13 | 97.29 | 98.48 | 99.67 | 100.89 † |
| 2024 | 95.06 | 96.22 | 97.41 | 98.61 | 99.82 | 101.06 † |
| 2025 | 95.14 | 96.32 | 97.52 | 98.74 | 99.98 | 101.23 † |
| 2026 | 95.22 | 96.42 | 97.64 | 98.87 | 100.13 † | 101.39 † |
| 2027 | 95.30 | 96.52 | 97.76 | 99.01 | 100.27 † | 101.56 † |
| 2028 | 95.39 | 96.62 | 97.87 | 99.13 | 100.42 † | 101.72 † |
| 2029 | 95.46 | 96.71 | 97.98 | 99.26 | 100.56 † | 101.88 † |
| 2030 | 95.53 | 96.80 | 98.08 | 99.38 | 100.70 † | 102.03 † |
| 2031 | 95.60 | 96.88 | 98.17 | 99.49 | 100.82 † | 102.18 † |
| 2032 | 95.66 | 96.95 | 98.26 | 99.59 | 100.94 † | 102.31 † |
| 2033 | 95.71 | 97.01 | 98.34 | 99.69 | 101.05 † | 102.44 † |
| 2034 | 95.74 | 97.07 | 98.41 | 99.77 | 101.15 † | 102.55 † |
Note: † indicates the ROK’s maximum attainable per capita income ratio compared with the SMA for each year under the given scenarios.
Table 7.
Per capita income ratio of ROK to SMA in Scenario 3 (unit: %).
| Year | 0 | 20 | 40 | 60 | 80 | 100 |
|---|---|---|---|---|---|---|
| 2010 | 94.61 | 95.27 | 95.84 | 96.29 | 96.55 | 96.50 |
| 2011 | 94.52 | 95.16 | 95.71 | 96.11 | 96.29 | 96.11 |
| 2012 | 94.48 | 95.12 | 95.66 | 96.03 | 96.13 | 95.85 |
| 2013 | 94.48 | 95.12 | 95.64 | 95.97 | 96.01 | 95.63 |
| 2014 | 94.48 | 95.12 | 95.63 | 95.92 | 95.91 | 95.43 |
| 2015 | 94.50 | 95.14 | 95.63 | 95.89 | 95.82 | 95.27 |
| 2016 | 94.53 | 95.17 | 95.64 | 95.88 | 95.76 | 95.14 |
| 2017 | 94.57 | 95.20 | 95.67 | 95.88 | 95.72 | 95.04 |
| 2018 | 94.62 | 95.25 | 95.71 | 95.90 | 95.70 | 94.97 |
| 2019 | 94.68 | 95.31 | 95.76 | 95.93 | 95.70 | 94.92 |
| 2020 | 94.75 | 95.38 | 95.82 | 95.97 | 95.71 | 94.90 |
| 2021 | 94.82 | 95.45 | 95.89 | 96.03 | 95.74 | 94.90 |
| 2022 | 94.89 | 95.53 | 95.96 | 96.09 | 95.78 | 94.91 |
| 2023 | 94.97 | 95.61 | 96.04 | 96.16 | 95.83 | 94.95 |
| 2024 | 95.06 | 95.70 | 96.13 | 96.23 | 95.89 | 95.00 |
| 2025 | 95.14 | 95.79 | 96.22 | 96.31 | 95.96 | 95.07 |
| 2026 | 95.22 | 95.88 | 96.31 | 96.40 | 96.04 | 95.15 |
| 2027 | 95.30 | 95.97 | 96.40 | 96.49 | 96.13 | 95.25 |
| 2028 | 95.39 | 96.05 | 96.49 | 96.58 | 96.22 | 95.35 |
| 2029 | 95.46 | 96.14 | 96.58 | 96.67 | 96.32 | 95.47 |
| 2030 | 95.53 | 96.22 | 96.66 | 96.76 | 96.41 | 95.59 |
| 2031 | 95.60 | 96.29 | 96.74 | 96.85 | 96.51 | 95.72 |
| 2032 | 95.66 | 96.36 | 96.82 | 96.93 | 96.61 | 95.85 |
| 2033 | 95.71 | 96.42 | 96.88 | 97.01 | 96.70 | 95.99 |
| 2034 | 95.74 | 96.47 | 96.94 | 97.07 | 96.79 | 96.12 |
© 2017 by the authors. Licensee MDPI, Basel, Switzerland. This article is an open access article distributed under the terms and conditions of the Creative Commons Attribution (CC BY) license (http://creativecommons.org/licenses/by/4.0/).
Share and Cite
MDPI and ACS Style
Woo, Y.; Kim, E.; Lim, J. The Impact of Education and R&D Investment on Regional Economic Growth. Sustainability 2017, 9, 676. https://doi.org/10.3390/su9050676
AMA Style
Woo Y, Kim E, Lim J. The Impact of Education and R&D Investment on Regional Economic Growth. Sustainability. 2017; 9(5):676. https://doi.org/10.3390/su9050676
Chicago/Turabian StyleWoo, Youngjin, Euijune Kim, and Jaewon Lim. 2017. "The Impact of Education and R&D Investment on Regional Economic Growth" Sustainability 9, no. 5: 676. https://doi.org/10.3390/su9050676
Note that from the first issue of 2016, this journal uses article numbers instead of page numbers. See further details here.