
Improvements in Soil Carbon and Nitrogen Capacities after Shrub Planting to Stabilize Sand Dunes in China’s Horqin Sandy Land

1
Northwest Institute of Eco-Environment and Resources, Chinese Academy of Sciences, Lanzhou 730000, China
2
Naiman Desertification Research Station, Northwest Institute of Eco-Environment and Resources, Chinese Academy of Sciences, Tongliao 028300, China
3
School of Environmental and Municipal Engineering, Lanzhou Jiaotong University, Lanzhou 730070, China
*
Authors to whom correspondence should be addressed.
Sustainability 2017, 9(4), 662; https://doi.org/10.3390/su9040662
Submission received: 24 February 2017
/
Revised: 9 April 2017
/
Accepted: 19 April 2017
/
Published: 23 April 2017
(This article belongs to the Special Issue Ecological Restoration for Sustainable Forest Management)
Abstract
:Caragana microphylla, a native perennial leguminous shrub, is widely used for desertification control in China’s Horqin Sandy Land. We investigated the effects of afforestation using C. microphylla in areas with fixed and active dunes on soil carbon (C) and nitrogen (N) storage in the soil total and light-fraction (LF) organic matter. Compared to the values in the control areas, soil organic carbon (SOC) storage to a depth of 100 cm increased by 88%, 74%, and 145% at 9, 15, and 31 years after shrub planting, respectively; the corresponding values were 68%, 61%, and 195% for total nitrogen (TN) storage, 109%, 199%, and 202% for LF organic carbon storage, and 203%, 337%, and 342% for LF nitrogen storage. The soil light-fraction (LF) organic matter contributed significantly to total SOC and TN storage, despite the low proportion of total soil mass accounted for by the LF dry matter. Thus, afforestation using C. microphylla was an effective way to sequester C and to restore degraded soils, but the process was slow; it would take more than 100 years to fully restore SOC storage in active dunes through afforestation with C. microphylla in the Horqin Sandy Land.
1. Introduction
The increase in atmospheric carbon dioxide (CO2) concentrations from 280 ppm in pre-industrial times to 391 ppm in 2011 has been attributed to numerous anthropogenic activities, including unsustainable land use, that have resulted in an increased severity and extent of soil degradation and desertification, and this increase has contributed greatly to global warming [1,2]. Arid and semiarid regions comprise 47.2% of the world’s land and more than two-thirds of these fragile ecosystems have undergone degradation and desertification, primarily due to overgrazing, other unsustainable human activities, and climate change [3]. Lal [4] estimated that global desertification led to a total loss of 19 to 29 Pg·C from the plant-soil continuum. However, it is increasingly accepted that restoration of vegetation cover in the world’s arid and semiarid regions could create a high potential C sink because of the vast area of this land combined with widespread degradation and desertification in these areas [5,6].
Many agroforestry management practices can be employed to sequester C and counteract land degradation. Afforestation (artificial planting of trees or shrubs) is one of the most effective ways because of the durability and large mass of the woody stems, combined with the ongoing contribution of organic matter to the soil. Afforestation is usually successful above the isohyet of 200 mm mean annual rainfall and, occasionally, at a lower annual rainfall, if the introduced or reintroduced species is appropriate (i.e., does not require more water than the environment can provide) and if the causes of the degradation have been discontinued or strongly mitigated [7]. Numerous researchers have investigated the benefits associated with afforestation to sequester C and to restore degraded soils and ecosystems in arid and semiarid regions [5,8,9,10,11,12]. However, this restoration ability cannot be assumed, since some researchers have reported negative or neutral effects of afforestation on the soil C content at some sites [13,14,15]. In addition, some doubt has been expressed over the effectiveness of afforestation for combating desertification and controlling dust storms in the arid and semiarid regions of China [16].
Historically, the Horqin Sandy Land of northern China (42°41′N to 45°45′N, 118°35′E to 123°30′E; 180 m to 650 m asl) was a grassland with many lakes and lush vegetation dominated by palatable grass species, along with sparsely scattered woody species. However, almost 80% of this region has suffered from desertification since the 1950s, primarily due to the region’s fragile ecology combined with climate change and inappropriate anthropogenic activities such as overgrazing, excessive cultivation of marginal farmland, firewood harvesting, and excessive groundwater withdrawal [17]. The landscape became dominated by active dunes (Figure 1a) by the late 1970s, and local people live in poverty due to the severe environmental degradation in the region. Zhou et al. [18] estimated that the total C and N losses from the plant-soil system of the Horqin Sandy Land, which covers 30,152.7 km2, amounted to 107.53 and 9.97 Mt, respectively, compared with the original grassland values due to the desertification that occurred in the last century. A range of restoration practices have been widely implemented to control the desertification, including the establishment of straw checkerboards to protect exposed soil against wind, the establishment of grazing exclosures to protect surviving vegetation against livestock, and afforestation using indigenous and introduced tree and shrub species. These efforts have significantly reversed desertification and improved the regional ecological environment [19]. The establishment of grazing exclosures and the implementation of afforestation using an introduced tree species (Mongolian pine, Pinus sylvestris var. mongolica Litv.) in areas with active dunes in the region have had significant positive effects through the vegetation’s ability to sequester CO2 [17,20].
Caragana microphylla, a native perennial leguminous shrub, has performed well and is widely used for stabilization of active dunes in the Horqin Sandy Land (Figure 1b). Previous studies have investigated the effects of C. microphylla plantations on the spatial variability of soil nutrients and microbiological properties [21] and on the diversity and composition of native soil bacterial communities [22]. However, we found only one published study of the accumulation of organic C and nitrogen (N) in soils following the establishment of an age sequence of C. microphylla plantations in desertified areas [23]. Our previous study [24] also investigated the effects of C. microphylla plantations in sandy land on C storage in the soil light-fraction (LF) organic matter, which is a plant-like and dynamic fraction of the soil organic matter that reflects short-term shifts in soil organic matter storage and turnover and that has been regarded as an early indicator of management-induced changes in soil quality [25,26]. However, previous research only sampled soil to a depth of 20 cm [23] or 5 cm [24]. This limitation made it difficult to compare the results with those of other researchers, who have typically sampled to a depth of 100 cm, which is a common threshold used for meta-analyses [27].
Therefore, the objectives of the current research were to investigate changes in soil organic C (SOC) and total N (TN) storage to a depth of 100 cm, and to investigate the contribution of the soil LF organic matter to SOC and TN accumulation following afforestation using C. microphylla in areas of the Horqin Sandy Land with fixed and active dunes. The present results, combined with the results of our previous studies [17,20], can provide the basic data required to comprehensively estimate the potential C and N sequestration in soils that would result from the restoration of severely desertified sandy land through tree and shrub planting as well as grazing exclosures.
2. Materials and Methods
2.1. Study Area
Our study was conducted in the Naiman Banner (a county-level division) in China’s Inner Mongolia Autonomous Region, one of the most seriously desertified regions in the southern part of the Horqin Sandy Land. In 1985, the Chinese Academy of Sciences established the Naiman Desertification Research Station (42°55′52″N, 120°41′56″E, 377 m asl), which is 13 km from the urban center of the Naiman Banner. The study area is characterized by sand dunes that alternate with gently undulating interdunal lowlands. The region has a continental semiarid monsoon temperate climate regime, with a mean annual precipitation of 366 mm, of which 70% falls from June to August, a mean annual potential evaporation of 1935 mm, and a mean annual air temperature of 6.8 °C. Mean monthly temperatures range from a minimum of −13.2 °C in January to a maximum of 23.5 °C in July. The mean wind speed is 4.3 m·s−1, with occasional occurrences of gales ≥20 m·s−1 in winter and spring, when the vegetation cover is lowest and the soil is driest [17]. The area’s soils are derived from alluvial and aeolian sediments, and have been classified as Cambic Arenosols [28], with a coarse texture (medium to coarse sand) and a loose structure.
2.2. Site Selection and Location
The present study was conducted in April 2015. As study stands, we selected 9-, 15-, and 31-year-old C. microphylla plantations that had been established using seedlings. The 9-year-old plantations were established in areas with fixed dunes, whereas the 15- and 31-year-old plantations were established in areas with active dunes. Fixed dunes have better vegetation and soil environments than active dunes. The vegetation cover is generally 50–70% in fixed dunes, versus less than 10% in active dunes. Fixed and active dunes can be classified as having light and severe desertification, respectively, based on the Zhu and Chen [29] classification criteria. For the 9-year-old plantation, the spacing within and between the rows was 0.5 m × 1.5 m, with an average shrub height of 58 cm and an average crown diameter of 61 cm × 65 cm at the time of our study. For the 15-year-old plantation, the spacing within and between the rows was 1.0 m × 2.0 m, with an average shrub height of 134 cm and an average crown diameter of 149 cm × 137 cm at the time of our study. For the 31-year-old plantation, the spacing within and between the rows was 1.0 m × 2.0 m, with an average shrub height of 117 cm and an average crown diameter of 120 cm × 108 cm at the time of our study. The 9-year-old plantation was protected from livestock grazing, but the 15- and 31-year-old plantations underwent continuous grazing at an unquantified intensity (Figure 1c). All investigated plantations were pruned every 3 to 4 years to facilitate regeneration, but the biomass was removed from the sites to provide firewood for local residents (Figure 1d). Because no continuous long-term observational data was available for each plantation since its establishment, our approach does not represent a strict examination of the changes in a given plot over time; rather, it represents a “space for time” approach.
We selected three stands (replicates) in each plantation age class. In addition, we selected three sand dune sites in neighboring areas to use as the control for each plantation age class. For the 9-year-old plantations, which were established in an area of fixed dunes, the controls were provided by three sites with fixed dunes (as described in Section 2.2). The older plantations were established in areas with active dunes. The distances among the plantations ranged from 20 to 82 km and the 15- and 31-year-old plantations were established in areas with active dunes, about 62 km apart. Therefore, for each of the two older plantations, we used three sites with active dunes as the control (i.e., a total of six sites with active dunes). For each age class, we sampled the soil in three 30 m × 30 m plots at the plantation sites and three 30 m × 30 m plots at the control sites. Thus, we established a total of 18 plots in the present study. All plots faced south, and had a slope <20°. Although we did not control rigorously for the effect of topographic variations, we chose relatively flat sites along the midslope of each dune to provide some basic control over the effects of topography. However, in future research, it will be necessary to control more rigorously for topographic effects.
2.3. Soil Sampling
Each 30 m × 30 m plot was divided into 36 subplots (each 5 m × 5 m) and every subplot was numbered. We then randomly selected six subplots for soil sampling using simple random sampling. In each of the three plantation types, we selected two sampling locations: one under the shrub canopy and one in the soil between the rows of shrubs. At the control sites, samples were collected from six random subplots within each overall plot. After carefully removing large surface plant debris by hand, soil samples were collected using a soil auger (2.5 cm in diameter) from five layers: 0 to 10, 10 to 20, 20 to 40, 40 to 60, and 60 to 100 cm below the surface. At each location, 10 soil samples were collected and then mixed to provide a single composite sample for each soil layer. Therefore, in every plot, we obtained a total of 60 composite samples (30 under the canopy and 30 between the rows) for the five soil layers, versus only 30 composite samples at the control sites (i.e., because there were no shrubs at these sites). Soil samples under the shrub canopies were collected as close to the center of the shrub as possible.
To determine soil bulk density, three additional soil cores were collected from each layer at each location using a soil auger equipped with a stainless-steel cylinder (5.5 cm in diameter and 4.2 cm in height). The method was described in detail in our previous study [30]. To avoid bias in the bulk density that would have resulted from the presence of roots, we rejected any sampling location where obvious roots were encountered, and replaced that sample with a sample from a different location.
2.4. Laboratory Analyses
Soil samples were air-dried and hand-sieved through a 2 mm mesh to remove roots and other coarse debris. A portion of each soil sample was then ground to pass through a 0.25 mm mesh for determination of the SOC and TN concentrations. The remaining portion was stored at room temperature for determination of the LF organic matter content and the particle size distribution.
A subsample of the air-dried soil was weighed and dried at 105 °C for 24 h to determine the gravimetric water content, which refers to the soil hygroscopic water and is used for calculating the dry soil mass that we used to calculate the content of LF organic matter. Soil particle sizes were analyzed by the wet sieving method using sodium hexametaphosphate as the dispersing agent [31]. Each soil sample was separated into three fractions using nested sieves with openings of 2, 0.1, and 0.05 mm: these defined the coarse sand (2 to 0.1 mm), fine sand (0.1 to 0.05 mm), and silt + clay (<0.05 mm) fractions. The SOC concentration was determined using the Walkley-Black dichromate oxidation procedure [32]. The soil TN concentration was determined using the Kjeldahl procedure [33].
The LF organic matter was extracted from the soil using aqueous NaI solution at a density of 1.8 g·cm−3 according to the procedure described by Murage et al. [25]. The LF dry matter content was expressed as a percentage of the total oven-dry soil mass. To obtain enough LF for our analyses, we used three to six subsamples (i.e., 60 to 120 g) from each soil sample. We determined a single value of the LF organic C (LFOC) and N (LFN) concentrations for all five layers combined at a given location. The organic C and N concentrations in the LF organic matter were determined using the same procedures that were used for the bulk soil.
2.5. Data Analyses
The C and N storage per unit area in the bulk soil (the bulk elemental storage, BES, in kg·ha−1) and in the LF soil organic matter (the light-fraction elemental storage, LFES, in kg·ha−1) to a depth of 100 cm were estimated using the following equations:
where ECi represents the elemental concentration in the bulk soil (SOC or TN, in g·kg−1 ) in layer i, BDi represents the soil bulk density (in g·cm−3) in that layer, Ti (i = 1, 2, …, 5) represents the thickness of the soil sampling layer i (in cm), 100 represents a unit conversion factor, DMi represents the LF dry matter content as a proportion of the total soil mass (%), and ECLFi represents the LFOC or LFN concentration (in g·kg−1 dry LF organic matter).
Data were tested for normality using the Shapiro-Wilk test (with significance at p < 0.05), and homogeneity of variance was confirmed using Levene’s test (with significance at p < 0.05) before further statistical testing. No transformations were required because the data met the assumptions of normality and homogeneity of variance. The measured soil variables and the resultant C and N storage were analyzed using one-way ANOVA to identify significant differences among the treatments. When the ANOVA results were significant, we compared means using the least-significant-difference (LSD) test. Correlations between parameters were calculated using Pearson’s correlation coefficient (r). The statistical analysis was performed using version 13.5 of the SPSS software (SPSS, Chicago, IL, USA).
3. Results
3.1. Changes in Soil Particle-Size Distributions and Bulk Density
The soil particle-size distributions for the three plantations (Table 1) generally indicated that the proportion of coarse sand decreased significantly and the proportions of fine sand and silt + clay increased significantly after the establishment of plantations in areas with sand dunes. Within each plantation age class, the proportion of coarse sand under the shrub canopy was generally lower than that between the rows; in contrast, the proportions of fine sand and silt + clay were higher under the shrub canopy, although the differences were generally not significant. Compared to the control areas, the mean values under the canopy and between the rows for coarse sand to a depth of 100 cm decreased by 4%, 4%, and 10%, respectively, in the 9-, 15-, and 31-year-old plantations; the corresponding values for fine sand increased by 26%, 43%, and 215%, whereas those for silt + clay increased by 161%, 65%, and 294%. (These values refer to the columns labeled “Mean” in Table 1.) Except for fine sand in the 9-year-old plantation, each of the particle-size fractions for the combined layer from 0 to 100 cm differed significantly (p < 0.05) between the plantation and the corresponding control area within each age class.
Soil bulk density decreased following the establishment of plantations (Table 1). However, the differences between the plantations and the corresponding control areas were only significant (p < 0.05) in the upper 10 cm of the soil for the 15- and 31-year age classes. No significant difference was detected for the combined layer from 0 to 100 cm between the plantation and control areas. The soil under the shrub canopy generally had a lower bulk density than that between the rows, but the differences were only significant (p < 0.05) in the layers from 0 to 10 cm and from 10 to 20 cm in the 15-year-old plantation, and from 0 to 10 cm in the 31-year-old plantation.
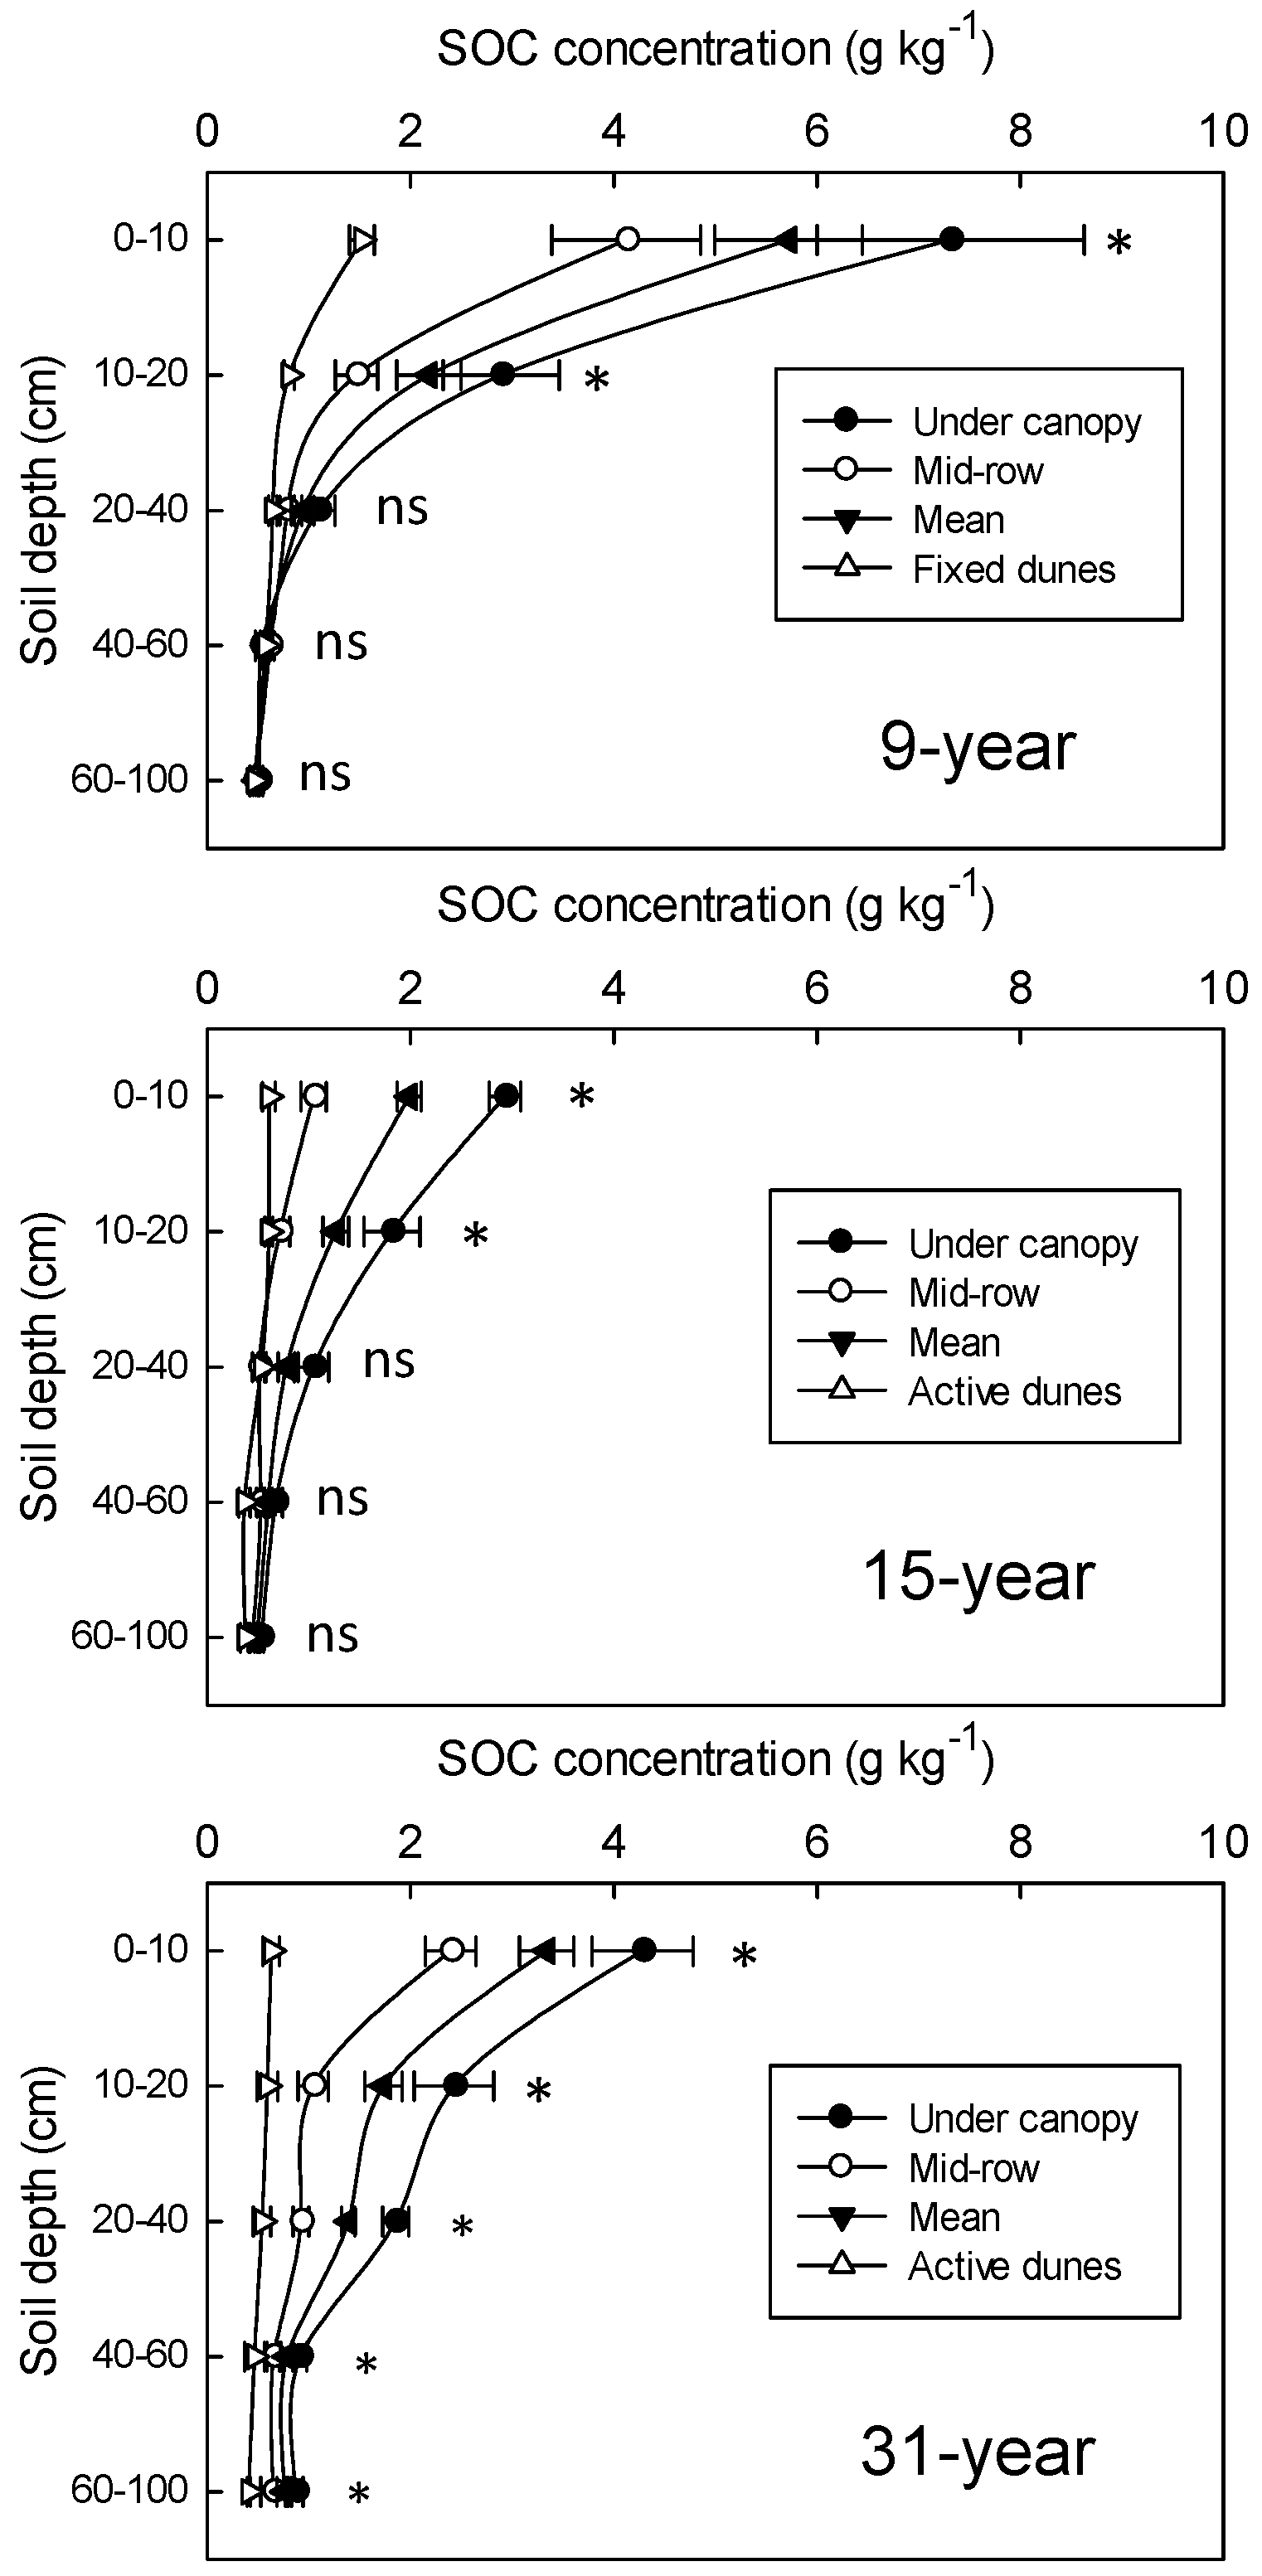
3.2. Changes in SOC and TN Concentrations
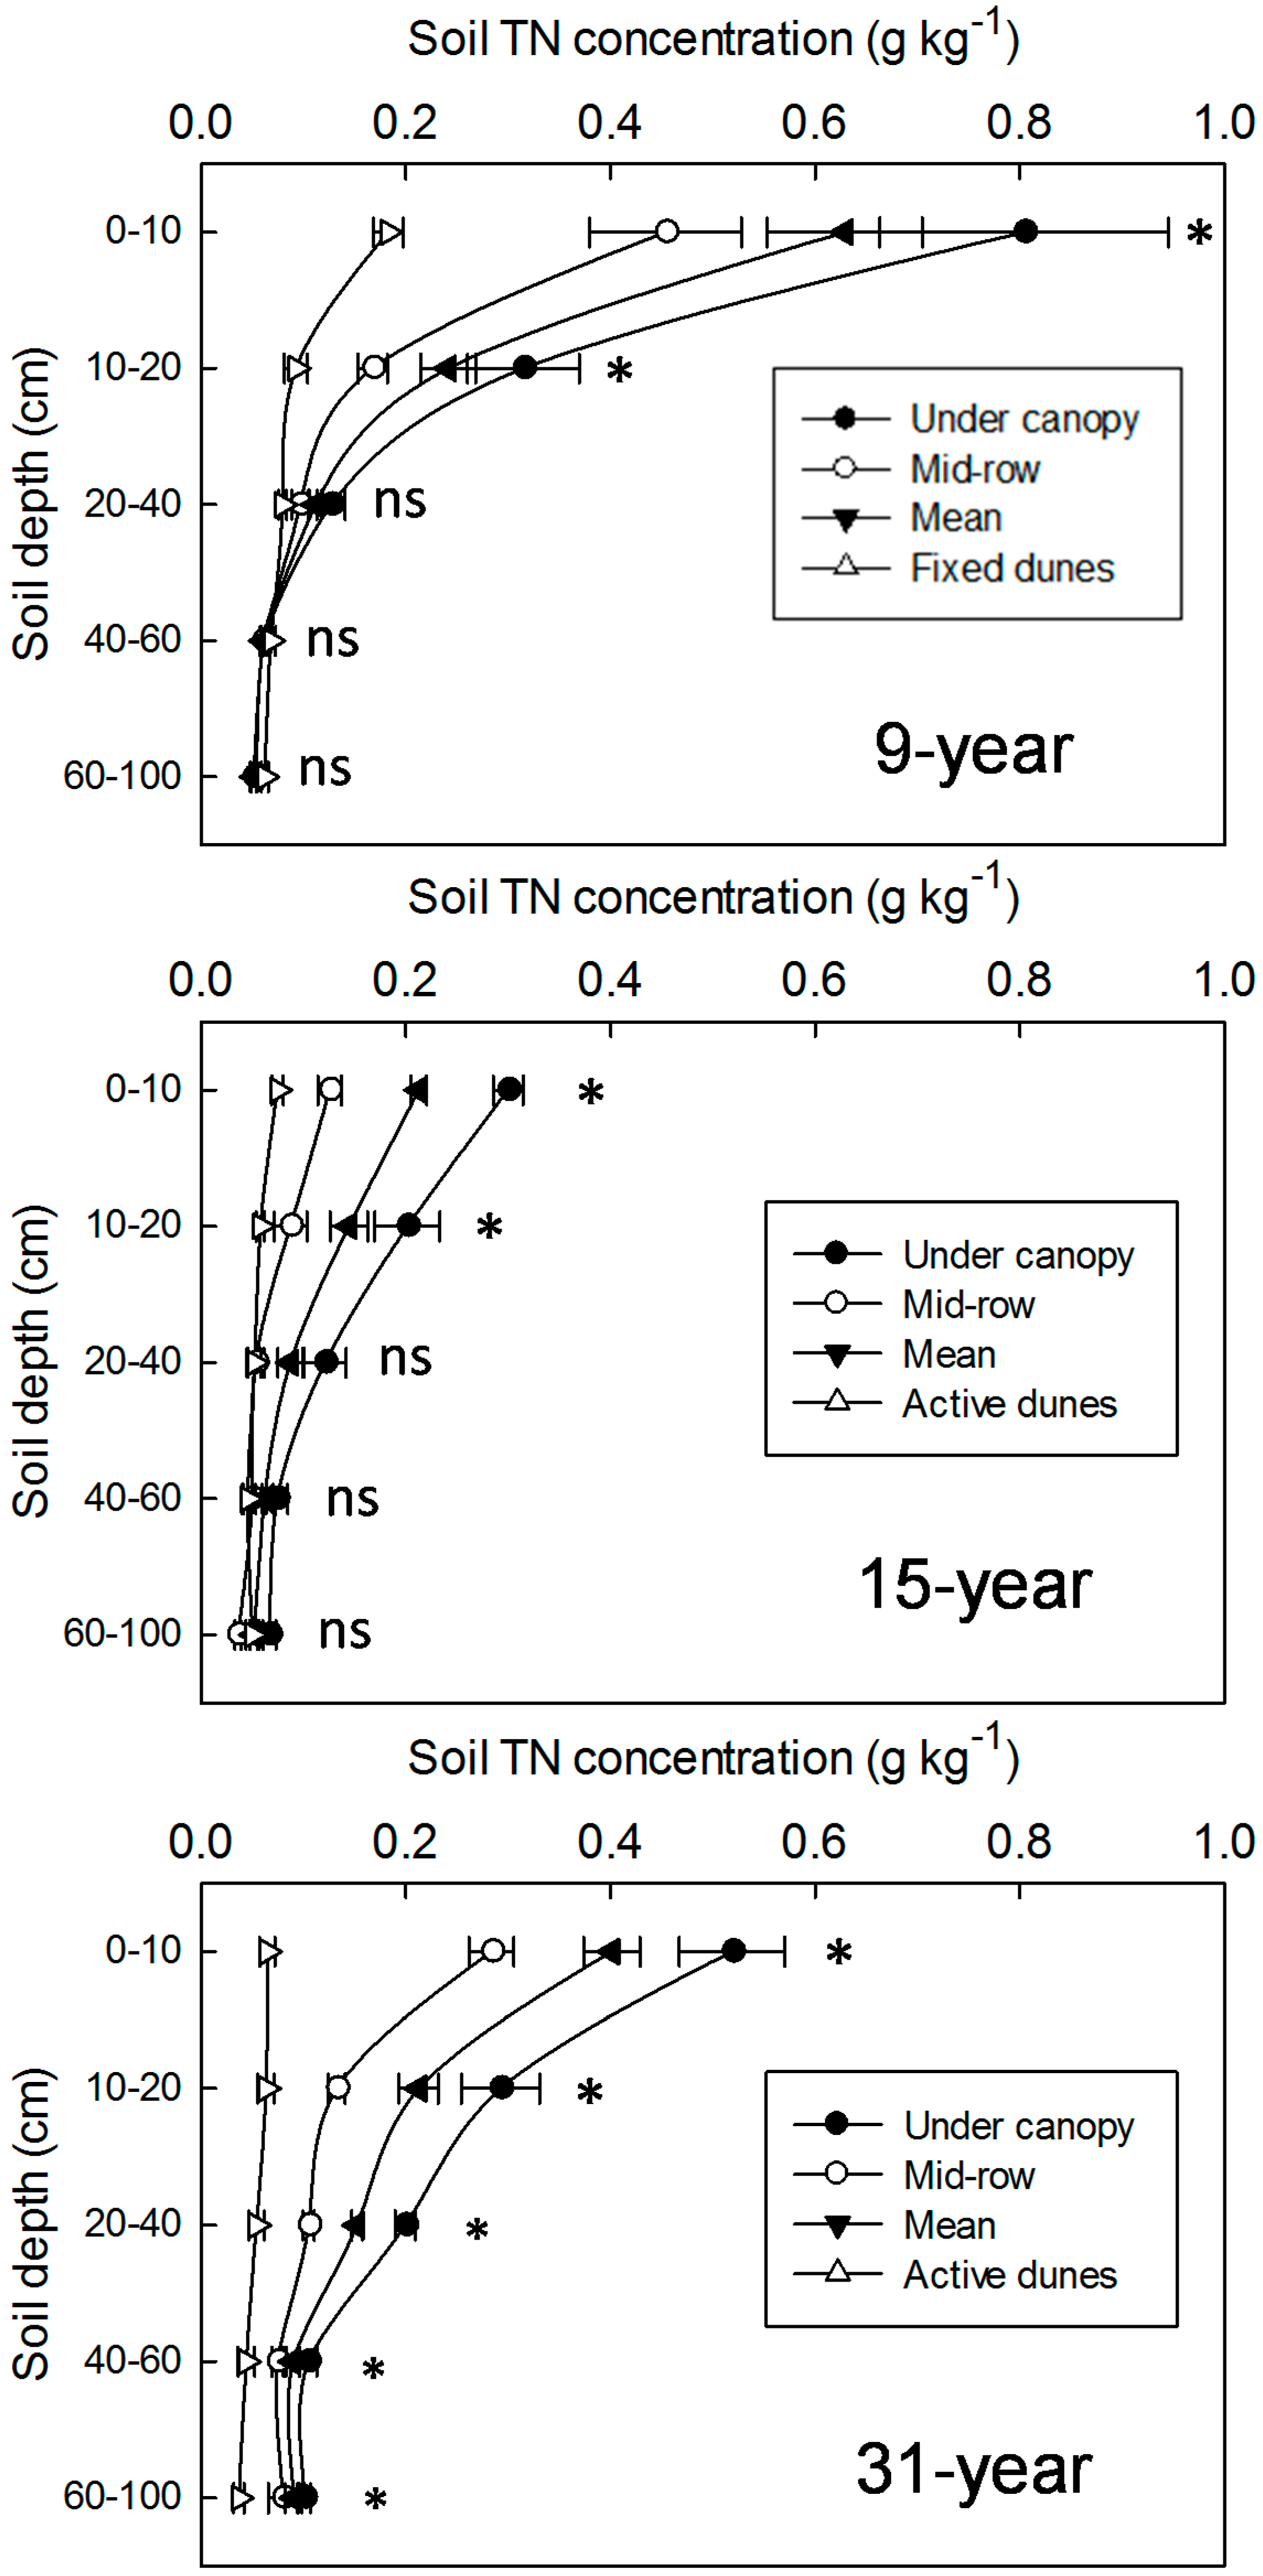
The shrub plantations showed increased SOC (Figure 2) and TN (Figure 3) concentrations. At all three plantation ages, SOC and TN in the top 20 cm of the soil were significantly higher than in the corresponding control dunes; in the 31-year age class, the differences were significant at all depths. The mean SOC concentrations (for the values under the shrub canopy and between the rows) to a depth of 100 cm in the 9-, 15-, and 31-year-old plantations increased to 2.5, 2.1, and 3.0 times the values for the corresponding control area (the fixed and active dunes). The corresponding TN concentrations increased to 2.4, 2.0, and 3.6 times the control value. SOC and TN concentrations decreased rapidly with increasing depth for each age class; the 9-year-old plantations had the most rapid decrease.
SOC and TN concentrations under the canopy were significantly higher than those between the rows in each layer of the upper 40 cm of the soil in the 9- and 15-year-old plantations, but were significantly higher in each layer of the upper 60 cm of the soil in the 31-year-old plantation. For both SOC and TN concentrations, a weak difference was observed between the samples obtained between the rows and the samples obtained in the control areas within each plantation. There was no significant difference in SOC and TN for the combined layer from 0 to 100 cm for the samples obtained between the rows and the samples from active dunes in the 15-year-old plantation.
3.3. Changes in Soil LF Organic Matter
The trends for the LF dry matter content (Figure 4) were similar to those for the SOC and TN concentrations (Figure 2 and Figure 3): LF dry matter increased after the establishment of plantations and decreased with increasing depth in the soil. The content differed significantly in the top 20 cm of the soil between the plantation and control areas in all three age classes. The LF dry matter only accounted for a small proportion of the total soil mass (from 0.033 to 1.005%), but was significantly correlated with both the total SOC concentration (r = 0.976, p < 0.001) and the TN concentration (r = 0.971, p < 0.001).
The LF dry matter content for the combined layer from 0 to 100 cm was significantly higher under the shrub canopy than between the rows within each plantation, but there was no significant difference between the values obtained between the rows and the respective values obtained in the control areas in the 9- and 15-year-old plantations. The LF dry matter had much higher C and N concentrations than the bulk soil in the controls in all three age classes (Table 1). In addition, the LFOC and LFN concentrations in each plantation were significantly greater than those in the control areas.
3.4. Changes in Soil C and N Storage and Accumulation Rates
The total soil storage of SOC and TN were estimated using Equation (1) and the soil storage of LFOC and LFN were estimated using Equation (2) for the individual soil layers and for the combined layer from 0 to 100 cm (Table 2). Compared to the values in the control areas, the SOC storage to a depth of 100 cm increased by 9033, 5185, and 11,148 kg·ha−1 (by 88%, 74%, and 145%, respectively) 9, 15, and 31 years after shrub planting. The corresponding increases were 866, 496, and 1462 kg·ha−1 (by 68%, 61%, and 195%) for TN storage, 2108, 2361, and 2648 kg·ha−1 (by 109%, 199%, and 202%) for LFOC storage, and 187, 172, and 205 kg·ha−1 (by 203%, 337%, and 342%) for LFN storage.
The greatest increases in SOC and TN storage after the establishment of plantations were found in the upper 20 cm of the soil (Table 2). In the layer from 0 to 10 cm, SOC storage in the 9-, 15-, and 31-year-old plantations increased to 3.7, 3.1, and 4.8 times the values in the corresponding control areas, respectively, versus 3.4, 2.7, and 5.7 times for TN storage. In the layer from 10 to 20 cm, the corresponding ratios were 2.7, 2.1, and 2.8 times for SOC storage and 2.6, 2.4, and 3.2 times for TN storage. However, the corresponding SOC storage for the combined layer from 20 to 100 cm increased to 1.1, 1.5, and 2.0 times the values in the corresponding control areas, versus increases of 1.0 (i.e., no increase), 1.3, and 2.4 times for TN storage.
The ratio of LFOC storage to total SOC storage and the ratio of LFN storage to TN storage increased with increasing time after plantation establishment. Compared with the control values, the LFOC/SOC storage ratio to a depth of 100 cm increased from 19% to 21%, from 17% to 29%, and from 17% to 21%, respectively, 9, 15, and 31 years after shrub planting. The corresponding ratios for LFN/TN storage increased from 7% to 13%, 6% to 17%, and 8% to 12%. LFOC accounted for 23%, 46%, and 24% of the total increase in SOC storage to a depth of 100 cm, respectively, in the 9-, 15-, and 31-year-old plantations; the corresponding LFN contributions were 22%, 35%, and 14% of the TN storage increase.
By 9, 15, and 31 years after shrub planting, the SOC accumulation to a depth of 100 cm (the increase compared with the value in the corresponding control area, divided by the time since plantation establishment) was 1004, 346, and 360 kg·C·ha−1·yr−1, respectively, versus 96, 33, and 47 kg·N·ha−1·yr−1 for TN accumulation, 234, 157, and 85 kg·C·ha−1·yr−1 for LFOC accumulation, and 21, 11, and 7 kg·N·ha−1·yr−1 for LFN accumulation. The SOC accumulation rates for the combined layers from 0 to 20 cm in the 9-, 15-, and 31-year-old plantations were 909, 201, and 180 kg·C·ha−1·yr−1, respectively, versus 97, 22, and 23 kg·N·ha−1·yr−1 for TN accumulation. That is, 91, 58, and 50% of the total increase in SOC storage occurred in the upper 20 cm of the soil profile, respectively, in the 9-, 15-, and 31-year-old plantations, versus 100%, 67%, and 49% of the total increase in TN storage. This means that LF organic matter contributed strongly to C and N storage in the top 20 cm of the soil and that the soil profile below 20 cm showed increasing SOC and TN accumulation with increasing plantation age.
4. Discussion
4.1. Challenges for Afforestation in Arid and Semiarid Ecosystems
Researchers have investigated the effects of afforestation on soil carbon and nitrogen storage, and especially on SOC storage, because of the roles of this storage in determining soil quality and in the carbon cycle of arid and semiarid areas [34,35,36,37]. In the present study, we quantified the effects of the conversion of sand dunes to shrub plantations in a semiarid region of northern China. We found accumulation of 1004, 346, and 360 kg·C·ha−1·yr−1 for SOC to a depth of 100 cm, respectively, 9, 15, and 31 years after planting, versus 96, 33, and 47 kg·N·ha−1·yr−1 for TN. In China’s semiarid Shanxi Province, the conversion of degraded wastelands to Pinus tabulaeformis plantations increased SOC to a depth of 100 cm by 383 kg·C·ha−1·yr−1, but decreased the corresponding TN by 6.5 kg·N·ha−1·yr−1 24 years after planting, versus decreases of 1098 kg·C·ha−1·yr−1 for SOC and 119 kg·N·ha−1·yr−1 for TN 8 years after planting [36]. In semiarid Patagonia, the SOC in afforested systems 15 years after planting did not differ from that in adjacent degraded steppes [5]. During the period from 5 to 29 years after afforestation of Australian pastures, SOC did not change substantially, but TN decreased greatly in the plantations [35]. In an arid grazing region in Chile, SOC decreased by 32% 2 years after establishing shrub plantations [34]. In New Zealand, the afforestation of grassland had no net effect on SOC even 20 years after planting [38].
In contrast with these previous studies, our results suggested that the planting of shrubs in areas with sand dunes has high potential for increasing carbon and nitrogen sequestration in the Horqin Sandy Land. One possible explanation for these differences may relate to differences in the nitrogen requirements among the plantation species. Another relates to the interaction between soil and climatic conditions, since many factors (e.g., soil type, temperature, and moisture content; soil microbial populations) will affect rates of organic matter decomposition and loss from the soil (e.g., as CO2 or CH4 for carbon; as nitrogen oxides for nitrogen). It is also important to note that afforestation projects oriented toward C sequestration face multiple risks due to their longevity, since this makes them vulnerable to unsustainable management practices (e.g., failing to prevent illegal harvesting of the wood) and to climate change; in addition, none of these studies (including the present study) investigated the effects of vegetation community succession over long periods, particularly in the context of the biodiversity loss that may result from monoculture plantings [39].
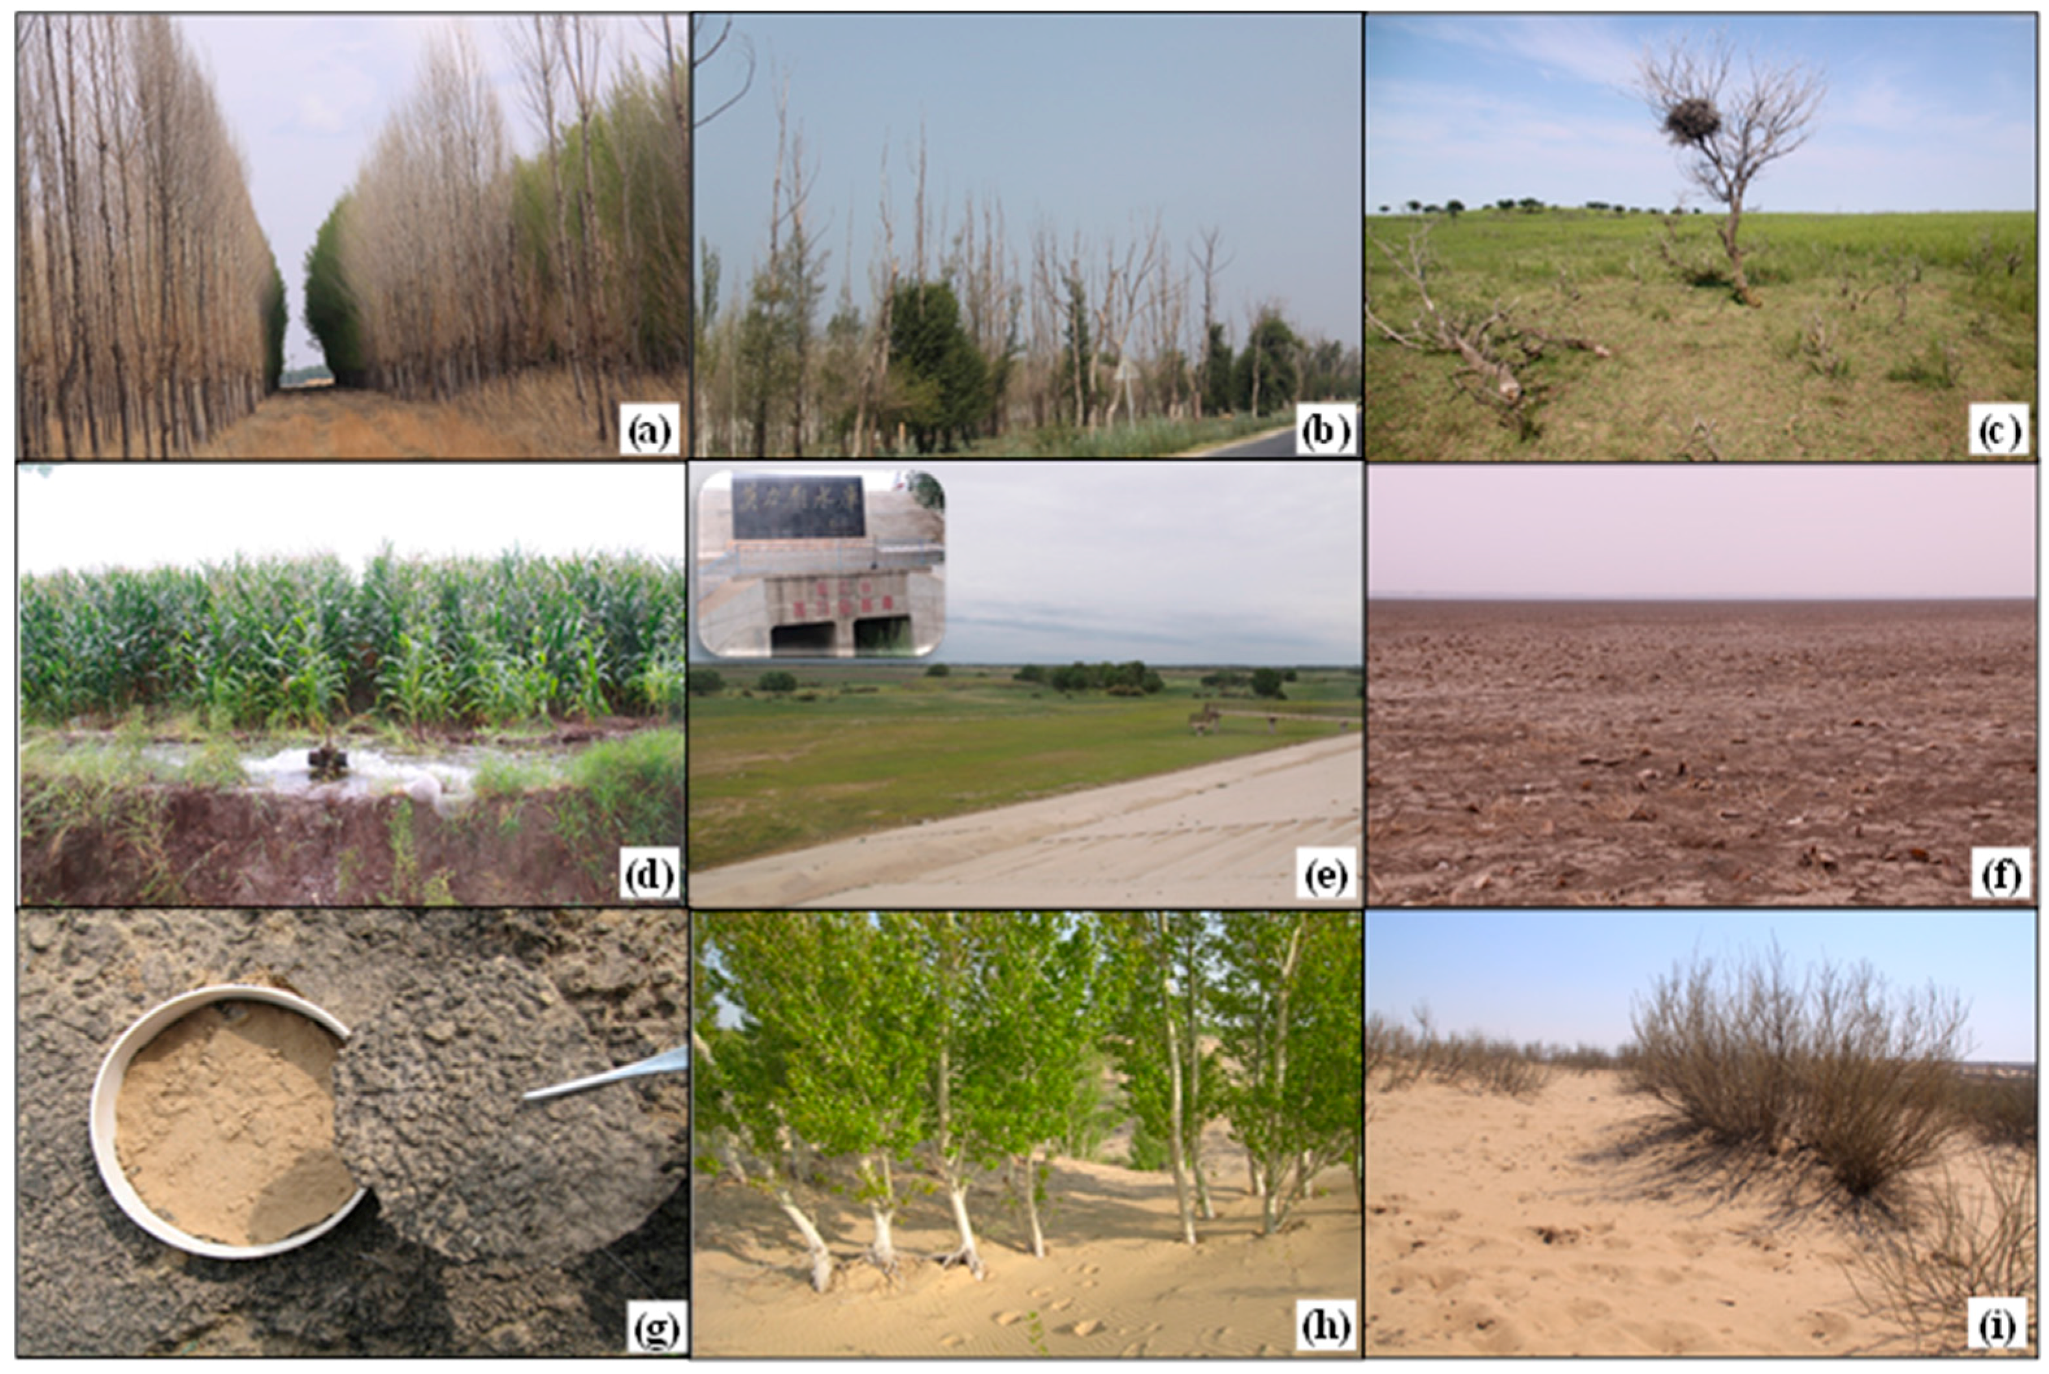
Our study area in the Horqin Sandy Land is one of the key areas for implementation of China’s Three-Norths Shelter Forest Program. The sustainability of the plantations in this region is now being questioned, since the benefits associated with afforestation of desertified areas have been decreasing over time, particularly in tree plantations. Trees in millions of hectares of plantations in the Horqin Sandy Land, most of which represent afforestation with Populus spp., are now dying (Figure 5a,b) at an increasing rate, as reported by China Central Television’s “Half-Hour Economy” program on their economics channel (CCTV-2) [40]. Even worse, a dominant indigenous tree species of the sandy grassland of the region, Ulmus macrocarpa, has also begun dying in recent years (Figure 5c). Researchers [16,19] believe that the tree deaths have resulted partly from warmer and drier weather conditions linked to climate change. For example, our study area in the Naiman Banner showed a 0.9 °C increase in air temperature and an 81.4 mm decrease in rainfall based on a comparison of mean values from 2000 to 2009 with the average from 1959 to 1999 [41]. This climate change would greatly decrease the water availability to trees while simultaneously increasing their transpiration, and could therefore partly explain the tree deaths from 2000 to 2010. The climate change would also have increased the already excessive withdrawal of groundwater to support agricultural production (Figure 5d), which would further reduce the availability of groundwater resources to support tree growth. The mean annual depth to groundwater in the study area was 2.2 m from 1979 to 1997, but increased to 7.6 m from 2005 to 2012 [42]. The depth even reached 12 to 13 m at some sites mentioned in the CCTV-2 report [40].
The Molimiao reservoir (43°31′43.0″N, 121°46′48.2″E, Figure 5e) and the Shelihu reservoir (42°45′15.3″N, 120°33′30.1″E, Figure 5f), claimed to be the largest and second-largest desert reservoirs in Asia, with capacities of 1.92 × 10⁸ and 1.28 × 10⁸ m3, respectively, are both located in the Horqin Sandy Land and have played important roles in supporting local development. However, the Molimiao reservoir dried up completely in 2003 and the Shelihu reservoir dried up completely in 2010 due to a combination of climate change with unsustainable water use. Most areas served by these reservoirs are currently used to cultivate corn. The decrease in natural water availability (e.g., rainfall and recharge of soil water) and the increase in irrigated agriculture have created a vicious cycle in which environmental protection has been sacrificed to achieve economic development in the Horqin Sandy Land.
The urgent need for a more sustainable trade-off between protecting and improving the local environment and developing the local economy is becoming increasingly acute in the world’s arid and semiarid regions. These regions are generally associated with poverty because of their limited endowments of biological and ecological resources [39,43]. Afforestation of these lands is problematic when it reduces the availability of arable land for crops or pastures, thereby endangering food security. Therefore, vandalism of these lands (often by felling trees and shrubs for their wood and replacing them with farmland) is threatening the sustainability of the plantations. In our study area, the net income could increase to RMB 15,000 (US $2175)·ha−1·yr−1 if land with moderate nutrient conditions were cultivated with corn. (This assumes that sufficient water is available to support this activity, which is not necessarily possible in the study area.) In contrast, the net income from land planted with Populus spp. is RMB 36,000 (US $5219)·ha−1 (based on harvesting of 60 m3 of timber) over a 15-year rotation period, representing an annual income of only RMB 2400 (US $348)·ha−1·yr−1 (i.e., only 16% of the agricultural income). Because afforestation projects have such a low yield, farmers sometimes destroy plantations so they can farm the land. To mitigate this problem, the current ecological compensation payments system should be improved to give farmers a reason to protect plantations; for example, carbon offset credits should be accounted for in China, and the resulting credits transferred to residents of afforestation areas to compensate them for the loss of arable land.
Livestock grazing is another critical factor that influences the effectiveness of afforestation. In arid and semiarid regions, soil crusts that commonly formed once active dunes have been stabilized through re-vegetation [44]. These soil crusts perform essential ecosystem services, including enhancement of soil stability and fertility [45], protection of the soil from wind erosion [46], and fixation of C and N [47,48]. Figure 5g shows the soil crust that formed in an area of active dunes 7 years after afforestation using Populus spp. in the Horqin Sandy Land because the land was protected from livestock grazing. However, these soil crusts are fragile and vulnerable to anthropogenic and natural disturbances, and are easily destroyed by livestock [44]. Figure 5h,i show how the soil surface can become reactivated (i.e., mobile) as a result of continuous grazing, even over 10 years after tree and shrub establishment. In the present study, the 9-year-old plantation that was protected from grazing showed significantly greater SOC and TN accumulation rates in the uppermost soil layer (0 to 10 cm) than the rates in the 15- and 31-year-old plantations, both of which were disturbed by continuous grazing. For example, the SOC accumulations to a depth of 10 cm were 681, 136, and 126 kg·C·ha−1·yr−1, respectively, in the 9-, 15-, and 31-year-old plantations. The 9-year-old plantation was established in areas with fixed dunes, whereas the 15- and 31-year-old plantations were established in areas with active dunes. The fixed dunes had a greater nutrient content than the active dunes, so the difference in the initial quality of the desertified land partially explains the large differences in SOC accumulation rates between the 9-year-old plantation and the older plantations. However, the large increase in SOC in the 9-year-old plantation compared with its control areas supports our belief that protecting plantations from grazing is crucial to achieve a high SOC accumulation in the upper soil layers.
Identifying suitable species is very important for afforestation of degraded lands in arid and semiarid regions [49]. The most challenging aspect of such afforestation projects is the choice between indigenous and exotic species. Often, the advantages associated with exotic species (e.g., higher growth rates, better wood quality, or markets) outweighs the hidden and diffuse benefits offered by indigenous species, such as biodiversity conservation and the use of plants that are better adapted to the afforestation sites [39]. In the present study area, fast-growing exotic broadleaved Populus species were widely planted for rapid establishment of shelterbelts. However, recent research has suggested that these species are not an optimal choice for the region because they have low water-use efficiency, creating an acute contradiction between the increased water demand created by these trees and the decreasing water supply that has resulted from the background of climate change and unsustainable human use of the water resources [16,19]. Our current work confirmed that C. microphylla, an indigenous shrub species, performed well in the Horqin Sandy Land in terms of its ability to improve soil properties and combat desertification, and in terms of its ability to survive for at least 31 years under local environmental conditions. Shrub species have many advantages, such as extensive root systems, lower water consumption than trees, fast growth, high yield, and strong reproduction [50]. Therefore, such shrubs are highly adaptable and represent a better choice than many tree species for afforestation in arid and semi-arid regions. Although previous research suggested that a mean annual rainfall of 200 mm may be sufficient to sustain tree plantations [7], this value may be optimistic for many of the species that have been used in afforestation. Further research will be needed to determine the minimum rainfall required to support each afforestation species. This will allow managers to choose species that are most likely to survive in a given area. In addition, researchers should determine the potential of other life forms, such as desert steppe grasses, to determine whether they may be a better alternative than woody vegetation.
4.2. Carbon Sequestration Potential of Desertification Control in China’s Horqin Sandy Land
To sequester C and restore degraded land in arid and semiarid regions, afforestation and exclosures that protect an area from humans and livestock grazing are two of the most widely suggested options [5,7]. In China’s Horqin Sandy Land, we have investigated the positive effects of grazing exclosures and tree planting (using an introduced species of Mongolian pine) in areas with active dunes on the vegetation characteristics and soil properties of afforestation sites [17,20]. We confirmed that the exclosures and afforestation can control desertification in the region.
One of our previous studies showed that SOC storage to a depth of 100 cm increased by 566 kg·C·ha−1·yr−1 during a 25-year grazing exclosure [20], versus 205 kg·C·ha−1·yr−1 during a 28-year afforestation period using Mongolian pine [17]; both studies were established in areas with active dunes. In the present study, the 31-year-old plantation established in areas with active dunes was closest to the ages in the two previous studies, and showed an increase of 360 kg·C·ha−1·yr−1 in SOC storage. The existing areas of non-desertified grassland in the Horqin Sandy Land have 48,779 kg·C·ha−1 of SOC storage to a depth of 100 cm [18]. Based on an average SOC storage of 6688 kg C ha−1 in active dunes (the average of the values measured in the two previous studies and in the present study) and the abovementioned rate of SOC increase, it would take 74 years to fully restore the SOC storage of the active dunes through grazing exclosures, versus 117 years through afforestation using the shrub species C. microphylla and 205 years through afforestation using Mongolian pine. However, the results for the present study represent a conservative estimate, since branches of the shrubs in our study plantations were harvested every 3 to 4 years and the two older plantations were subjected to continuous browsing by livestock. Although we did not quantify the biomass removals by these processes, retaining the organic matter on the sites would likely accelerate the accumulation of organic matter, thereby shortening these times.
5. Conclusions
In the semiarid Horqin Sandy Land of northern China, the establishment of shrub plantations using C. microphylla in areas with fixed and active dunes led to significant increases in C and N storage in the soil. The greatest increases occurred in the top 20 cm of the soil profile. The soil LF organic matter was an important contributor to soil C and N sequestration, and its magnitude was strongly and significantly correlated with the total soil organic C and N concentrations. To increase the sustainability of artificial tree and shrub planting, it will be necessary to encourage local residents to preserve plantations. One possibility would be to improve ecological compensation mechanisms, perhaps by accounting for carbon offset credits. Afforestation is an effective option to sequester carbon and to restore degraded soils, but this process was very slow. Our results suggest that it would take more than 100 years to fully restore the SOC storage of the active dunes through afforestation with C. microphylla in the Horqin Sandy Land. However, if grazing and harvesting of firewood were prohibited in the plantations, recovery is likely to be faster.
Acknowledgments
This research was supported by the One Hundred Person Project of the Chinese Academy of Sciences (Y551821), the National Key Research and Development Program of China (2016YFC0500901), and the National Natural Science Foundation of China (grants 31640012, 31560161, 31260089, and 31400392). We are grateful to the anonymous reviewers for their constructive comments.
Author Contributions
All co-authors assisted with manuscript writing. Yuqiang Li and Yinping Chen conceived and designed the experiment, and wrote this paper. Xuyang Wang, Yayi Niu, and Jie Lian were responsible for the field investigation, soil sampling, and laboratory analyses.
Conflicts of Interest
The authors declare no conflict of interest.
References
- Lal, R. Sequestering carbon in soils of arid ecosystems. Land Degrad. Dev. 2009, 20, 441–454. [Google Scholar] [CrossRef]
- IPCC. Climate Change 2013: The Physical Science Basis, Contribution of Working Group I to the Fifth Assessment Report of the Intergovernmental Panel on Climate Change; Stocker, T.F., Qin, D., Plattner, G.-K., Tignor, M., Allen, S.K., Boschung, J., Nauels, A., Xia, Y., Bex, V., Midgley, P.M., Eds.; Cambridge University Press: Cambridge, UK, 2013. [Google Scholar]
- FAO (Food and Agriculture Organization of the United Nations). Carbon Sequestration in Drylands; FAO: Rome, Italy, 2004. [Google Scholar]
- Lal, R. Potential of desertification control to sequester carbon and mitigate the greenhouse effect. Clim. Chang. 2001, 51, 35–72. [Google Scholar] [CrossRef]
- Nosetto, M.D.; Jobbágy, E.G.; Paruelo, J.M. Carbon sequestration in semi-arid rangelands: Comparison of Pinus ponderosa plantations and grazing exclusion in NW Patagonia. J. Arid Environ. 2006, 67, 142–156. [Google Scholar] [CrossRef]
- Malagnoux, M. Arid land forests of the world: Global environmental perspectives. In Proceedings of the International Conference on Afforestation and Sustainable Forests as a Means to Combat Desertification, Jerusalem, Israel, 16–19 April 2007. [Google Scholar]
- Le Houérou, H.N. Restoration and rehabilitation of arid and semiarid Mediterranean ecosystems in North Africa and West Asia: A review. Arid Soil Res. Rehabil. 2000, 14, 3–14. [Google Scholar] [CrossRef]
- Wofsy, S.C. Where has all the carbon gone? Science 2001, 292, 2261–2263. [Google Scholar] [CrossRef] [PubMed]
- Grünzweig, J.M.; Lin, T.; Rotenberg, E.; Schwartz, A.; Yakir, D. Carbon sequestration in arid-land forest. Glob. Chang. Biol. 2003, 9, 791–799. [Google Scholar] [CrossRef]
- Nair, P.K.R. Methodological challenges in estimating carbon sequestration potential of agroforestry systems. In Carbon Sequestration Potential of Agroforestry Systems: Opportunities and Challenges, Advances in Agroforestry 8; Kumar, B.M., Nair, P.K.R., Eds.; Springer: Dordrecht, The Netherlands, 2011. [Google Scholar]
- Zhang, W.T.; Hu, G.Q.; Dang, Y.; Weindorf, D.C.; Sheng, J.D. Afforestation and the impacts on soil and water conservation at decadal and regional scales in Northwest China. J. Arid Environ. 2016, 130, 98–104. [Google Scholar] [CrossRef]
- Li, X.J.; Li, X.R.; Wang, X.P.; Yang, H.T. Changes in soil organic carbon fractions after afforestation with xerophytic shrubs in the Tengger Desert, northern China. Eur. J. Soil Sci. 2016, 67, 184–195. [Google Scholar] [CrossRef]
- Scott, N.A.; Tate, K.R.; Ford-Robertson, J.; Giltrap, D.J.; Smith, C.T. Soil carbon storage in plantation forests and pastures: Land-use change implications. Tellus 1999, 51B, 326–335. [Google Scholar] [CrossRef]
- Paul, K.I.; Polglase, P.J.; Nyakuengama, J.G.; Khanna, P.K. Change in soil carbon following afforestation. For. Ecol. Manag. 2002, 168, 241–257. [Google Scholar] [CrossRef]
- Hoogmoed, M.; Cunningham, S.C.; Thomson, J.R.; Baker, P.J.; Beringer, J.; Cavagnaro, T.R. Does afforestation of pastures increase sequestration of soil carbon in Mediterranean climates? Agric. Ecosyst. Environ. 2012, 159, 176–183. [Google Scholar] [CrossRef]
- Wang, X.M.; Zhang, C.X.; Hasi, E.; Dong, Z.B. Has the Three Norths Forest Shelterbelt Program solved the desertification and dust storm problems in arid and semiarid China? J. Arid Environ. 2010, 74, 13–22. [Google Scholar] [CrossRef]
- Li, Y.Q.; Brandle, J.; Awada, T.; Chen, Y.P.; Han, J.J.; Zhang, F.X.; Luo, Y.Q. Accumulation of carbon and nitrogen in the plant-soil system after afforestation of active sand dunes in China’s Horqin Sandy Land. Agric. Ecosyst. Environ. 2013, 177, 75–84. [Google Scholar] [CrossRef]
- Zhou, R.L.; Li, Y.Q.; Zhao, H.L.; Drake, S. Desertification effects on C and N content of sandy soils under grassland in Horqin, northern China. Geoderma 2008, 145, 370–375. [Google Scholar] [CrossRef]
- Yan, Q.L.; Zhu, J.J.; Hu, Z.B.; Sun, O.J. Environmental impacts of the shelter forests in Horqin Sandy Land, Northeast China. J. Environ. Qual. 2011, 40, 815–824. [Google Scholar] [CrossRef] [PubMed]
- Li, Y.Q.; Zhou, X.H.; Brandle, J.; Zhang, T.H.; Chen, Y.P.; Han, J.J. Temporal progress in improving carbon and nitrogen storage by grazing exclosure practice in a degraded land area of China’s Horqin Sandy Grassland. Agric. Ecosyst. Environ. 2012, 159, 55–61. [Google Scholar] [CrossRef]
- Cao, C.Y.; Jiang, S.Y.; Ying, Z.; Zhang, F.X.; Han, X.S. Spatial variability of soil nutrients and microbiological properties after the establishment of leguminous shrub Caragana microphylla Lam. plantation on sand dune in the Horqin Sandy Land of Northeast China. Ecol. Eng. 2011, 37, 1467–1475. [Google Scholar] [CrossRef]
- Jiang, D.M.; Cao, C.Y.; Zhang, Y.; Cui, Z.B.; Han, X.S. Plantations of native shrub species restore soil microbial diversity in the Horqin Sandy Land, Northeastern China. J. Arid Land 2014, 6, 445–453. [Google Scholar] [CrossRef]
- Su, Y.Z.; Zhao, H.L. Soil properties and plant species in an age sequence of Caragana microphylla plantations in the Horqin Sandy Land, North China. Ecol. Eng. 2003, 20, 223–235. [Google Scholar] [CrossRef]
- Li, Y.Q.; Zhao, X.Y.; Wang, S.K.; Zhang, F.X.; Lian, J.; Huang, W.D.; Mao, W. Carbon accumulation in the bulk soil and different soil fractions during the rehabilitation of desertified grassland in Horqin Sandy Land, northern China. Pol. J. Ecol. 2015, 63, 88–101. [Google Scholar] [CrossRef]
- Murage, E.W.; Voroney, P.; Beyaert, R.P. Turnover of carbon in the free light fraction with and without charcoal as determined using the 13C natural abundance method. Geoderma 2007, 138, 133–143. [Google Scholar] [CrossRef]
- Sequeira, C.H.; Alley, M.M.; Jones, B.P. Evaluation of potentially labile soil organic carbon and nitrogen fractionation procedures. Soil Biol. Biochem. 2011, 43, 438–444. [Google Scholar] [CrossRef]
- IPCC. Summary for Policymakers. In Land Use, Land-Use Change, and Forestry: A Special Report of the Intergovernmental Panel on Climate Change; Watson, R.T., Noble, I.R., Bolin, B., Ravindranath, N.H., Verardo, D.J., Dokken, D.J., Eds.; Cambridge University Press: Cambridge, UK, 2000. [Google Scholar]
- FAO (FAO/IUSS Working Group WRB). World Reference Base for Soil Resources 2006; World Soil Resources Report; FAO: Rome, Italy, 2006; p. 103. [Google Scholar]
- Zhu, Z.D.; Chen, G.T. Sandy Desertification in China: Status and Trends; Science Press: Beijing, China, 1994. (In Chinese) [Google Scholar]
- Li, Y.Q.; Han, J.J.; Wang, S.K.; Brandle, J.; Lian, J.; Luo, Y.Q.; Zhang, F.X. Soil organic carbon and total nitrogen storage under different land uses in the Naiman Banner, a semiarid degraded region of northern China. Can. J. Soil. Sci. 2014, 94, 9–20. [Google Scholar] [CrossRef]
- ISO (International Organization for Standardization). Soil Quality–Determination of Particle Size Distribution in Mineral Soil Material—Method by Sieving and Sedimentation; ISO: Geneva, Switzerland, 1998. [Google Scholar]
- Nelson, D.W.; Sommers, L.E. Total carbon, organic carbon and organic matter. In Methods of Soil Analysis, Part 2, 2nd ed.; Page, A.L., Miller, R.H., Keeney, D.R., Eds.; American Society of Agronomy: Madison, WI, USA, 1982; pp. 539–577. [Google Scholar]
- McGill, W.B.; Figueiredo, C.T. Total nitrogen. In Soil Sampling and Methods of Analysis; Carter, M.R., Ed.; Canadian Society of Soil Science/Lewis Publishers: Boca Raton, FL, USA, 1993; pp. 201–211. [Google Scholar]
- Perez-Quezada, J.F.; Delpiano, C.A.; Snyder, K.A.; Johnson, D.A.; Franck, N. Carbon pools in an arid shrub land in Chile under natural and afforested conditions. J. Arid Environ. 2011, 75, 29–37. [Google Scholar] [CrossRef]
- Cunningham, S.C.; Metzeling, K.J.; MacNally, R.; Thomson, J.R.; Cavagnaro, T.R. Changes in soil carbon of pastures after afforestation with mixed species: Sampling, heterogeneity and surrogates. Agric. Ecosyst. Environ. 2012, 158, 58–65. [Google Scholar] [CrossRef]
- Zeng, X.; Zhang, W.; Cao, J.; Liu, X.; Shen, H.; Zhao, X. Changes in soil organic carbon, nitrogen, phosphorus, and bulk density after afforestation of the “Beijing–Tianjin Sandstorm Source Control” program in China. Catena 2014, 118, 186–194. [Google Scholar] [CrossRef]
- Han, X.; Zhao, F.; Tong, X.; Deng, J.; Yang, G.; Chen, L.; Kang, D. Understanding soil carbon sequestration following the afforestation of former arable land by physical fractionation. Catena 2017, 150, 317–327. [Google Scholar] [CrossRef]
- Davis, M.R.; Condron, L.M. Impact of grassland afforestation on soil carbon in New Zealand: A review of paired-site studies. Aust. J. Soil Res. 2002, 40, 675–690. [Google Scholar] [CrossRef]
- Blujdea, V. Challenges and trade-offs in environmental and financial approaches of the afforestation of degraded lands. In Climate and Land Degradation; Sivakumar, M.V.K., Ndiang’ui, N., Eds.; Springer: Berlin, Germany, 2007. [Google Scholar]
- CCTV-2 (China Central Television). The fall of Shelter Forest, Half-Hour Economy. Available online: http://jingji.cntv.cn/2013/11/21/VIDE1385044320483135.shtml (accessed on 21 November 2013).
- Zhang, G.Y. Analysis of temperature and precipitation nearly 10 years and over year in Naiman Banner. J. Inn. Mong. Univ. Natl. 2010, 25, 517–518. (In Chinese) [Google Scholar]
- Zhao, H.L.; Zhao, X.Y.; Zhang, T.H.; Li, Y.S.; Han, F.L.; Zhou, R.L. The time-space variation of groundwater and its causes in the central desertified area of the Naiman Banner of Mongolia in the past 20 years. J. Desert Res. 1999, 19 (Suppl. 1), 7–11. (In Chinese) [Google Scholar]
- Chassany, J.P. Economic and social appraisal of the feasibility of land restoration, rehabilitation, and reallocation in arid and semiarid zones: A holistic approach. Arid Soil Res. Rehabil. 1999, 13, 383–395. [Google Scholar] [CrossRef]
- Zhao, H.L.; Guo, Y.R.; Zhou, R.L.; Drake, S. Biological soil crust and surface soil properties in different vegetation types of Horqin Sand Land, China. Catena 2010, 82, 70–76. [Google Scholar] [CrossRef]
- Liu, Y.M.; Yang, H.Y.; Li, X.R.; Xing, Z.S. Effects of biological soil crusts on soil enzyme activities in revegetated areas of the Tengger Desert, China. Appl. Soil Ecol. 2014, 80, 6–14. [Google Scholar] [CrossRef]
- Belnap, J.; Gillette, D.A. Vulnerability of desert biological crusts to wind erosion: The influences of crust development, soil texture, and disturbance. J. Arid Environ. 1998, 39, 133–142. [Google Scholar] [CrossRef]
- Housman, D.C.; Powers, H.H.; Collins, A.D.; Belnap, J. Carbon and nitrogen fixation differ between successional stages of biological soil crusts in the Colorado Plateau and Chihuahuan Desert. J. Arid Environ. 2006, 66, 620–634. [Google Scholar] [CrossRef]
- Li, X.R.; Zhang, P.; Su, Y.G.; Jia, R.L. Carbon fixation by biological soil crusts following revegetation of sand dunes in arid desert regions of China: A four-year field study. Catena 2012, 97, 119–126. [Google Scholar] [CrossRef]
- Reubens, B.; Moeremans, C.; Poesen, J.; Nyssen, J.; Tewoldeberhan, S.; Franzel, S.; Deckers, J.; Orwa, C.; Muys, B. Tree species selection for land rehabilitation in Ethiopia: From fragmented knowledge to an integrated multi-criteria decision approach. Agrofor. Syst. 2011, 82, 303–330. [Google Scholar] [CrossRef]
- Liu, W.H.; Zhu, J.J.; Jia, Q.Q.; Zheng, X.; Li, J.S.; Lou, X.D.; Hu, L.L. Carbon sequestration effects of shrub lands in Three-North Shelterbelt Forest region, China. Chin. J. Geogr. Sci. 2014, 24, 444–453. [Google Scholar] [CrossRef]
Figure 1.
Photographs of (a) a typical area of active dunes; (b) afforestation of active dunes using Caragana microphylla; (c) a plantation that was subjected to livestock grazing; and (d) a plantation that underwent pruning.
Figure 1.
Photographs of (a) a typical area of active dunes; (b) afforestation of active dunes using Caragana microphylla; (c) a plantation that was subjected to livestock grazing; and (d) a plantation that underwent pruning.
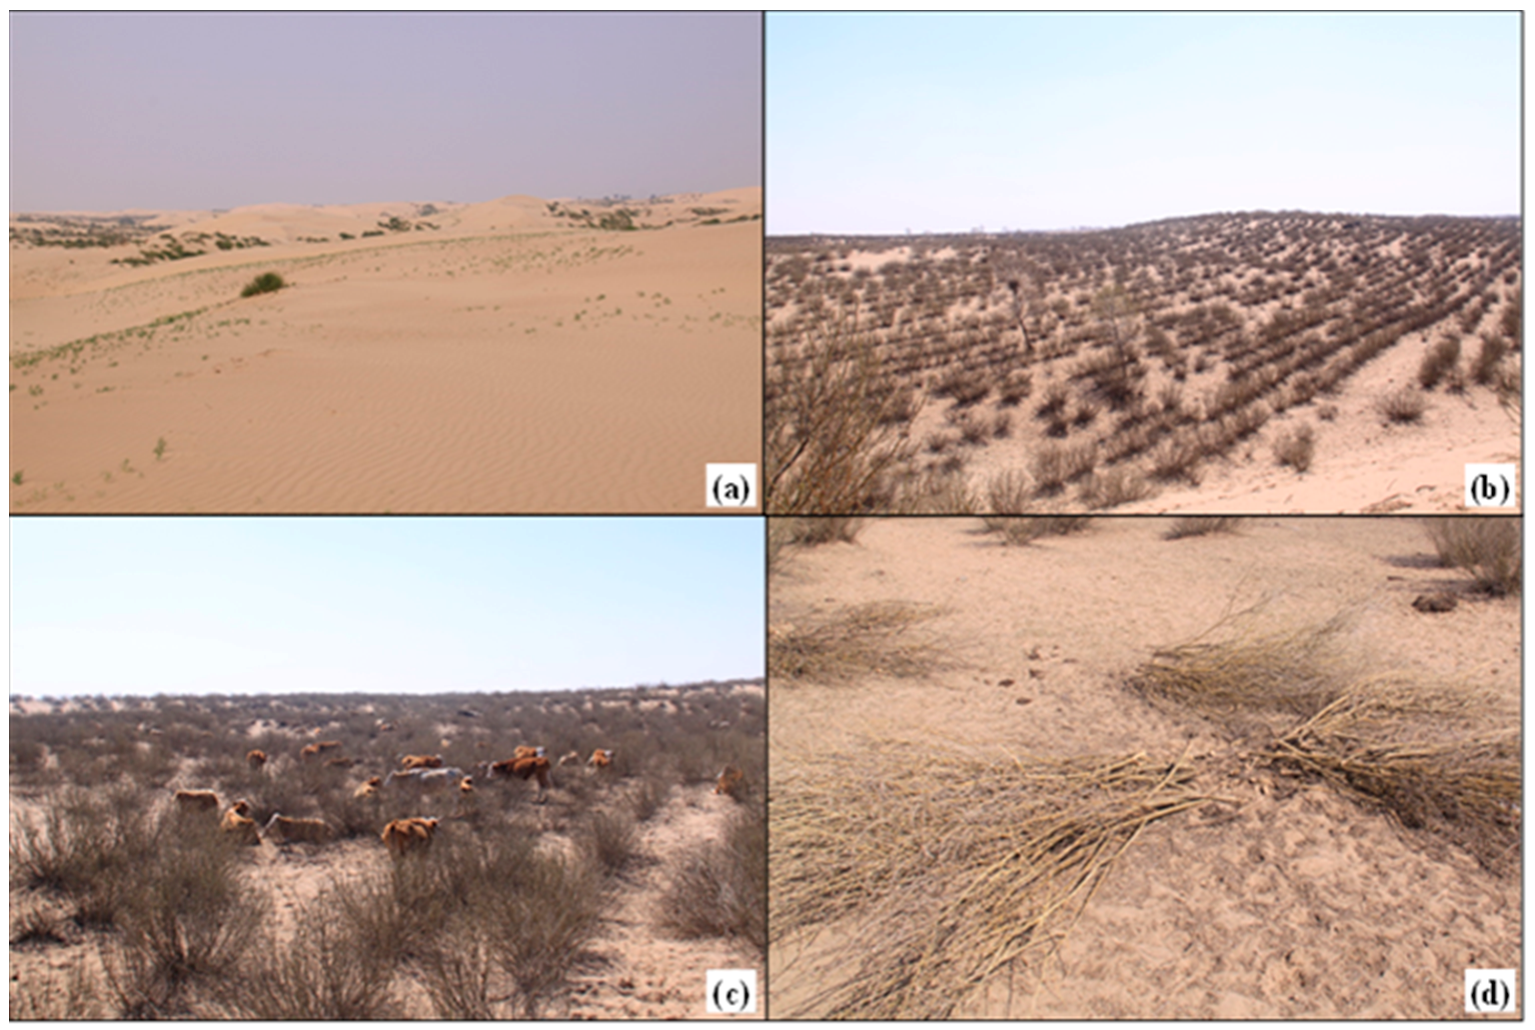
Figure 2.
Changes in the soil organic C (SOC) concentration in plots with sand dunes (fixed and active dunes) and in the 9-, 15-, and 31-year-old shrub plantations. Values represent means ± standard errors (SE) for sample positions under the shrub canopy, between the rows (“mid-row”), and for the average of these two positions (“Mean”). Points labeled with * differed significantly between the sand dunes and the mean (p < 0.05); points labeled with ns did not differ significantly.

Figure 3.
Changes in the soil total N (TN) concentration in plots with sand dunes (fixed and active dunes) and in the 9-, 15-, and 31-year-old shrub plantations. Values represent means ± standard errors (SE) for sample positions under the shrub canopy, between the rows (“mid-row”), and for the average of these two positions (“Mean”). Points labeled with * differed significantly between the sand dunes and the mean (p < 0.05); points labeled with ns did not differ significantly.

Figure 4.
Changes in the soil light-fraction (LF) dry matter content in plots with sand dunes (fixed and active dunes) and in the 9-, 15-, and 31-year-old shrub plantations. Values represent means ± standard errors (SE) for sample positions under the shrub canopy, between the rows (“mid-row”), and for the average of these two positions (“Mean”). Points labeled with * differed significantly between the sand dunes and the mean (p < 0.05); points labeled with ns did not differ significantly.
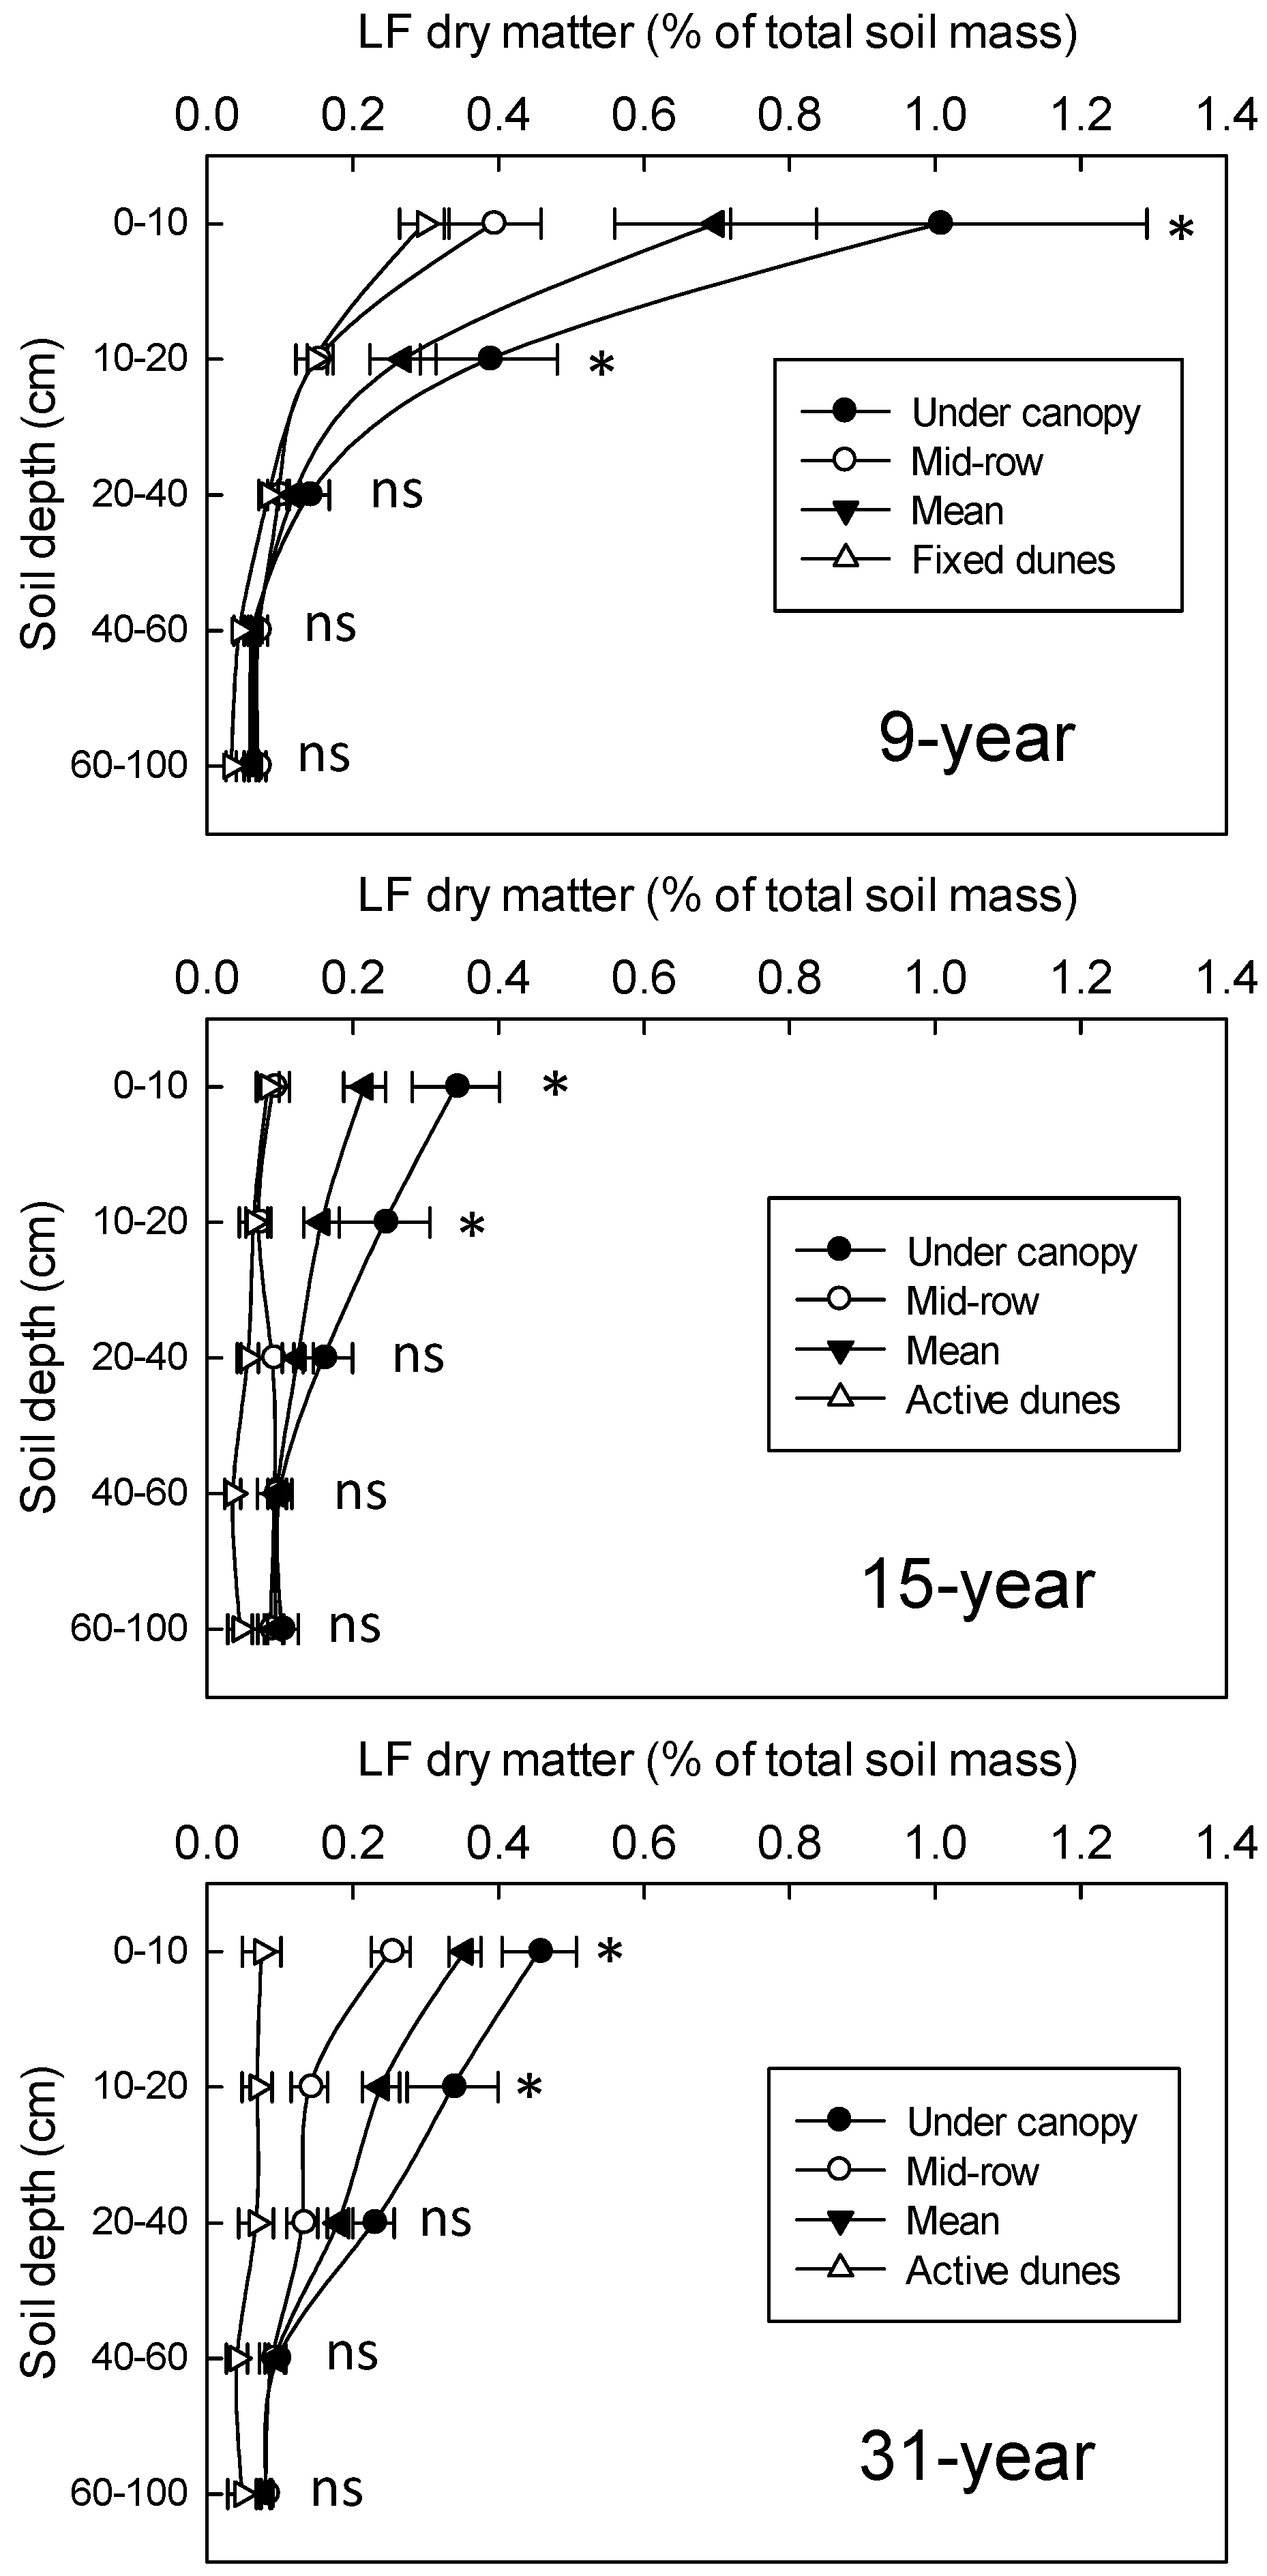
Figure 5.
Photographs of (a) dying Populus spp. in a farmland shelterbelt; (b) dying Populus spp. in a road shelterbelt; (c) dying Ulmus macrocarpa in a National Nature Reserve; (d) excessive withdrawal of groundwater to support agricultural production; (e) drying of the Molimiao reservoir (formerly Asia’s largest desert reservoir); (f) drying of the Shelihu reservoir (formerly Asia’s second-largest desert reservoir); (g) formation of a soil crust 7 years after afforestation in areas with active dunes that were protected from livestock grazing; and (h,i) reactivation of the soil surface as a result of heavy grazing more than 10 years after afforestation.

Table 1.
Changes in the soil particle-size distribution, bulk density, light-fraction (LF) organic carbon (LFOC) concentration, and light-fraction nitrogen (LFN) concentration after afforestation of fixed and active dunes with Caragana microphylla. (Values are mean ± SE.) The column labeled “Mean” represents the average of the values under the canopy and between the rows.
| Soil Properties | Layer (cm) | 9-Year | 15-Year | 31-Year | |||||||||
|---|---|---|---|---|---|---|---|---|---|---|---|---|---|
| Under Canopy | Between Rows | Mean | Fixed Dunes | Under Canopy | Between Rows | Mean | Active Dunes | Under Canopy | Between Rows | Mean | Active Dunes | ||
| Coarse sand (2.0–0.1 mm, %) | 0201310 | 71.7 ± 4.3a | 79.6 ± 2.7ab | 75.7 ± 2.7ab | 84.4 ± 2.3b | 84.2 ± 0.8a | 87.5 ± 1.1bc | 85.8 ± 0.6ab | 89.9 ± 1.4c | 72.7 ± 2.8a | 77.5 ± 1.7a | 75.1±1.7a | 94.8 ± 0.8b |
| 10–20 | 86.6 ± 3.5a | 92.0 ± 1.1ab | 89.3 ± 1.8ab | 94.3 ± 1.0b | 86.9 ± 1.4a | 88.3 ± 1.2ab | 87.6 ± 0.8ab | 90.8 ± 1.7b | 86.3 ± 1.3a | 90.1 ± 0.9b | 88.2 ± 0.9ab | 96.8 ± 0.4c | |
| 20–40 | 93.8 ± 0.7a | 94.5 ± 0.4a | 94.2 ± 0.4a | 97.7 ± 0.4b | 87.6 ± 0.9a | 89.4 ± 0.3ab | 88.5 ± 0.4ab | 91.9 ± 2.1b | 88.7 ± 0.9a | 90.3 ± 0.9a | 89.5 ± 0.7a | 97.0 ± 0.3b | |
| 40–60 | 95.3 ± 0.6a | 95.3 ± 0.3a | 95.3 ± 0.4a | 97.1 ± 0.9b | 88.2 ± 0.4a | 89.3 ± 0.4ab | 88.7 ± 0.4ab | 92.2 ± 2.1b | 91.2 ± 0.9a | 90.5 ± 0.9a | 90.8 ± 0.8a | 96.3 ± 0.3b | |
| 60–100 | 95.3 ± 0.7a | 94.5 ± 0.7a | 94.9 ± 0.6a | 95.3 ± 0.7a | 87.4 ± 1.0a | 90.1 ± 0.9a | 88.8 ± 0.7a | 93.7 ± 1.8b | 91.5 ± 0.7a | 91.2 ± 0.7a | 91.4 ± 0.5a | 96.6 ± 0.4b | |
| 0–100 | 88.6 ± 1.8a | 91.2 ± 0.7ab | 89.9 ± 1.0a | 93.7 ± 0.9b | 86.8 ± 0.4a | 88.9 ± 0.3a | 87.9 ± 0.2a | 91.7 ± 1.5b | 86.1 ± 1.0a | 87.9 ± 0.6a | 87.0 ± 0.7a | 96.3 ± 0.3b | |
| Fine sand (0.10–0.05 mm, %) | 0–10 | 12.5 ± 2.0a | 8.7 ± 1.1a | 10.6 ± 1.3a | 10.7 ± 1.5a | 9.3 ± 0.3a | 9.1 ± 0.6a | 9.2 ± 0.4a | 7.6 ± 1.1b | 10.9 ± 1.1a | 8.0 ± 0.7b | 9.4 ± 0.9ab | 2.8 ± 0.6c |
| 10–20 | 6.5 ± 1.4a | 4.1 ± 0.5a | 5.3 ± 0.7a | 4.1 ± 0.8a | 8.7 ± 0.7a | 9.5 ± 0.7a | 9.1 ± 0.5a | 7.1 ± 1.4a | 6.6 ± 0.6a | 5.4 ± 0.4a | 6.0 ± 0.4a | 1.7 ± 0.2b | |
| 20–40 | 4.2 ± 0.4a | 3.5 ± 0.4a | 3.9 ± 0.3a | 1.5 ± 0.3b | 9.8 ± 0.8a | 8.6 ± 0.5ab | 9.2 ± 0.4ab | 6.7 ± 1.8b | 5.7 ± 0.4a | 5.8 ± 0.5a | 5.7 ± 0.4a | 1.6 ± 0.2b | |
| 40–60 | 3.3 ± 0.6a | 3.7 ± 0.3a | 3.5 ± 0.4a | 2.0 ± 0.6b | 9.6 ± 0.5a | 9.2 ± 0.4a | 9.4 ± 0.4a | 6.1 ± 1.6b | 5.3± 0.4aa | 5.8 ± 0.4a | 5.6 ± 0.4a | 2.2 ± 0.3b | |
| 60–100 | 3.6 ± 0.5a | 3.9 ± 0.5a | 3.7 ± 0.4a | 3.1 ± 0.4a | 10.8 ± 0.8a | 8.1 ± 0.8ab | 9.5 ± 0.7a | 5.3 ± 1.6bc | 5.1 ± 0.4a | 4.9 ± 0.3a | 5.0 ± 0.2a | 1.9 ± 0.3b | |
| 0–100 | 6.0 ± 0.9a | 4.8 ± 0.4a | 5.4 ± 0.5a | 4.3 ± 0.5a | 9.6 ± 0.3a | 8.9 ± 0.2a | 9.3 ± 0.3a | 6.5 ± 1.2b | 6.7 ± 0.5a | 6.0 ± 0.3a | 6.3 ± 0.4a | 2.0 ± 0.2b | |
| Silt + clay (<0.05 mm, %) | 0–10 | 15.8 ± 2.3a | 11.7 ± 1.7a | 13.7 ± 1.4a | 4.5 ± 0.9b | 6.5 ± 0.9a | 3.4±0.6bc | 4.9 ± 0.4ab | 2.5 ± 0.5c | 16.5 ± 1.7a | 14.5 ± 1.2a | 15.5 ± 1.0a | 2.4 ± 0.3b |
| 10–20 | 6.9 ± 2.1a | 3.8 ± 0.8ab | 5.4 ± 1.1a | 1.3 ± 0.3b | 4.4 ± 0.9a | 2.1±0.7b | 3.3 ± 0.5ab | 2.1 ± 0.4b | 7.2 ± 0.8a | 4.4 ± 0.6b | 5.8 ± 0.5ab | 1.5 ± 0.3c | |
| 20–40 | 1.9 ± 0.3a | 2.0 ± 0.2a | 2.0 ± 0.1a | 0.8 ± 0.2b | 2.6 ± 0.6a | 2.0 ± 0.2ab | 2.3 ± 0.3ab | 1.4±0.4b | 5.6 ± 0.5a | 3.9 ± 0.5b | 4.8 ± 0.4ab | 1.5 ± 0.2c | |
| 40–60 | 1.4 ± 0.2a | 1.0 ± 0.2ab | 1.2 ± 0.1ab | 0.8 ± 0.3b | 2.2 ± 0.2a | 1.5 ± 0.1a | 1.9 ± 0.1a | 1.7 ± 0.7a | 3.6 ± 0.5a | 3.7 ± 0.5a | 3.6 ± 0.5a | 1.5 ± 0.2b | |
| 60–100 | 1.1 ± 0.3a | 1.6 ± 0.2a | 1.4 ± 0.2a | 1.6 ± 0.6a | 1.8 ± 0.4a | 1.7 ± 0.2a | 1.8 ± 0.2a | 1.0 ± 0.3a | 3.4 ± 0.4a | 3.8 ± 0.5a | 3.6 ± 0.3a | 1.5 ± 0.3b | |
| 0–100 | 5.4 ± 0.9a | 4.0 ± 0.4a | 4.7 ± 0.5a | 1.8 ± 0.4b | 3.5 ± 0.4a | 2.1 ± 0.2bc | 2.8 ± 0.1ab | 1.7 ± 0.3c | 7.2 ± 0.6a | 6.1 ± 0.4a | 6.7 ± 0.4a | 1.7 ± 0.2b | |
| Bulk density (g·cm−3) | 0–10 | 1.46 ± 0.03a | 1.49 ± 0.03a | 1.47 ± 0.03a | 1.50 ± 0.01a | 1.47 ± 0.03a | 1.56 ± 0.01bc | 1.51 ± 0.01ab | 1.60 ± 0.03c | 1.41 ± 0.05a | 1.53 ± 0.04bc | 1.47 ± 0.01ab | 1.62 ± 0.02c |
| 10–20 | 1.51 ± 0.03a | 1.52 ± 0.03a | 1.51 ± 0.03a | 1.54 ± 0.02a | 1.49 ± 0.01a | 1.56 ± 0.02b | 1.52 ± 0.01ab | 1.55 ± 0.02b | 1.53 ± 0.04a | 1.53 ± 0.02a | 1.53 ± 0.01a | 1.61 ± 0.02a | |
| 20–40 | 1.52 ± 0.03a | 1.53 ± 0.03a | 1.52 ± 0.03a | 1.56 ± 0.01a | 1.52 ± 0.01a | 1.54 ± 0.01a | 1.53 ± 0.01a | 1.54 ± 0.03a | 1.52 ± 0.03a | 1.54 ± 0.03a | 1.53 ± 0.03a | 1.60 ± 0.01a | |
| 40–60 | 1.52 ± 0.03a | 1.57 ± 0.05a | 1.54 ± 0.04a | 1.56 ± 0.02a | 1.53 ± 0.03a | 1.55 ± 0.02a | 1.54 ± 0.02a | 1.56 ± 0.02a | 1.50 ± 0.04a | 1.55 ± 0.02a | 1.53 ± 0.03a | 1.58 ± 0.01a | |
| 60–100 | 1.52 ± 0.03a | 1.54 ± 0.03a | 1.53 ± 0.03a | 1.58 ± 0.01a | 1.56 ± 0.01a | 1.55 ± 0.01a | 1.56 ± 0.01a | 1.55 ± 0.01a | 1.53 ± 0.06a | 1.55 ± 0.02a | 1.54 ± 0.03a | 1.57 ± 0.01a | |
| 0–100 | 1.50 ± 0.03a | 1.53 ± 0.03a | 1.52 ± 0.03a | 1.55 ± 0.01a | 1.51 ± 0.01a | 1.55 ± 0.01ab | 1.53 ± 0.01ab | 1.56 ± 0.02b | 1.50 ± 0.04a | 1.54 ± 0.03ab | 1.52 ± 0.02ab | 1.60 ± 0.01b | |
| LFOC (g·kg−1 LF) | 0–100 | 182.4 ± 2.8a | 155.3 ± 5.8bd | 168.9 ± 3.6c | 150.4 ± 3.9d | 204.8 ± 11.3a | 183.3 ± 13.3a | 194.0 ± 11.8a | 149.4 ± 4.0b | 184.9 ± 7.5a | 172.7 ± 6.8a | 178.8 ± 5.5a | 149.7 ± 2.4b |
| LFN (g·kg−1 LF ) | 0–100 | 13.3 ± 0.3a | 10.0 ± 0.5b | 11.7 ± 0.3c | 7.2 ± 0.2d | 12.7 ± 0.5a | 11.7 ± 0.7a | 12.2 ± 0.6a | 6.4 ± 0.4b | 12.2 ± 0.8a | 11.7 ± 0.3a | 12.0 ± 0.4a | 6.8 ± 0.5b |
Values of a parameter for a given plantation age labeled with different letters differ significantly (p < 0.05, ANOVA followed by a least-significant-difference test).
Table 2.
Changes in the storage of soil organic carbon (SOC), total nitrogen (TN), light-fraction (LF) organic carbon (LFOC), and light-fraction nitrogen (LFN) to a depth of 100 cm following the afforestation of fixed dunes and active dunes with Caragana microphylla. (Values are mean ± SE based on the mean of the storage under the shrub canopy and between the rows.) SOC and TN values were calculated using Equation (1); LFOC and LFN values were calculated using Equation (2).
| Layer (cm) | 9-Year | 15-Year | 31-Year | |||
|---|---|---|---|---|---|---|
| Plantation | Fixed Dunes | Plantation | Active Dunes | Plantation | Active Dunes | |
| SOC storage (kg·ha−1) | ||||||
| 0–10 | 8406 ± 1068a | 2279 ± 183b | 3000 ± 179a | 966 ± 102b | 4908 ± 391a | 1017 ± 133b |
| 10–20 | 3291 ± 478a | 1240 ± 77b | 1920 ± 191a | 936 ± 60b | 2651 ± 283a | 948 ± 164b |
| 20–40 | 2849 ± 338a | 2004 ± 128b | 2378 ± 247a | 1636 ± 102b | 4243 ± 202a | 1720 ± 273b |
| 40–60 | 1753 ±146a | 1786 ± 67a | 1837 ± 120a | 1137 ± 175b | 2386 ± 182a | 1461 ± 308b |
| 60–100 | 2961 ± 182a | 2918 ± 210a | 3039 ± 169a | 2314 ± 313b | 4665 ± 443a | 2559 ± 115b |
| Subtotal | 19,260 ± 1867a | 10,227 ± 357b | 12,174 ± 643a | 6989 ± 413b | 18,853 ± 908a | 7705 ± 896b |
| TN storage (kg·ha−1) | ||||||
| 0–10 | 925 ± 111a | 274 ± 22b | 321 ± 11a | 119 ± 9b | 590 ± 41a | 104 ± 12b |
| 10–20 | 364 ± 40a | 142 ± 17b | 219 ± 28a | 90 ± 7b | 325 ± 30a | 102 ± 13b |
| 20–40 | 339 ± 18a | 248 ± 12b | 266 ± 37a | 160 ± 19b | 465 ± 15a | 172 ± 24b |
| 40–60 | 186 ± 5a | 211 ± 14a | 190 ± 26a | 141 ± 13a | 274 ± 20a | 139 ± 25b |
| 60–100 | 319 ± 18a | 392 ± 21a | 319 ± 23a | 309 ± 39a | 556 ± 50a | 231 ± 31b |
| Subtotal | 2133 ± 141a | 1267 ± 45b | 1315 ± 97a | 819 ± 66b | 2210 ± 105a | 748 ± 90b |
| LFOC storage (kg·ha−1) | ||||||
| 0–10 | 1734 ± 343a | 673 ± 77b | 633 ± 85a | 199 ± 37b | 930 ± 58a | 181 ± 65b |
| 10–20 | 686 ± 116a | 342 ± 59b | 463 ± 72a | 147 ± 46b | 653 ± 70a | 165 ± 49b |
| 20–40 | 610 ± 47a | 395 ± 62b | 738 ± 126a | 256 ± 66b | 982 ± 78a | 321 ± 115b |
| 40–60 | 342 ± 30a | 206 ± 34b | 573 ± 74a | 164 ± 51b | 507 ± 73a | 193 ± 69b |
| 60–100 | 663 ± 76a | 311 ± 65b | 1139 ± 130a | 419 ± 156b | 885 ± 67a | 449 ± 185b |
| Subtotal | 4035 ± 446a | 1927 ± 246b | 3546 ± 300a | 1185 ± 223b | 3957 ± 148a | 1309 ± 432b |
| LFN storage (kg·ha−1) | ||||||
| 0–10 | 120 ± 24a | 32 ± 4b | 40 ± 5a | 9 ± 2b | 62 ± 4a | 8 ± 3b |
| 10–20 | 47 ± 8a | 16 ± 3b | 29 ± 5a | 6 ± 2b | 44± 5a | 8 ± 2b |
| 20–40 | 42 ± 3a | 19 ± 3b | 46 ± 8a | 11 ± 3b | 66 ± 5a | 15 ± 5b |
| 40–60 | 24 ± 2a | 10 ± 2b | 36 ± 5a | 7 ± 2b | 34 ± 5a | 9 ± 3b |
| 60–100 | 46 ± 5a | 15 ± 3b | 72 ± 8a | 18 ± 7b | 59 ± 5a | 20 ± 8b |
| Subtotal | 279 ± 31a | 92 ± 12b | 223 ± 19a | 51 ± 10b | 265 ± 10a | 60 ± 20b |
Values of a parameter for a given plantation age labeled with different letters differ significantly (p < 0.05, ANOVA followed by a least-significant difference test).
© 2017 by the authors. Licensee MDPI, Basel, Switzerland. This article is an open access article distributed under the terms and conditions of the Creative Commons Attribution (CC BY) license (http://creativecommons.org/licenses/by/4.0/).
Share and Cite
MDPI and ACS Style
Li, Y.; Chen, Y.; Wang, X.; Niu, Y.; Lian, J. Improvements in Soil Carbon and Nitrogen Capacities after Shrub Planting to Stabilize Sand Dunes in China’s Horqin Sandy Land. Sustainability 2017, 9, 662. https://doi.org/10.3390/su9040662
AMA Style
Li Y, Chen Y, Wang X, Niu Y, Lian J. Improvements in Soil Carbon and Nitrogen Capacities after Shrub Planting to Stabilize Sand Dunes in China’s Horqin Sandy Land. Sustainability. 2017; 9(4):662. https://doi.org/10.3390/su9040662
Chicago/Turabian StyleLi, Yuqiang, Yinping Chen, Xuyang Wang, Yayi Niu, and Jie Lian. 2017. "Improvements in Soil Carbon and Nitrogen Capacities after Shrub Planting to Stabilize Sand Dunes in China’s Horqin Sandy Land" Sustainability 9, no. 4: 662. https://doi.org/10.3390/su9040662
Note that from the first issue of 2016, this journal uses article numbers instead of page numbers. See further details here.