Article

Correlation between Desertification and Environmental Variables Using Remote Sensing Techniques in Hogno Khaan, Mongolia

1
Department of Environmental Science and Ecological Engineering, Korea University, Seoul 02841, Korea
2
Institute of Geography and Geoecology (Desertification Research Center), Mongolian Academy of Sciences, Baruun Selbe-15, Chingeltei District, 4th Khoroo, Ulaanbaatar 15170, Mongolia
*
Author to whom correspondence should be addressed.
Sustainability 2017, 9(4), 581; https://doi.org/10.3390/su9040581
Submission received: 26 January 2017 / Revised: 5 April 2017 / Accepted: 8 April 2017 / Published: 11 April 2017
(This article belongs to the Section Environmental Sustainability and Applications)

Abstract

:
In this paper, we used Landsat thematic mapper (TM) and enhanced thematic mapper (ETM) data from 1990, 2002, and 2011 to analyze the spatial and temporal patterns of desertification using seven factors; the normalized difference vegetation index (NDVI), the topsoil grain size index (TGSI), land surface albedo, the topographic wetness index (TWI), land surface temperature (LST), the perpendicular drought index (PDI), and the elevation of Hogno Khaan, which lies in a semiarid region of central Mongolia. We normalized the indicators, determined their weights, and defined five levels of desertification; none, low, medium, high, and severe. Sets of rules were constructed, and a multi-criteria evaluation (MCE) approach was used to assess desertification and test the correlations between the seven variables in comparison to the different levels of desertification, with field and reference data used for accuracy. We provide a review of the literature on MCE applied to desertification assessment issues based on satellite data. At the first step, major desertification factors were computed for satellite data. The next step was the construction of pairwise comparison matrix. Then, the weight of each factor was determined by the contribution of an analytical hierarchy process. Finally, the susceptible areas to desertification in the study area were identified using a multi-criteria evaluation method. We found that more than 15% of the total land area in Hogno Khaan suffered from severe desertification in 2011, increasing from 7% in 1990. Our analysis showed that the highest correlations were between TGSI and albedo, PDI and TGSI, and PDI and albedo at all levels of desertification. LST was less strongly correlated with TGSI, albedo, and PDI. The correlation of TWI with PDI and NDVI in the non- and low desertification areas produced R values of 0.15 and 0.58, respectively. The correlation analysis indicated a significant positive correlation between TWI and both NDVI and PDI for all years in non- and low desertification areas. Comparing elevation and NDVI, the highest correlation was found for severe desertification in 2002, although correlations for severe desertification were lower in 1990 and 2011.

1. Introduction

The United Nations Convention to Combat Desertification (UNCCD), which has been ratified by 195 countries, identifies land degradation and desertification as two of the most pressing current environmental concerns [1,2]. In addition, the UN Conference on Sustainable Development (“Rio + 20”) called for a target of zero net land degradation, in which any increase in the degraded land would be counterbalanced by the improvement of land in other areas.
Unfortunately, the breadth, complexity, and dynamism of the desertification process have so far precluded the development of a comprehensive desertification model, and assessment and monitoring techniques have relied on the use of indicators [3,4]. Geeson and Brandt [5], Baartman et al. [6], and Sommer et al. [7] have thoroughly reviewed previous indicator studies and programs, many of which describe one or more aspects of desertification and provide data on the threshold levels, status, and evolution of relevant physical, chemical, biological, and anthropogenic processes.
Desertification mainly occurs in arid areas [8,9,10], but it can affect a wide variety of environments, climates, and societies [11]. Various methods have been used to analyse desertification, including empirical approaches [12,13], remote sensing applications [14,15,16,17,18,19], and modelling [20,21]. With the development of remote sensing technology, especially when combined with geographic information system (GIS) technology, researchers now have an effective method for conducting desertification research over large areas [17,22]. By analysing remote sensing imagery over a long period of time, it has become possible to quickly and accurately assess desertification trends, thereby aiding in the prediction and management of this problem.
The condition of the vegetation on degraded land has long been considered a good indicator for the quantitative detection of ecosystem processes at different scales [23,24,25,26]. Therefore, many studies have employed vegetation indices based on remote sensing images, in particular the normalized difference vegetation index (NDVI) and net primary production (NPP), which has a strong correlation with NDVI, to identify anthropogenic land degradation or desertification by comparing the potential and actual state of the vegetation [27,28,29,30,31,32,33].
Mongolia is severely affected by desertification. According to the first national survey on desertification, desertification (from low to severe levels) is evident in 70% of the total land area. However, there are many different natural zones in this region, so a method that allows for the detailed analysis of each natural zone and local sub-region is required. We have thus conducted a desertification assessment in this area using a decision tree (with three variables) on the other research [34]. In this article, we assessed desertification using a multi-criteria evaluation (MCE) method incorporating seven variables at the local level (administrative body for a small geographic area). The specific objectives of this study are to (1) use multi-criteria evaluation (MCE) techniques in the desertification of assessment based on satellite data on a local scale; (2) identify the relationship between environmental variables and desertification; (3) determine the spatial distribution of desertification; and (4) do an accuracy check by reference map and field data on the final result.

2. Study Area

The Hogno Khaan nature reserve is located between latitudes 47°23′ and 47°38′N and longitudes 103°30′ and 103°50′E in the Khangai-Khentii ranges. It borders three geographic regions; the Gurvanbulag and Rashaant sums (districts) of Bulgan Province and the Burd sum of Uvurkhangai Province. This area is characterised by various geomorphic and topographic features, including tall mountains, steppes, sand dunes, and a river. The reserve covers 835.45 km2 and is situated in the area of the Elsen Tasarkhai sand dunes, with Mongol Els in the south and Hogno Tarnyn Els in the north. Elsen Tasarkhai sand is saturated under the surface; therefore, shrubs such as Ulmus pumila and Salix ledebouriana grow in the area. Elsen Tasarkhai is surrounded by mountains, with Hogno Khaan to the north and Ikh Mongol to the south. Geologically, the mountainous areas consist of Jurassic granites, and their topography is characterised by rocky outcrops and flat or undulating slopes, with the highest peak at 1967 m above sea level and a low of 1165 m in the Tarna river basin.
The area was placed under state protection as a nature reserve in 1997 after Parliament Resolution No. 47. The Hogno Khaan area is characterised by an extreme continental climate, being both dry and cool. Temperatures fall to around −20 to −25 °C in winter and rise to 20 to 27 °C in summer. The coldest month is January, with a lowest recorded temperature of about −44 °C, while the warmest month is July, with a recorded high of 30 °C. The mean annual precipitation in the area is 250 to 300 mm, with 80% to 90% of this falling during the warm season.
Wind velocity ranges from 0.5 to 2.3 m/s, with the strongest winds generally occurring in May, at about 4.0 m/s. Lenses of permafrost at depths ranging between 3.2 and 4.5 m and seasonal frosts occur in the intermountain valleys and on north-facing slopes for 5 to 5.5 months a year. A large aeolian sand dune is located on the western margin and southwestern corner of the protected area, extending south and north along the valley due to the deflation of the dune crests in the Tarna-Tuul region. Different types of vegetation form a successional series on the sand dune: (1) Polygonum-Oxytropis herb communities during incipient dune formation; (2) Salix shrub communities in the early pioneer stage; and (3) Betula shrub communities in the later pioneer stage. The Betula shrub community is most dominant on stabilised sand dunes. The two Salix sp. and Betula sp. shrub communities exhibit a bushy and mono-dominated physiognomy. Felling for firewood is the main disturbance in the shrub community. A wide terrace carved by channel incision is found in the Schiluust streamlet of the Tarna River. The floodplain of the stream channel at base flow is about 15 m wide, the bank full channel (Thalweg) is 1 m wide and 0.2 m deep, and the scarp slope is very steep. Iris bungei communities are typical of the dry grasslands on the sandy soils of the wide terrace and show the effects of overgrazing in a semidesert zone.

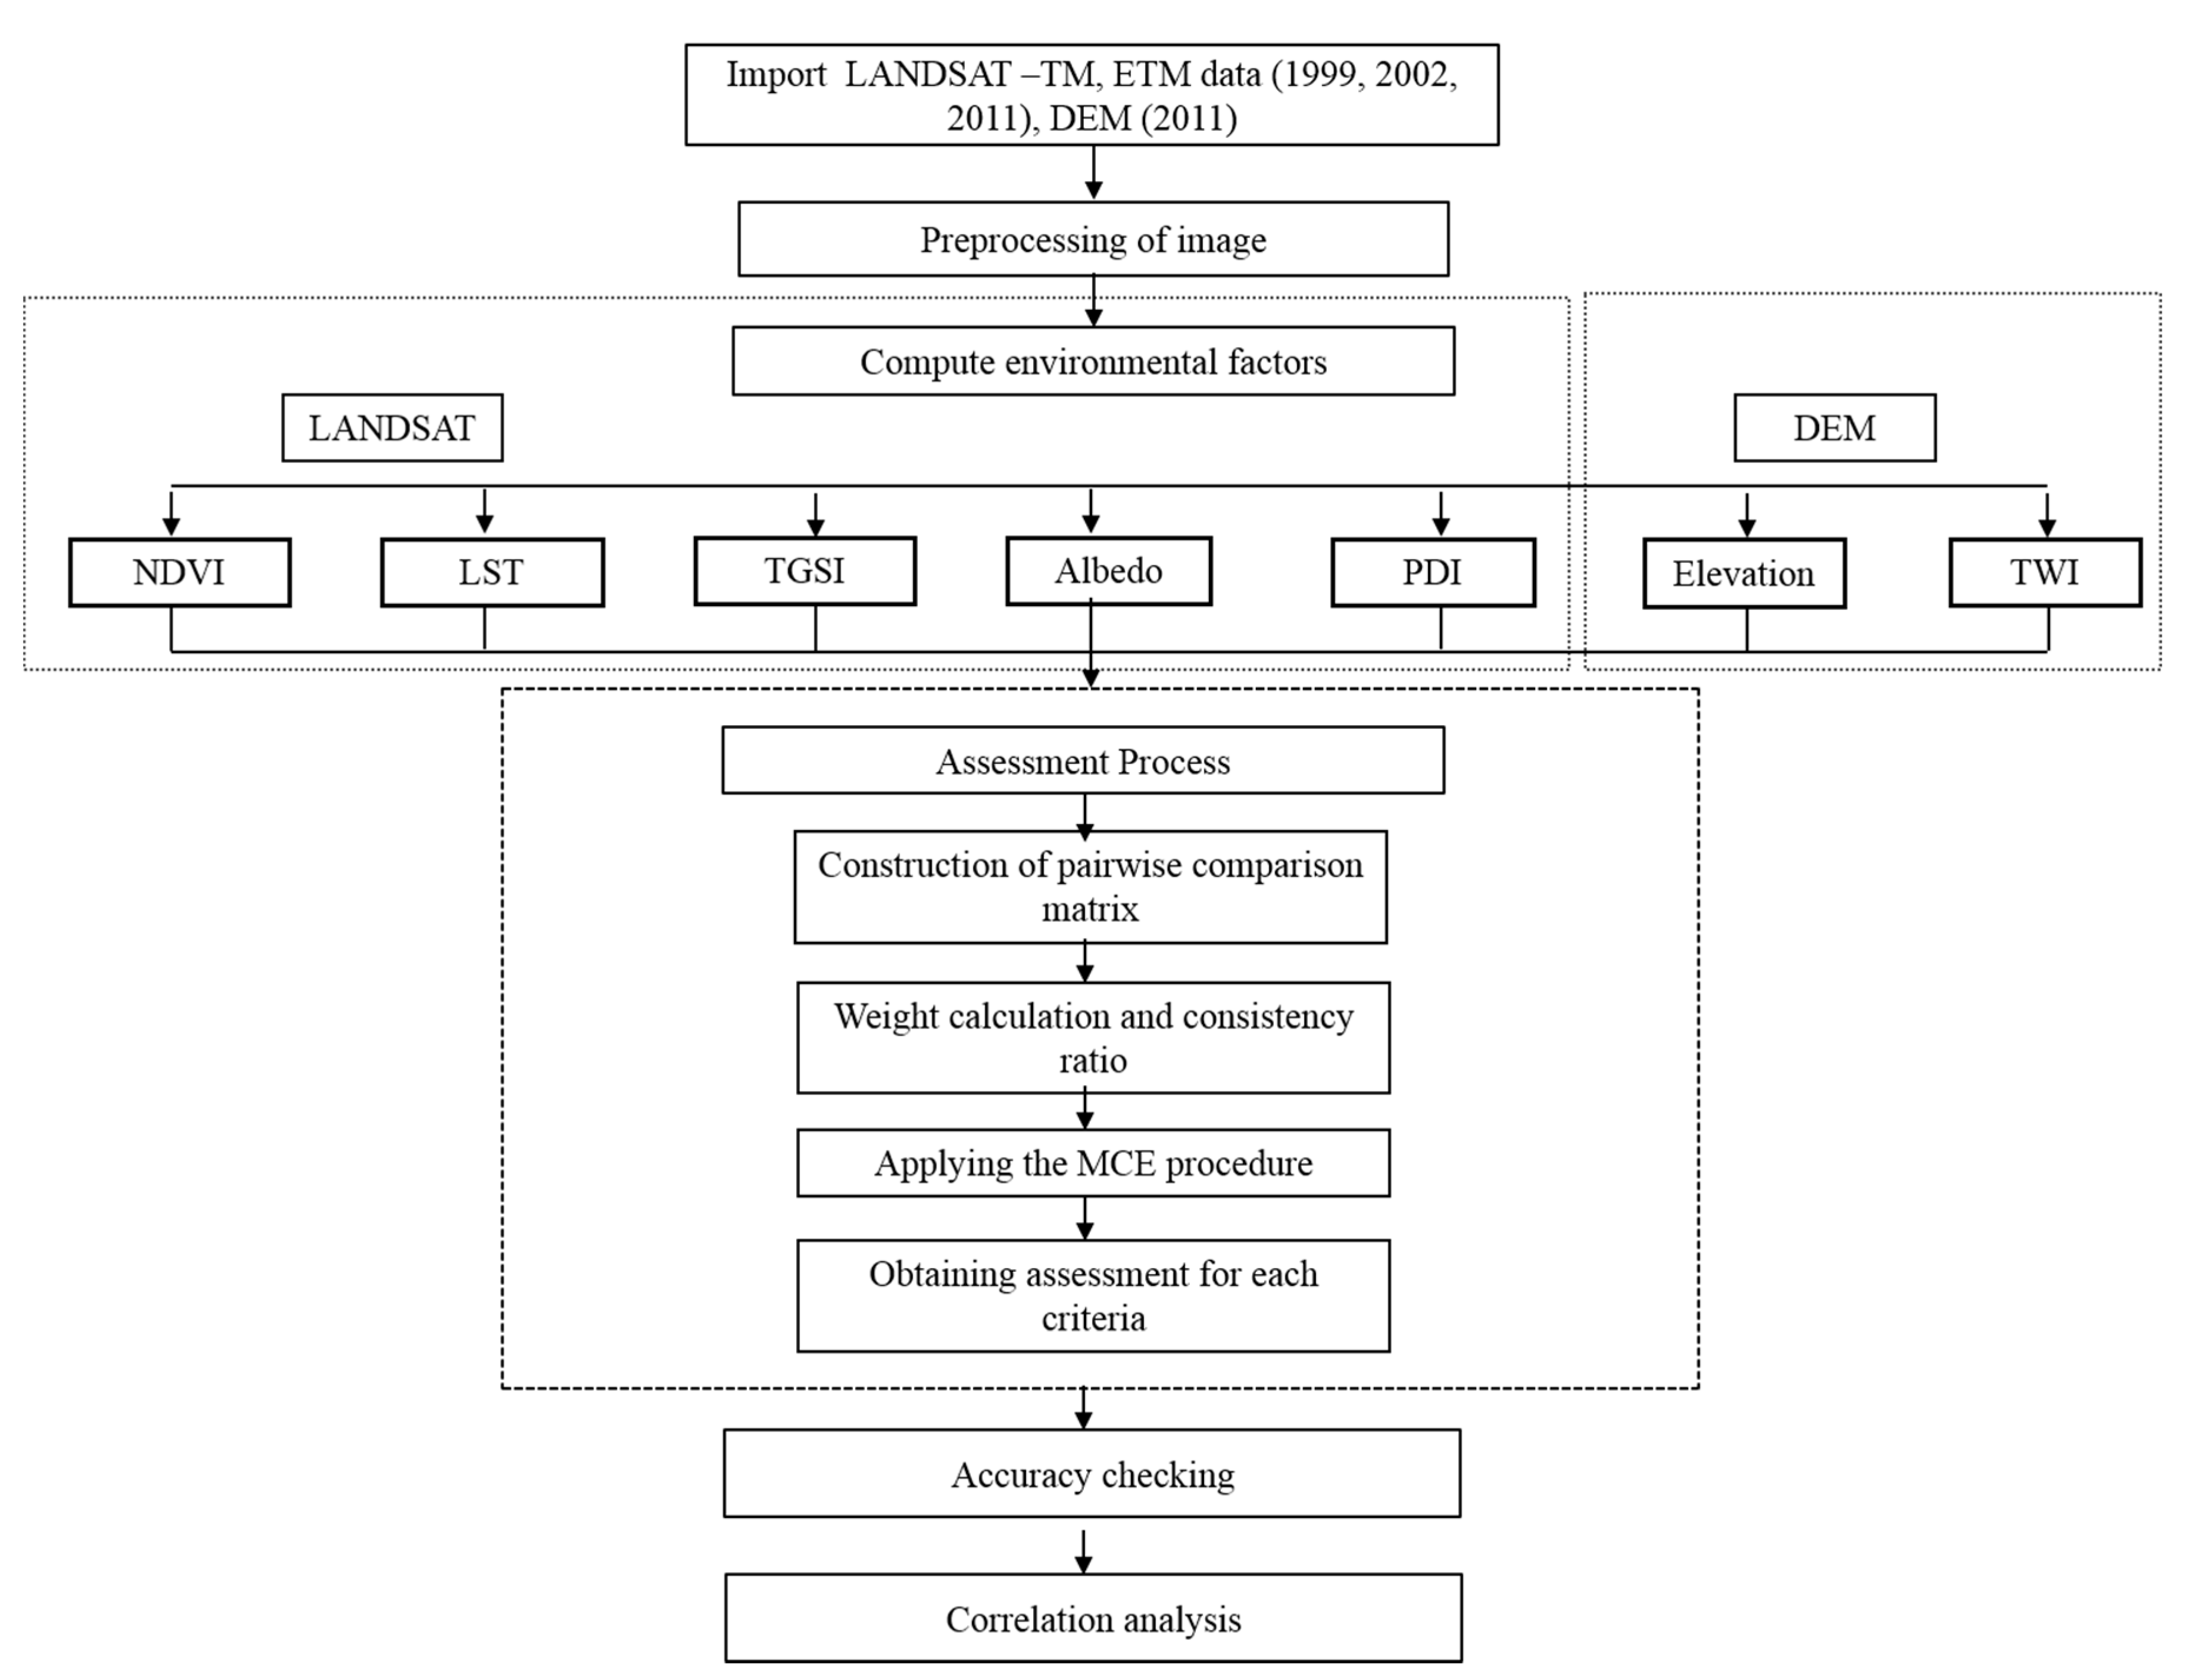
3. Materials and Methods

3.1. Materials and Preprocessing

In this research, the process of desertification in the Hogno Khaan protected area was evaluated using satellite remote sensing imaging from three periods between 1990 and 2011. Enhanced Thematic Mapper Plus (ETM+) images from Landsat 7 were recorded on 16 August 2002 and Thematic Mapper (TM) images from Landsat 4–5 were recorded on 8 September 1990 and 17 August 2011 (path/row 133/027), http://landsat.usgs.gov. This was done with an ASTER (Advanced Spaceborne Thermal Emission and Reflection Radiometer) Global Digital Elevation Model (ASTER GDEM) version 2, 2011 (https://gdex.cr.usgs.gov/gdex/). Radiometric calibration, geometric correction, and cloud removal were carried out for all of these images, which were all geo-referenced to the WGS_1984_UTM Projected Coordinate System. The image DN (digital number) values were transformed into spectral radiance value and then into land surface albedo and land surface temperature. Satellite data for the three years were used to identify multi–temporal changes in five factors, and TWI (topographic wetness index) and elevation are based on one DEM (Digital Elevation Model).

3.2. Processing of Images

Changes in land surface conditions are closely related to desertification. The main characteristics of desertification are soil degradation, micrometeorological alteration, and the decrease in both land cover and vegetation biomass. In addition to elevation, six other indicators were used to assess desertification, following the procedure presented in Figure 1. The software packages used for this study were ENVI (Exelis Visual Information Solutions, Boulder, CO, USA) for image processing, TerrSet (Clark Labs at Clark University, Worcester, MA, USA) and ArcInfo (Esri, Redlands, CA, USA) for analysing and presenting the results, and SPSS (SPSS Inc., Chicago, IL, USA) for statistical and graphical analysis.

Environmental Variables

• Normalized difference vegetation index (NDVI):
This is the most common vegetation index, measuring the difference between the red R and near infrared (NIR) bands divided by the sum of the red and near-infrared bands.
• Topsoil grain size index (TGSI):
This was developed from a field survey of soil surface spectral reflectance and laboratory analyses of soil grain composition [35]. Even one rainfall event can significantly increase vegetation cover; thus, NDVI may misinterpret the actual degree of desertification [35]. To overcome this problem, Xiao et al. [35] proposed the TGSI, which is associated with the physical properties (mechanical composition) of topsoil and is based on the mean or effective diameter of individual mineral grains or particles. The TGSI reflects the coarsening of topsoil grain size, which has a positive correlation with the fine sand content of the surface soil. The more severe the desertification, the coarser the topsoil grain size. High TGSI values are found in areas with a high content of fine sand in the topsoil or a low proportion of clay-silt grains.
• Albedo:
Land surface albedo is an important indicator of the energy budget and changes in micrometeorological conditions such as temperature and the aridity/humidity of land affected by desertification [36,37]. Some studies have suggested that an increase in land surface albedo represents the degradation of land quality [38]. In this study, we used broadband albedo, which is determined by the combination of the narrow-band albedos for each band, to assess the micrometeorological conditions of the land surface. The narrow-band albedo for each band in the Landsat images (except band six for Landsat TM/ETM+) was determined using the dark object subtraction method [39,40]. The broadband albedo was then calculated according to its relationship with each narrow band [41,42,43].
• Perpendicular drought index (PDI):
PDI is a line segment parallel to the soil line and perpendicular to the normal of the soil line that passes through the coordinate origin. PDI values vary between 0.0 and 1.0. A pixel with a larger PDI exhibits more severe water stress and is located further away from the coordinate origin than a pixel with a smaller PDI, which is located closer to the coordinate origin and represents lower water stress or a wet surface [44].
• Topographic wetness index (TWI):
This is a steady-state wetness index, and it has been shown to predict solum depth in some studies [45]. TWI is strongly correlated with soil moisture, thus it can provide indirect information about land cover and agricultural potential [46].
• Land surface temperature (LST):
LST was derived from the corrected ETM+ TIR (thermal infrared) band 6 (10.44–12.42 μm). The ETM+ TIR band has a spatial resolution of 60 m, and the thermal imagery from Landsat 7 is generally well calibrated to ground truth data [47]. TM (thermal infrared) band 6 has a similar effective wavelength with a spatial resolution of 120m. The next step is to convert the spectral radiance into at satellite brightness temperature (black body temperature, TB) under the assumption of uniform emissivity [48].

3.3. Assessment Method

MCE is a tool that helps to establish weights for several criteria, without requiring that all data be converted into the same units and widely used appraisal method, which assesses options on the basis of a multi-dimensional criteria framework and calculates rankings of options. This is done to evaluate the overall environmental consequences of an alternative, taking into account multiple criteria and their relative weights. Weights were given according to the effectiveness of the criteria. The weight for each factor was determined by pairwise comparisons in the context of a decision-making process known as the analytical hierarchy process (AHP) [49]. The resilience rating for each level of a factor was determined from the survey results and professional judgment of the authors. In this study, we provided a review assessment of desertification based on satellite data, with the general environmental variables in a combination of various weighted criteria. Outputs were then successively integrated using multi-criteria evaluation (MCE) techniques to assess them. Although the factor scores were based on real data, the assignment of weights during the multi-criteria evaluation (MCE) stage was considered to be partly subjective because it was dependent on decisions made by the authors [50,51,52].

3.3.1. Weights and Scores

One of the mathematical models in a multi-criteria evaluation method is a weighted linear combination (WLC) mathematical model, which is an approach to qualitative map combination. The weight of each factor (W) in this method represents the importance of each factor compared to the other factors. Authors and experts were invited to fill in the pair-wise comparison matrices to generate the weighting matrix, which is shown in Table 1 and Table 2.
In order to use this procedure, it is necessary for the weights to add up to 1. The seven factors selected for assessing the desertification are compared with each other according to experts’ judgments. Ratings are systematically scored on a 17-point continuous scale from 1 (least important) to 9 (most important) [50], as presented in Table 1. Otherwise, the value varies between the reciprocals 1/2 and 1/9. In this research, scores were assigned in rank order according to the number of factors involved in the assessment with no repetition. The pairwise comparison matrices are shown in Table 2. The pair-wise comparison matrix contains many multiple paths by which the relative importance can be assessed. It is also possible to determine the degree of consistency that has been used in developing the judgments. In the construction of the matrix of paired comparison, the consistency of the judgments could be revealed because this matrix is a consistent matrix. For example, if factor 1 is preferred to factor 2 and factor 2 to factor 3, then factor 1 must be more preferred to factor 3. In AHP, an index of consistency, known as the consistency ratio (CR), is used to indicate the probability that the matrix judgments were randomly generated [50]:
CR   =   C I R I
where R I is the average of the resulting consistency index depending on the order of the matrix given by Saaty [50]. The consistency index CI is defined as:
C I = m m a x n n 1 ,
where m m a x is the largest or principal eigenvalue of the matrix and n is the order of the matrix. A CR of 0.10 or less is a reasonable level of consistency Saaty [50]. A CR above 0.10 requires revisions of the judgments in the matrix because of an inconsistent treatment of particular factor ratings. In the present study, the CR of 0.0044 (Table 2) is then acceptable.

3.3.2. Desertification Assessment Map

In this step, desertification factors are combined and the desertification map is obtained using WLC mathematic model Equation (3) by Wang [53].
D A M = i = 1   t o   n   W i   X i
where:
  • D A M = Desertification map,
  • W i = weight of each information layer,
  • X i = map of each information layer.

3.4. Accuracy Checking

We were collected 15 training points in August 2011 for each desertification grade based on vegetation and desertification. The maps, which were constructed for The Institute of Geography and Geoecology (Desertification Research Center), Mongolian Academy of Sciences, would be used to the assessment of desertification. For the accuracy of desertification, 526 testing points were selected when used with the desertification reference map of 2011.
We estimated the accuracy checking of 2002 and 1990, which was the same as for 2011, which means that the result of the classification is affected only by differences in the state of the landscape. The differences in the conditions of shooting a space image should not be influential for all the images shot in the same season; the images were radiometrically calibrated.
Accuracy is defined as the degree to which the constructed map agrees with the reference classification. There are four measures of accuracy in common use [54]. Overall accuracy is simply the proportion of the area mapped correctly. It provides the user of the map with the probability that a randomly selected location on the map is correctly classified. User accuracy is the proportion of the area mapped as a particular category that is actually that category “on the ground”, wherein the reference classification is the best assessment of the ground condition. Producer accuracy is the proportion of the area that is a particular category on the ground that is also mapped to that category. Producer accuracy is the complement of the probability of omission error. The kappa coefficient of the agreement is often used as an overall measure of accuracy. Kappa incorporates an adjustment for “random allocation agreement”, but the validity of this adjustment is arguable and numerous articles have questioned the use of kappa [55,56,57].

3.5. Linear Correlation Analysis

The correlation coefficient is also known as the sample correlation coefficient R product-moment correlation coefficient, or coefficient of correlation. It measures the linear correlation between two random variables. For example, when the value of the predictor is manipulated (increased or decreased) by a fixed amount, the outcome variable changes proportionally (linearly).
In this study, we computed correlations between desertification level, and environmental variables were determined using a single (R value). This was done to calculate data of statistical measures between a single predictor (independent variable) or predictors and images (dependent variable) for each pixel in the image. The output statistical measures include the correlation coefficient R.

4. Results and Discussion

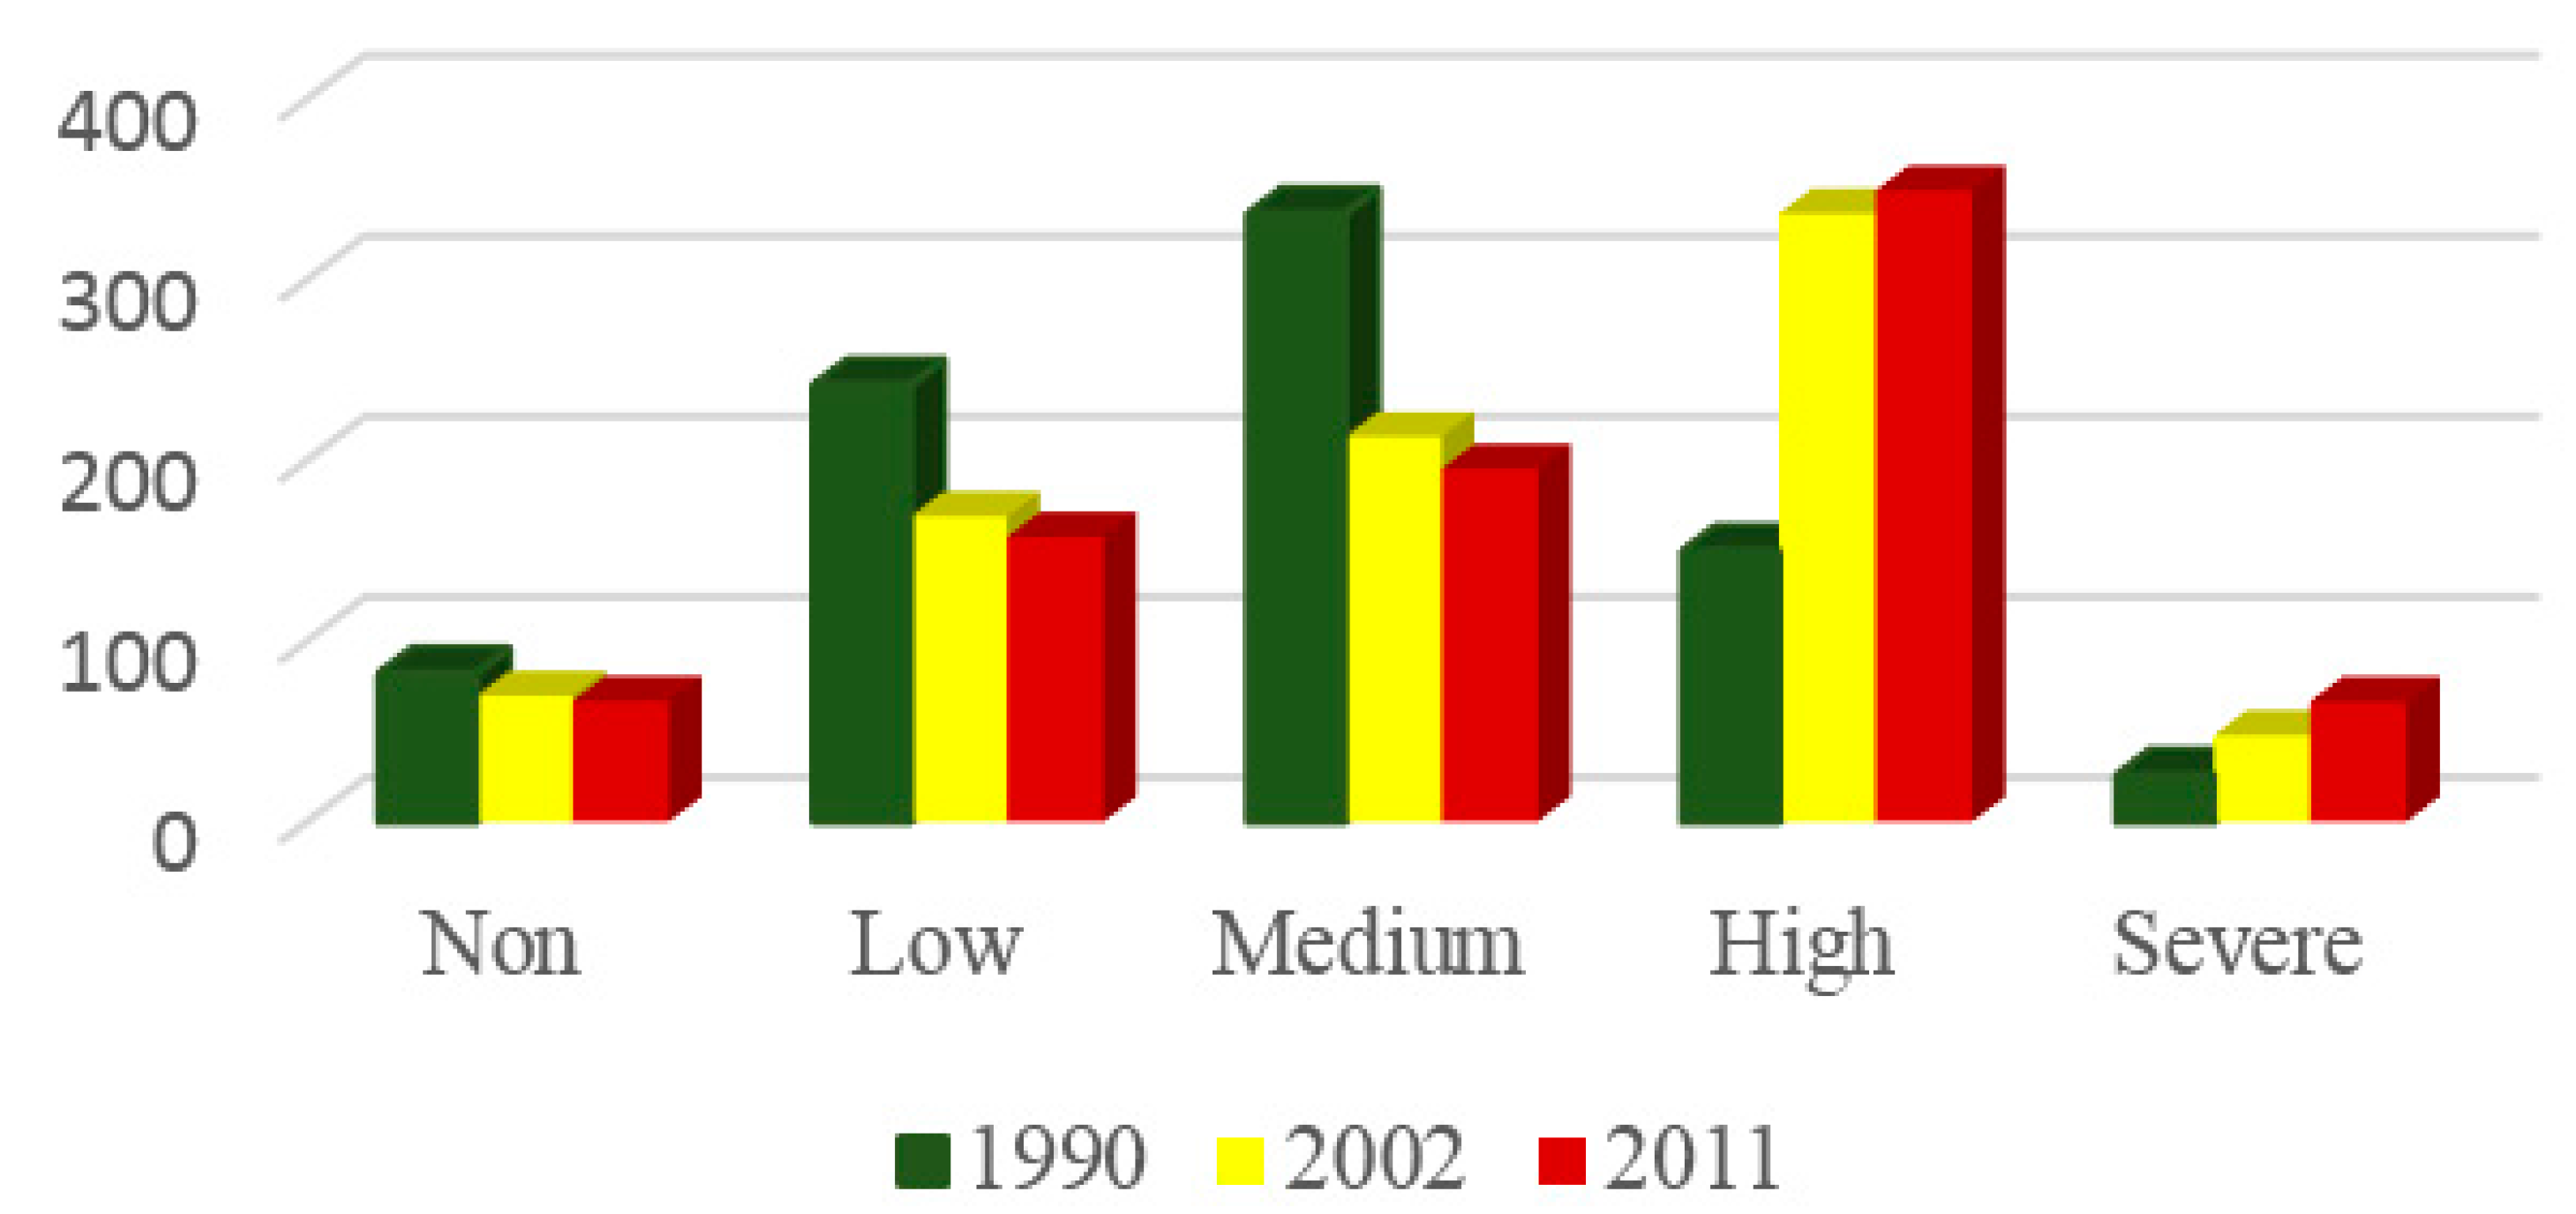
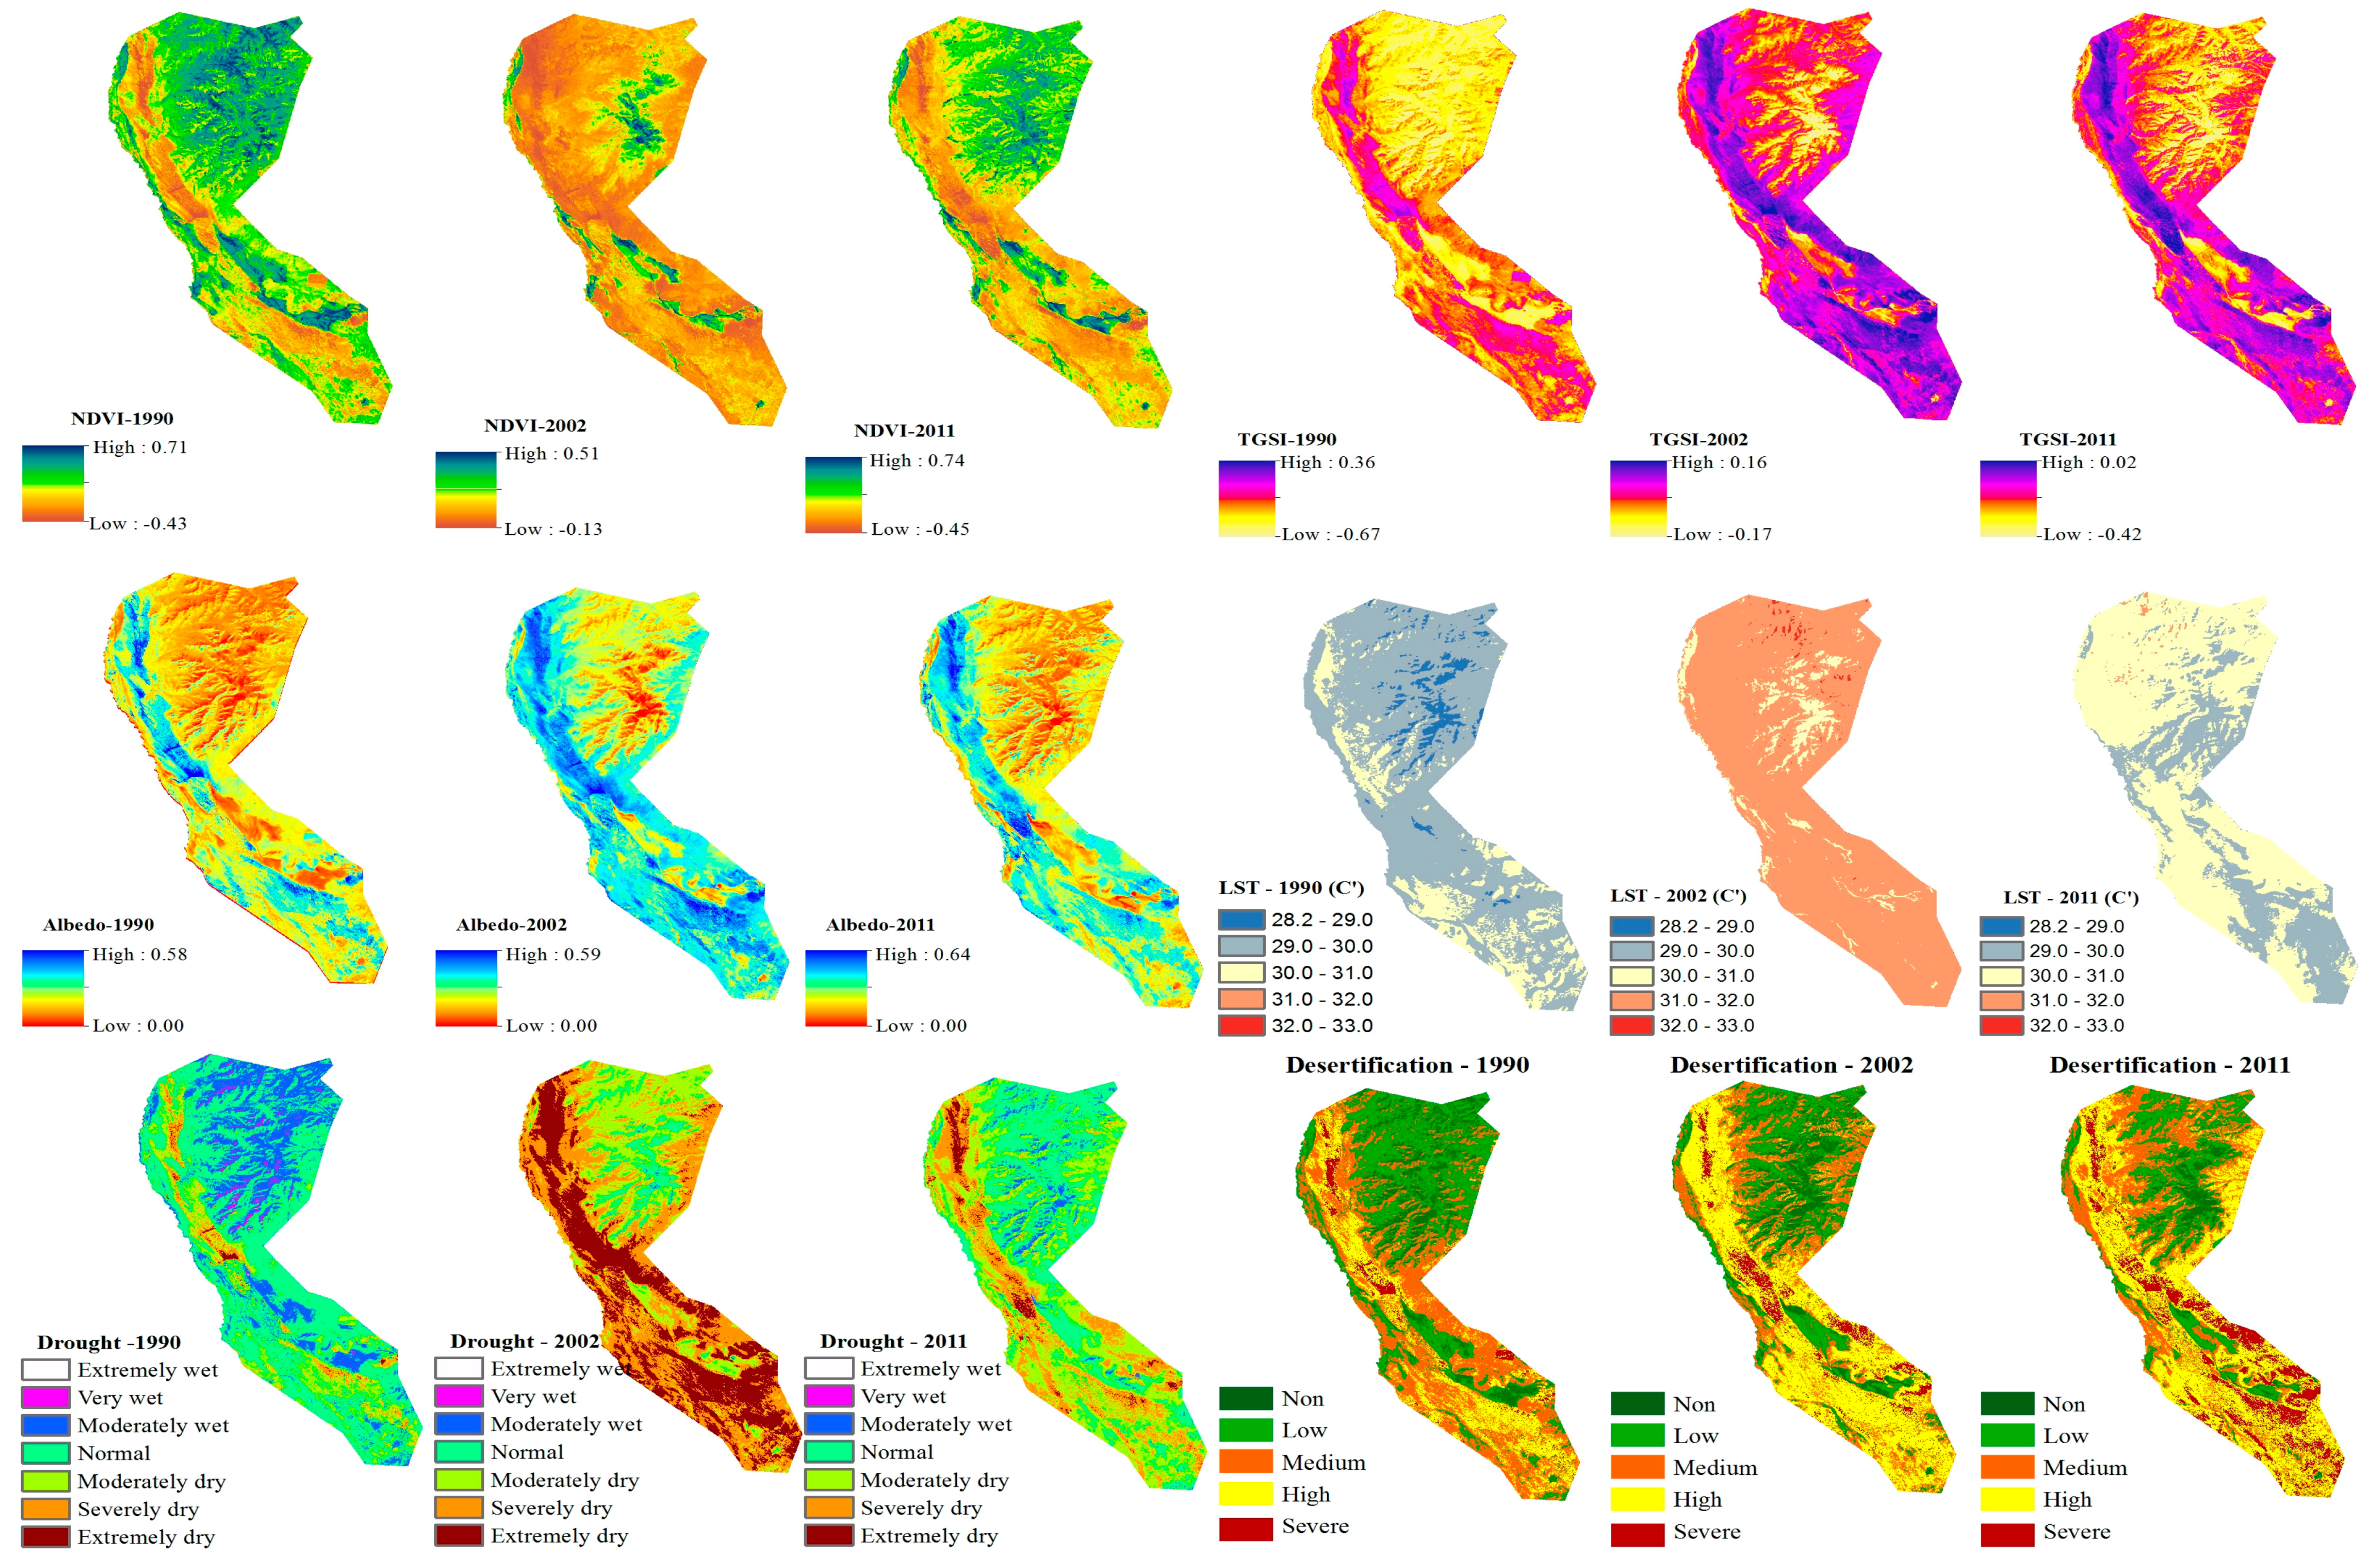
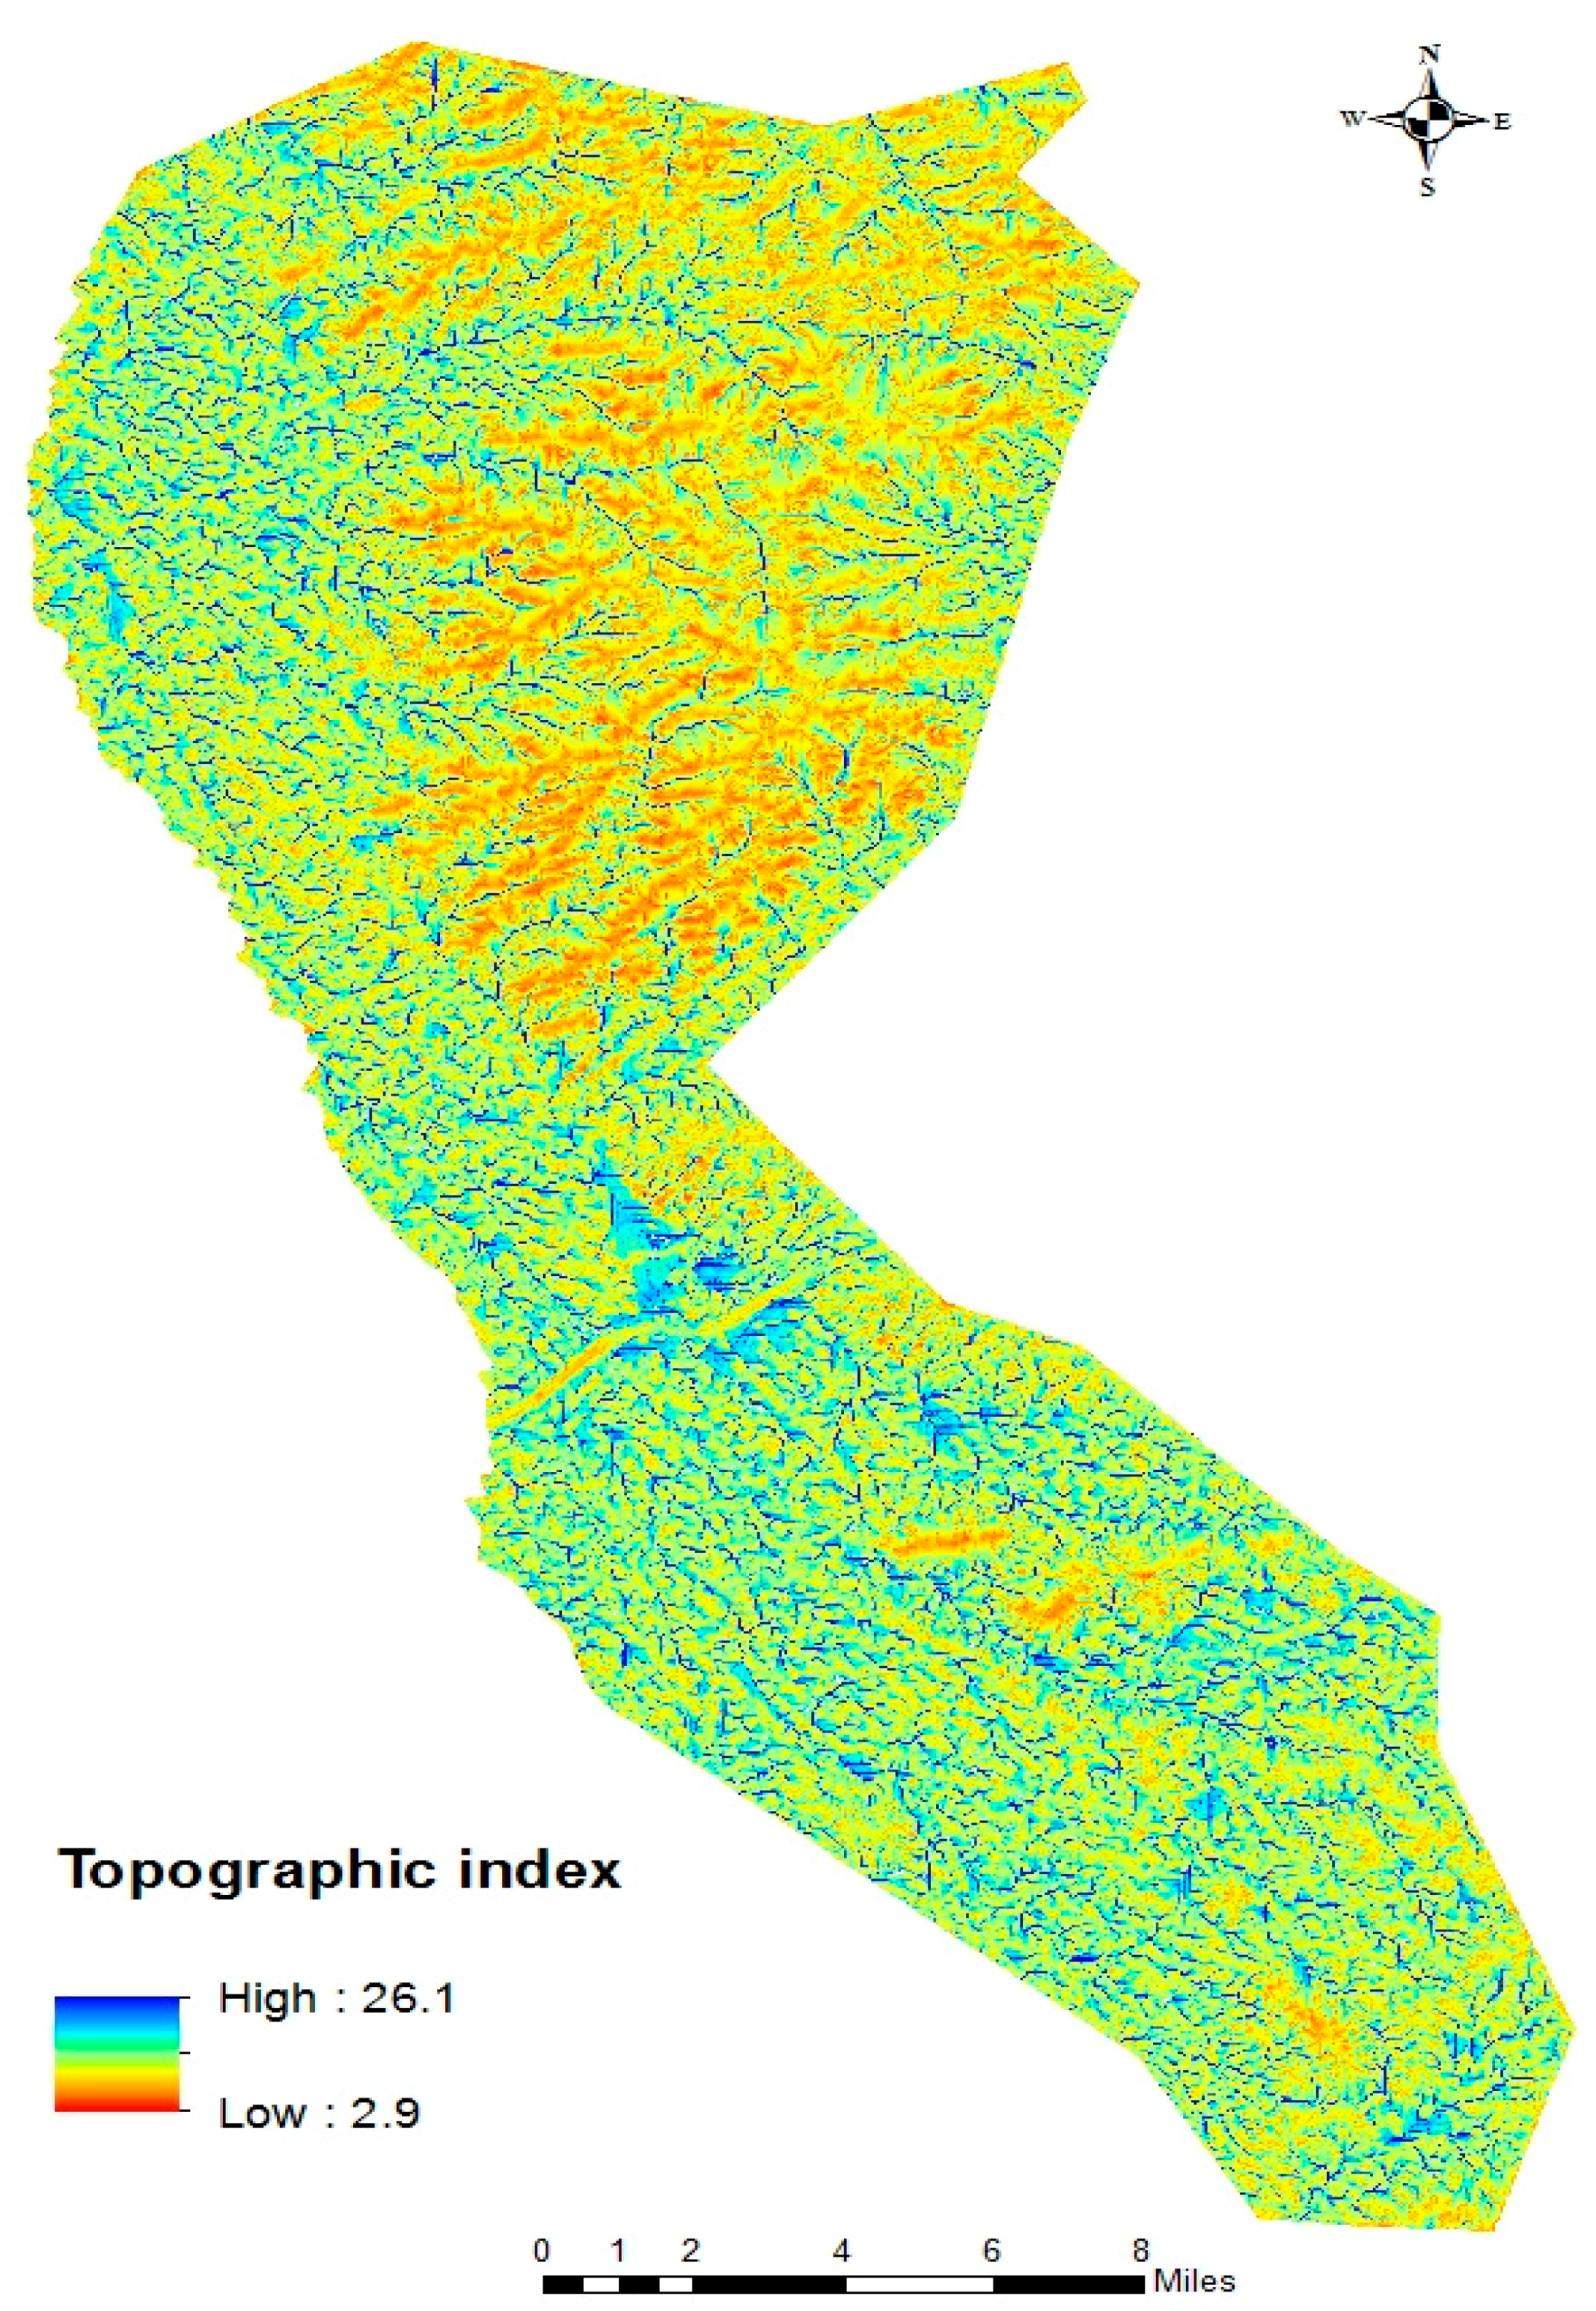
4.1. Assessment of Desertification, Distribution of Environmental Variables

The study area exhibited an overall trend of increasing desertification. In the last 20 years, there has been a decrease in areas of low desertification and an increase in areas with high and severe desertification. Also, severe desertification has increased significantly over the last 10 years, while areas of medium and high desertification have barely changed.
The dominant land cover types in this region are sand dunes and grasslands. Areas of cropland in the region have been abandoned since the 1990s; however, in the last ten years, degraded areas have increased dramatically. The southern and northwestern parts of Hogno Khaan have seen an expansion of desertification, with a gradual intensification in the last twenty years. The cultivation of planted crops in some agricultural zones between 1980 and 1990 resulted in degraded soil and the abandonment of fields in the 1990s. As a result, Chenopodium album L., Caragana microphylla, Urtica cannabina L., Artemisia Adamsii, Artemisia frigida, Potentilla bifurca, Potentilla anserina, Carex duriuscula, and Agropyron cristatum started to grow in these areas, an indication of desertification [34]. However, these regions were characterised by a medium NDVI because the plants reflect green light. This demonstrates that the NDVI can be used to indicate a change in greenness; in this study we used a field survey data of vegetation at 15 sites in August 2011.
This region is a protected area covered by natural sand dunes and experiences increased sand movement; areas of no desertification have been converted into areas of low desertification, and areas of medium and high desertification have become areas of severe desertification. In the last year, we estimated the desertification levels in this area using another method, and we compared the two results. Very similar results were obtained.
LST ranged from 30 to 32 °C, with the highest value in the regions downstream of severe desertification. LST is higher in the desert region due to its lower soil moisture and higher solar radiative energy [58]. We found different results in 2002 from other years; the change in maximum LST coincided with maximum PDI and albedo. This is consistent with the occurrence of drought in this year (Table 3 and Figure 2). The results of correlation can be seen in Table 4; there is a correlation between NDVI and LST that suggests a negative value (R = −0.02 to −0.22) and the correlation between albedo and PDI demonstrate a positive value (R = 0.80 to 0.98), all occurring at the desertification level in 2002. However, in the other year, the correlation between NDVI and LST showed a positive value (R = 0.08 to 0.29) at the non-desertification level but indicated a negative value (R = 0.12 to 0.97) at the other desertification level. Nevertheless, the correlation between albedo and PDI showed a negative value at the non-desertification level but, on the other desertification level, was associated with a positive value. Non-desertification levels occurred in the forest cover in our study area; we can say moisture is not generally important in forest cover, but in a drought year moisture is an important factor in forest cover. Generally, with high LST availability, PDI increases, becoming similar to both bare soil and vegetation. The dry edge represents the limiting conditions of wet for vegetation cover. Drought reflects very stressed surfaces with low vegetation, LST, and Albedo. 2002 showed the highest LST for overall area, as well as the lowest NDVI and retention of drought. We confirmed that NDVI, LST, and PDI are temporary factors and that TGSI and the desertification process are created in the long term. With increasing NDVI, the albedo becomes lower, masked by vegetation, with decreases in temperature. In areas where the degree of desertification was low, the NDVI values were high, whereas the TGSI and albedo values were low to moderate, indicating that the area was normally wet. However, in areas of high desertification, NDVI values were low and the TGSI and albedo values were high, indicating that the area was severely dry. In the past 20 years, NDVI has decreased in the southern part, where TGSI and albedo were increased.
The TWI for the study area was calculated from the watershed area DEM. Higher values for the topographic index were only a reflection of higher order streams. A steeper slope facilitates greater run–off and lower residence time for rainwater, whereas gentle slopes have lower run-off, allowing more time for greater infiltration of the soil by the rainwater. The northeastern section of the study area is characterised by rolling hills with slopes exceeding 8%, with some reaching as high as 26%. The southern section of the study area is characterised by undulating plains and low slopes. It was found that the mountain and forest areas had no or low levels of desertification. We used Enhanced Thematic Mapper plus (ETM+) images from Landsat 7, which were recorded on 16 August 2002. In this year, our results showed mostly dry and drought-ridden areas. We did not fing any other problem with the differences in the atmospheric conditions of ETM and TM (Table 3 and Figure 2).

4.2. DeserTification Accuracy Checking

Two types of accuracy were used in this study: producer accuracy (PA), which corresponds to errors of omission (exclusion), which is the percentage of a given class that is correctly identified on the map, and user accuracy (UA), which corresponds to errors of commission (inclusion), which is the probability that a given pixel will appear on the ground as it has been classified. The majority of desertification map classifications were assessed using reference maps. In addition to using the reference maps, the resulting images were further examined using personal knowledge of the study area. The classification accuracy results exhibited similar patterns of agreement with the desertification image reference points. The range of the agreement was between 73.35% and 98.93% for UA and PA, respectively. This high accuracy suggests a satisfactory agreement between sample control points and images for which desertification has been classified.
The accuracy of the results for 1990, 2000, and 2011 was confirmed using a confusion matrix (Table 5). The classification was satisfactory, with an average accuracy for all three periods of above 0.8, with a highest accuracy and kappa statistic of 0.84 and 0.80, respectively, for 2011. Due to the relatively low quality of the images for 1990, the overall accuracy and kappa statistic were the lowest of the three years at 0.86 and 0.77, respectively. User and producer accuracies were higher for stable classes compared to disturbance classes. Producer accuracy for the no-disturbance classification was high for all three years, ranging from 86.13 to 92.7%. In terms of the user accuracy for severe desertification, 1990 was the highest of the three years at 98.93%. The overall accuracy of the desertification classification using the decision tree classifier was more than 81%, and the overall kappa statistics were as high as 0.82 in 2002.

4.3. Linear Correlation between Desertification Level and Environmental Variables

The linear correlations between the various environmental factors for each desertification level are shown in Table 4. In summary, the measured environmental factors had a linear correlation with changes in desertification. Increasing desertification was characterised by decreasing NDVI and increasing albedo, drought, LST, and TGSI. No correlation was found between NDVI and either albedo or TGSI for any level of desertification. The highest correlations were between TGSI and albedo, PDI and TGSI, and PDI and albedo for all levels of desertification. Strong correlations (0.50–0.83) between NDVI and PDI were found in the non- and low desertification areas. The correlation of TWI with NDVI and PDI for the non- and low desertification areas was 0.15 and 0.58, respectively. Although NDVI is significantly associated with most environmental factors, the spatial heterogeneity and scale dependency of these correlations remain unclear [34].
There was no significant correlation between LST and either albedo or PDI for areas with high and severe desertification in 1990 and 2002, nor between TWI and either NDVI or PDI in areas with high and severe desertification in 1990, 2002, and 2011.
The correlations for the desertification levels varied greatly, especially for NDVI with albedo, drought, and TGSI; NDVI increased while albedo, drought, and TGSI all decreased over time. As NDVI increases, the proportion of cool vegetation to warm soil increases and thermal emissions decrease. The relationship between LST and NDVI has been recognised as an important indicator of evaporative flux and soil moisture [59,60]. Most studies conducted in mid–latitude ecosystems have found a linear decrease in LST as NDVI increases [61].
In 2011, the strongest positive correlations were between LST and both TGSI and PDI for all desertification grades. There was also a positive correlation between LST and albedo in areas of high and severe desertification in 2011, although the relationship was the opposite in the other two years; we thus hypothesise an increase in LST and desertification over the last ten years.
Our results found a higher negative correlation between NDVI and albedo for 2011 compared to 1990. The medium and low albedo in 1990 was the result of low TGSI (clayey silt soil). However, by 2011, this region showed low albedo, a high TGSI value, changed soil particle size, and decreased vegetation cover (Figure 3).
The correlations for TWI varied with desertification level. There was a significant positive correlation between TWI and both NDVI and PDI for each of the three survey years in the areas of non- and low desertification. A comparable correlation, though somewhat lower, was found between elevation and NDVI in areas with severe desertification in 1990 and 2011. The highest correlation between elevation and NDVI was observed in areas of high and severe desertification in 2002 (Table 4, Figure 2 and Figure 3).
Pasture is an important land cover type in the study area. Water and land conservation strategies need a sound knowledge of the land activity in areas under stress. In the study area, herders use the watershed in the summer and move to the warmer mountainside in the winter. Furthermore, many herders move to areas served by rivers and wells (Figure 4).
This seasonal migration has contributed to increased desertification in the study area because grazing pressure is greatest near settlements and water sources. The carrying capacity of pasture is frequently exceeded in areas receiving the heaviest grazing, resulting in changes in plant species composition and increases in soil denudation. Pastureland-based beef farming in Mongolia increased the number of livestock animals during the last period. These cases were affected by the resilience of grassland and by forage use in this area. If this issue continues for a long time, farmers will have to respond the increase desertification in the future. The first issue is land management and the second one is climate change in this area. Land policy and climate change are both direct drivers in this area; it should also be noted that this steady increase in animal production has periodically been interrupted as a result of political changes and policy shifts in Mongolia. Extreme climate events have caused major economic disasters, reflected in the reduction of livestock [62,63]. For example, the amount of drought or severe winter storms closely coincided with severe losses of livestock in Mongolia, where the majority of livelihoods rely on livestock husbandry under extensive systems of production [64].
This study suggests that in Hugnu Khaan the vegetation growth with respect to land surface temperature and drought is more a function of the underlying factors; however, topsoil grain size has a major influence on vegetation growth in the region, and serve desertification levels are observed in the low elevation area. Finally, we compared two kinds of methods, resulting in the MCE method being more clearly accurate than the Decision Tree method. For these reasons, the conclusion is that MCE is based on seven dominant factors of desertification. The main factors of desertification are vegetation degradation, land surface temperature, top soil grain size, elevation, soil moisture, albedo, and drought, so this study is subject to which environmental factor is of important concern in desertification. When there are more related factors at each desertification level, it is necessary to examine the effect of environmental disclosure on desertification.

5. Conclusions

Monitoring the dynamics of desertification and their relationship with climate change and human activity in the region is essential to successful environment rehabilitation. This monitoring research, based on Landsat images, found that the pastureland has experienced a significant increase in desertification between 1990 and 2011, and the relative proportion of the five levels of desertification has changed considerably. The most important resource that has been negatively affected by this stress is natural pasture vegetation. The water supply to pasture and the maintenance of watering points have also suffered damage. Our results also show that desertification and environmental factors exhibit heterogeneity and non–stationary correlations in the study area. The correlations between desertification and environmental factors (both positive and negative) may be caused by the relationship between elevation, climate, and human activity. The areas of lower altitude exhibit high and severe levels of desertification and lower NDVI values due to greater human disturbance, while the higher altitude areas tend to have a higher NDVI. In addition, water meadows are found at lower altitudes, which have a high NDVI and no desertification. Theoretically then, an increase in elevation should be associated with decreasing NDVI. However, our study found the opposite, possibly due to human activity in the area.

Acknowledgments

We thank the editors and anonymous reviewers for their in-depth comments and review, which greatly improved this manuscript. This work was funded by the Korea Meteorological Administration Research and Development Program with a See-At (See+Atmosphere) grant (KMIPA 2015-6140) and supported by a Korea University grant. This study was also out with the support of “Forest Science & Technology Projects (S211214L030200)” provided by Korea Forest Service.

Author Contributions

Munkhnasan Lamchin designed the research; analyzed the data and wrote the paper. All authors read, gave comments and approved the final manuscript.

Conflicts of Interest

The authors declare no conflict of interest.

References

  1. UNCCD (United Nations Convention to Combat Desertification). United Nations Convention to Combat Desertification in Those Countries Experiencing Serious Drought and/or Desertification, Particularly in Africa; UN: Paris, France, 1994. [Google Scholar]
  2. UNCCD (United Nations Convention to Combat Desertification). Recommendations and Conclusions of the African Regional Conference Preparatory to the First Session of the Committee for the Review of the Implementation of the United Nations Convention to Combat Desertification (UNCCD–CRIC1); Secretariat of the Convention to Combat Desertification: Windhoek, Namibia, 2002. [Google Scholar]
  3. Kosmas, C.; Kirkby, M.J.; Geeson, N. Manual on Key Indicators of Desertification and Mapping Environmentally Sensitive Areas to Desertification. Available online: https://www.kcl.ac.uk/projects/desertlinks/downloads/publicdownloads/ESA%20Manual.pdf (accessed on 16 December 2013).
  4. Brandt, J.; Geeson, N.; Imeson, A. A Desertification Indicator System for Mediterranean Europe. Available online: http://www.kcl.ac.uk/projects/desertlinks/downloads/publicdownloads/Towards%20a%20DISME.zip (accessed on 16 December 2013).
  5. Geeson, N.; Brandt, J. State of the art on existing indicators and their use for desertification monitoring and CCD implementation in the northern Mediterranean. In AIDCCD e Active Exchange of Experience on Indicators and Development of Perspectives in the Context of UNCCD; Nucleo Ricerca Desertificazione, University of Sassari: Sassari, Italy, 2005; p. 28. [Google Scholar]
  6. Baartman, J.E.M.; van Lynden, G.W.J.; Reed, M.S.; Ritsema, C.J.; Hessel, R. Desertification and Land Degradation: Origins, Processes, and Solutions—A Literature Review (Series: Scientific Reports. Report Number 4); ISRIC—World Soil Information: Wageningen, The Netherlands, 2007. [Google Scholar]
  7. Sommer, S.; Zucca, C.; Grainger, A.; Cherlet, M.; Zougmore, R.; Sokona, Y.; Hill, J.; Della Peruta, R.; Roehrig, J.; Wang, G. Application of indicator systems for monitoring and assessment of desertification from national to global scales. Land Degrad. Dev. 2011, 22, 184–197. [Google Scholar] [CrossRef]
  8. Dregne, H.; Kassas, M.; Rozanov, B. A new assessment of the world status of desertification. Desertification Control Bull. 1991, 20, 6–18. [Google Scholar]
  9. Kassas, M. Desertification: A general review. J. Arid Environ. 1995, 30, 115–128. [Google Scholar] [CrossRef]
  10. Sivakumar, M.V.K. Interactions between climate and desertification. Agric. For. Meteorol. 2007, 142, 143–155. [Google Scholar] [CrossRef]
  11. Arnalds, A. Desertification in a humid environment: An example from Iceland. In Encyclopedia of Soil Science, 2nd ed.; Lal, R., Ed.; Taylor & Francis: Boca Raton, FL, USA, 2006; p. 6. [Google Scholar]
  12. Liu, Y.; Gao, J.; Yang, Y. A holistic approach towards assessment of severity of land degradation along the Great Wall in northern Shaanxi province, China. Environ. Monit. Assess. 2003, 82, 187–202. [Google Scholar] [CrossRef] [PubMed]
  13. Geist, H.J.; Lambin, E.F. Dynamic causal patterns of desertification. Bioscience 2004, 54, 817–829. [Google Scholar] [CrossRef]
  14. Liu, S.L.; Wang, T. Aeolian desertification from the mid-1970s to 2005 in Otindag Sandy Land, Northern China. Environ. Geol. 2007, 51, 1057–1064. [Google Scholar] [CrossRef]
  15. Shalaby, A.; Tateishi, R. Remote sensing and GIS for mapping and monitoring land cover and land-use changes in the Northwestern coastal zone of Egypt. Appl. Geogr. 2007, 27, 28–41. [Google Scholar] [CrossRef]
  16. Zhang, Y.Z.; Chen, Z.Y.; Zhu, B.Q.; Luo, X.Y.; Guan, Y.N.; Guo, S.; Nie, Y.P. Land desertification monitoring and assessment in Yulin of Northwest China using remote sensing and geographic information systems (GIS). Environ. Monit. Assess. 2008, 147, 327–337. [Google Scholar] [CrossRef] [PubMed]
  17. Hu, G.Y.; Dong, Z.B.; Lu, J.F.; Yan, C.Z. Driving forces responsible for aeolian desertification in the source region of the Yangtze River from 1975 to 2005. Environ. Earth Sci. 2012, 66, 257–263. [Google Scholar] [CrossRef]
  18. Li, J.Y.; Yang, X.C.; Jin, Y.X.; Yang, Z.; Huang, W.G.; Zhao, L.N.; Gao, T.; Yu, H.D.; Ma, H.L.; Qin, Z.H.; et al. Monitoring and analysis of grassland desertification dynamics using Landsat images in Ningxia, China. Remote Sens. Environ. 2013, 138, 19–26. [Google Scholar] [CrossRef]
  19. Xue, Z.J.; Qin, Z.D.; Li, H.J.; Ding, G.W.; Meng, X.W. Evaluation of aeolian desertification from 1975 to 2010 and its causes in northwest Shanxi Province, China. Glob. Planet Chang. 2013, 107, 102–108. [Google Scholar] [CrossRef]
  20. Salvati, L.; Zitti, M.; Ceccarelli, T. Integrating economic and environmental indicators in the assessment of desertification risk: A case study. Appl. Ecol. Environ. Res. 2008, 6, 129–138. [Google Scholar] [CrossRef]
  21. Ding, H.; Chen, J.; Wang, G. A model for desertification evolution employing GIS with cellular automata. In Proceedings of the International Conference on Computer Modeling and Simulation, Macau, China, 20–22 February 2009; pp. 324–328. [Google Scholar]
  22. Wang, T.; Wu, W.; Wang, X.Z. Remote sensing monitoring and assessing sandy desertification: An example from the sandy desertification region of northern China. Quat. Sci. 1998, 2, 108–118. (In Chinese) [Google Scholar]
  23. Prince, S.D. Spatial and temporal scales for detection of desertification. In Global Desertification: Do Humans Cause Deserts? Reynolds, J.F., Stafford Smith, D.M., Eds.; Dahlem University Press: Berlin, Germany, 2002; pp. 23–41. [Google Scholar]
  24. Asner, G.P.; Heidebrecht, K.B. Desertification alters regional ecosystem—Climate interactions. Glob. Chang. Biol. 2005, 11, 182–194. [Google Scholar] [CrossRef]
  25. Veron, S.R.; Paruelo, J.M.; Oesterheld, M. Assessing desertification. J. Arid Environ. 2006, 66, 751–763. [Google Scholar] [CrossRef]
  26. Hanafi, A.; Jauffret, S. Are long-term vegetation dynamics useful in monitoring and assessing desertification processes in the arid steppe, southern Tunisia. J. Arid Environ. 2008, 72, 557–572. [Google Scholar] [CrossRef]
  27. Holm, A.M.; Cridland, S.W.; Roderick, M.L. The use of time-integrated NOAA NDVI data and rainfall to assess landscape degradation in the arid shrubland of Western Australia. Remote Sens. Environ. 2003, 85, 145–158. [Google Scholar] [CrossRef]
  28. Evans, J.; Geerken, R. Discrimination between climate and human-induced dryland degradation. J. Arid Environ. 2004, 57, 535–554. [Google Scholar] [CrossRef]
  29. Geerken, R.; Ilaiwi, M. Assessment of rangeland degradation and development of a strategy for rehabilitation. Remote Sens. Environ. 2004, 90, 490–504. [Google Scholar] [CrossRef]
  30. Wessels, K.J.; Prince, S.D.; Frost, P.E.; Van Zyl, D. Assessing the effects of human-induced land degradation in the former homelands of northern South Africa with a 1 km AVHRR NDVI time-series. Remote Sens. Environ. 2004, 91, 47–67. [Google Scholar] [CrossRef]
  31. Herrmann, S.M.; Anyamba, A.; Tucker, C.J. Recent trends in vegetation dynamics in the African Sahel and their relationship to climate. Glob. Environ. Chang. 2005, 15, 394–404. [Google Scholar] [CrossRef]
  32. Wessels, K.J.; Prince, S.D.; Malherbe, J.; Small, J.; Frost, P.E.; Van Zyl, D. Can human-induced land degradation be distinguished from the effects of rainfall variability? A case study in South Africa. J. Arid Environ. 2007, 68, 271–297. [Google Scholar]
  33. Xu, D.; Kang, X.; Qiu, D.; Zhuang, D.; Pan, J. Quantitative assessment of desertification using Landsat data on a regional scale—A case study in the Ordos Plateau, China. Sensors 2009, 9, 1738–1753. [Google Scholar] [CrossRef] [PubMed]
  34. Lamchin, M.; Lee, Y.L.; Lee, W.K.; Lee, E.J.; Kim, M.; Lim, C.H.; Choi, H.A.; Kim, S.R. Assessment of land cover change and desertification using remote sensing technology in a local of Mongolia. Adv. Space Res. 2016, 57, 64–77. [Google Scholar] [CrossRef]
  35. Xiao, J.; Shen, Y.; Tateishi, R.; Bayaer, W. Development of topsoil grain size index for monitoring desertification in arid land using remote sensing. Int. J. Remote Sens. 2006, 27, 2411–2422. [Google Scholar] [CrossRef]
  36. Jackson, R.D.; Idso, S.B.; Otterman, J. Surface albedo and desertification. Science 1975, 189, 1012–1015. [Google Scholar] [CrossRef] [PubMed]
  37. Li, S.G.; Harazono, Y.; Oikawa, T.; Zhao, H.L.; He, Z.Y.; Chang, X.L. Grassland desertification by grazing and the resulting micrometeorological changes in Inner Mongolia. Agr. For. Meteorol. 2000, 102, 125–137. [Google Scholar]
  38. Riobinove, C.J.; Chavez, P.S.; Gehring, D.; Holmgren, R. Arid land monitoring using Landsat albedo difference images. Remote Sens. Environ. 1981, 11, 133–156. [Google Scholar] [CrossRef]
  39. Chavez, P.S., Jr. An improved dark-object subtraction technique for atmospheric scattering correction of multispectral data. Remote Sens. Environ. 1988, 24, 459–479. [Google Scholar] [CrossRef]
  40. Chavez, P.S., Jr. Image-based atmospheric corrections—Revisited and improved. Photogramm. Eng. Remote Sens. 1996, 62, 1025–1036. [Google Scholar]
  41. Musick, H.B. Temporal change of Landsat MSS albedo estimates in arid rangeland. Remote Sens. Environ. 1986, 20, 107–120. [Google Scholar] [CrossRef]
  42. Liang, S.L. Narrowband to broadband conversions of land surface albedo algorithms. Remote Sens. Environ. 2000, 76, 213–238. [Google Scholar] [CrossRef]
  43. Smith, R.B. The Heat Budget of the Earth’s Surface Deduced from Space. 2010. Available online: http://yceo.yale.edu/sites/default/files/files/Surface_Heat_Budget_From_Space.pdf (accessed on 10 April 2017).
  44. Ghulam, A.; Qin, Q.; Zhan, Z. Designing of the perpendicular drought index. Environ. Geol. 2007, 52, 1045–1052. [Google Scholar] [CrossRef]
  45. Gessler, P.E.; Moore, I.D.; McKenzie, N.J.; Ryan, P.J. Soil-landscape modeling and spatial prediction of soil attributes. Int. J. Geogr. Inf. Syst. 1995, 9, 421–432. [Google Scholar] [CrossRef]
  46. Moore, I.D.; Gessler, P.E.; Nielsen, G.A.; Peterson, G.A. Soil attribute prediction using terrain analysis. Soil Sci. Soc. Am. J. 1993, 57, 443–452. [Google Scholar] [CrossRef]
  47. Arvidson, T.; Landsat Project Science Office, Goddard Space Flight Center, Washington, DC, USA. Personal communication, 2002.
  48. Landsat Project Science Office. Landsat 7 Science Data User’s Handbook. Available online: https://landsat.gsfc.nasa.gov/wp-content/uploads/2016/08/Landsat7_Handbook.pdf (accessed on 10 April 2017).
  49. Saaty, T.L. A scaling method for priorities in hierarchical structures. J. Math. Physiol. 1977, 15, 234–281. [Google Scholar] [CrossRef]
  50. Hossain, M.S.; Rahman, M.F.; Thompson, S.; Nabi, M.R.; Kibria, M.M. Climate change resilience assessment using livelihood assets of coastal fishing community in Nijhum Dwip, Bangladesh. Sci. Technol. 2013, 21, 397–422. [Google Scholar]
  51. Hossain, M.S.; Das, N.G. GIS-based multi-criteria evaluation to land suitability modelling for giant prawn (Macrobrachium rosenbergii) farming in Companigonj Upazila of Noakhali, Bangladesh. Comput. Electron. Agr. 2010, 70, 172–186. [Google Scholar] [CrossRef]
  52. Eastman, J.R.; Kyem, P.A.K.; Toledano, J.; Jin, W. United Nations Institute for Training and Research, Explorations in Geographic Information Systems Technology; The Clarks Labs for Cartographic Technology and Geographic Analysis, Clark University: Worcester, MA, USA, 1993. [Google Scholar]
  53. Wang, X.D.; Zhong, X.H.; Liu, J.G.; Wang, Z.Y.; Li, M.H. Regional assessment of environmental vulnerability in the Tibetan Plateau. J. Arid Environ. 2008, 72, 1929–1939. [Google Scholar] [CrossRef]
  54. Liu, C.; Frazier, P.; Kumar, L. Comparative assessment of the measures of thematic classification accuracy. Remote Sens. Environ. 2007, 107, 606–616. [Google Scholar] [CrossRef]
  55. Stehman, S.V. Selecting and interpreting measures of thematic classification accuracy. Remote Sens. Environ. 1997, 62, 77–89. [Google Scholar] [CrossRef]
  56. Foody, G.M. Status of land covers classification accuracy assessment. Remote Sens. Environ. 2002, 80, 185–201. [Google Scholar] [CrossRef]
  57. Pontius, R.G.; Millones, M. Death to kappa: Birth of quantity disagreement and allocation disagreement for accuracy assessment. Int. J. Remote Sens. 2011, 32, 4407–4429. [Google Scholar] [CrossRef]
  58. Tian, F.; Qiu, G.Y.; Yang, Y.H.; Xiong, Y.J.; Wang, P. Studies on the relationships between land surface temperature and environmental factors in an inland river catchment-based on geographically weighted regression and MODIS data. IEEE J. Sel. Top. Appl. 2012, 5, 687–698. [Google Scholar] [CrossRef]
  59. Goetz, S.J. Multi-sensor analysis of NDVI surfaces temperature and biophysical variables at a mixed grassland site. Int. J. Remote Sens. 1997, 18, 71–94. [Google Scholar] [CrossRef]
  60. Kustas, W.P.; Moran, M.S.; Humes, K.S.; Stannard, D.L.; Pinter, P.; Hipps, L.E.; Swiatek, E.; Goodrich, D.C. Surface energy balance estimates at local and regional scales using optical remote sensing and atmospheric data collected over semiarid rangelands. Water Resour. Res. 1994, 30, 1241–1259. [Google Scholar] [CrossRef]
  61. Sandholt, I.; Rasmussen, K.; Andersen, J. A simple interpretation of the surface temperature/vegetation index space for assessment of surface moisture status. Remote Sens. Environ. 2002, 79, 213–224. [Google Scholar] [CrossRef]
  62. Shi, Y.; Shen, Y.; Kang, E.; Li, D.; Ding, Y.; Zhang, G.; Hu, R. Recent and future climate change in Northwest China. Clim. Chang. 2007, 80, 379–393. [Google Scholar] [CrossRef]
  63. Qian, W.; Lin, X. Regional trends in recent precipitation indices in China Meteorol. Atmos. Phys. 2005, 90, 193–207. [Google Scholar] [CrossRef]
  64. Retzer, V.; Nadrowski, K.; Miehe, G. Variation of precipitation and its effect on phytomass production and consumption by livestock and large wild herbivores along an altitudinal gradient during a drought, South Gobi, Mongolia. J. Arid Environ. 2006, 66, 135–150. [Google Scholar] [CrossRef]
Figure 1. Flowchart of study.
Sustainability 09 00581 g001
Figure 2. Statistics of the desertification area in 1990, 2002, and 2011. “non”, “low”, “medium”, “high”, and “severe” are used to represent desertification grades for short.
Sustainability 09 00581 g002
Figure 3. Distribution of desertification and environmental variables.
Sustainability 09 00581 g003
Figure 4. Topographic wetness index.
Sustainability 09 00581 g004
Table 1. The relative importance of two criteria [50].
1/91/81/71/61/51/41/31/2123456789
ExtremelyVery stronglyStronglyModeratelyEquallyModeratelyStronglyVery stronglyExtremely
Less ImportantMore Important
Table 2. A pairwise comparison matrix for assessing the relative importance of different criteria for desertification (numbers show the rating of the row factor relative to the column factor).
Assets
NDVILSTTGSIAlbedoElevationPDITWIWeight
NDVI11/224/51/12/51/50.1032
LST511/51/21/231/20.3688
TGSI61/2121/121/20.0704
Albedo1/51/21/211/11/51/20.0387
Elevation33/52/51/511/530.0758
PDI551/22/21/111/20.2197
TWI2/522221/210.1234
Consistency ratio (CR): 0.0044
Table 3. The maximum values of the measured environmental variables for each year.
Variables199020022011
NDVI0.710.510.74
Albedo0.590.690.64
TGSI0.360.160.02
LST30.632.231.2
PDI0.360.790.64
Table 4. Correlations between environmental variables for the five desertification levels (Correlation coefficient-R value).
CorrelationNonLowMediumHighSevere
1990
NDVI and TGSI−0.20−0.38−0.38−0.57−0.28
NDVI and Albedo−0.06−0.21−0.34−0.58−0.34
Albedo and TGSI0.770.720.450.690.33
NDVI and LST0.29−0.61−0.04−0.030.10
NDVI and PDI0.830.490.15−0.66−0.66
PDI and TGSI0.550.400.520.870.87
LST and TGSI0.220.310.240.11−0.07
Elevation and NDVI−0.25−0.080.070.090.24
Albedo and PDI−0.100.710.120.970.50
Albedo and LST0.150.370.180.05−0.04
PDI and LST0.560.25−0.080.05−0.13
TWI and NDVI0.320.190.05−0.01−0.04
TWI and PDI0.340.15−0.03−0.03−0.00
2002
NDVI and TGSI−0.53−0.30−0.25−0.17−1.00
NDVI and Albedo−0.39−0.57−0.30−0.46−0.46
Albedo and GSI0.920.730.480.570.07
NDVI and LST−0.22−0.26−0.18−0.09−0.02
NDVI and PDI0.330.58−0.00−0.34−0.38
PDI and TGSI0.580.390.560.850.81
LST and TGSI0.470.270.10−0.030.04
Elevation and NDVI0.02−0.260.260.490.55
Albedo and PDI0.800.830.950.960.98
Albedo and LST0.450.150.000.02−0.04
PDI and LST0.300.00−0.010.02−0.02
TWI and NDVI0.380.350.04−0.00−0.04
TWI and PDI0.360.300.100.00−0.00
2011
NDVI and TGSI−0.34−0.51−0.37−0.41−0.36
NDVI and Albedo−0.12−0.20−0.25−0.30−0.31
Albedo and TGSI0.800.700.390.380.33
NDVI and LST0.08−0.040.05−0.02−0.14
NDVI and PDI0.750.56−0.04−0.39−0.54
PDI and TGSI0.350.250.520.730.84
LST and TGSI0.450.160.030.160.33
Elevation and NDVI−0.17−0.100.120.270.33
Albedo and PDI−0.010.160.330.480.64
Albedo and LST0.090.020.070.260.44
PDI and LST0.390.070.110.420.55
TWI and NDVI0.340.220.08−0.04−0.01
TWI and PDI0.350.230.030.01−0.01
Table 5. Confusion matrix and accuracy assessment for desertification in 1990, 2002, and 2011.
Desertification1990
GradeNoLowMediumHighSevereTotalProducer AccuracyUser Accuracy
No871820010792.07%86.91%
Low1488100011277.39%79.46%
Medium09894010280.58%81.37%
High002852411194.05%85.58%
Severe00012829487.73%98.93%
Total101115103101106526
Overall accuracy 0.86, kappa statistic 0.77.
Desertification2002
GradeNoLowMediumHighSevereTotalProducer AccuracyUser Accuracy
Non931210010786.13%81.30%
Low889150011276.51%78.57%
Medium014835010286.40%87.25%
High004951311184.15%76.57%
Severe0001939473.35%87.23%
Total101115103101106526
Overall accuracy 0.81, kappa statistic 0.82.
Desertification2011
GradeNoLowMediumHighSevereTotalProducer AccuracyUser Accuracy
No92960010791.08%85.98%
Low991111011279.13%81.25%
Medium012826210279.61%80.39%
High034901411189.10%81.08%
Severe0004909484.90%95.74%
Total101115103101106526
Overall accuracy 0.84, kappa statistic 0.80.

