1. Introduction
China, surpassing the United States, is the largest greenhouse gas (GHG) emitter in the world [
1,
2]. GHG emissions are mainly associated with human activities [
3]. The impacts of GDP increase, urbanization processes, population growth, and energy consumption have important relationships with carbon emissions [
4,
5], but some studies state that population growth has been statistically insignificant for China [
6,
7]. Fossil fuel combustion produced the most CO
2 emissions (90%), and has simultaneously caused serious environmental issues in China [
8]. China has been suffering from heavy air pollution in recent years, especially in the northern and eastern urban areas, including the Beijing-Tianjing-Hebei region and the Yangtze River Delta region [
9,
10]. Hence, China is now facing tremendous pressure to dually mitigate GHG emissions and air pollutant emissions [
11].Co-control measures for improving air quality and mitigating GHG emissions have been a focal point for China and other countries [
12,
13].
The electric power sector has a significant effect on global CO
2 emission growth and local environment deterioration [
14,
15]. The extent of urbanization and industrialization in China has been massive ever since these processes started to accelerate in the 1980s. Now, more than half of the population lives in cities, and the rapid growth of urban areas has been supported by more and more products and services from the industrial sector [
16]. China’s industrial sector consumes approximately 70% of the total energy production and contributes more than 70% of the amount of GHG emissions [
17]; this sector is also the largest producer of air pollutants, and it produced 88.2% of sulfur dioxide (SO
2), 67.6% of nitrogen oxides (NO
x), and 81.3% of particulate matter (PM) emissions in the year 2014 [
18]. Meanwhile, the coal-fired power (also called thermal power) industry is the biggest contributor to GHGs and air pollutants in the whole industrial sector [
19], and it accounts for about 40% of the total carbon dioxide (CO
2) and 60% of the total SO
2 emissions in China [
20]. In China, the total national generation of electricity was 5604.5 billion kWh in 2014 (accounting for 24% of the world’s total generation), and 3951.0 billion kWh was generated by coal-fired power plants [
21,
22]. Around 90% of the total electricity was used in cities in 2014, where 87.4% was consumed by the industrial sector for support of industrial and urban development [
16]. Coal made up approximately 78% of the primary energy production in 2014, and the coal used for power generation accounted for approximately 50% of the total coal consumption in China in 2013 [
23,
24,
25]. Consequently, huge amounts of GHG and air pollution emissions are produced by the generation of electricity and heat power [
26,
27].
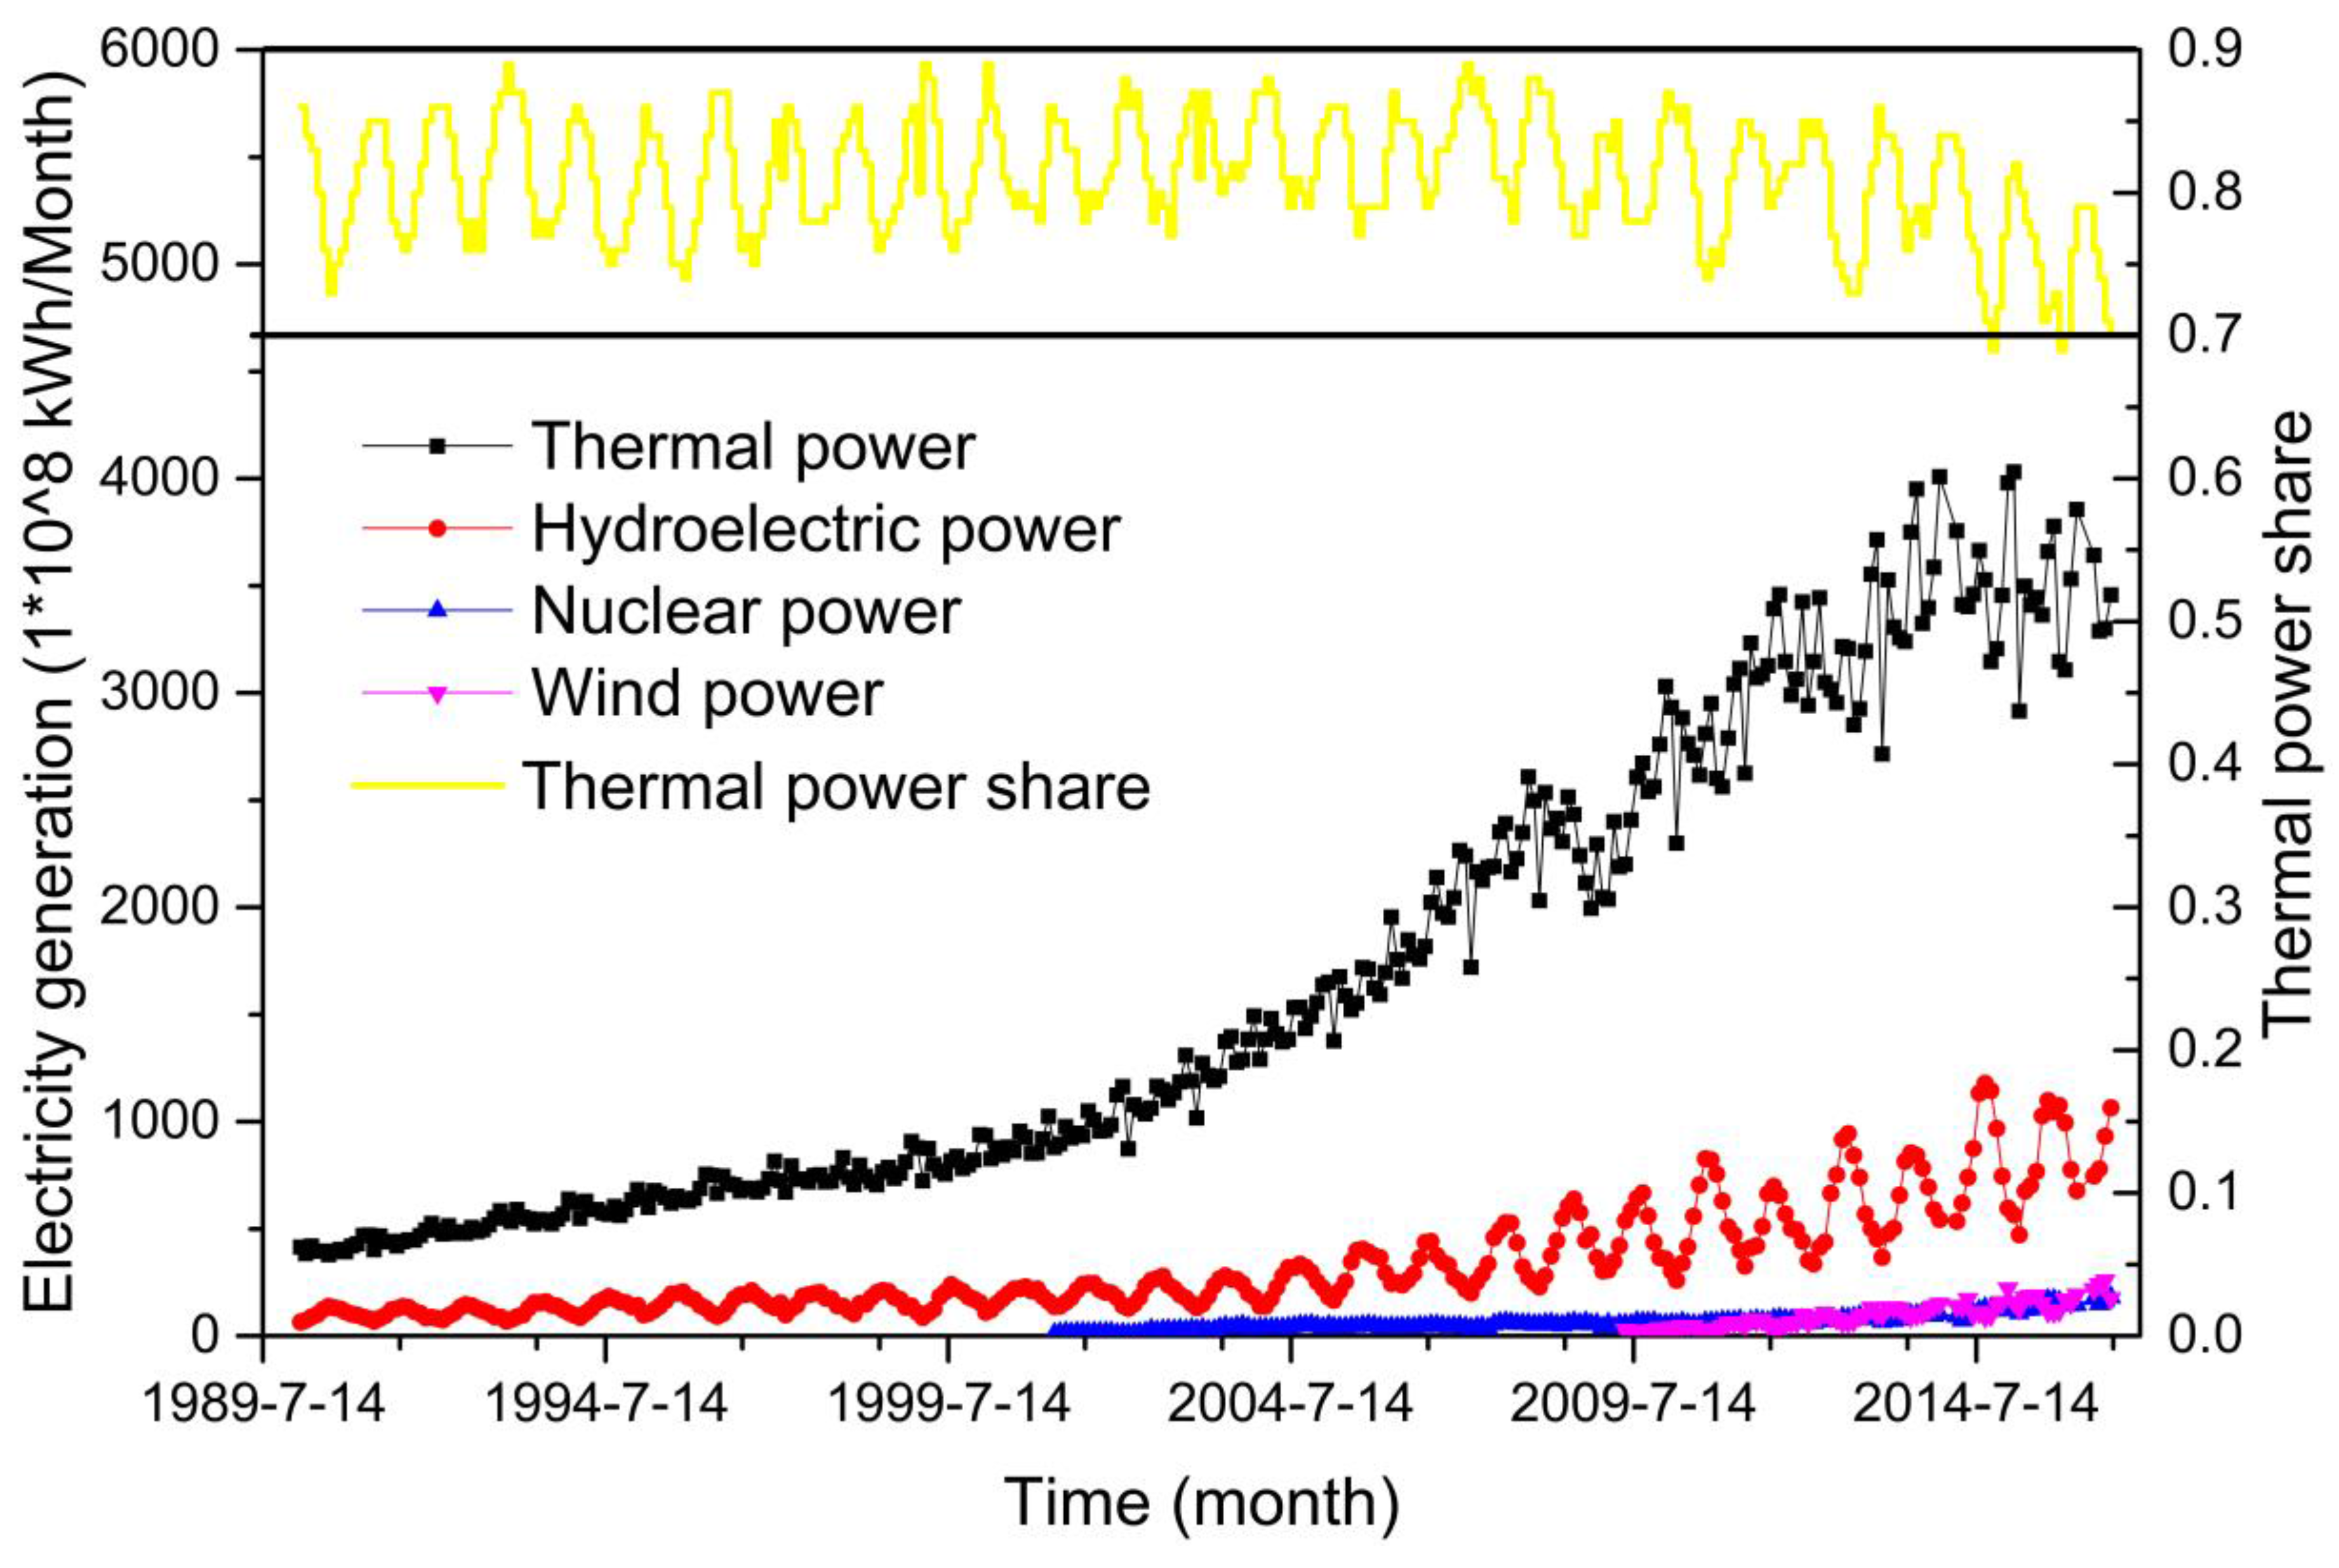
As shown in
Figure 1, electricity generation has maintained a steady rate of growth because of the rapid urbanization and economic development in China from 1989 to 2015 [
28]. Even in present times, the generation of electricity has shown little decrease since 2014, and the share of electricity generated by thermal power was still as high as 70% in 2015 [
28,
29]. The main fossil fuels for electricity and thermal plants include coal, oil, and natural gas. However, the power generation from coal-fired power plants account for 70.5% of the national electricity generation in 2014 [
30]. According to our survey, most of China’s newly built power plants in 2014 and 2015 are all coal-fired plants with large generation capacities (over 300 MW) [s31]. Therefore, we focused our work on the newly-built coal-fired power plants, and looked for solutions to reduce CO
2 and air pollutant emissions.
End-of-pipe reduction measures used to control emissions are important for coal-fired power plants [
32]. The Chinese government has issued a series of policies to control air pollution, improve energy efficiency, and reduce CO
2 emissions since the 1980s, and in particular, huge efforts have been put forth in regards to the coal-fired power plants [
31,
33,
34]. With the implementation of these policies, most coal-fired power plants have established end-of-pipe treatment measures to reduce pollution emissions [
35,
36]. In the 13th Five-Year Plan for national development, a CO
2 reduction target was given for large power plants that states that CO
2 emissions should be controlled under the level of 550 g/kWh [
37].One study shows that, compared with other sectors, the contribution of end-of-pipe reduction measures is the largest in the electric sector [
38].
Since 1995, the Intergovernmental Panel on Climate Change (IPCC) first stated co-benefits in its second assessment report [
39], co-benefits have been used in academic studies and policy documents [
40,
41].Co-benefit analysis via models (e.g., Greenhouse gas-Air pollution Interactions and Synergies (GAINS) model, Computable General Equilibrium (CGE) model, and other models) and policy scenario analysis are widely used tools in top-down studies [
42,
43,
44]. Moreover, some bottom-up studies can also use models based on complex technologies (e.g., Long-range Energy Alternatives Planning System (LEAP) model) to evaluate industrial and regional co-benefits [
45,
46]. Inevitably, fossil fuel consumption will lead to certain amounts of air pollution and CO
2 emissions [
47,
48], and it is now recognized that energy saving and air pollution control measures can have co-benefits in terms of cutting air pollutants and carbon emissions [
49,
50]. Therefore, understanding the synergy and co-effects of air pollutant and GHG emission reduction measures is an interesting research topic [
51,
52]. Past research has even yielded some predictions about the connections between air pollution and climate change based on analyses of emission reduction measures, environmental policies, and socio-economic conditions [
41,
53]. However, it is difficult to precisely verify the synergistic effects of carbon and air pollution reduction measures just through the application of such traditional top-down methods to coal-fired power plants in China.
In order to quantify the co-benefits of air pollution control and CO
2 reduction measures, this paper adopts a bottom-up method that involves the collection of data at the generator unit level for all newly built coal-fired power plants in China in 2014 and 2015 (i.e., 39 plants). The utilized technologies for the control of air pollutants may lead to co-effects on CO
2 emissions [
54]. Currently, there is a widely held viewpoint that co-benefits of air pollutant reductions can be achieved among different pollutants in the process of implementing pollution controls in plants [
55,
56], but fewer studies with bottom-up research methods have so far shown that there are specific co-effects for carbon emissions and air pollutants simultaneously when undertaking measures for air pollutant reductions in the new plants [
57,
58,
59]. Therefore, it is important to understand the synergistic connections between air pollutants (i.e., SO
2, NO
x, PM) and CO
2 emissions, and this was accomplished in this study through a quantitative assessment of China’s new coal-fired power plants.
2. Methods and Materials
Eighty-three generator units for a total of 39 coal-fired power plants built in 2014 and 2015 were selected as the research samples. The focus of this study was on the end-of-pipe pollution reduction measures employed by these power plants and the corresponding co-effects on local air pollutant and GHG emissions. The target air pollutants included SO
2, NO
x, and PM, and the target GHG was CO
2. The method used to analyze the synergistic effects is described in the following three subsections.
Section 2.1 presents the method for calculating the production of SO
2, NO
x, PM, and CO
2.
Section 2.2 presents the method for obtaining the reduction of one pollutant from the direct effects and the indirect effects for the other pollutants.
Section 2.3 describes the way we evaluated the coefficients of the co-effects made by different reduction measures.
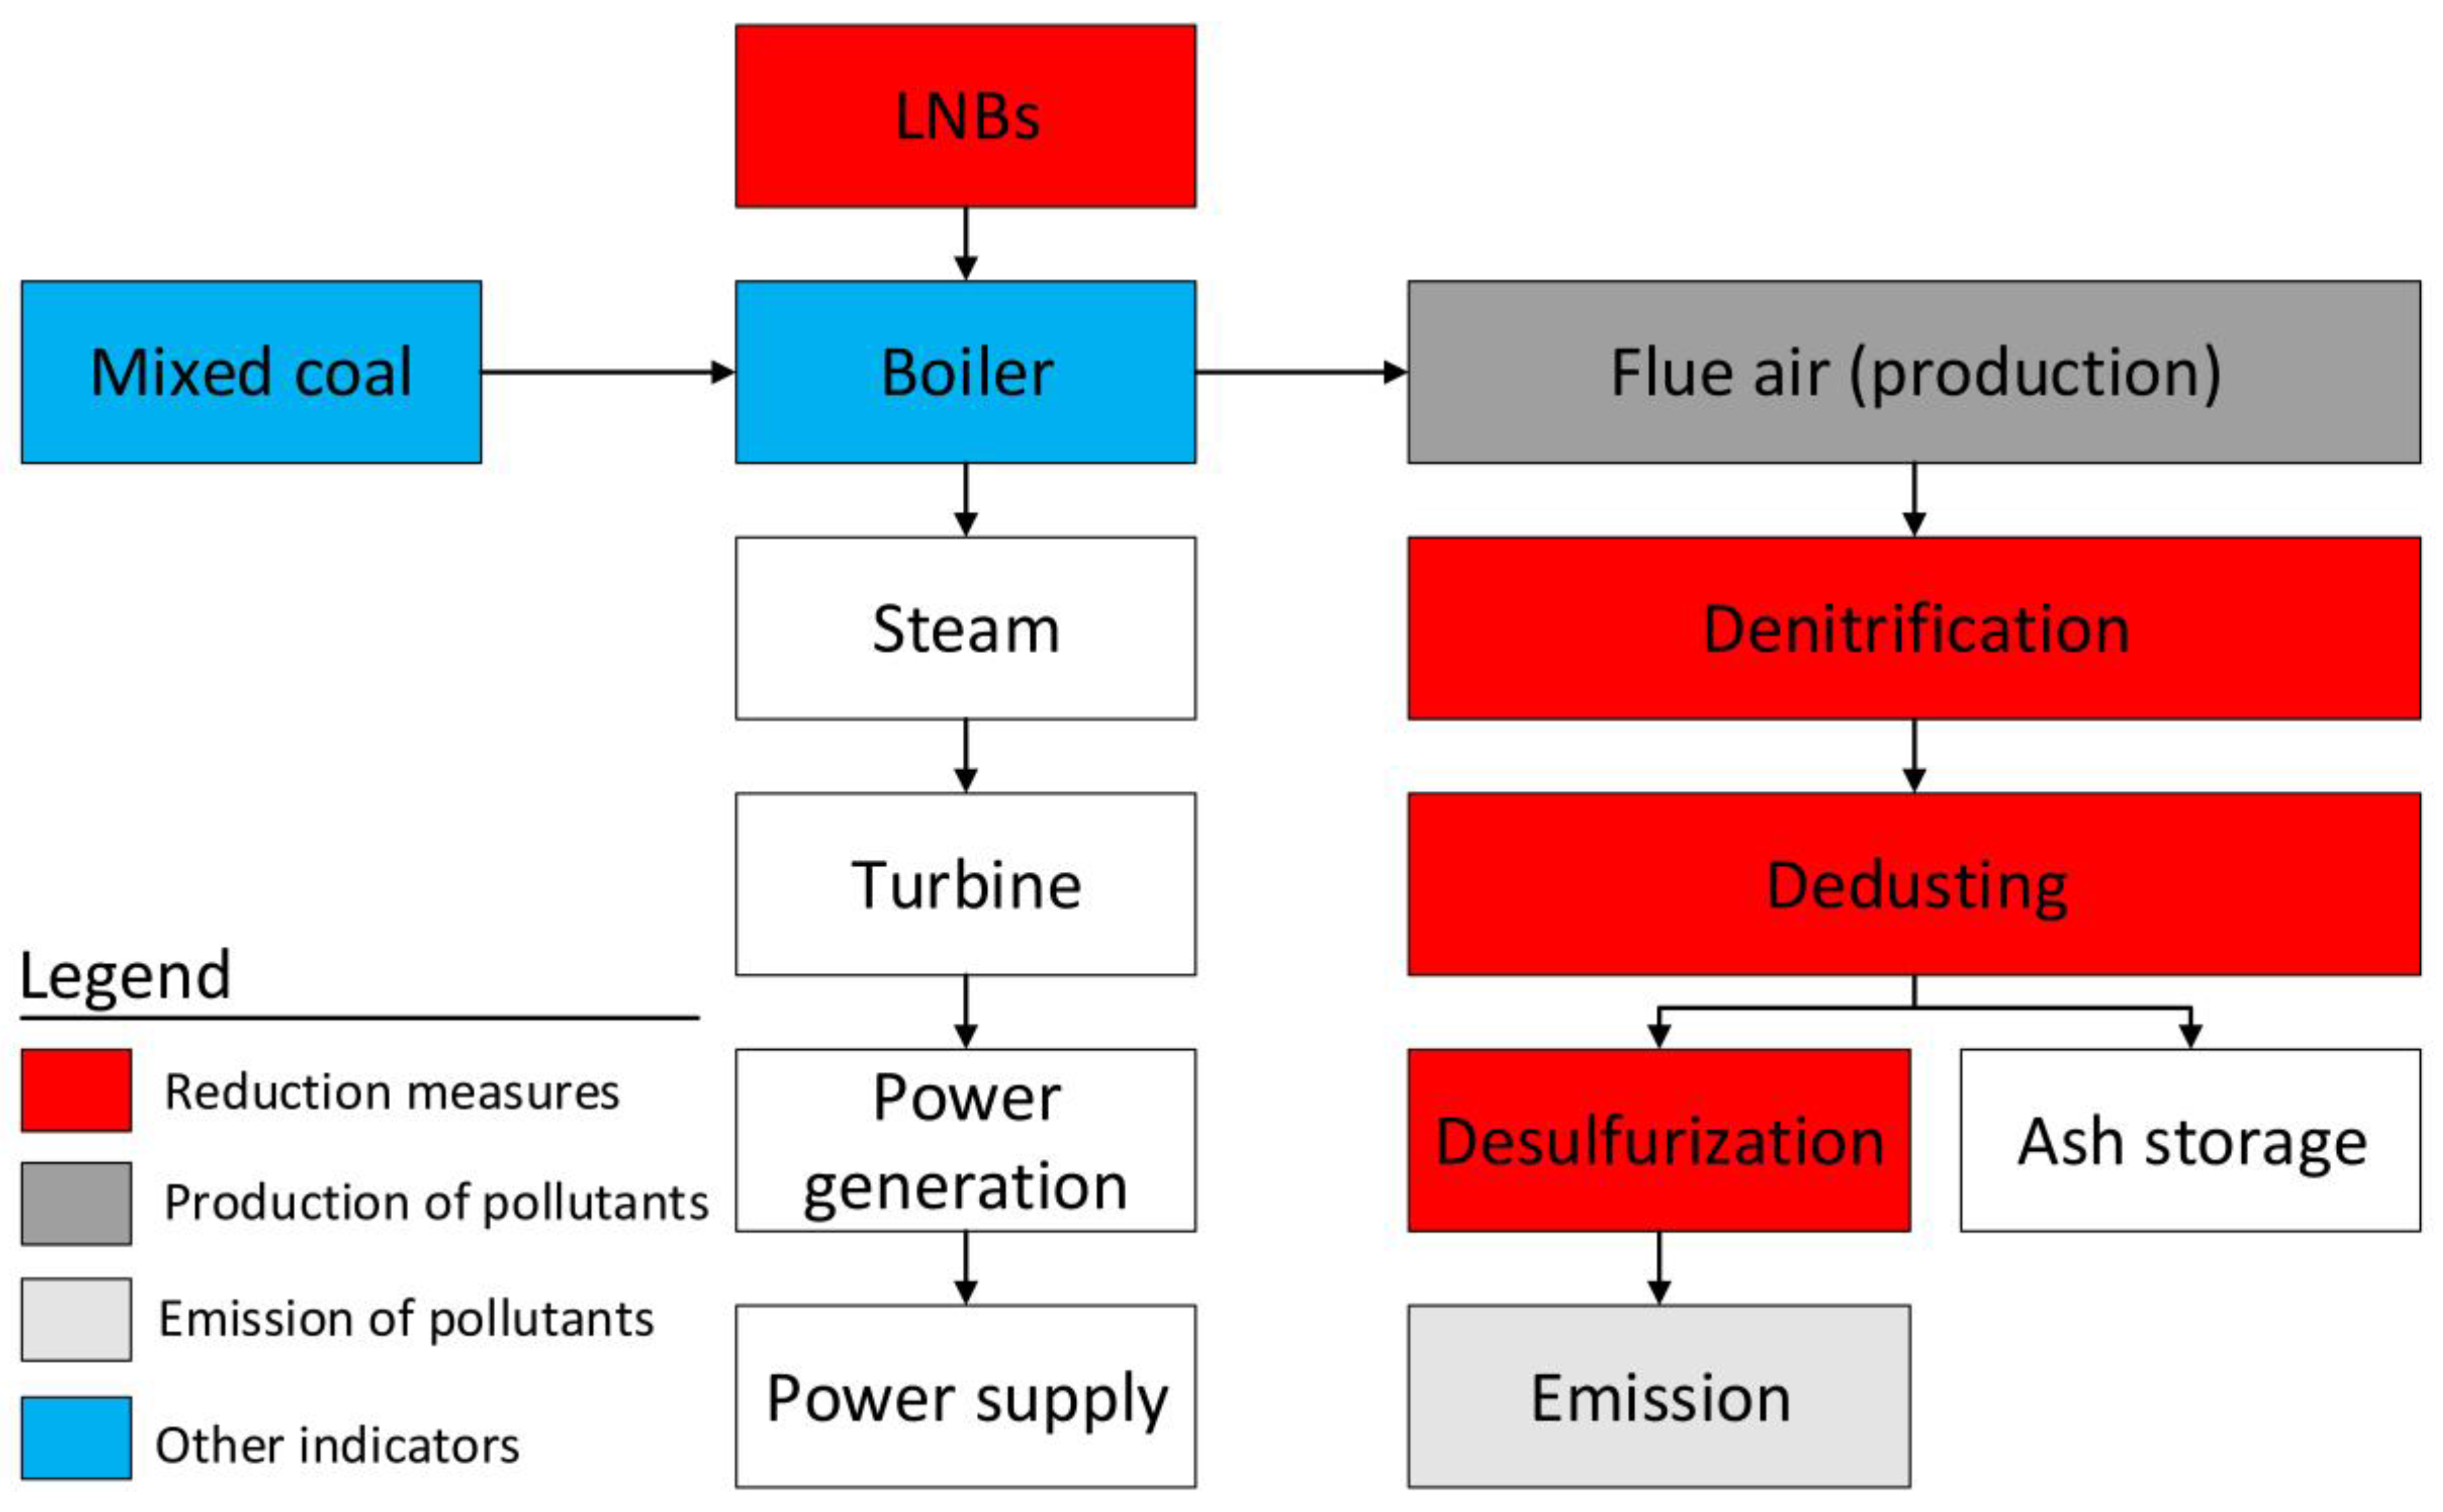
Figure 2 shows the processes of power generation and pollutant control measures in selected coal-fired power plants analyzed in this study.
2.1. Method for Calculating Emissions
The equation for calculating SO
2 production is as follows [
60]:
where
is the production of sulfur dioxide (tons/year), B is the fuel consumption (tons/year), S is St.ar,
q is the heat loss for incomplete combustion in the boiler (
q = 2), 64 is the relative molecular mass of SO
2, 32 is the relative molecular mass of
S, and
k is the proportion of converting sulfur in fuel to SO
2 (
k = 90%).
The equation for calculating NO
x production is as follows [
60]:
where
is the production of nitrogen oxides (tons/year), B is the fuel consumption (tons/year),
is the efficiency of converting NO
x to NO
2 (
= 70%), and
N is Nar. This paper uses
to present the production of NO
x.
The equation for calculating PM production is as follows [
60]:
where
is the production of PM (tons/year),
A is Aar,
q is the heat loss for incomplete combustion in the boiler (
q = 2),
Q is the Qnet.ar of fuel (kJ/kg), and
is the fly ash share in flue gases (
a = 70%).
The equation for calculating CO
2 production is as follows [
61]:
where
is the production of carbon dioxide (tons/year),
C is carbon content (t c/TJ),
O is the oxidation rate of carbon, 44 is the relative molecular mass of CO
2, and 12 is the relative molecular mass of
C.
2.2. Method for Calculating Synergistic Emission Reductions
Pollution control measures can reduce the emissions of specific target pollutants, and at the same time, they can also have co-effects on other air pollutants and CO
2 emissions. In particular, some adsorbents used for the chemical reactions driving the reductions in target pollutants have direct co-effects on other pollutant emissions (
Table 1). CO
2 can also be indirectly produced because of the electricity consumed during the application of each measure. Therefore, the co-effects discussed in this paper refer to the total direct effects and indirect effects on emissions.
For the process of desulfurization, the calculation equation is as follows:
where
is the reduction of SO
2 by desulfurization attachments, and
is the reduction rate for desulfurization attachments.
The oxidation reaction equations of limestone (the main ingredient being CaCO
3) or slaked lime (the main ingredient being Ca(OH)
2) and SO
2 are as follows [
62,
63]:
Direct co-effects of desulfurization are calculated as:
where
represents the direct CO
2 emissions for using limestone as an absorbent in desulfurization, 44 is the relative molecular mass of CO
2, and 64 is the relative molecular mass of SO
2.
Direct co-effects of the desulfurization methods involve the synergistic reduction of PM:
where
is the synergistic reduction rate of PM for desulfurization.
Indirect co-effects of desulfurization are calculated as:
where
represents the indirect emissions from operating the desulfurization attachments (tons/year),
is the electricity consumption share of the total generation (as a percentage),
P is the total electricity generation (which is simplified in the equation),
represents air pollutant and GHG emissions, and i represents SO
2, NO
x, PM, and CO
2.
For the process of denitrification, the calculation equation is:
where
is the reduction of NO
x by the denitrification attachments, and
is the reduction rate for the denitrification attachments.
When urea is used as an adsorbent, the reaction equation of urea and NO
x is as follows [
64]:
When use liquid ammonia as an adsorbent, the equation is as follows [
64]:
Where NO can be oxidized to NO
2:
Direct co-effects of denitrification are calculated as:
where
represents the direct CO
2 emissions for the use of urea as an absorbent during denitrification,
is the reduction rate of the denitrification attachments, 44 is the relative molecular mass of CO
2, 46 is the relative molecular mass of NO
2, and
is the balancing coefficient of the reaction equation.
Indirect co-effects of denitrification are the same as those of desulfurization:
For the process of dedusting, the calculation equation is:
where
is the reduction of PM by the denitrification attachments and
is the reduction rate of the denitrification attachments.
Dedusting technologies do not have direct effects on the SO
2, NO
x, and CO
2, and indirect co-effects are the same as those for desulfurization. The calculation formula is:
The total reduction, which includes direct effects and indirect effects, is , where I is S, N, and P as above, and these represent different measures for reducing SO2, NOx, and PM. The value i represents SO2, NOx, PM, and CO2. The value is the direct effect of pollutant i in the reduction measure I, while is the indirect effect.
The FGD in
Table 1 is flus-gas desulfurization; CFB is circulating fluidized bed boiler; SCR is selective catalytic reduction; and SNCR is the selective non-catalytic reduction; LNBs is low-NOx burners; EP is electrostatic precipitation.
2.3. Method for Deriving Synergistic Coefficients
In order to quantify the degree of co-effects for the different measures used for pollution control in the sample coal-fired power plants, we adopted the equation for pollutant reduction cross-elasticity (
), which has been used for assessing the variation between two pollutants [
49]. In accordance with this method, we defined CI as the synergistic coefficient of the co-effects, and the variation of each pollutant is presented as RI and RI
′ which refer to the direct reduction and indirect reduction, respectively (the term I refers to the different reduction measures). The relevant equations are as follows:
Take desulfurization measures as an example, where is the synergistic coefficient of pollutant i according to the targeted reduction of SO2. is the co-reduction of pollutant i, is the reduction of SO2, is the production of pollutant i, is the production of SO2, and i represents SO2, NOx, PM, and CO2. In the same way, is the synergistic coefficient of the denitrification measures, and is the synergistic coefficient of the dedusting measures.
2.4. Data Collection Method
This research analyzed the co-effects on air pollutants and CO2 emissions achieved through implementing end-of-pipe pollution reduction measures in China’s newly built coal-fired power plants. We used a bottom-up approach to collect the data from all newly built coal-fired power plants in 2014 and 2015, and the data were derived from Environmental Impact Assessment (EIA) reports. Research samples included 83 units of electricity generation with a generation capacity ranging from 300 MW to 1000 MW. Normally, the energy efficiency of units that have a larger capacity is higher than that of other units that have a smaller generation capacity.
The fuel used in the coal-fired power plants is a mixed coal product, which contains soft coal, lignite, anthracite, and washed coal. Since the proportion of coal fuel varies greatly, and in one plant, the proportion of coal fuel even changed through time, it was very difficult to obtain accurate components such as St.ar (Sulfur-received), Nar (Nitrogen-received), and Aar (Ash-received). Thus, when calculating the production of pollutants by burning mixed coal, we used the average data for the components.
China has prioritized energy saving and air pollution control policies for thermal power plants [
20], especially for SO
2, NO
x, and PM. As a result, most coal-fired power plants are equipped with attachments for desulfurizing, denitrifying, and dedusting in accordance with these mandatory policies. The common attachments used for desulfurizing, denitrifying, and dedusting are given in
Table 1.Polices such as the 13th Five-Year Plan and China’s efforts to address climate change have also exerted pressure on power plants to cut their CO
2 emissions. However, because of costs and technology availability, no specific measures were being utilized to reduce CO
2 emissions in any of the selected coal-fired plants analyzed in this study. Meanwhile, mercury emissions are highly hazardous to human health [
67,
68], and the Emission Standard of Air Pollutants for Coal-Fired Power Plants (ESETP), which was issued on 1 January 2015, requires that all coal-fired boilers meet an emission limit of 0.03 mg/m
3 for mercury and mercury-containing compounds [
33]. China’s coal-fired power plants started to pay more attention to mercury control after January 2015. However, all sample plants in the study which were built in 2014 and 2015, have not installed special facilities for reducing mercury emissions. Because of co-benefits generated in the process of pollution control measures, the mercury emissions can be reduced by 70%–75% in our survey [
55,
67].
In addition to policies and the ESETP presented above, there are other policies that have also addressed the installation and operation of end-of-pipe reduction measures in power plants in China [
34,
35,
69]. For instance, the Environmental Production Law of the People’s Republic of China [
69] stipulates that power plants must run pollution control measures when units operate normally. The operation time of reduction measures in sample power plants is consistent with the running time of electricity generation units regarding the data collected from EIA reports of sample power plants. Our survey shows that all sample coal-fired power plants have been equipped with on-line monitoring equipment by local environmental protection agencies, especially those plants with big generation capacities (over 300 MW) [
70,
71]. Based on our survey, we also can find that all 39 newly-built coal-fired power plants run the control technologies of desulfurization, denitrification, and dedusting when they operate, and the operation rates of these control measures are 100%.
Data on 83 units in the 39 newly built plants were collected. The databases adopted in this study are presented in
Table 2.
3. Results and Discussion
3.1. Air Pollutants Produced
Coal is a traditional fuel and a widely used energy source in China. Because of its complex chemical composition and the presence of a variety of elements in coal, such as sulfur, nitrogen, etc., burning coal leads to higher CO
2 and pollutant emissions than other energy sources, such as natural gas or oil.
Table 3 gives detailed information about the units from the 39 newly built coal-fired power plants. PC is pulverized coal boiler, and CFB is circulating fluidized bed boiler.
The 83 coal-fired units analyzed in this study employ different types of boilers and have different generation capacities. The generation capacities amounted to 300 MW, 350 MW, 660 MW, and 1000 MW.
Table 3 shows that half of the units had a capacity of over 600 MW, and the efficiency of coal consumption was better for the units with bigger capacities. Currently, China wants to build power plants with larger capacities (i.e., over 600 MW) to replace smaller capacity power plants with low energy efficiencies, in accordance with centralized and local mandatory policies. The CFB and PC boilers are the two primary types of boilers utilized in these power plants; CFB boilers are mainly used in power plants with a generation capacity of 300 MW or 350 MW, whereas PC boilers are used in plants with a generation capacity over 250 MW. The PC boilers have higher energy efficiencies than CFB boilers.
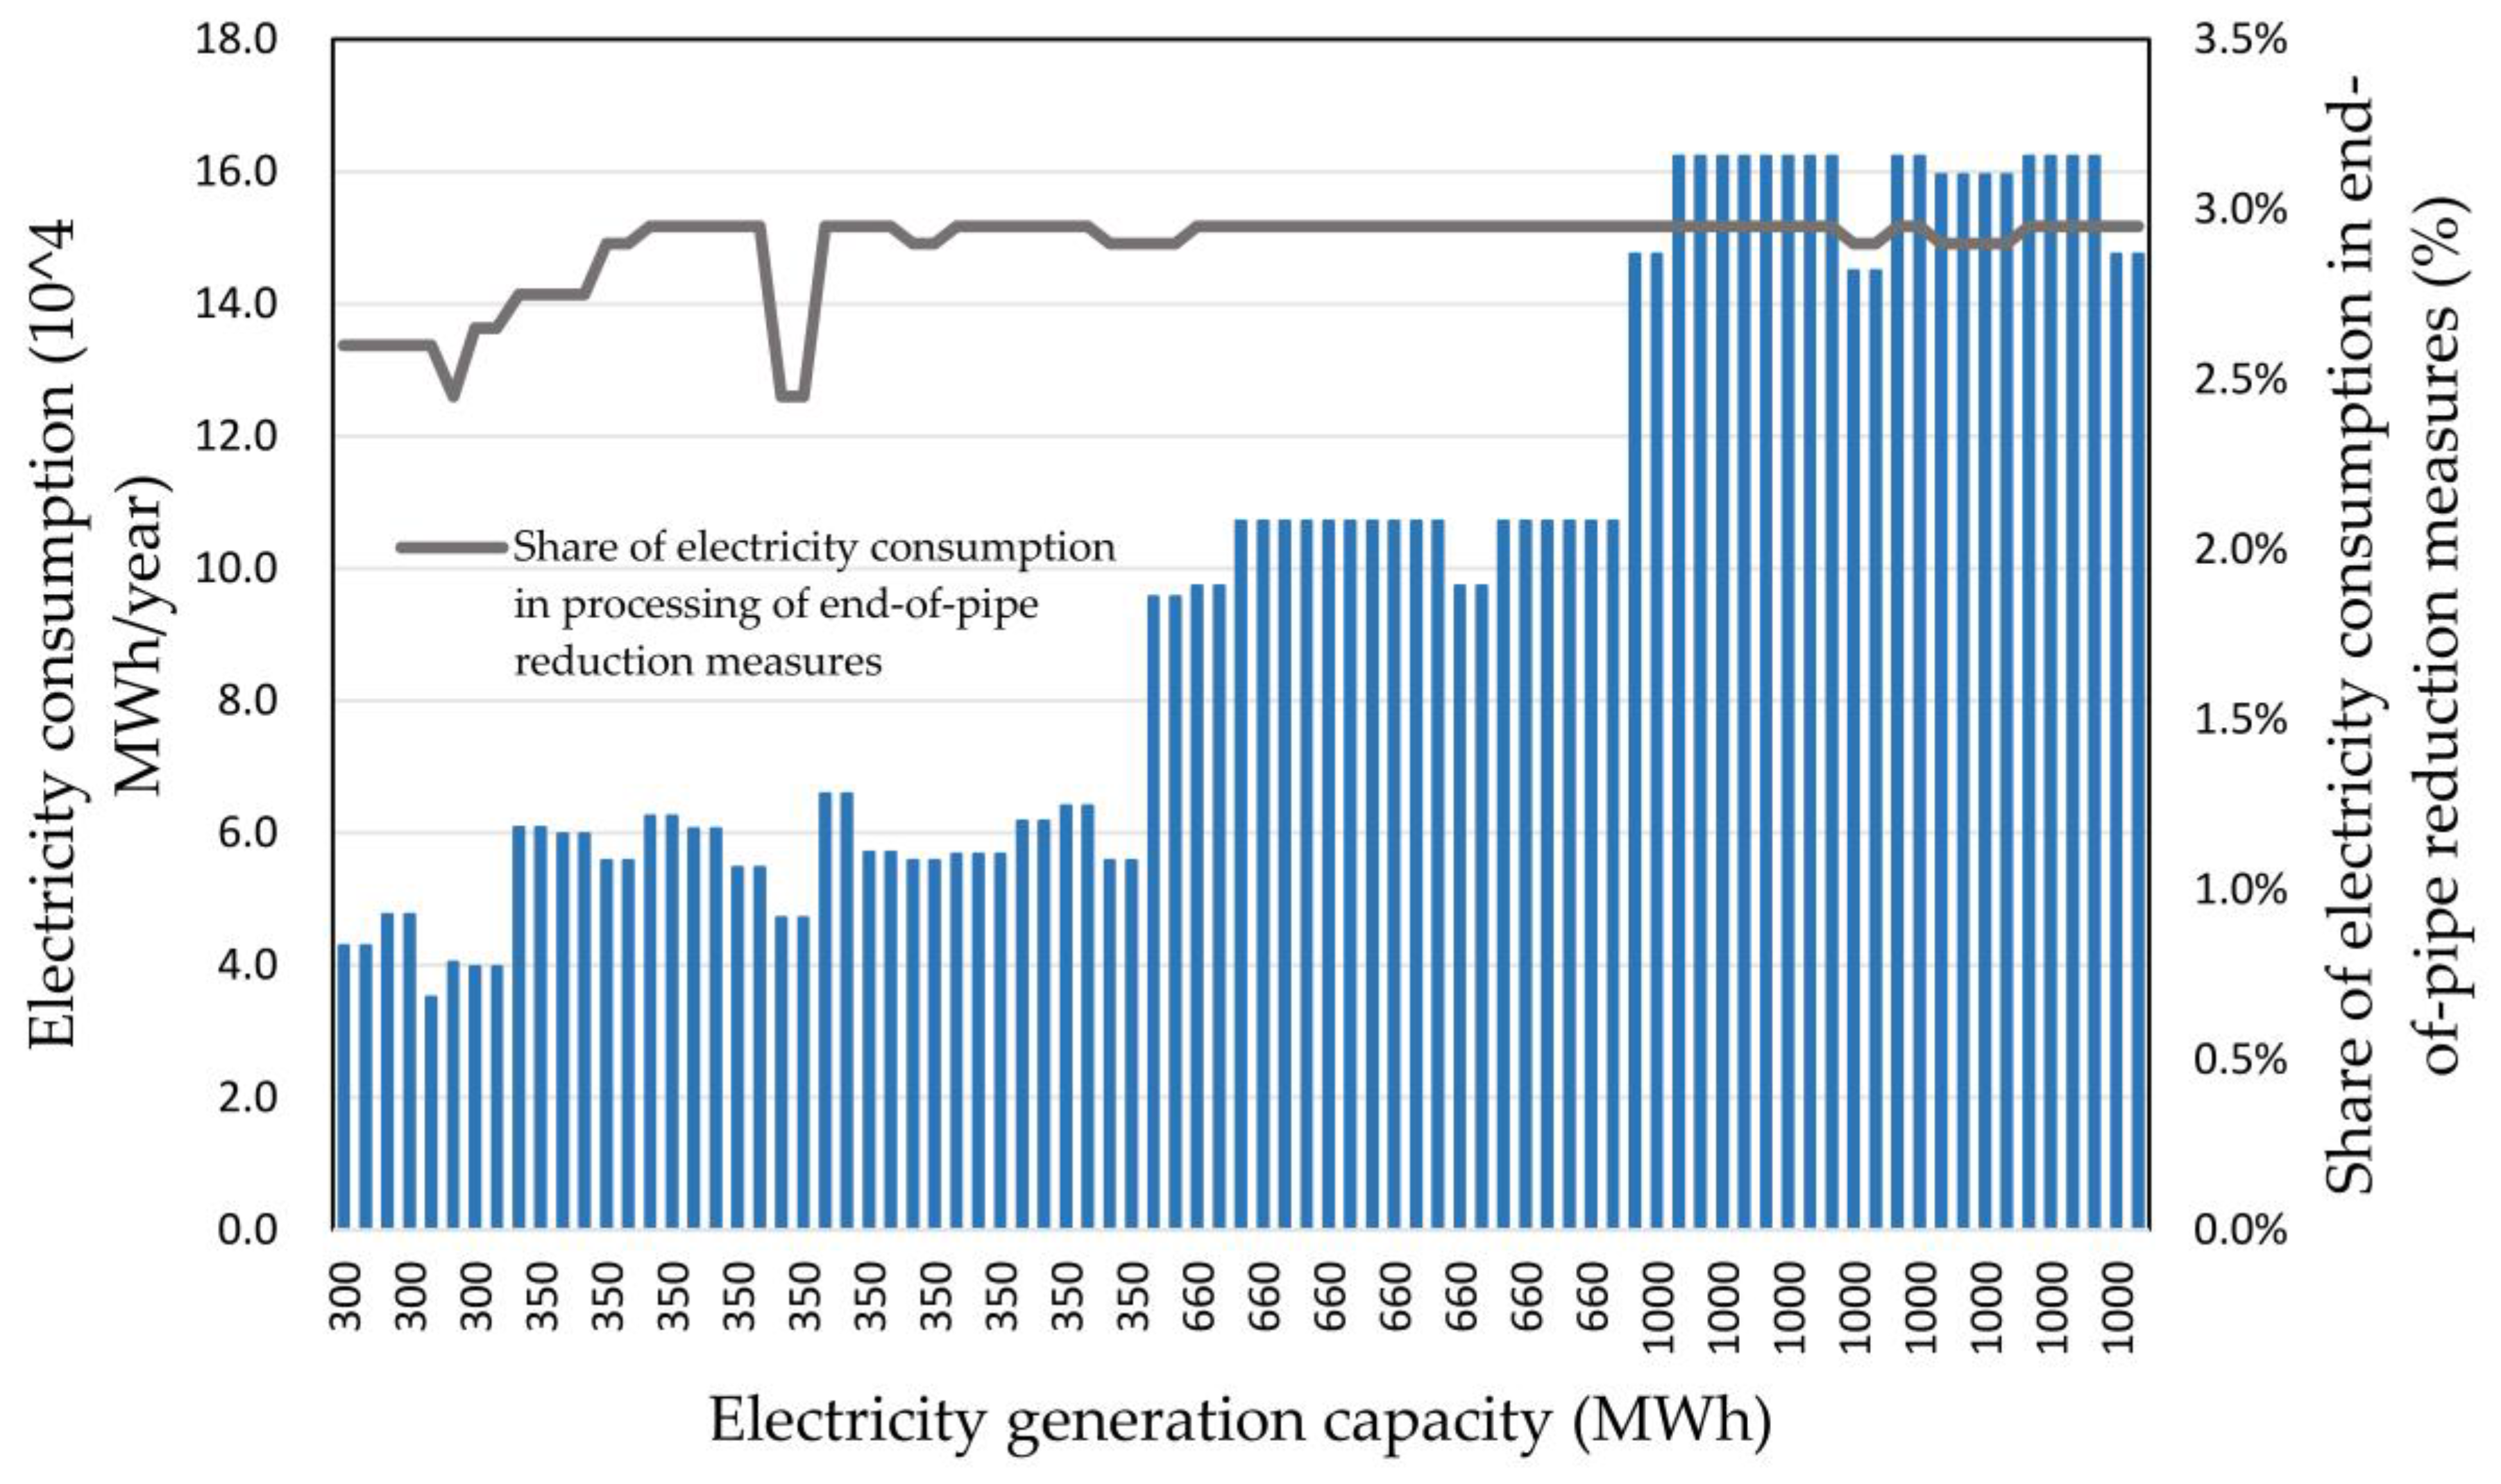
The electricity consumption of desulfurization is usually larger than the denitrification and desuting in
Table 1. As
Figure 3 shows, the total electricity consumption of end-of-pipe reduction measures accounts for 2.5% to 3.0% of the total electricity generation. The co-effects from the electricity consumption of the reduction measures can not only indirectly increase pollutants and GHG emissions, but can also reduce energy efficiency and electric supply of the power plants. However, compared to the boiler types (PC or CFB), the line loss rate of electric transmission (the average line loss rate is 5.8% of the total electricity generation in 2014 [
30]) and other factors, and the influence of supply efficiency from the electricity consumption of reduction measures is not very significant.
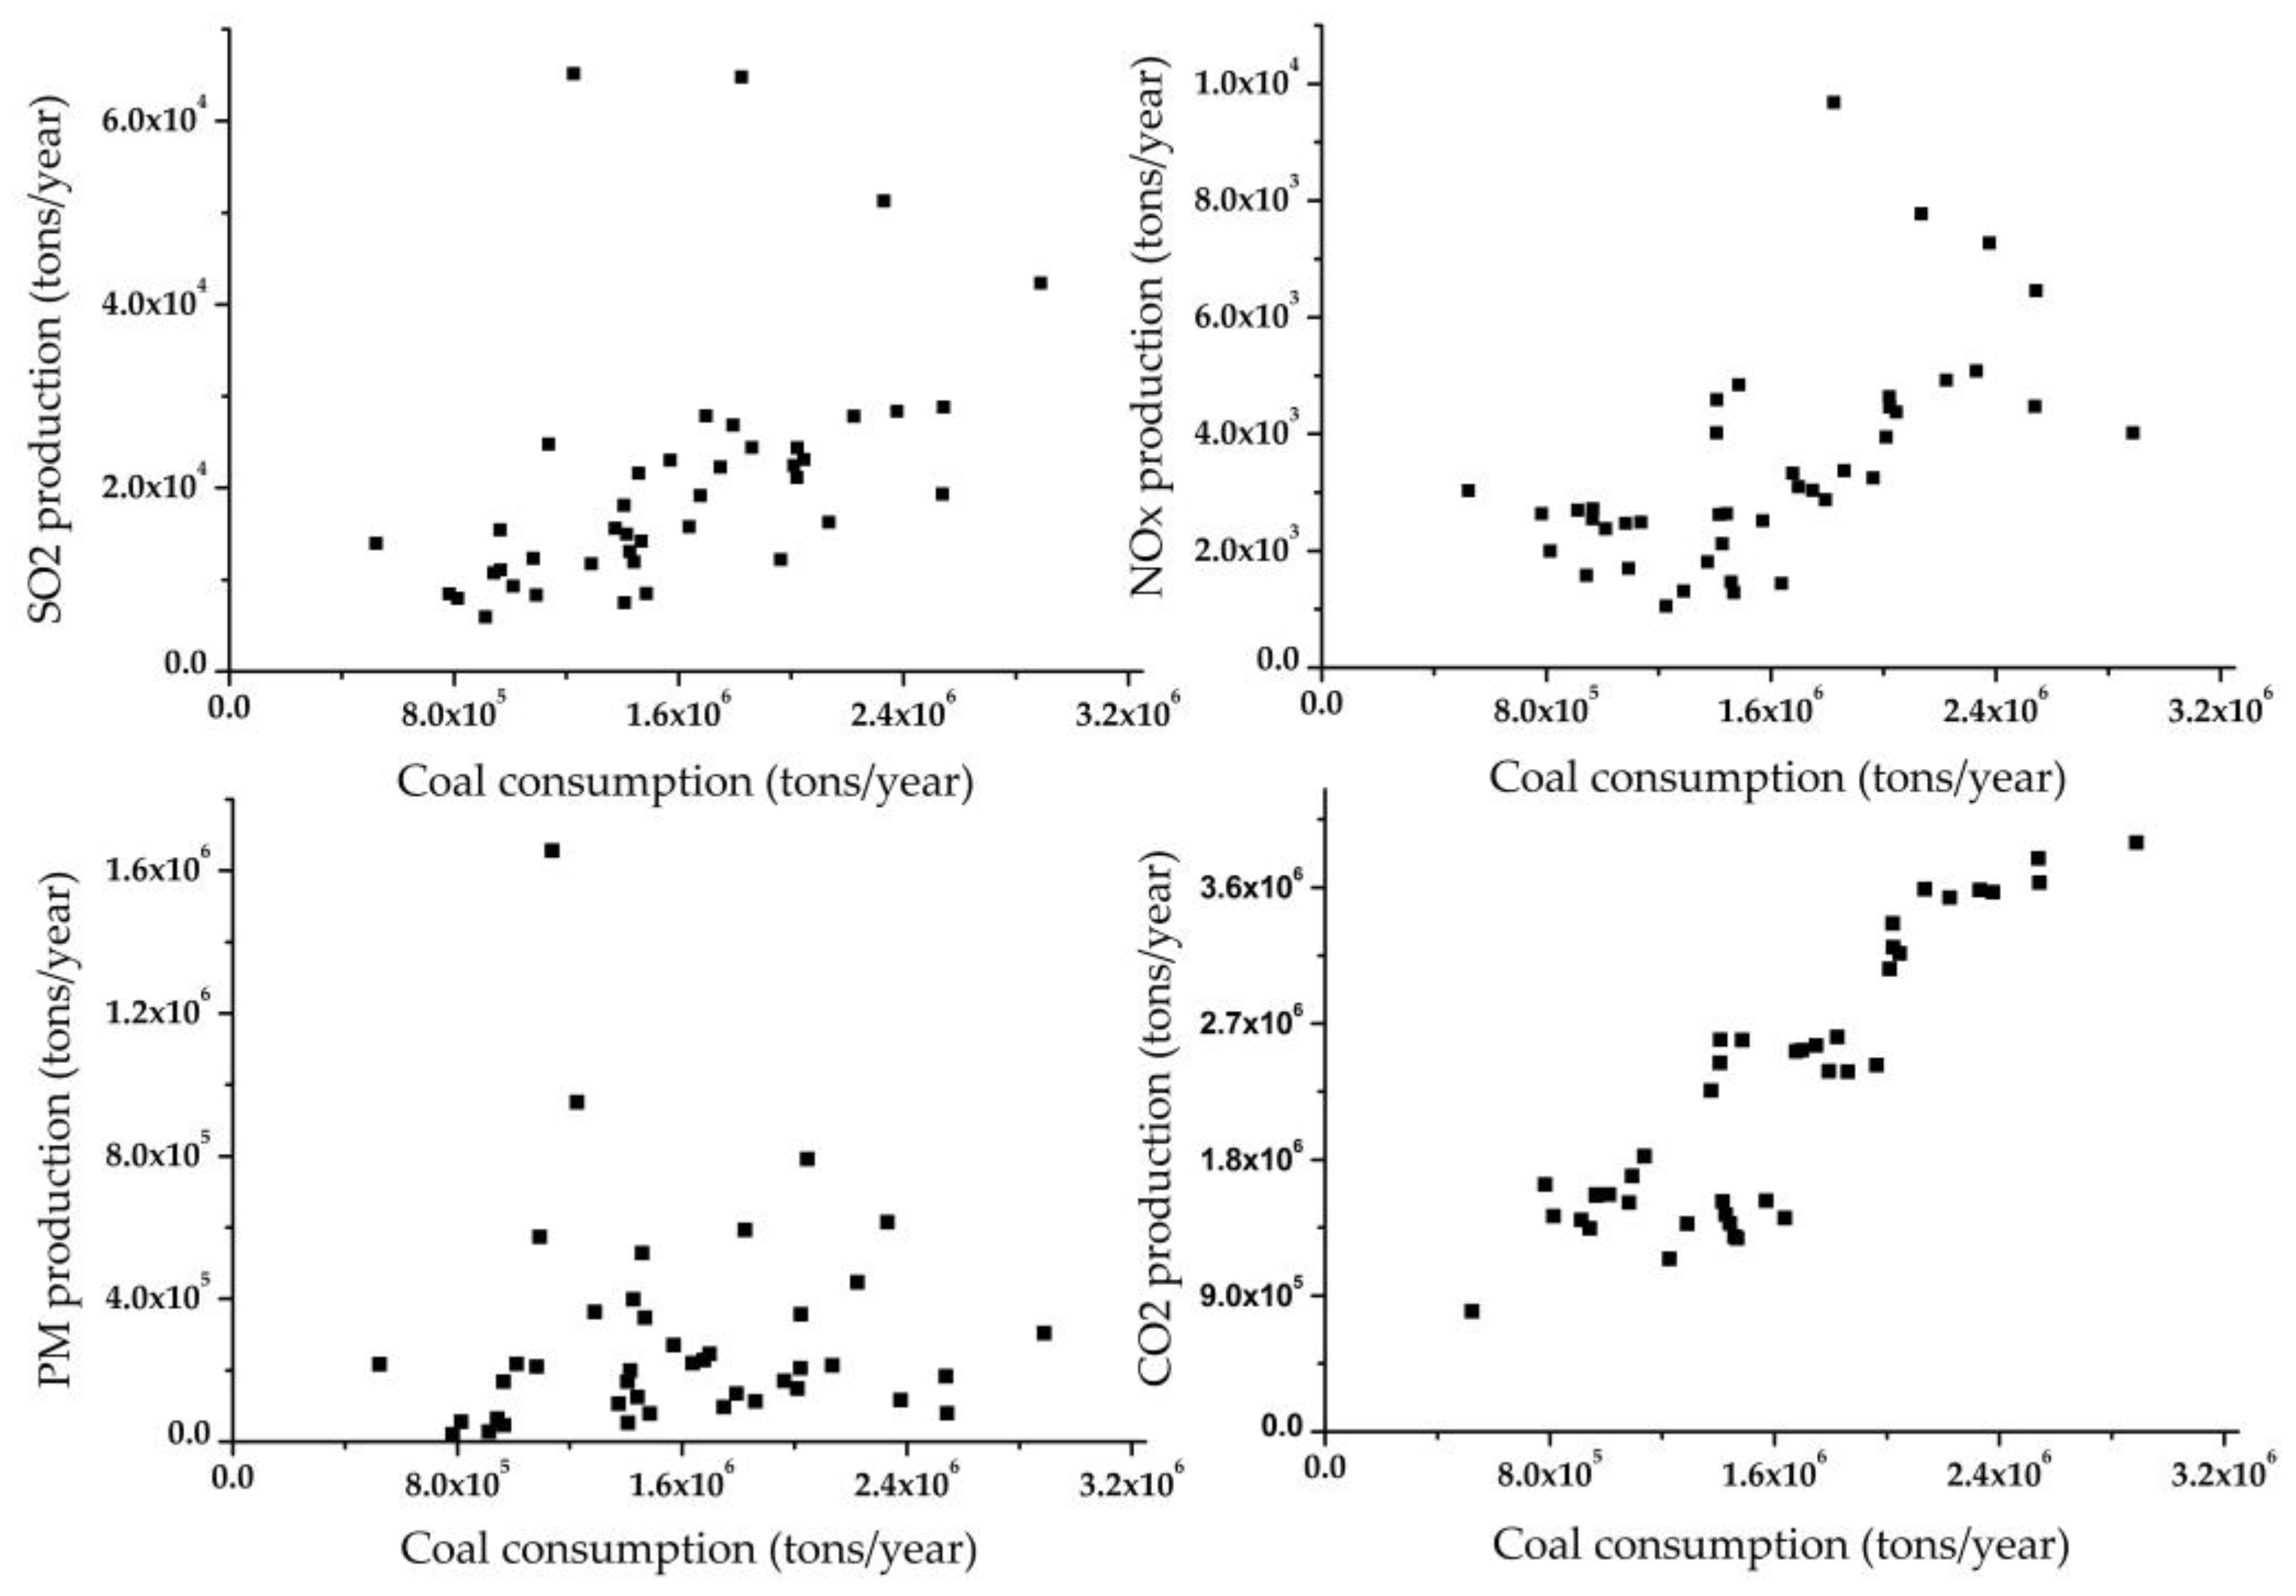
By using Equations (1)–(4) and inputting the collected data, we calculated the production of SO
2, NO
x, PM, and CO
2 for different volumes of coal combustion in the sample power plants. The results are shown in
Figure 4.
As
Figure 4 shows, the variation trends in emissions were not strictly consistent with the trends of coal combustion because the chemical composition of the coal fuel was not the same in every plant. As discussed in
Section 2.4, the fuel type used in the selected coal-fired power plants is mixed coal, and the mixed rate can change often according to the actual supply situation. Hence, it was impossible to gather accurate data for this study on the rate of coal mixing and the actual components present.
Figure 4 shows that the pollutant emissions were not only strongly linked to the volume of coal consumption, but also with the quality of the coal fuel. For example, cleaned coal has reduced St.ar and Aar as a result of the washing process. Thus, the use of high quality coal can promote the efficiency of electricity generation and also reduce the emissions of air pollutants [
72].
3.2. Reductions in Air Pollution
The Ministry of Environmental Protectionof the People’s Republic of China issued the ESETP in 2011 [
33]. Consequently, new plants had to adopt pollution control devices for the processes of desulfurizing, denitrifying, and dedusting to reach the standards set for pollution control. Recall that because of immature technology and high costs, no special measures to control CO
2 or mercury are installed in the 83 units of the 39 newly built plants.
Table 4 presents the main standards outlined in the ESETP for coal-fired power plants in China.
Abatement measures to reduce SO
2 emissions can be generally divided into three main categories including wet, semi-dry, and dry measures. Four common desulfurization technologies are summarised in
Table 5. According to the statistical data for desulfurization technologies of national coal-fired plants [
73], limestone–gypsum wet FGD was utilized in 32% of the total plants established between 1997 and 2010, and this type of equipment was utilized in 54% of the total plants established between 2011 and 2013. In our study, limestone–gypsum wet FGD was adopted by 90% of the newly built coal-fired power plants in 2014 and 2015.
Abatement measures for NO
x control can be divided into pre-combustion and post-combustion technologies, and most power plants are equipped with LNBs (Low-NOx Burners) that are designed to control the fuel and air mixing ratio to achieve reductions in NO
x generation [
74,
75]. According to the Environmental Protection Agency (1999), general NO
x reduction percentages for LNBs range from 20% to 60%, but now new units with LNBs can reach 100% during electricity generation. Widely used post-combustion methods include SCR and SNCR, and SCR has been adopted by 88% of the total sample plants in our study. The SNCR technology needs a high reaction temperature without a catalyst. In contrast, SCR has no limitations in regards to the temperature of flue gases, but it does need a catalyst to promote the reaction. Common equipment for reducing PM includes EP (Electrostatic Precipitation) devices and bag filters. In order to reduce dust bag loads and shorten the numbers of replacement bags needed, more and more units are now using a combination of EP technology and bag filters, which decreases the cost of dust bags. In our survey, 71% of the dedusting measures involved EP devices, 8% involved bag filters, and 20% involved a combination of EP and bag filters.
The abatement measures presented above can reduce certain target pollutants effectively, and at the same time, these measures can have co-effects on other pollutants and CO2 emissions because of the direct and indirect effects produced by the chemical reactions and electricity consumption.
Based on the outcomes detailed in
Section 3.1, and by using Equations (5)–(13) given in
Section 2.2, the average air pollutant and CO
2 emission reductions per plant for SO
2, NO
x, PM, and CO
2 were calculated for each abatement measure, and the results are shown in
Table 5. Here, the reduction represents the total from both the direct and indirect effects.
Each measure exhibited a strong control capacity for the target pollutant and simultaneously exerted co-effects via direct and indirect effects on the other pollutants and CO2 emissions.
According to the results presented in
Table 5, we can see that all pollution measures led to more CO
2 emissions. The electricity used in the process of reducing target pollutants was the reason for the generation of more CO
2. These findings indicate that air pollution reduction measures can have negative synergistic effects on CO
2 emissions in the sample power plants.
As
Table 5 shows, technology consisting of a CFB furnace mixed with limestone and outside limestone–gypsum wet FGD was the best measure to achieve target pollutant reduction and better synergistic effects in regards to the reduction of other pollutants. The limestone–gypsum wet FGD technology is now widely used for end-of-pipe pollution control, but the high amounts of CO
2 production may raise concerns about GHG emissions. During the process of denitrification, SCR was more efficient for reducing NO
x, but SNCR had less of a negative effect on the other pollutants because the power consumption of SCR was more than that for SNCR. Additionally, if a plant used urea as the absorbent, the main disadvantage was the production of CO
2, but if liquid ammonia was used as the absorbent, the negative effect on CO
2 was reduced. In the process of dedusting, all pollution reduction rates were more than 99%. Using bag filters is considered to be the best measure under the comprehensive evaluation. However, because of the costs associated with replacing the bags, the application of combined EP and bag filter technology has become more extensive (though it was not adopted widely in the sample plants). By comparing all pollutant control measures, we can see that the SO
2 control measures brought about more synergistic reduction effects for the other pollutants such as NO
x and PM than the other control measures.
3.3. Formatting of Mathematical Components
The purpose of the synergistic coefficients was to quantify the degree of co-effects for the different measures used for pollution control in the sample coal-fired power plants. The method for obtaining the synergistic coefficients was given in
Section 2.3. Recall that
CI is the synergistic coefficient for the co-effects achieved by undertaking each of the pollution reduction measures. Equations (14)–(16) were used for the assessment. The upper limit of the synergistic coefficient is 1 for target pollutants. If
CI < 0, the synergy effect is negative; if
CI > 0, the synergy effect is positive for the co-control measure. The value of the coefficient represents the synergistic intensity. Every abatement measure had synergistic coefficients for SO
2, NO
x, PM, and CO
2, and
Table 6 presents the evaluation results.
If the reduction was less than zero in
Table 5, the synergistic coefficients were negative numbers, and if the reduction was more than zero, the coefficients were positive numbers. Direct effects from chemical reactions were stronger than indirect effects from electricity use in the process of pollution reduction. The adsorbent use is a core issue in the occurrence mechanism of direct effects. For example, limestone used in the desulfurization process, or urea in the denitrification process, are two adsorbents that can produce CO
2 emissions when chemical reactions occur during the reduction of the target pollutants.
Synergistic coefficients can provide clear quantifiable results to judge what kind of measure can produce the most positive co-effects. First, for the desulfurization measures, the limestone–gypsum wet FGD technology, which is widely used, was found to be not the best measure for achieving co-effects because of the negative effects on CO2 produced through the consumption of electricity. The coefficient for the technology of the CFB furnace mixed with limestone and outside limestone–gypsum wet FGD was higher than for the other coefficients for measures aimed at reducing SO2, but its market share is only 7% compared to the other measures. One reason for the low rate of market share is the limitation posed by the types of boilers that have to be matched to this measure. Two other technologies of Rotary spray semi-dry FGD and CFB dry FGD had lower negative co-benefits than the above two technologies.
Second, for denitrification measures, SCR and SNCR with LNB are two mainstream application technologies. The LNB systems have been installed in power plants since 2004 [
27,
73]. Here, we found that SCR was better in NO
x control as it achieved higher reduction rates, but it was associated with more negative co-effects than the other measures. In comparison, SNCR was better at achieving co-effects, but the NO
x removal rate was lower in flue air. The reaction conditions for SNCR require high temperatures to promote the processes that adsorb NO
x, and SNCR is often used in conjunction with CFB boilers.
Finally, for the three kinds of PM reduction measures, EP was found to be the worst measure, even though it is widely used, as its efficiency for reducing PM was the lowest, and the synergistic coefficients were low as well. Bag filters performed well in terms of the reduction efficiency and synergy coefficients, but the costs of using bag filter technology were the highest of the reduction measures studied. In order to decrease the costs of PM abatement, plants can install EP devices before bag filters to reduce the loads on the bags, and thus reduce the replacement bag costs. This combination of EP and bag filters is expected to be more efficient and economical.
The main findings for the synergistic coefficient analysis were as follows:
The synergy of end-of-pipe pollution control measures in newly built coal-fired power plants was clear and significant. With data from the bottom-up approach at the unit level in the sample power plants and the method designed for assessing synergistic coefficients, we quantified the coefficients to understand the degree of co-effects on air pollutant reductions.
Indirect effects on CO2 emissions for the abatement measures were all negative. One important factor driving this trend was that some measures had to consume electricity to maintain high reaction temperatures.
With the exception of the negative effects involving increases in CO2 emissions, the co-effects on PM reduction during target pollutant reduction were positive in two desulfurization measures.
The reduction efficiency and synergistic coefficients of abatement measures did not have a positive correlation with their market shares. In the selected power plants analyzed in this study, the actual implementation of the measures depended on a variety of factors such as costs, boiler matching, and the capacity for power generation.
3.4. Summary of Findings
Most newly-built power plants are coal-fired plants with large generation capacities. Under the emission standard, all 83 units in our survey adopt desulfurization, denitrification, and dedusting measures to control the emissions of air pollutants. These end-of-pipe reduction measures have co-effects on the efficiency of the power supply and emissions of air pollutants and GHG. Power plants need to use 2.5–3.0% of the electricity to maintain the operation of the removal equipment, which brings indirect emissions. Additionally, some chemical reactions for reducing target pollutants can increase or decrease other pollutants and CO2 directly. Direct effects are more significant than indirect effects in emissions.
In this study, all direct and indirect co-effects generated by using desulfurization, denitrification, and dedusting, have negative effects on CO2 emission control. Some reduction measures can co-control emissions of other air pollutants except the targets. According to the evaluation of the synergistic coefficients, the CFB furnace mixed with limestone and outside limestone–gypsum wet FGD did better in desulfurization measures; SCR is better than SNCR; and bag filters are the best of the three dedusting measures. However, limestone–gypsum wet FGD and EP are more widely used measures because of low operating costs for boiler types and others.
4. Conclusions
More energy and resources are needed to support China’s rapid growth and urbanization. The present coal dominated energy system, which generates about 90% of the electricity for China’s cities, has led to huge GHG and air pollutant emissions in recent years. Thus, there is tremendous interest in pollutant abatement technologies for coal-fired power plants.
In this study, we selected 83 units of 39 coal-fired power plants built between 2014 and 2015 as research samples, and the data for the study were collected at the unit level for different measures of pollutant control through a bottom-up approach. All selected plants have installed devices for desulfurizing, denitrifying, and dedusting in accordance with national and local mandatory policies. The focus of this study was on evaluating the co-effects on different air pollutants and CO2 emissions generated by the end-of-pipe measures used for pollution control in the sample plants. The findings of this study indicated that each of the end-of-pipe treatment measures for desulfurization, denitrification, and dedusting had co-effects on the emissions of air pollutants and GHGs, and these co-effects were due to the chemical reactions and electricity combustion. For instance, chemical reactions were effective at reducing both SO2 and PM. Additionally, negative co-effects on CO2 reduction were observed because CO2 was indirectly produced during electricity use. The positive co-effects of limestone–gypsum wet FGD technology were particularly striking, and we detected reductions of more than 95% for SO2 and 50% for PM. However, this technology (i.e., limestone–gypsum wet FGD), which is the most widely used measure for desulfurization in China, was not the best measure for reducing air pollutants while controlling GHG emissions. The other technology for targeted SO2 reductions, namely, the use of a CFB furnace mixed with limestone and outside limestone–gypsum wet FGD, is limited by the requirement for certain types of CFB boilers, and therefore, this technology has not been widely adopted because PC boilers are more efficient in large-generation-capacity units (≥300 MW) compared to CFB boilers. For denitrification measures, SCR and SNCR with LNBs are two mainstream measures that have been adopted. The SCR technology was found to be better at NOx control, but it had less co-benefits in terms of the reduction of other pollutants. The SNCR technology exhibited better co-benefits for the removal of both NOx and other pollutants under high temperature reaction conditions. Co-effects for the three PM reduction measures studied were not very different, but given the costs of replacement bag filters, the combination of EP devices and bag filters was deemed to be the most efficient and economical approach.
After assessing the synergistic coefficients, we were able to better understand the degree of co-effects generated when comprehensively taking direct and indirect co-effects into consideration. Each measure of pollution control had different coefficients for the co-effects on pollutants and CO
2 emissions. According to the results presented in
Table 5, we found that the synergistic coefficients for desulfurization measures were higher than the coefficients for dedusting and denitrification measures. The most widely used desulfurization technology, limestone–gypsum wet FGD, has 90% of the market share, and it was associated with a reduction rate of 95%–99%. A CFB furnace mixed with limestone and outside limestone–gypsum wet FGD has 7% of the market share, and it was associated with a reduction rate of 96%–97%. These two desulfurization measures have positive co-effects to PM reduction, but also have negative co-effects for controlling CO
2 emission significantly. For denitrification measures, all SCR and SNCR processes are combined with LNBs to improve the reduction efficiency. The market share of SCR is 88% and is higher than the 12% for SNCR, and the reduction rate for SCR was higher as well. Finally, there was no significant difference in reduction rates and synergistic factors for the dedusting measures, but EP has 71% of the market share because of the high costs associated with bag filters. From the results of the synergistic coefficient analysis, it was apparent that the measures with the biggest market shares were not the best ones in terms of achieving synergistic pollution reduction benefits.
One interesting finding of this study was that no measures have been undertaken to cut CO2 and mercury emissions in the 39 newly built coal-fired power plants because of the immature nature of the technology and high costs. Considering the fact that all pollutant abatement measures implemented in the 39 plants result in significant CO2 emissions, we need to rethink how we want to achieve co-benefits in terms of climate change mitigation and air pollution control, which have been previously addressed in China’s policies as separate issues. Accordingly, the relevant policies, standards, and laws should be improved and updated. Additionally, researchers need to take a comprehensive view of China’s coal-fired power plants and explore more solutions for tackling both GHG and air pollutant emissions, while considering how to maximize the positive co-effects.
Finally, based on the outcomes of the study of the co-effects of reduction measures in China’s new coal-fired power plants, some recommendations are proposed below.
- (1)
Government needs to strengthen the emission supervision of power plants under updated emission standards for effectively dealing with the enterprises’ emissions.
- (2)
The operation rates of reduction measures need to be improved to 100% in the whole national area, especially for those plants with generation capacities below 300MW. It is good for the improvement of operation rates because the government has put the operation rate into consideration of the electricity price recently.
- (3)
Considering the continuing growth of the electricity supply and the national target of reducing 18% of CO2 emissions per unit GDP by 2020 compared to 2005, China needs to accelerate the measure of decarburization in power plants.
- (4)
In order to reduce the coal consumption and synergistic emissions, China needs to improve desulfurization, denitrification, and dedusting efficiencies and energy efficiencies as well.
- (5)
Although end-of-pipe technologies have controlled pollutant emissions effectively, a gap still exists in achieving further emissions reduction under updated emission control standards for thermal power plants. China needs to put more efforts on measures such as adjusting power structure, coal cleaning, and improving energy efficiency.


