Article

An Expert-Based Assessment Model for Evaluating Habitat Suitability of Pond-Breeding Amphibians

1
Department of Horticulture, National Chung Hsing University, Taichung City 402, Taiwan
2
Department of Ecosystem Science & Management, Texas A&M University, College Station, TX 77843, USA
*
Author to whom correspondence should be addressed.
Sustainability 2017, 9(2), 278; https://doi.org/10.3390/su9020278
Submission received: 8 November 2016 / Revised: 9 February 2017 / Accepted: 10 February 2017 / Published: 16 February 2017

Abstract

:
Farm ponds are important habitats for amphibians, birds, and other wildlife. In Taiwan, artificial ponds were originally created on farmlands for irrigation purposes and the needs of the domestic water supply. Although pond creation is a typical farming practice, it also provides habitats for pond-breeding amphibians. Thus, it is essential to understand the current status of habitats and their vulnerability regarding urgent conservation needs for target species. Günther’s frog (Hylarana guentheri), a pond-breeding amphibian, has a high sensitivity towards surrounding environmental changes, and can be used as an indicator species to assess habitat suitability. The purpose of this study is to establish a systematic framework to assess the habitat suitability of pond-breeding amphibians by using Günther’s frog as a pilot-study species. First, we collected frog survey data from Chiayi, Taiwan, from winter 2013 to spring 2015, and investigated the present status of the environmental conditions around the ponds. Next, expert questionnaires and the fuzzy Delphi method were applied to establish the hierarchical evaluation criteria regarding the habitat suitability assessment. Four indicators: the aquatic environments of farm ponds; the terrestrial environments around ponds; landscape connectivity; and the conservation perceptions of the residents, were determined as first-layer factors in the assessment criteria, while ten other indicators were defined as second-layer factors. Based on the established assessment criteria, we performed in situ habitat suitability evaluations on 69 selected sites and surveyed the perceptions of the residents using questionnaires. Results revealed that 19% of locations were rich in frog species with a high habitat suitability. However, 67% of locations showed signs of habitat degradation, which may imply a higher need in practicing habitat improvement or restoration. The Kappa value was 0.6061, which indicated a high reliability of the habitat suitability assessment model. In brief, the proposed method can be applied, not only to assess the sustainability of frog habitats and degradation risks, but also to determine which locations may require future attention regarding conservation implementation. Furthermore, findings in this study provide useful background knowledge to all associated stakeholders when designing and implementing plans of wildlife habitat management and restoration at farm ponds.

1. Introduction

At present, 37.7% of the surface area of the world is covered by agricultural land [1]. If managed in an environmentally friendly way, farm ponds and their surrounding lands can form a landscape with spatial heterogeneity and support a high level of biodiversity, including species rich plants [2]; birds [3]; and amphibian [4] communities. However, human population growth, urbanization and industrialization have shifted the land use of agricultural landscapes, resulting in habitat loss and fragmentation; spatial homogenization; and a reduction in biodiversity [5,6]. Understanding the relationship between the agricultural landscape and its dynamics, and wildlife conditions in farmlands is an important issue in conservation biodiversity [6]. Ponds and other small stagnant water bodies are crucial for maintaining regional biodiversity. Recently, it has been recognized that these small-sized wetlands may make a significant contribution to the biodiversity of entire landscapes [7]. Small-sized wetlands have also been promoted as valuable habitats for water birds [8,9]. Although the recognition of the value of ponds for their biodiversity value has prompted calls toward conservation actions [6,10], wetland habitats are still impacted by human activities, such as induced land use change [6]. In Taiwan, many farm ponds have been destroyed or have become degraded, particularly in agricultural areas, such as Chiayi County. From 1995 to 2007, the number of farm ponds decreased from 1535 to 978. In the last two decades, more than five hundred farm ponds have disappeared.
Hazell et al. [4] demonstrated that farm ponds were an important frog habitat. The typical life cycle of a frog involves three stages: eggs hatching; larvae development in water; and terrestrial activity after metamorphosing to adult, which exposes the frog to a wide range of environments. Frog larvae are typically herbivores, whereas adults are carnivores, thus exposing them to diverse food; predators; and parasites [11]. Frogs have moist and well vascularized skin, placing them in intimate contact with surrounding environments. One may expect them to be vulnerable to changes in water quality resulting from different pollutants. Thus, they can be considered as a good indicator species for detecting changes in farm pond environments and ecosystems. Günther’s Frog, Hylarana guentheri is a subtropical species. It is widely distributed throughout southern China, and the islands of Hainan, Guam, and Taiwan [12]. Hylarana guentheri is characteristically found in open swampy habitats and is well-suited to living in agricultural landscapes, especially rice cultivation [13]. Günther’s frog has small activity ranges, leaving them vulnerable to habitat changes that result from either direct or indirect human activities [5].
Habitat suitability models are useful tools that have been extensively applied by conservation planners to estimate the likelihood of occurrence and the abundance of threatened wildlife species in terrestrial ecosystems [14]. Many habitat suitability models have been set up that use different analytical methods, including an integrated index of habitat suitability [15]; multi-criteria evaluation (MCE) and geographic information systems (GIS) [16]; analytic hierarchy process (AHP) and GIS [17,18]; remote sensing (RS), GIS, AHP and Natural Break (Jenks) classification [19]; the fuzzy Delphi method (FDM), fuzzy analytic hierarchy process (FAHP) and GIS applications [9]. Since the fuzzy Delphi method can reduce the investigation time substantially; accurately express the opinions of experts; and show economic benefits in time and cost [20], it has been integrated with GIS to evaluate the number and locations of farm ponds that provide various ecosystem services, such as habitation, production, biodiversity, culture preservation, and disaster reduction, and maintain the overall preservation value in Yunlin County [9]. Although FDM and GIS or FAHP and GIS have been adopted to facilitate the assessment of habitat suitability, previous studies have not demonstrated the implications of species distribution data, particularly to validate and test the reliability of the developed framework. Thus, this is a research niche worthy of being filled.
The purpose of this study was to establish a systematic framework for assessing the habitat suitability of pond-breeding amphibians in farm pond ecosystem conservation. Günther’s frog (Hylarana guentheri) was selected as the pilot study species. The criteria to determine the habitat suitability value of Günther’s frog in farm ponds were established by expert questionnaires which were analyzed using the fuzzy Delphi method. The on-site investigation data of the 69 farm ponds in Chiayi County were evaluated based on the evaluation structure of Günther’s frog habitat suitability in farm ponds. The suitability value was calculated through the process, including weighting the score of the evaluation criteria and summing up scores. Results were used to determine whether a farm pond was a suitable habitat and/or worthy to be preserved. Kappa statistics were applied to test the reliability of the habitat suitability evaluation structure. Matrix analysis was used to group ponds based on the number of Günther’s frogs present and habitat suitability value, and can provide useful information for stakeholders in developing win-win practices in both the conservation of Günther’s frog and the well-being of the residents.

2. Material and Methods
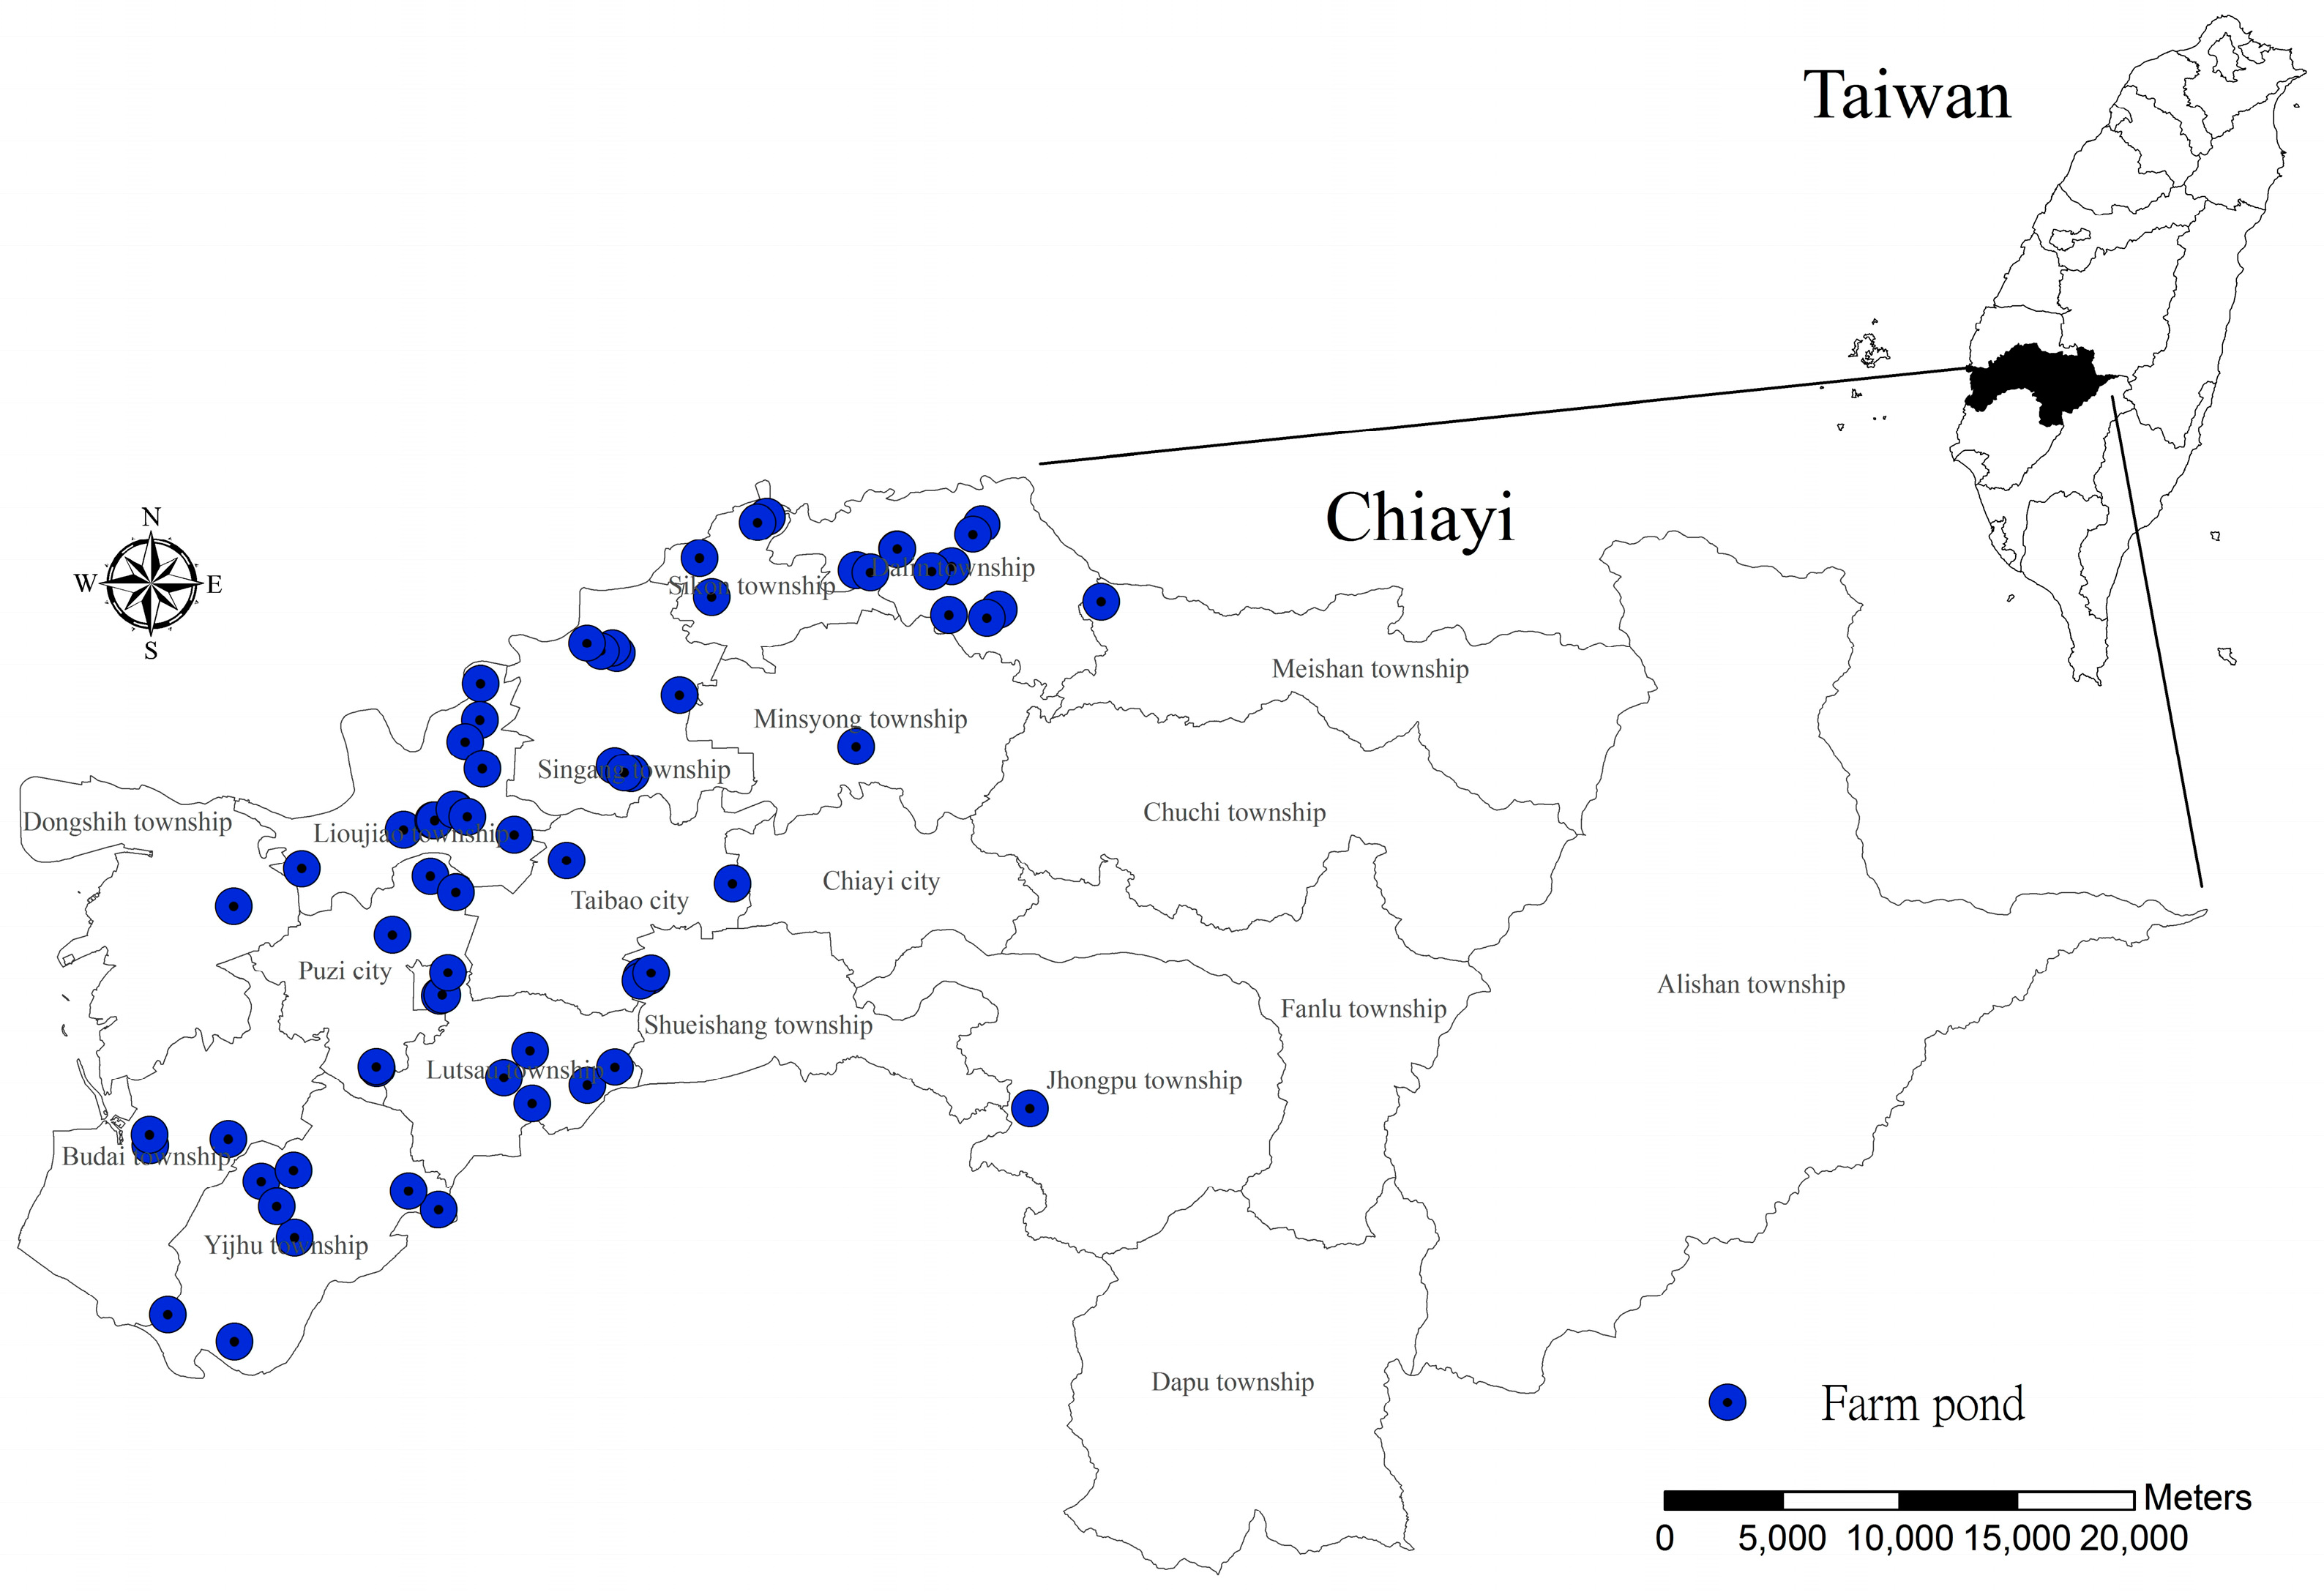
2.1. Study Area

The average annual rainfall in Chiayi County is approximately 1700 mm; however, the temporal distribution of precipitation is uneven. More than 80% of precipitation accumulates from May to October (i.e., the wet season), but the received rain could flow into the ocean rapidly and become less helpful for agricultural irrigation if not retained. Moreover, approximately 20% of annual rainfall occurs during the dry season (from November to April), leading to a water supply shortage for agricultural production. To cope with the uneven rainfall and insufficient irrigation systems, farmers began digging farm ponds for agricultural use during the period 1684–1895. The Chianan irrigation system represented the most important construction for water transportation during the period between 1896 and 1949. Digging farm ponds for water was utilized for irrigation until the Chianan irrigation system was completed [9]. Recently, farm ponds keep disappearing due to rapid urban sprawl, expansions of transportation route and construction in rural areas. The number of farm ponds in Chiayi County dropped from 1535 in 1995 down to 978 in 2007, with changes in land use for building sites or aquaculture ponds. The preservation of the remaining farm ponds is one of the critical issues in the study area with regard to perspectives of habitat conservation and agricultural landscape ecology. However, investigating the remaining 978 farm ponds in Chiayi County requires significant funding and time. Thus, we focused our study on farm ponds located in agricultural areas with nearby rivers, creeks, or other ponds. Next, we selected 180 farm ponds by using 1:5000 aerial photographs. An officer in each township helped to identify 86 farm ponds which were suitable to study amphibians, with dry ponds excluded after on-site surveys. A total of 69 farm ponds were selected, and the location distribution is shown in Figure 1.

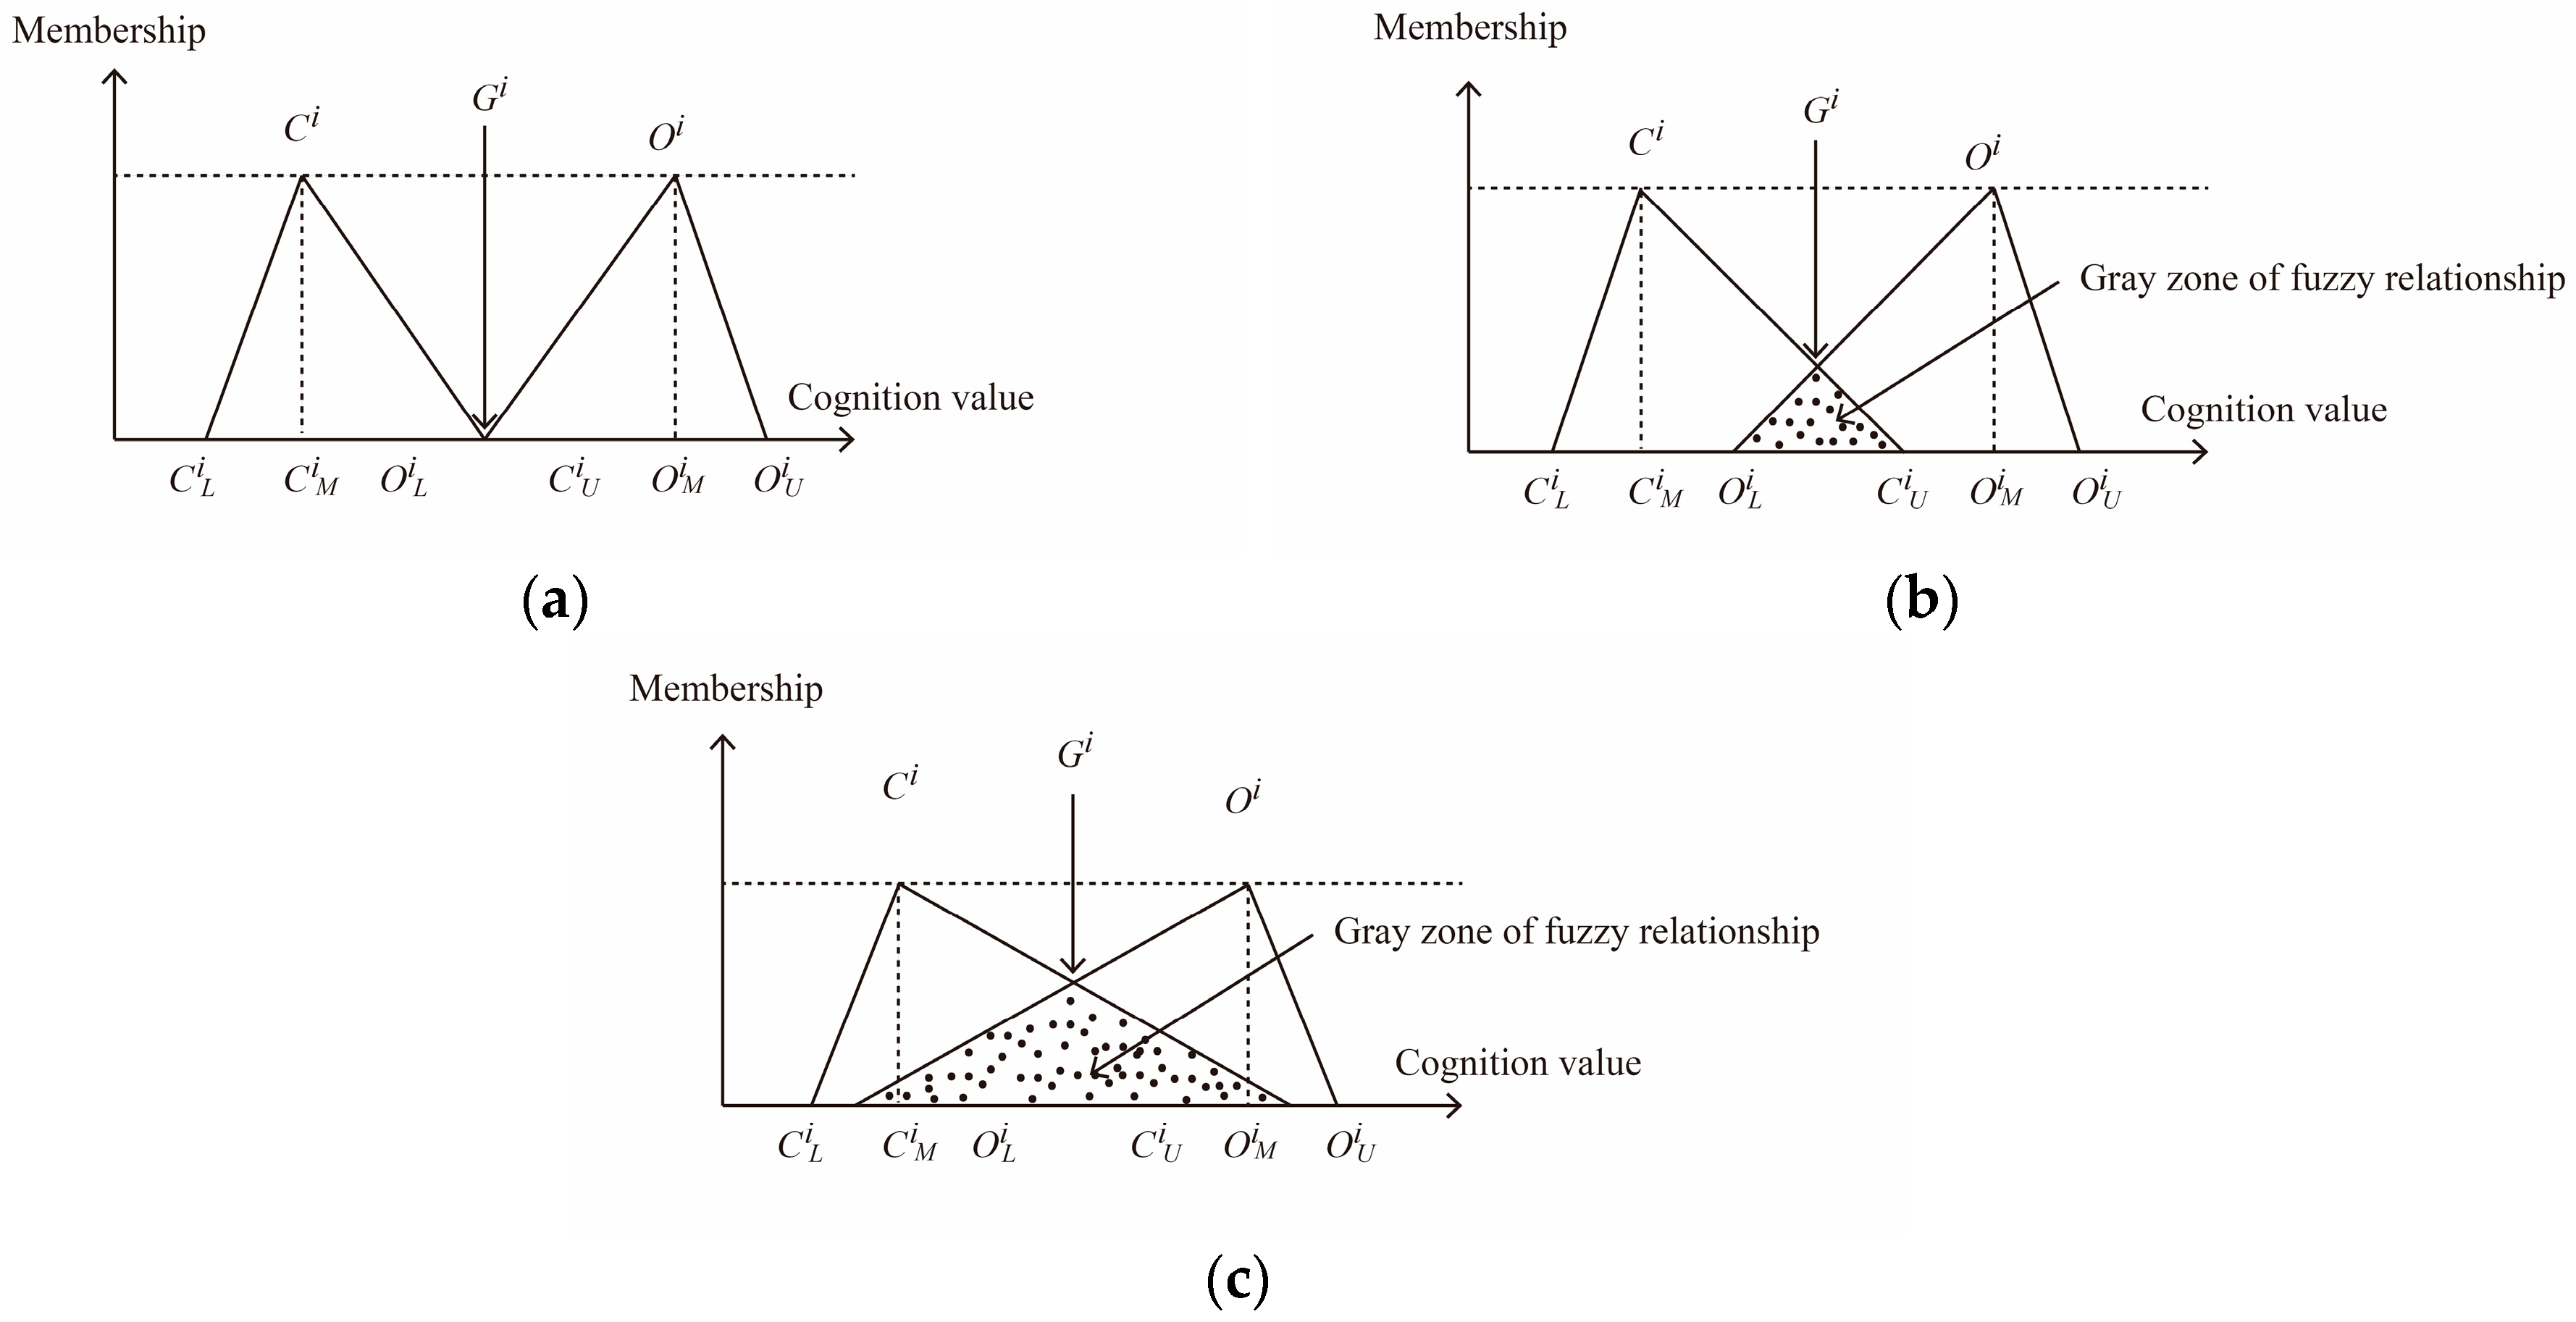
2.2. Fuzzy Delphi Method

The fuzzy Delphi method is a more advanced version of the Delphi method that utilizes triangulation statistics to determine the distance between the levels of consensus within the expert panel. Jeng [20] indicated that the performance of the traditional fuzzy Delphi method could be improved considerably if algorithms were modified by introducing the dual triangular fuzzy number. Thus, the modified algorithm can integrate expert judgments and form a consensus more effectively, avoiding the need to ask experts repeatedly. Ishikawa et al. [21] demonstrated the application of the dual triangular fuzzy number into a fuzzy integration of expert opinions for the purpose of producing accurate results more effectively.
Considering different aspects, such as time and cost effectiveness and the accurate integration of experts’ judgment, etc. [9], the fuzzy Delphi method is a suitable approach to evaluate the habitat suitability for Günther’s frog at farm ponds. The first step was to gather experts’ opinions and determine evaluation criteria in assessing the habitat suitability of farm ponds. A questionnaire on the subjects of pond preservation and habitat conservation was designed and distributed to collect expert opinions. To select experts, we first searched for scientists familiar with frog biology or ecology in Taiwan. Thirty native researchers were identified, including 16 affiliated with universities; five at governmental research institutes; and nine who worked with ecological Non-governmental Organizations (NGOs). Next, we screened the list and looked for scholars who have performed field surveys on Günther’s frog; studied its habitats; and published articles in peer-reviewed journals. Only four researchers fit these criteria and were selected. One expert was a college professor who has studied native frogs for more than two decades, and was not only knowledgeable in the life history and habitat environments of frogs, but continuously contributes to the field by publishing scholarly articles [22,23]. The other two experts consulted were research scientists working with the Endemic Species Research Institute of Taiwan, both of whom have more than 10 years of experience in researching amphibians and reptiles. Both experts have conducted long-term research on frogs in Taiwan, particularly in the study of the ecology and biology of Günther’s frog in depth [24] and have documented its geographic distribution in Taiwan [25]. The fourth expert was a local resident of Chiayi County and a senior scientist affiliated with several ecological NGOs. He has 15 years of experience in biological surveys, including frog count surveys. Furthermore, this expert also participates in advocating frog habitat conservation and environmental education in Chiayi County [26]. In our study, we sent our questionnaire to all four experts. The first part of the questionnaire addressed the purpose of the interview and evaluation criteria. Next, we called the selected experts and discussed our research purposes; contents of indicators; and evaluation criteria over the phone. After ensuring that the experts understood the purpose and contents of the questionnaire, we collected their opinions via the survey instrument. All four expert surveys were valid.
Afterward, we introduced the fuzzy Delphi method to validate the expert consensus and select evaluation factors. Each expert provided a “considered” reasonable range of values for each evaluation criterion where the minimum interval value represented “the most conservative cognition” of the quantified criteria, and the maximum defined as “the most optimistic cognition” [9,27]. This approach was also used to screen the evaluation factors. Lastly, the six steps proposed by Chou et al. [9] were used to examine the expert consensus, with the details as follows:
i denotes each evaluation item, which is quantified as “the most conservative cognition (CiL)” and “the most optimistic cognition (OiU)” of the experts. If the value was two times greater than the standard deviation, it was considered as an outlier and excluded from the calculation of the minimum CiL; the geometric mean CiM; and the maximum CiU for “the most conservative cognition” and the minimum OiL; the geometric mean OiM; and the maximum OiU for “the most optimistic cognition” (Figure 2).
The first step contains no gray area. The denotation is
CiUOiU
where CiU represents the most conservative cognition and OiU is the most optimistic cognition. The cognition interval appeared to be the two non-overlapping triangular fuzzy numbers of each expert’s interval value (Figure 2a). The “cognition importance” of the evaluation criterion Gi is represented as:
Gi = (CiM + OiM)/2
where CiM is the geometric mean of the most conservative cognition and OiM, is the geometric mean of the most optimistic cognition.
The second step contains gray areas, which stand for the allowance of a little option differences among experts. In this case, the triangular fuzzy numbers are overlapped (Figure 2b). The mathematical expression can be written as CiU > OiL, and the gray area of the fuzzy relation can be addressed as:
Zi = CiUOiL < Mi = OiMCiM
where OiL is the minimum of the most optimistic cognition.
The “cognition importance” of the evaluation criterion i can be derived as:
Gi = min (fuzzy relations of two triangular fuzzy numbers) the fuzzy set is further calculated according to the quantified mean of the maximum
The third step not only contained gray areas, but also allowed a large gap in cognition among the experts (Figure 2c). The two triangular fuzzy numbers appeared to be overlapping (CiU > OiL), and the gray area of the fuzzy relations is represented as:
Zi = CiUOiL > Mi = OiMCiM
which indicates the interval value of each expert’s opinion not appearing in the cognition interval and due to significant differences among opinions [9].
The fourth step focused on establishing the evaluation structure and screening factors. The detailed process involved examining the evaluation of the hierarchical factors; deleting factors with excessively differing opinions; and setting up the hierarchy. In the fifth step, we calculated and weighed each factor in a hierarchical setting. The evaluation structure established by screening the factors was further quantified via the mean of the hierarchical weights and relative weights, including the “optimum value” of the expert’s cognition [9]. The sixth step involved the actual investigation of the farm ponds. We conducted field investigations of 69 farm pond locations. When the experts’ opinions were consistent and the evaluation criteria achieved convergence in the fuzzy Delphi method, there was no standard threshold. The reason for this was that the threshold was generally determined by the research objectives and subjective opinions [9]. For instance, more factors could be kept with lower threshold limits while additional factors could be deleted at higher thresholds.
The questionnaire includes two parts: The first part described the hierarchical structure to evaluate the habitat suitability of farm ponds for Günther’s frog in Chiayi County, and the contents of all indicators. The first-layer criteria contained eight indicators: weather conditions; the aquatic environment of the farm pond; the terrestrial environment around the pond; the conditions of the pond bank; the surrounding environment; landscape connectivity; biological competition; and the conservation perception of the residents. The second part was designed for the experts to determine the level of importance for all indicators. The scale of values ranged from 0 to 10, with 0 representing the least important and 10 indicating the most important. When the panel of experts formed a consensus and the indicators reached convergence, the triangular fuzzy number Zi would be greater than 0. The cognition value, Gi, would be greater when the consensus degree of experts and the importance of criteria are higher. The threshold was the mean of all cognition values for first-layer and second-layer criteria [28]. The threshold value of this study was 6.30. Hence, any indicator with a cognition value less than 6.30 was deleted. Three first-layer criteria were deleted, these being weather conditions, the conditions of the pond bank, and surrounding environments. Fifteen indicators under the first-layer criteria above were deleted simultaneously, and included differences of monthly precipitation; preferred temperature; preferred relative humidity; shrub coverage; tree coverage; farmland coverage; residential area coverage; competition due to exotic frog species, etc. In addition, two second-layer indicators—bank slope type and the height of pond bank—were also eliminated. After applying the FDM to the screen criteria, we retained four indicators—aquatic environments of farm pond, terrestrial environments around pond, landscape connectivity, and residents’ conservation perception—as first-layer criteria while the second-layer criteria had ten indicators (e.g., water depth of farm pond, farm pond connected with trenches/creeks).

2.3. Frog Census and Pond Environment Investigation

The sampling method of the frog survey was based on the approach addressed in the Methods and Technology of Reptile and Amphibian Survey [29] and the Taiwan Amphibian Monitoring Standard Operating Manual published by the Forestry Bureau, Council of Agriculture, Executive Yuan, Taiwan, R. O. C. The line transects method is widely used for road sampling in the night and is also an approach that allows the study of more species simultaneously [30,31,32]. In general, amphibians are more active under warm and rainy weather [33]. In other words, more species can be seen in a shorter time if applying the line transects method during the rainy seasons. In this study, frog surveys via the road sampling method were conducted not only during the rainy periods in spring and summer, but also in fall and winter for cross comparison purposes. During the road sampling, we first walked around the perimeter of farm ponds and performed road sampling on selected locations or potential micro-habitats such as bushes, holes, wither bark, small trenches, etc. Next, we identified the frog species and documented frog counts based on seen individuals and callings. The frog survey of this research included road sampling records of six different periods: 16–25 January 2014; 28 March–14 April 2014; 30 June–20 August 2014; 1 November–14 December 2014; and 20–30 January 2015.
The graduated steel tape method was used to measure the depth of the farm pond. A lead weight was attached to the end of a tape measure, which could become lodged and pulled the tape when lowering the lead weight into the pond for the water depth measurement. We also performed a field investigation on plant diversity (i.e., the number of plant species) and plant abundance within a 100-m-radius around the target pond. Results were used to represent the conditions of terrestrial vegetation. Vegetation coverage on pond banks and the ratio of water surface covered by floating plants were derived by integrating field data and GIS applications. First, we delineated the vegetation covering areas on both the pond banks and water surface when carrying out the field investigation. Next, GIS software was used to estimate the total area of the pond and the areas covered by vegetation. The coverage was calculated by dividing the areas covered by vegetation by the total area of farm pond. Furthermore, we studied the landscape connectivity between the farm pond and surrounding trenches or creeks by exploring whether any trench/creek existed within each farm pond. If there were any trenches/creeks, GIS software would be used to determine the distances in-between.

2.4. Questionnaire Design and Sampling Method for Resident Perspectives

A questionnaire was designed to evaluate the perception of the residents regarding the functions of farm ponds; their awareness of the declining frog population; and the conservation of frog habitats. Three options were presented in the questionnaire, which were “I understand that farm ponds can be frog habitats”; “I noticed that the number of frogs has decreased”; and “I am willing to preserve farm ponds for the purposes of frog conservation”. The 7-point Likert scale was used to determine the survey response, with seven used to indicate total agreement while one indicated a total disagreement. The survey was carried out from 16 to 25 January 2014. Targeted interviewees were community leaders; landlords; and residents who lived near the farm ponds. For each study site, we collected three valid questionnaires, thus, collecting a total of 207 questionnaires from 69 different locations with farm ponds.

2.5. Frog Habitat Suitability Assessment and Reliability Analysis

The investigation data of the 69 farm ponds in Chiayi County were examined based on the evaluating structure of Günther’s frog habitat suitability. The 10 evaluation criteria in Hierarchy II contained five Likert scales, and scores were assigned based on the on-site investigation of farm ponds, where a higher level and score represented more suitable habitats for frogs. The habitat suitability of farm ponds was calculated by weighting the score of the evaluation criteria and summing scores to attain the overall value, which defined which farm pond had the most suitable habitat for Günther’s frog.

2.6. Kappa Analysis

The simplest assessment for calculating a kappa statistic is to measure the proportion of agreement between predictive high habitat suitability and frogs present, accounting for the proportion of the pond present frog agreement ( p 0 ) and the proportion of high habitat suitability for the frog present agreement ( p e ). The kappa statistics can be calculated as [34,35],
k = p 0 p e 1 p e = i = 1 c p i i i = 1 c p i T p T i 1 i = 1 c p i T p T i
where p 0 p e is the difference between the proportion of the pond present frog agreement and that of agreement of high habitat suitability for frogs present, while 1 p e is interpreted as the maximum possible correct present beyond that expected by high habitat suitability for the frog present agreement; c is the number of categories; p i T shows the proportion of ponds in category i of observed pond present frog agreement, taken from the marginal total of the last column of the contingency matrix; p T i shows the proportion of ponds in category i of the high habitat suitability for frogs present, taken from the marginal totals of the last row of the contingency matrix and p i i shows the proportion of ponds in the same category, i, on both frogs present and high habitat suitability for frog present results, taken from the diagonal elements of the contingency matrix [35].

3. Results

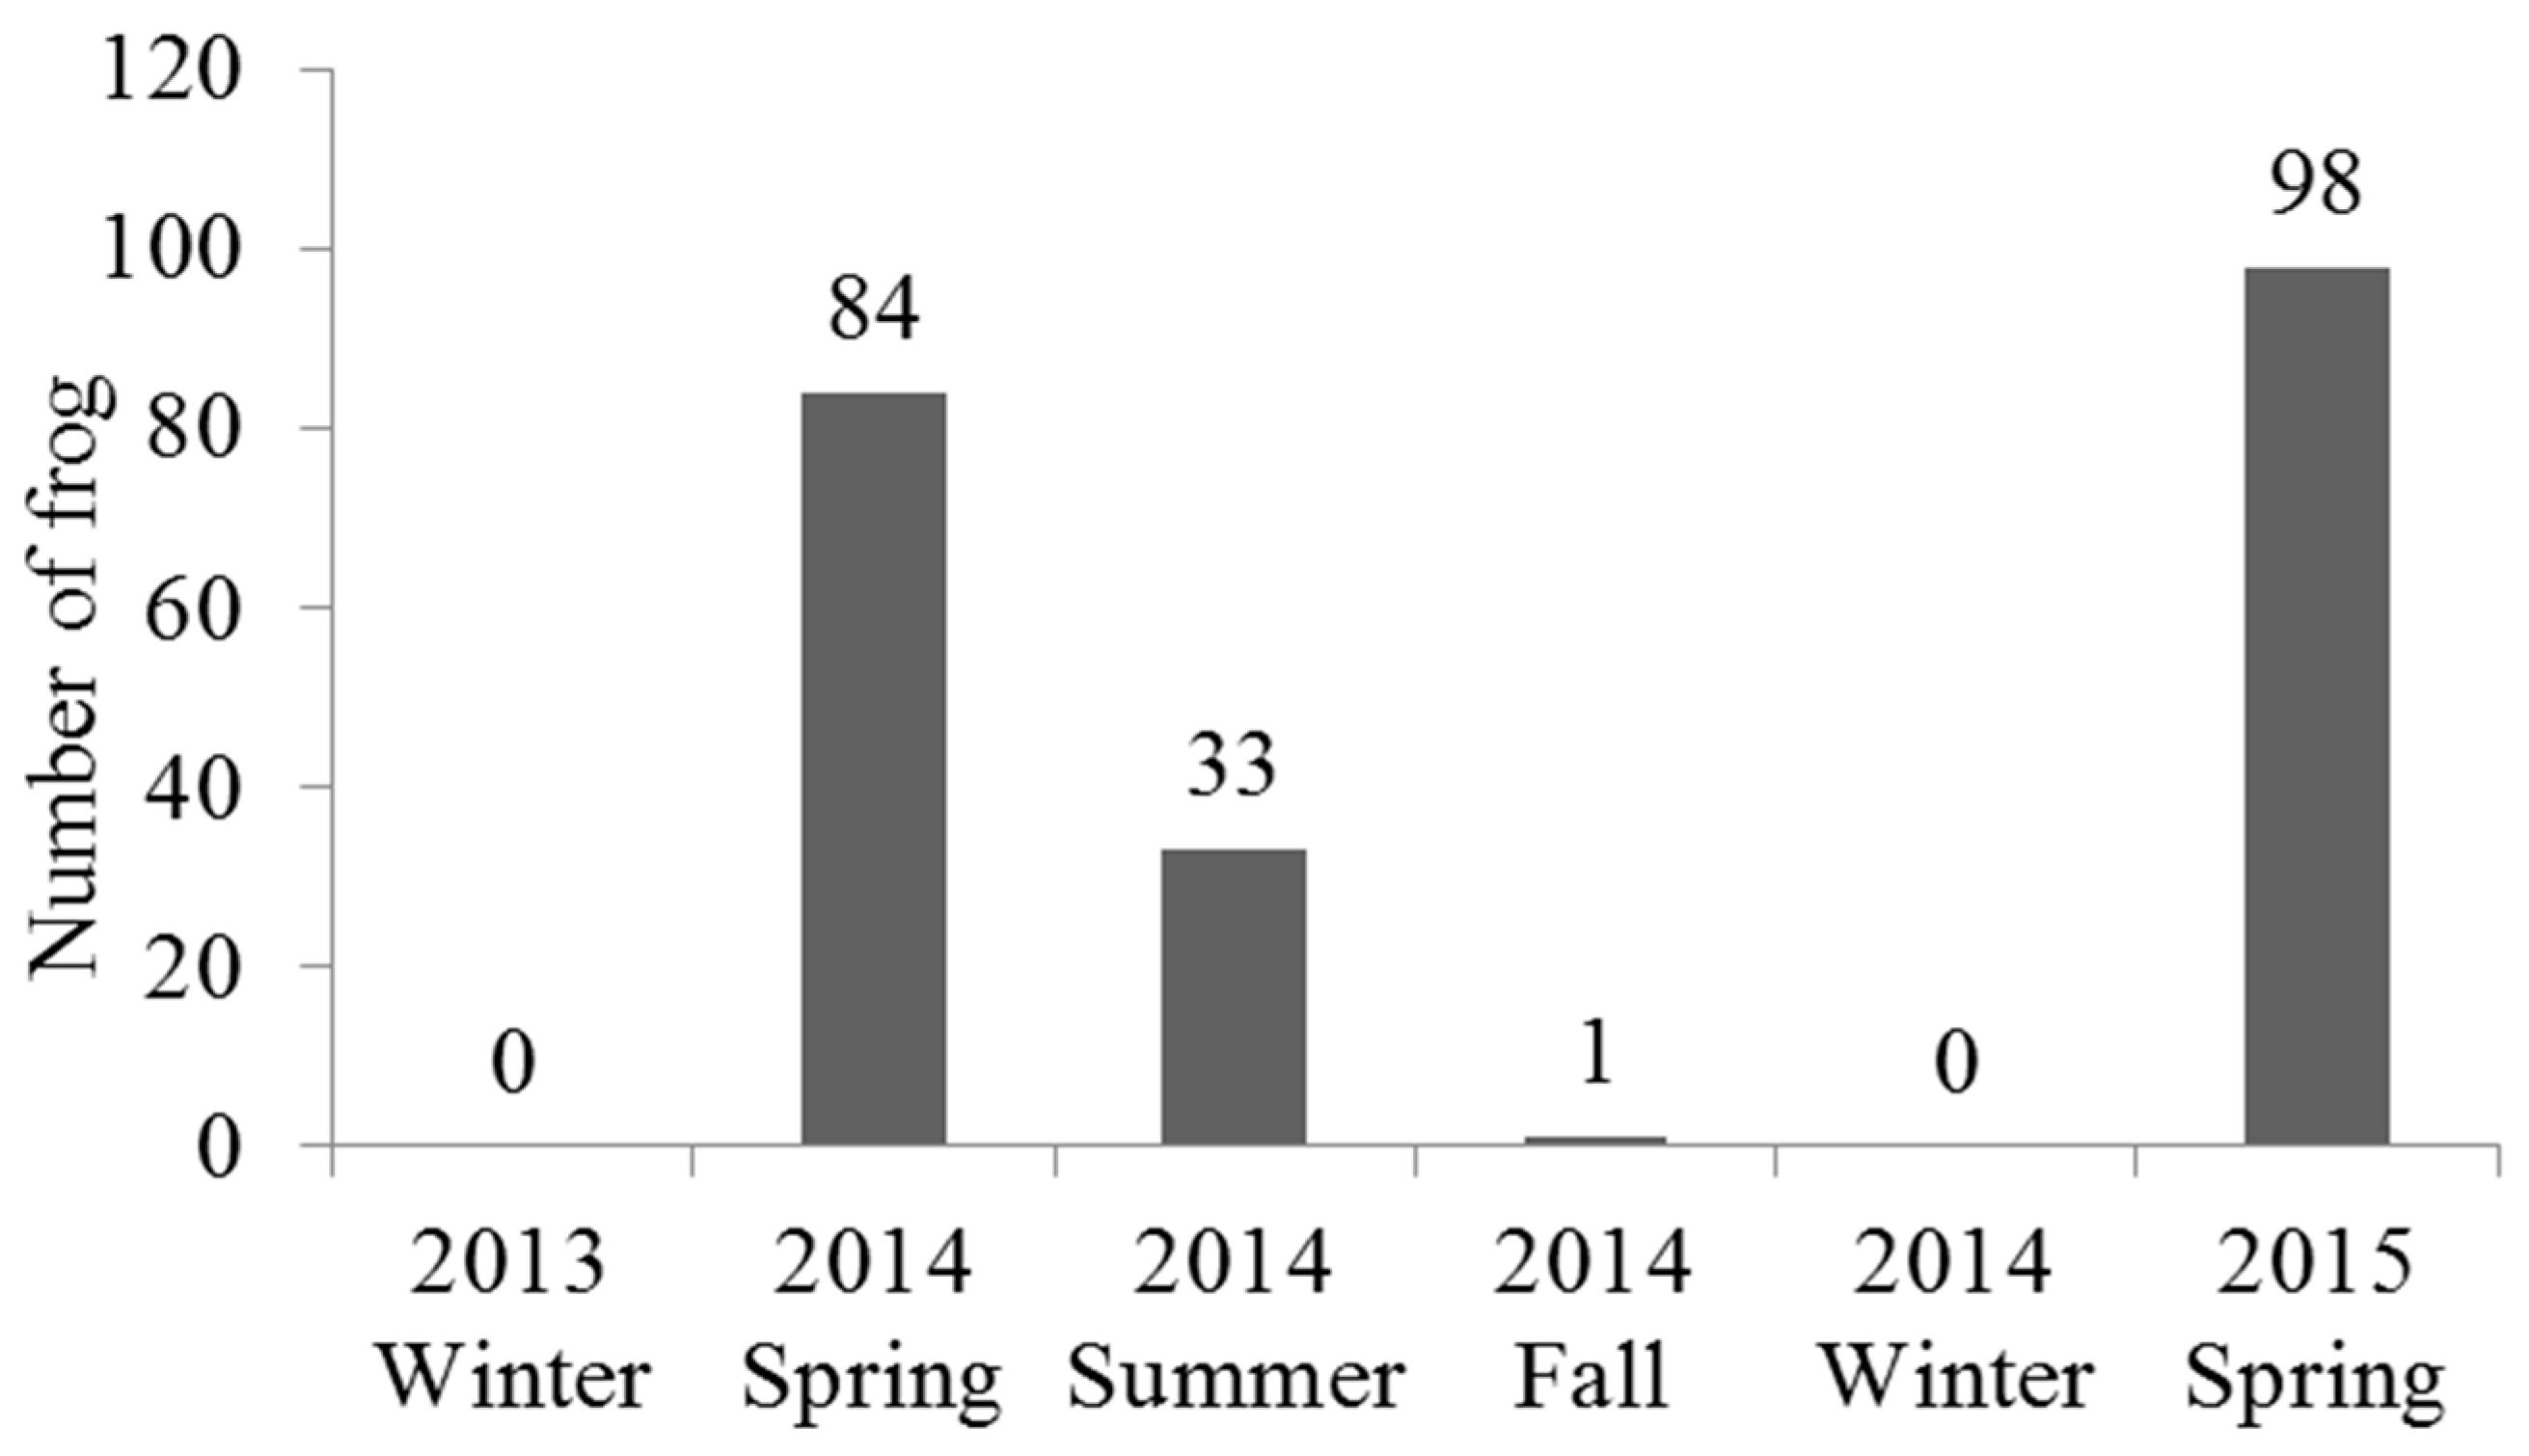
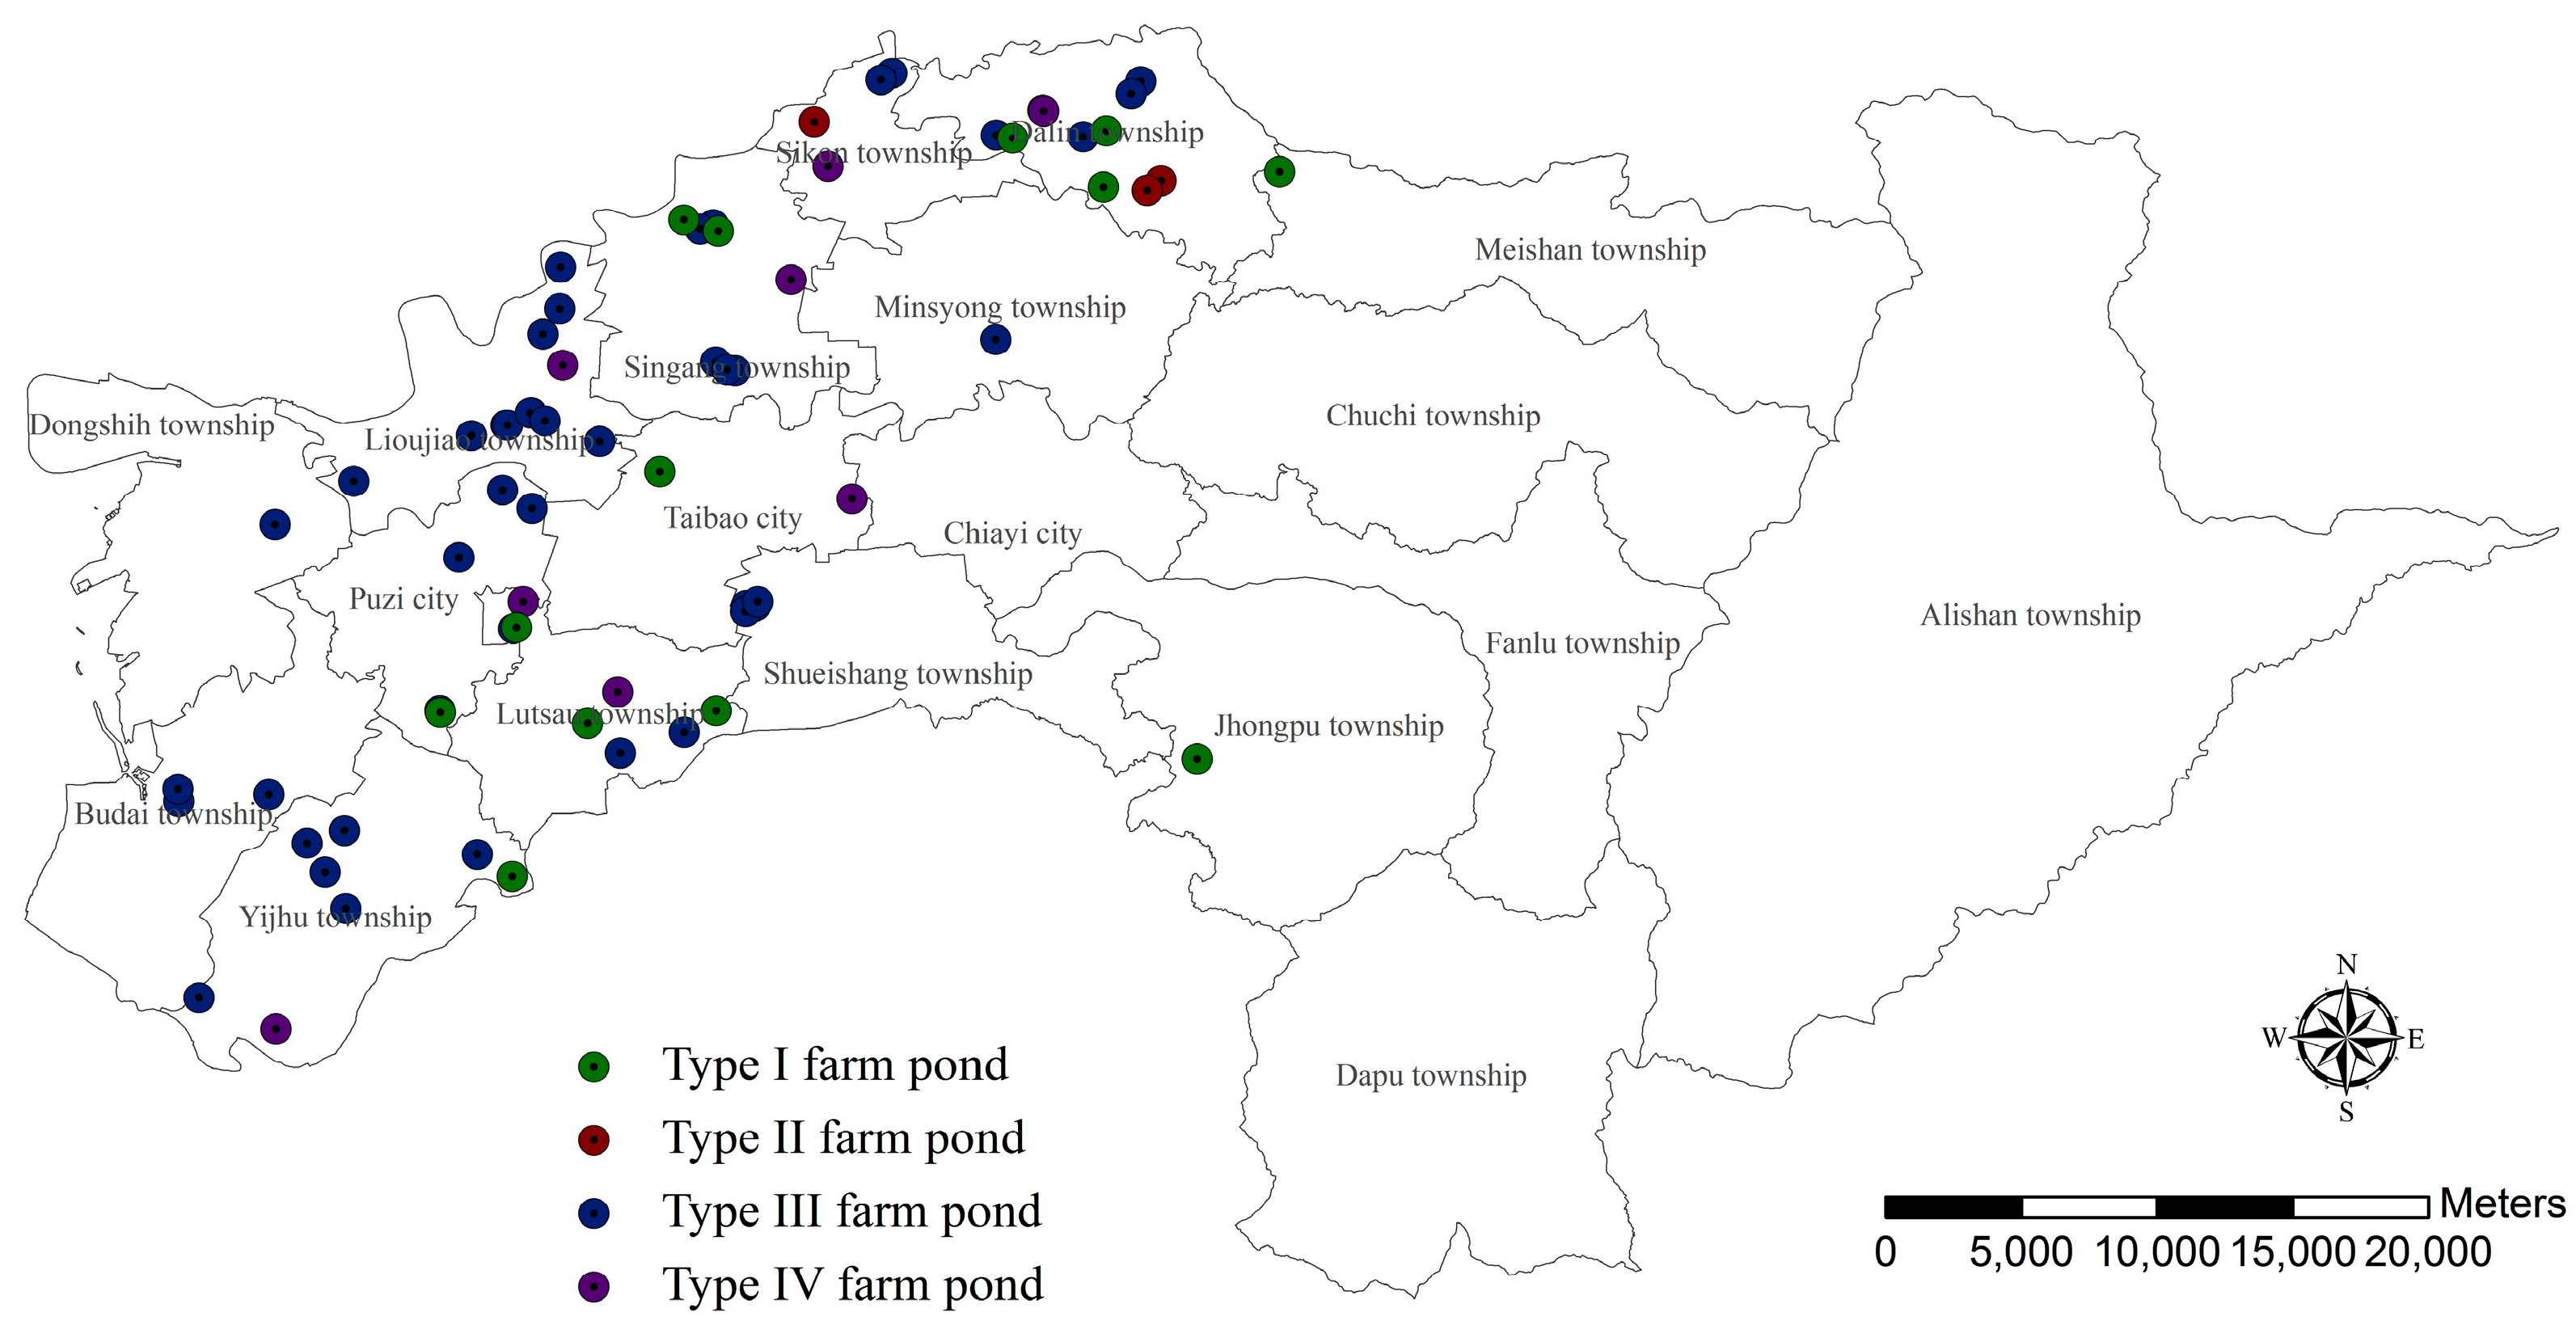
3.1. Günther’s Frog Population in Farm Ponds

Based on the results of frog surveys at 69 farm-pond sites, a total of 1638 individuals were observed, which were classified into 13 Anuran species including three in family Ranidae; three in family Rhacophoridae; three in family Microhylidae; two in family Dicroglossinae; one in family Hylidae; and one in family Bufonidae. With regard to seasonal variation, more frogs were found in spring, where a peak record of 886 of overall frog counts occurred in the spring of 2014, followed by the second peak of 416 in the spring of 2015 (Table 1). Overall, 216 Günther’s frogs were identified, with 84 frogs seen in the spring of 2014; 33 frogs were found in the summer of 2014; while one frog was observed in the fall of 2014. In the spring of 2015, 98 frogs were identified. No individual was observed in the winters of 2013 and 2014. Although frog counts were observed in the spring of 2015, Günther’s frogs were found at more locations in the spring of 2014. Specifically, 20 farm-pond sites (i.e., 28.99%) had records of the frog’s presence in the spring of 2014 while only 16 sites (23.19%) had frogs present in the spring of 2015. Furthermore, records of the frog counts in the spring of 2015 remained similar to what was observed in 2014 at 49 farm-pond sites (71.01%), but records of 12 locations varied from present to absent.

3.2. Weight Coefficients of Günther’s Frog Habitat Suitability Evaluation for Farm Ponds

The significance statistical analysis of the Hierarchy I criteria shows that the aquatic environment of the farm pond (0.305) had the highest weight coefficient (Table 2). Weight scores of the conservation perception of the residents (0.247) and terrestrial environments around the pond (0.238) illustrated the similar importance of these habitat suitability values. The weight coefficient of landscape connectivity was 0.211 which means that the species corridor of farm ponds and trenches can impact habitat suitability.
The evaluation of Hierarchy II included 10 factors: Three in the aquatic environments of farm ponds; two in the terrestrial environment around the ponds; two in the landscape connectivity; and three in the conservation perception of the residents. Regarding the overall weights of the evaluation factors in Hierarchy II, the order of importance is as follows: Terrestrial plant diversity (# of species) within a 100-m radius around the pond (0.127) had the highest relative weight; followed by distance to nearby farm pond (0.112); and the terrestrial plant abundance (plant coverage) within a 100-m radius around pond (0.111). These evaluation criteria are included under the categories of terrestrial environment around the ponds and landscape connectivity from Hierarchy I, showing the importance of expert consensus regarding the terrestrial buffer zone area and corridor connectivity of the farm pond. This result also indicated that the value of terrestrial plant diversity and abundance, and corridor connectivity are key indicators of Günther’s frog habitat suitability.
The depth of the farm ponds (0.105); vegetation coverage on the pond bank (0.102); and area ratio and distribution of pond water surfaces covered by aquatic plants (0.098) were the criteria contained in the aquatic environment of farm ponds from Hierarchy I, representing a high level of agreement among experts with respect to the aquatic environment of farm ponds. Otherwise, the value of the aquatic environment of the farm pond was higher than most of the other evaluation criteria. Residents were willing to participate in frog conservation (0.087) and also understood that farm ponds were frog habitats (0.084), as well whether residents realized the issue of frog population decrease or/and habitat degradation (0.075) were part of the criteria contained in the conservation perception of the residents from Hierarchy I, representing a high level of agreement among experts with respect to the conservation perception of the residents. However, this had the lowest weights among the evaluation factors, which revealed that the conservation perception of the residents did not equal the preservation value of the farm ponds.

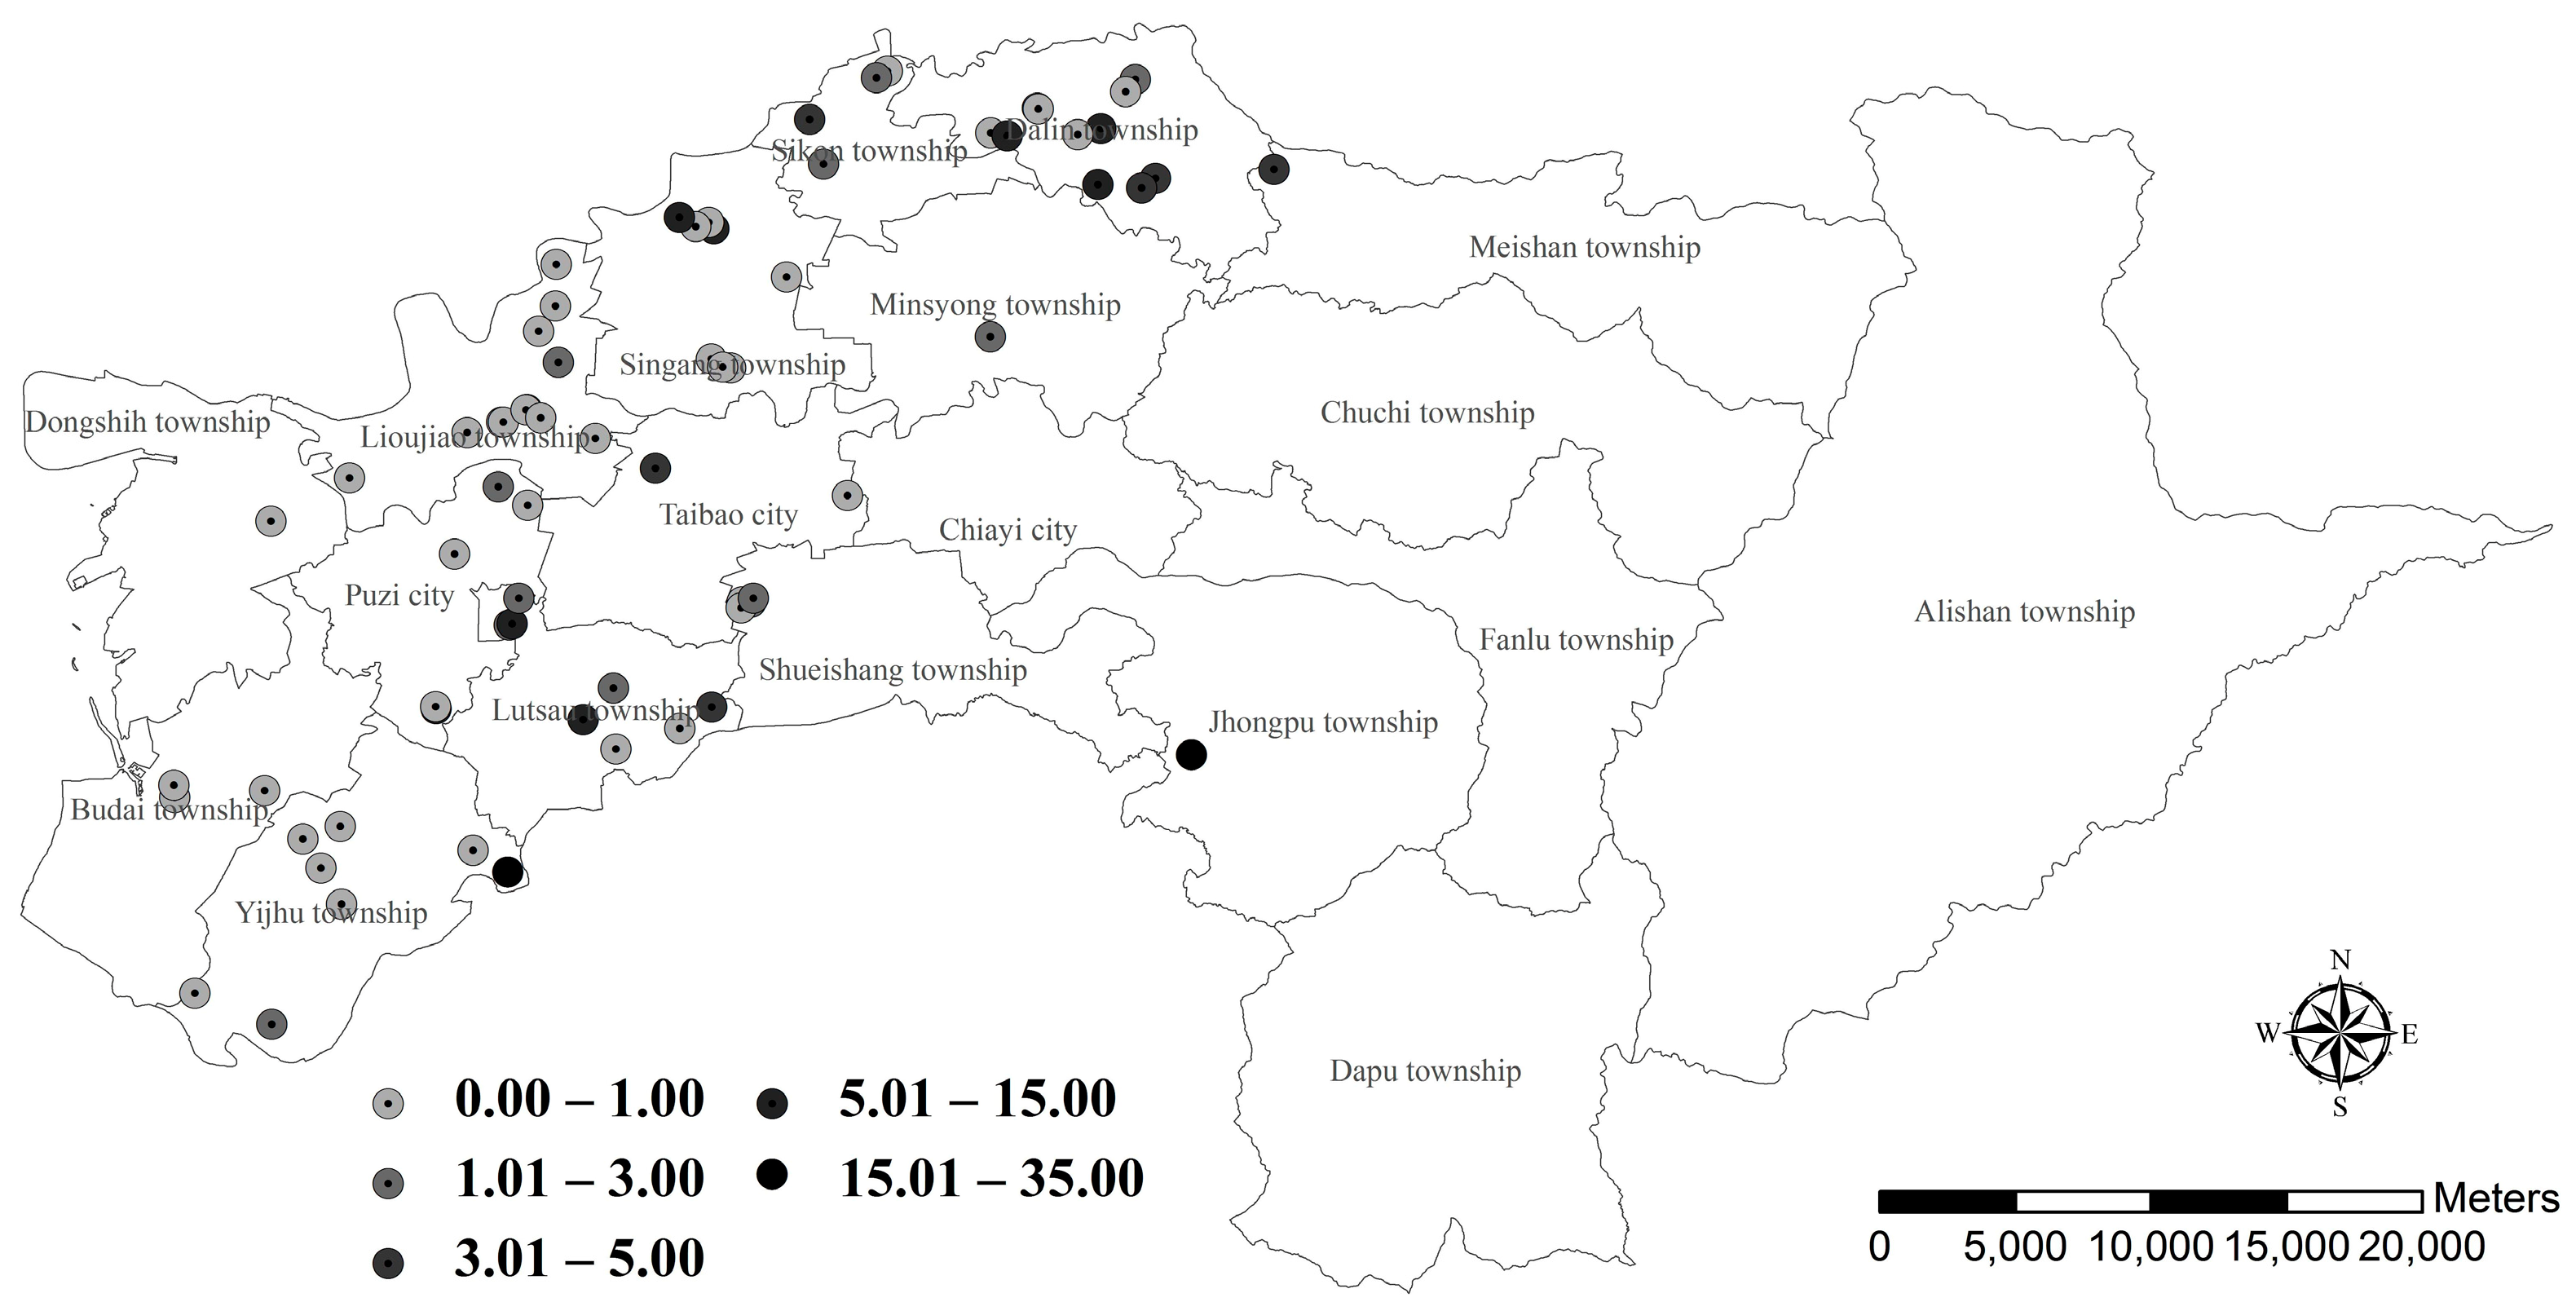
3.3. Günther’s Frog Habitat Suitability Assessment

The data from winter 2014 to spring 2015 of the 69 farm ponds in Chiayi County were evaluated according to the evaluation structure of habitat suitability assessment. The 10 evaluation criteria in second-layer factors were categorized into five levels and scored (Table 3). The habitat status of each pond was evaluated and assigned proper scores based on the on-site investigation, with a higher level and score indicating more suitable habitat conditions. The suitability value of each second-layer criterion was derived by multiplying the score of each indicator by the relative weight coefficient. Based on the hierarchical evaluating structure, we summed up the scores of all second-layer factors for each first-layer criterion. Finally, the overall suitability value of a particular farm pond was calculated by summing up the scores of all first-layer criteria.

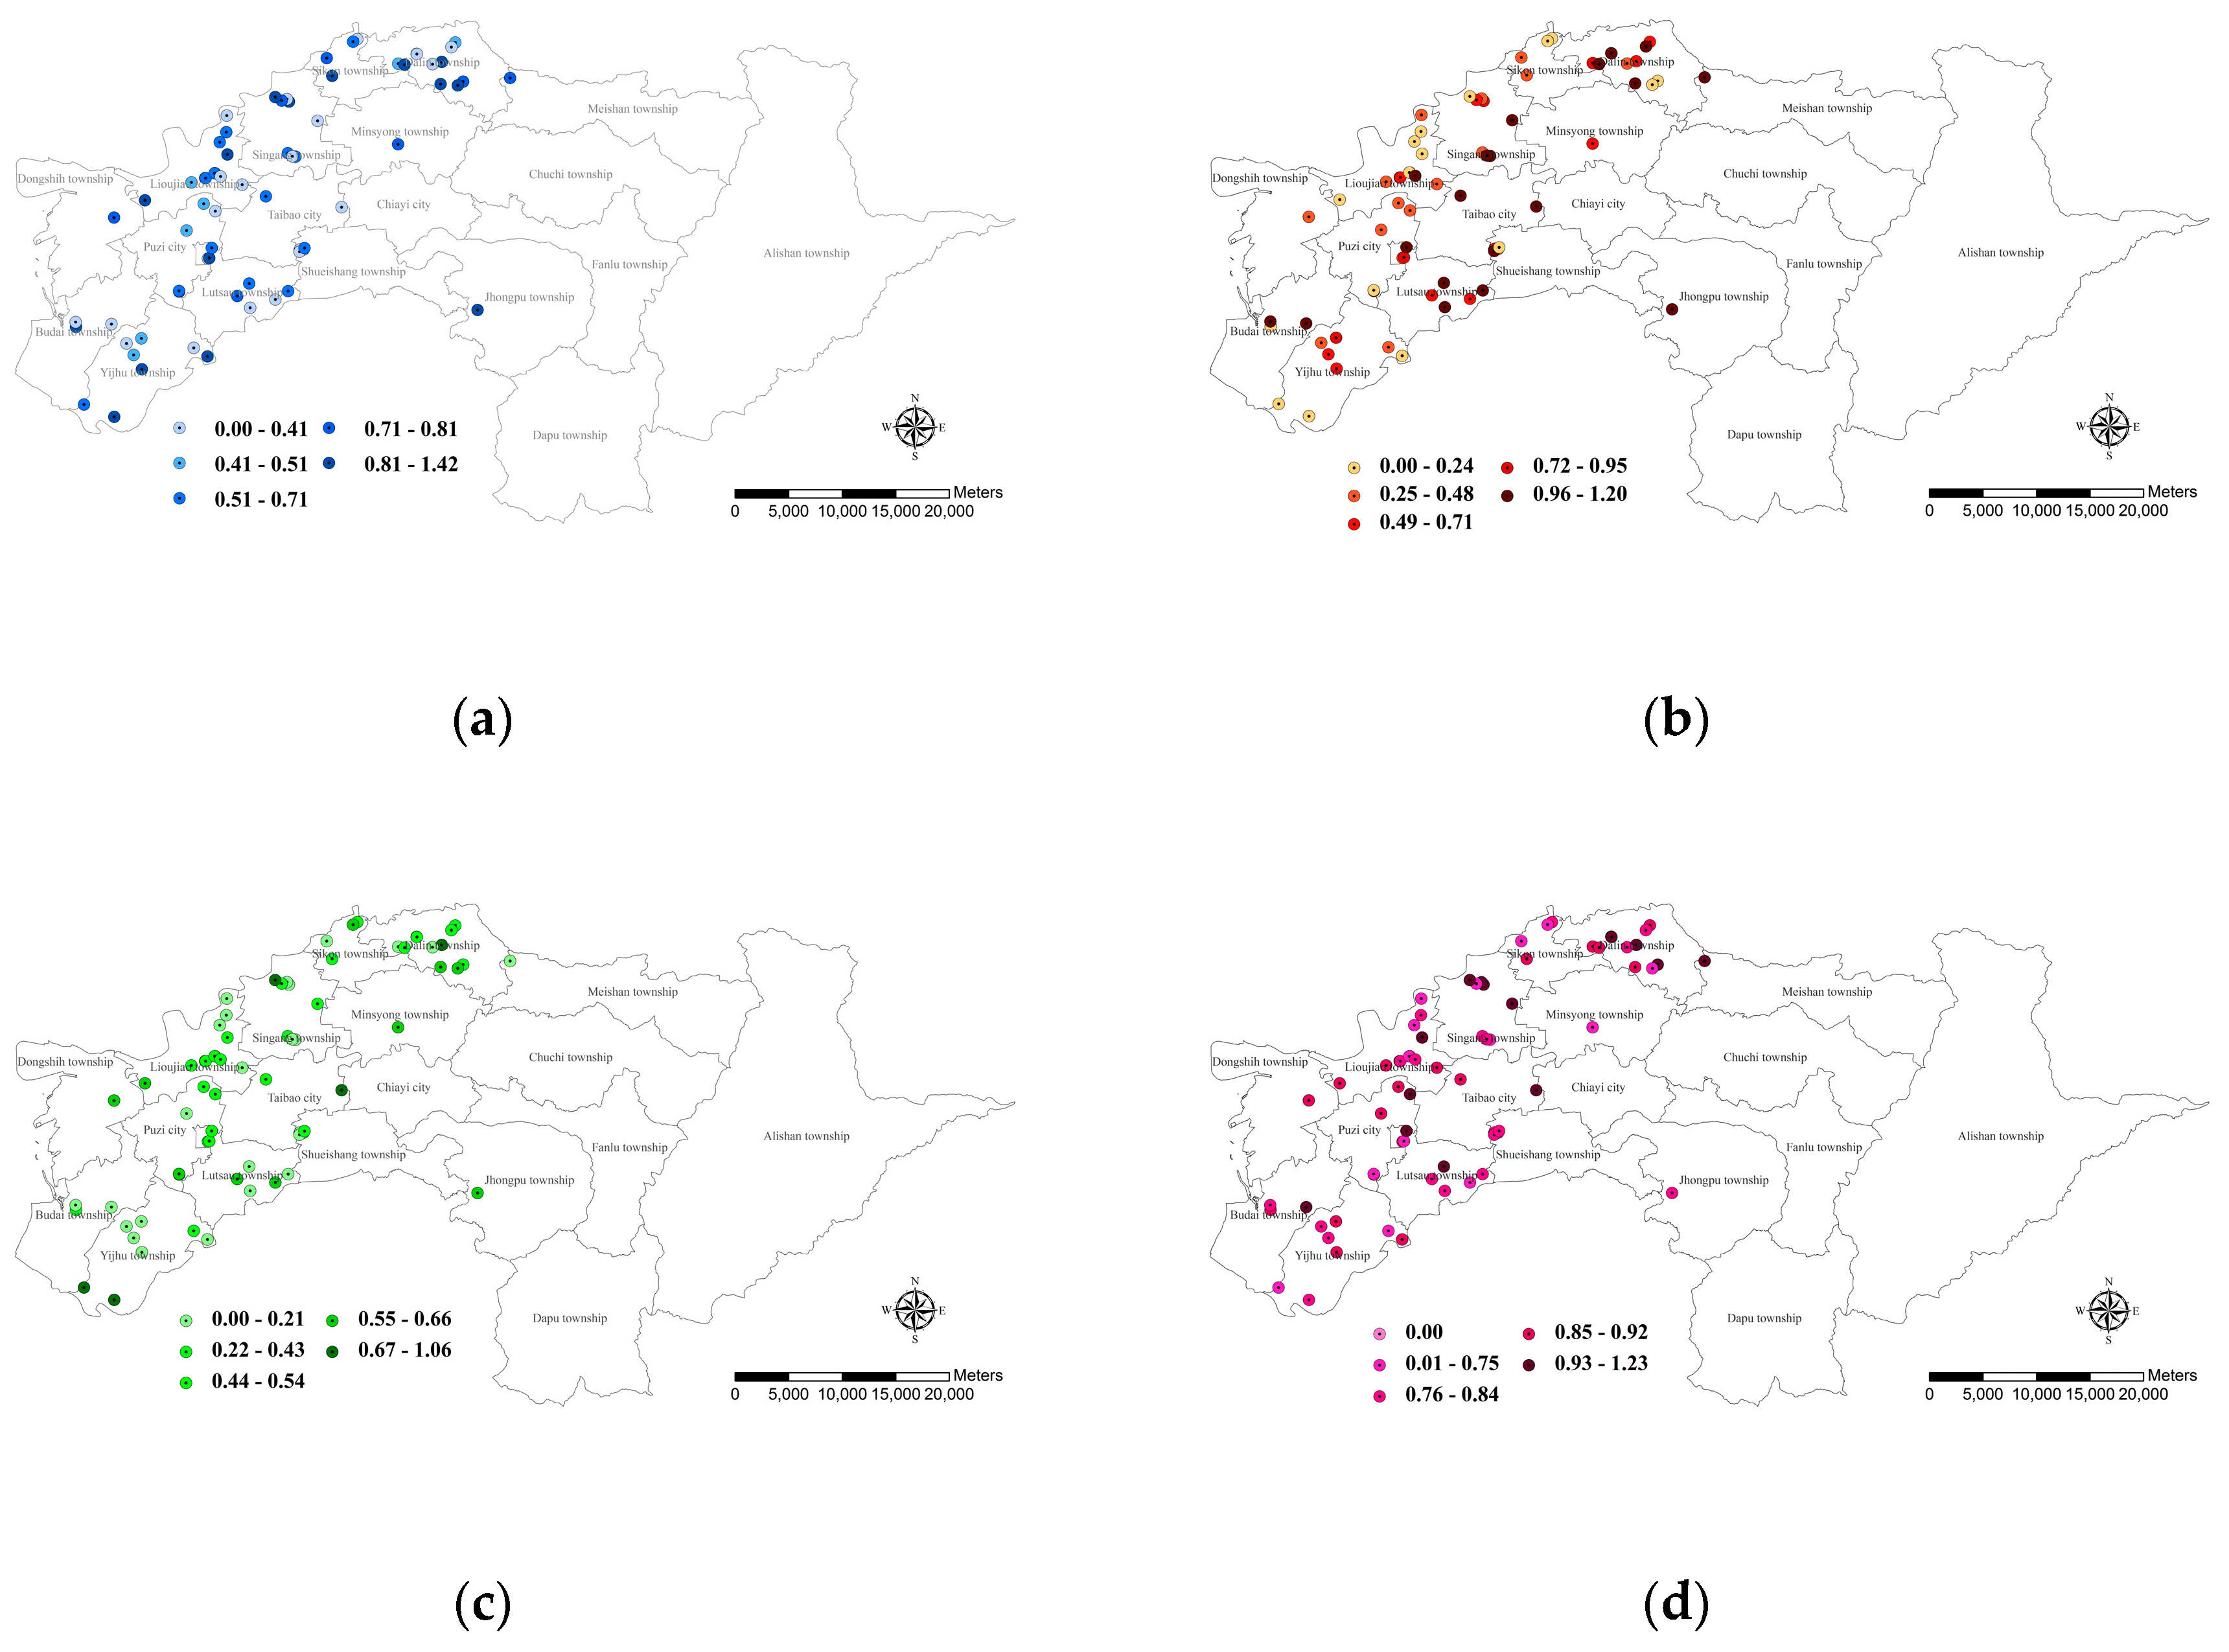
3.3.1. Farm Ponds with Aquatic Environment Value

The second-layer evaluation criteria of the aquatic environment included three indicators, which were the water depth of the farm pond; the vegetation coverage on the pond banks; and the area ratio and distribution of pond water surfaces covered by aquatic plants. The average water depth of 69 farm ponds was 126.67 cm with an average bank height of 106.95 cm. Approximately 94% of ponds had a water depth deeper than 60 cm (i.e., scores lower than 2), and there were no water ponds with a water depth less than 20 cm. Only one farm-pond site, Yizhu-Zhongping-01, gained a score higher than 4 with a water depth ranging between 20 and 40 cm. For vegetation coverage on pond banks, the average score was 2.93. The overall score distribution showed the bimodal shape of which 27.54% of sites had more than 80% of pond banks area covered by plants; and 27.54% sites with vegetation coverage less than 20% (Table 3).
The average score of the area ratio and distribution of pond water surfaces covered by aquatic plants was 1.88, which is substantially lower than the calculated value of vegetation coverage on pond banks and implies that there were more aquatic plants growing along the pond banks than actually covering the water surfaces. For example, more than 70% of ponds show the trend, where less than 25% of the ponds’ water surfaces are covered by aquatic plants and/or vegetation that does not grow along pond banks. Furthermore, there were three study sites that earned a full score (5) for this evaluating criteria. The final weight coefficient of the water depth of the farm pond; vegetation coverage on the pond banks; and the area ratio and distribution of pond water surfaces covered by aquatic plants were 0.105, 0.102 and 0.098, respectively (Table 2). The aquatic environment value was calculated by using the final weight coefficients multiplied by the indicators’ score. The range of the aquatic environments value was 0.3–1.42. Ponds with high aquatic environment values were located in the northern townships, including Dalin, Sikon, Singang and Lioujiao townships (Figure 3a).

3.3.2. Farm Ponds with Terrestrial Environment Value

Terrestrial plant diversity (i.e., the number of plant species) and plant abundance (i.e., the number of plants) within a 100-m radius around the pond were the second-layer evaluation criteria of the terrestrial environment around pond (Table 3). The 5-level evaluation scheme was determined based on the mean number of plant species (67) and the mean number of plants (202). The average score of terrestrial plant diversity within a 100-m radius around pond was 2.8, and 35 farm-pond sites (50.72%) have an evaluation score higher than the average. These high-plant-diversity ponds were mostly distributed at the Dalin Township, Xingang Township, and Lucao Township. With regard to the evaluation results of terrestrial plant diversity within a 100-m radius around pond, 30 farm-pond sites (43.28%) had scores higher than the average, 2.71. These ponds with high plant abundance showed a similar trend with the spatial distribution of ponds with high plant diversity. To sum up, the assessment of the terrestrial environment around the pond shows contrast, bimodal results where 19 farm-pond sites (26.54%) received full scores of 10, but also 18 farm ponds (26.09%) obtained lower-end scores. The final weight coefficients of terrestrial plant diversity and plant abundance within a 100-m radius around pond were 0.127 and 0.111. The range of terrestrial environments value was 0.23–1.2. Farm ponds with a high terrestrial environment value were located in Dalin, Singang and Lutsau (Figure 3b).

3.3.3. Farm Ponds with Landscape Connectivity Value

The second-layer evaluation criteria of landscape connectivity contained two indicators: the first was farm ponds connected with trenches/creeks; and the second was the distance to the nearby farm pond (Table 3). The investigation time frame was mainly set to focus on the frog’s reproduction season from winter 2014 to spring 2015. The average score of Farm ponds connected with trenches/creeks was 2.12. More than half of the study sites (52.17%, n = 36) were not connected with trenches or creeks while roughly 10% of farm ponds (n = 7) were assigned the highest score of five. Furthermore, all farm ponds with a score of five were all connected with at least two trenches or creeks and usually with shallow water that could benefit the activity of Günther’s frogs. For the evaluation results of the distances to the nearby farm ponds, more than 60% of ponds (63.77, n = 44) were assigned a score equal to one, which indicated that these ponds did not have any neighborhood ponds or buildings as a barrier between them. Thus, the mean evaluation value was at lower end, at 1.81. However, there were still a few farm-pond sites with as higher score, for example, four ponds at the Liujiao Township were assigned scores higher than four as the distances to nearby ponds were less than 10 m and were not divided by roads. The mean of the summed-up scores was 3.93, of which 36.23% of sites (n = 25) had the lowest score of two. The final weight coefficient of the categories of farm pond connected with trenches/creeks and distances to nearby farm ponds were 0.1 and 0.112. The range of landscape connectivity value was 0.21–1.06. Ponds with high landscape connectivity value were in the Dalin, Singang and Yijhu townships (Figure 3c).

3.3.4. Farm Ponds with Residents’ Conservation Perception Value

The second-layer evaluation criteria of the residents’ conservation perception consisted of three indicators: (1) that residents understand that farm ponds are frog habitats; (2) that residents realize the issue of frog population; and (3) that residents are willing to participant frog conservation. The average score for the question whether residents understand that farm ponds are frog habitats was 4.95 based on the 7-Likert scale (Table 3). It suggests that most interviewees knew that farm ponds were frog habitats. Residents in the Dalin Township showed higher scores, while residents in the Lutsau Township showed the opposite trend. Scores of the second question asking if residents realized that frog populations decrease or/and habitat degradation was 5.11, indicating that more than half of the interviewees recognized the issue. Residents in the Dalin Township had the highest score of this question while residents in Singang and Sikon showed less understanding. Furthermore, as most farm ponds in the Jhongpu Township are located in mountainous areas, these remain more like their natural habitats where the local population do not seem to be aware of whether the frog population is decreasing or not. The mean values for the third question regarding whether residents were willing to participate frog conservation was 5.71 while 76.81% of responses were assigned a score of four. This suggests that most interviewees are willing to participate in the conservation of the frog and its habitats, except for the residents in the Sikon and Lioujiao Township. The final weight coefficient of the first question, that residents understood that farm ponds are frog habitats was 0.084. The second question was assigned 0.075 as the final weight coefficient while the coefficient value for the final question was 0.087. The range of the landscape connectivity value was 0.64–1.23. Ponds with a high residents’ conservation perception value were in the Dalin Township (Figure 3d), with low values located in the Yijhu Township.

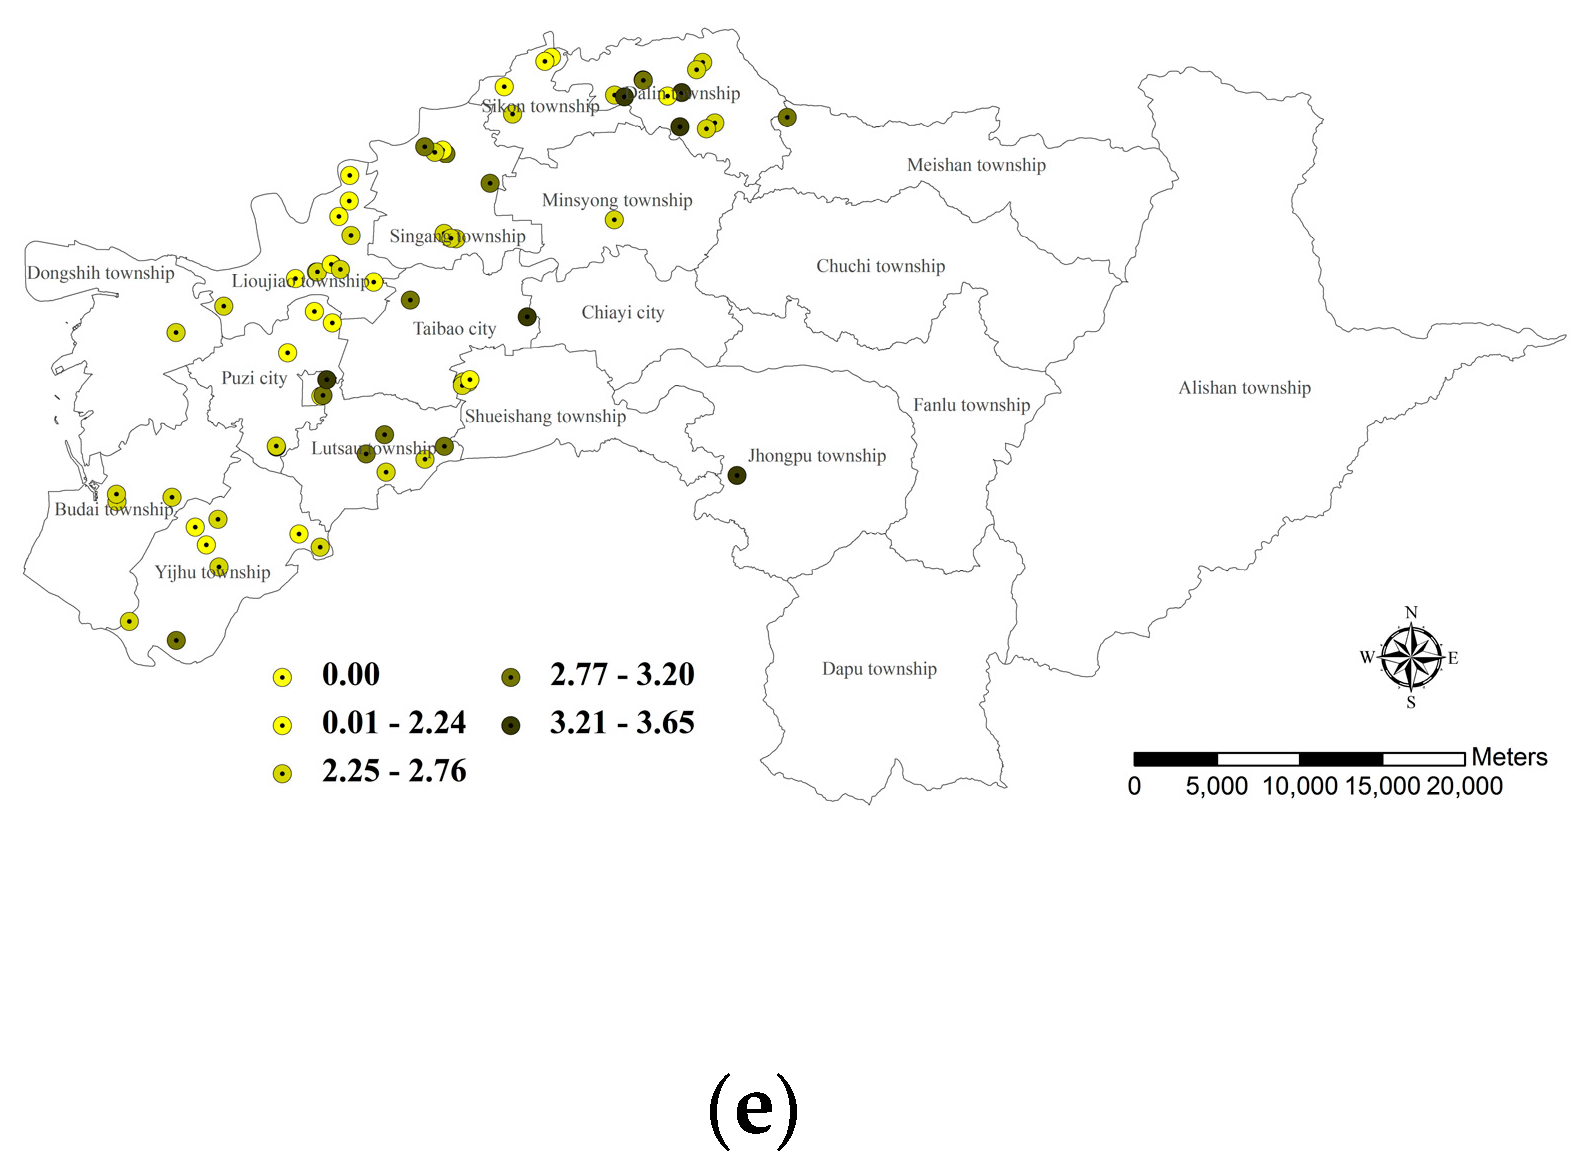
3.3.5. Farm Ponds with Overall Habitat Suitability Value

The value of overall habitat suitability was calculated by synthesizing the scores of the aquatic environment of the farm pond; terrestrial environment around ponds; landscape connectivity; and the residents’ conservation perception. The range of the values was 1.69–3.65 while the mean was 2.56. Around 17 sites (with a score higher than 2.95) were determined as “more suitable” or “better” habitats, and are located in the Lucao, Dalin and Xingang Townships. Approximately 11 sites in the Lioujiao Township with (scores less than 2.0) had the worst conditions for habitats (Figure 3e).

3.4. Reliability of Habitat Suitability Assessment

Kappa statistics have been applied to assess the predictive accuracy of the species distribution models [41,42]. In this study, it was applied to test the reliability of the habitat suitability model in this work. The mean value of the habitat suitability score was 2.645 which was set as a threshold of reliability of habitat suitability assessment. A total of 23 farm-pond sites (33.33%) had scores greater than or equal to 2.645 (Table 4). Of those farm ponds, 20 sites also showed the presence of Günther’s frogs, which were absent at the other three sites. Forty-six farm-pond sites (66.67%) had scores lower than 2.645, representing degraded habitats. In these low-score sites (lower than 2.645), 36 sites recorded a zero Günther’s frog count, despite these frogs being found at the other 10 locations. The overall accuracy was 81.16% and the Kappa test value was 0.6061. This means that there was a high reliability of the habitat suitability assessment method according to the standard set by Landis and Koch [43].

4. Discussion

4.1. Seasonal Variation and Spatial Distribution of Günther’s Frog Population

Yang and Chen [23,44] indicated that the Günther’s frog population was widely distributed through various environments in Taiwan, including low-elevation deciduous forests (i.e., elevation: 0–800 m); rice paddies; ponds; and swamps in low-altitude mountain areas. During the main breeding period from May to September, mature Günther’s frogs tend to migrate, gather at breeding sites and stay hidden in the marsh. Their preferred temperature range is from 16 to 32.5 °C with a relative humidity between 30% and 95%, and they hibernate in winter [23]. In this study, the Günther’s frog survey across all four seasons also shows a similar trend with more frog counts in spring and summer and relatively less in fall and winter (Figure 4). Furthermore, farm ponds with more frequent frog appearances were located at the southern part of Chiayi County along the Touqian River and Luliao Reservoir (Figure 5), which has lower temperatures and higher humidity.
We also realized that the stability of habitat conditions impacts the establishment of Günther’s frog, even if a small change is applied to the habitat environment. For example, our results indicated that Günther’s frogs can be seen in the spring of both 2014 and 2015 in 71.01% of farm ponds (49 out of 69), while another 12 sites had frog records only in 2014. This implies that the environmental conditions may rapidly become unsuitable for the establishment of Günther’s frog populations. Additionally, there were eight locations (11.59%) with frog appearances in 2015, which possibly refers to the improvement in the suitability of their habitat.

4.2. Günther’s Frog Habitat Suitability Impact Factors

The category referring to the aquatic environment of the farm pond was the most important characteristic influencing the habitat suitability of Günther’s frogs (relative weight coefficient: 0.305). In this study, this category was determined by the following second-layer criteria, including (1) the water depth of the farm pond; (2) the vegetation coverage on the pond banks; and (3) the area ratio and distribution of pond water surfaces covered by aquatic plants. Water depth and vegetation coverage are environmental conditions associated with the frog’s biological behavior, such as reproduction, feeding, nesting, etc. Chuang [36] recommended that the most suitable locations for frog activities and habitats had 10 cm of shallow water or flat, exposed bottoms. Results of this study show that most ponds (94.21%) had water deeper than 60 cm while only one site had a water depth less than 40 cm. Thus, regarding the behavioral capacity and preference of Günther’s frog, it suggests that the current conditions of water depth and pond bank height are not suitable. However, spawning and related activities can be benefited by improving the landscape connectivity between the aquatic and terrestrial environments by increasing the vegetation coverage on pond banks and on the water surface. Farm pond locations with less plant material along the bank were usually constructed of concrete, with steep side slopes, and/or lacking soil slopes and ditches as a buffering zone (e.g., the Dalin-Goubei Village). Furthermore, we found that plant species and abundances changed seasonally due to differences in growing seasons, which also influence habitat suitability.
The second most important criterion was the residents’ conservation perception (relative weight coefficient: 0.246). This was assessed by three survey questions: (1) if residents understood that farm ponds are frog habitats; (2) if residents realized the issue of frog population decrease or/and habitat degradation (i.e., awareness); and (3) if residents were willing to participate in frog conservation (i.e., willingness). We learned that the Dalin District Office have been advocating resident participation in the conservation of frogs and their habitats for a long time, therefore, leading to a better understanding of frog ecology, the potential risks, and their related conservation strategies. Thus, this is reflected in the survey analysis as higher scores. Another critical condition was to investigate the terrestrial environment around the pond (relative weight coefficient: 0.238). This included looking at (1) the terrestrial plant diversity (# of species) within a 100-m radius around the pond; and (2) the terrestrial plant abundance (# of plants) within a 100-m radius around the pond. Both of these factors pertain to the feeding behavior and burrowing needs of these frogs, with higher terrestrial plant diversity and abundance resulting in a more suitable habitat for Günther’s frog.
The least influential criterion was landscape connectivity (relative weight coefficient: 0.211). Farm ponds connected to nearby trenches/creeks, were considered beneficial to the migration and nesting of Günther’s frog populations, especially if the ponds were linked to a trench with a water depth less than 10 cm. Results of the field study showed that there were 36 farm ponds (52.17%) not connected to any trench. Although a few ponds had a nearby trench/creek, they were not connected to prevent sewage discharging into irrigation water resources. We also observed that the conditions of seven sites (10.14%) had more than three trenches/creeks connected, but only half of them had water; or two trenches/creeks connected and both with water, which were Dalin–Sanhe Village-01; Dalin–Shanglin Village-01; Dalin–Zhongkeng Village-02; Minxiong–Shuangfu Village-01; Xingang–Zhongzhuang Village-03; Xingang–Gonghe Village-02; and Taibao–Bixiang-01. These locations were deemed suitable habitats for Günther’s frog.

4.3. Farm Pond Habitat Management and Ecosystem Restoration for Günther’s Frog Preservation

In this study, we surveyed a total of 69 farm-pond sites, and identified 216 Günther’s frogs. The average frequency of frog counts was 3.13 per site, and the average value of habitat suitability was 2.645. Based on these two means, we performed a quadrant matrix analysis that categorized farm ponds into four types (Figure 6). The first quadrant contained locations with better habitat conditions and higher frog abundance, representing the best scenario. Thirteen farm ponds (18.84%) fit into this category, and are distributed throughout low-elevation mountains (e.g., the Meishan and Zhongpu Townships) and terrane areas (e.g., the Dalin Township; Xingang Township; Taibao City; Puzi City; Yizhu Township; and Lucao Township). We recommend conserving first quadrant farm ponds as a first priority. In order to gain the most effective outcomes, we also suggest the practice of low-impact ecotourism and the reinforcement of ecological education. There were three farm ponds in the second quadrant, which were not suitable for Günther’s frog populations. However, frog counts in this group were greater than the overall mean value of 3.13. This may have due to the limitations of frog migration capacity as it takes time and effort to reach further bodies of. Thus, it may be quite helpful for increasing frog populations by improving habitat conditions. Forty-three farm ponds (62.32%) in the third quadrant were found to have more unsuitable habitat conditions and also fewer frog counts. These ponds were mainly distributed along the coastal and plain areas such as Dalin; Minxiong; Xikou; Puzi; Lucao; and Shuishang. We suggest the development of recreation parks for the purpose of the residents’ well-being. Ten sites were assigned to the fourth quadrat, which showed high suitability but low frog presence. These results imply that it could be a good strategy to reintroduce Günther’s frog into these sites, which may have a higher potential for species restoration.

5. Conclusions

The framework of this research was to integrate the expert questionnaire and fuzzy Delphi method in assessing the habitat suitability of Günther’s frogs. Results demonstrated that the aquatic environment of farm ponds was the most critical condition, followed by the residents’ conservation perception; the terrestrial environment around the pond; and landscape connectivity. We also learned that farm ponds in the western Chiayi County had better aquatic environmental conditions, while the eastern sites had more suitable terrestrial environments. For the residents’ conservation perception, residents in the Dalin Township showed a good understanding of frog conservation. Locations with higher scores of landscape connectivity were usually located in natural areas with more trenches or creeks. Additionally, we found that spring and winter were the breeding seasons for Günther’s frog. Their reproduction and spawning grounds were usually near or at farm ponds. In particular, the north and south study sites with nearby creeks had more frog counts. The quadrant matrix method was used to analyze the results of habitat suitability assessment to assign farm ponds into four groups with different needs: habitat conservation; habitat restoration; frog restoration; and recreation development. This study has provided useful implications and references for stakeholders to develop win-win scenarios for both the conservation of Günther’s frog and to increase the well-being of the residents.

Acknowledgments

The authors would like to thank the Ministry of Science and Technology of the Republic of China, Taiwan, for financially supporting this research under Contract No. NSC 102-2410-H-005-034-MY3 and MOST 105-2621-M-005-003-MY3.

Author Contributions

Shin-Ruoh Juang established the framework and analysis methodology, performed the Günther’s frog field surveys, designed the residents’ perception questionnaire, executed the survey interviews, and performed the multi-variance analysis. Szu-Hung Chen synthesized the results of the data analysis, created tables and graphs, and wrote up the manuscript. Chen-Fa Wu determined the research rationales and objectives, performed statistical analysis and spatial distribution analysis, determined the article structure and outline, wrote up the manuscript, and acted as the corresponding author. All authors critically revised and approved the final manuscript.

Conflicts of Interest

The authors declare no conflicts of interest.

References

  1. World Bank. The World Bank Annual Report 2013. Available online: https://openknowledge.worldbank.org/handle/10986/16091 (accessed on 13 January 2017).
  2. Edvardsen, A.; Økland, R.H. Variation in plant species richness in and adjacent to 64 ponds in SE Norwegian agricultural landscapes. Aquat. Bot. 2006, 85, 79–91. [Google Scholar] [CrossRef]
  3. Fang, W.T.; Cheng, B.Y.; Shih, S.S.; Chou, J.Y.; Otte, M.L. Modelling driving forces of avian diversity in a spatial configuration surrounded by farm ponds. Paddy Water Environ. 2016, 14, 185–191. [Google Scholar] [CrossRef]
  4. Hazell, D.; Cunnningham, R.; Lindenmayer, D.; Mackey, B.; Osborne, W. Use of farm dams as frog habitat in an Australian agricultural landscape: factors affecting species richness and distribution. Biol. Conserv. 2001, 102, 155–169. [Google Scholar] [CrossRef]
  5. Wake, D.B.; Vredenburg, V.T. Are we in the midst of the sixth mass extinction? A view from the world of amphibians. Proc. Natl. Acad. Sci. USA 2008, 105, 11466–11473. [Google Scholar] [CrossRef] [PubMed]
  6. Nuno, C.; Hartel, T.; Arntzen, J.W. Amphibian pond loss as a function of landscape change—A case study over three decades in an agricultural area of northern France. Biol. Conserv. 2011, 144, 1610–1618. [Google Scholar]
  7. Scheffer, M.; Geest, G.J.; van Zimmer, K.; Jeppesen, E.; Sondergaard, M.; Butler, M.G.; Hanson, M.A.; Declerck, S.; de Meester, L. Small habitat size and isolation can promote species richness: Second-order effects on biodiversity in shallow lakes and pond. Oikos 2006, 112, 227–231. [Google Scholar] [CrossRef]
  8. Hazell, D.; Hero, J.-M.; Lindenmayer, D.; Cunningham, R. A comparison of constructed and natural habitat for frog conservation in an Australian agricultural landscape. Biol. Conserv. 2004, 119, 61–71. [Google Scholar] [CrossRef]
  9. Chou, W.W.; Lee, S.H.; Wu, C.F. Evaluate the preservation value and location of farm ponds in Yunlin County. Int. J. Environ. Res. Public Health 2014, 11, 548–572. [Google Scholar] [CrossRef] [PubMed]
  10. Céréghino, R.; Biggs, J.; Oerli, B.; Declerck, S. The ecology of European pond: defining the characteristics of a neglected freshwater habitat. Hydrobiologia 2008, 597, 1–6. [Google Scholar]
  11. Duellman, W.E.; Trueb, L. Biology of Amphibians, 6th ed.; Johns Hopkins University Press: Baltimore, MD, USA, 1994. [Google Scholar]
  12. Leong, T.M.; Lim, K.K.P. Occurrence of Günther’s frog, Hylarana Guentheri (Amphibia: Anura: Ranidae) in Singapore. Nat. Singap. 2011, 4, 135–141. [Google Scholar]
  13. Chan, S.K.F.; Cheung, K.S.; Ho, C.Y.; Lam, F.N.; Tang, W.S.M.; Lau, W.N.; Bogadek, A. A Field Guide to the Amphibians of Hong Kong; Friends of the Country Parks & Cosmos Books Limited: Hong Kong, China, 2005; p. 212. [Google Scholar]
  14. Carvalho, J.C.; Gomes, P. Habitat suitability model for European wild rabbit (Oryctolagus cuniculus) with implications for restocking. Game Wildl. Sci. 2003, 20, 287–301. [Google Scholar]
  15. Tian, B.; Zhou, Y.; Zhang, L.; Yuan, L. Analyzing the habitat suitability for migratory birds at the Chongming Dongtan Nature Reserve in Shanghai, China. Estuar. Coast. Shelf Sci. 2008, 80, 296–302. [Google Scholar] [CrossRef]
  16. Store, R.; Kangas, J. Integrating spatial multi-criteria evaluation and expert knowledge for GIS-based habitat suitability modelling. Landsc. Urban Plan. 2001, 55, 79–93. [Google Scholar] [CrossRef]
  17. Nekhay, O.; Arriaza, M.; Guzmán-Álvarez, R.J. Spatial analysis of the suitability of olive plantations for wildlife habitat restoration. Comput. Electron. Agric. 2009, 65, 49–64. [Google Scholar] [CrossRef]
  18. Dong, Z.; Wang, Z.; Liu, D.; Li, L.; Ren, C.; Tanga, X.; Jia, M.; Liu, C. Assessment of habitat suitability for waterbirds in the West Songnen Plain, China, using remote sensing and GIS. Ecol. Eng. 2013, 55, 94–100. [Google Scholar] [CrossRef]
  19. Luan, X.F.; Qu, Y.; Li, D.; Liu, S.; Wang, X.; Wu, B.; Zhu, C. Habitat evaluation of wild Amur tiger (Panthera tigris altaica) and conservation priority setting in north-eastern China. J. Environ. Manag. 2011, 92, 31–42. [Google Scholar]
  20. Jeng, T.B. Fuzzy Assessment Model for Maturity of Software Organization in Improving Its Staff’s Capability. Master’s Thesis, National Taiwan University of Science and Technology, Taipei, Taiwan, 2001; pp. 33–36. [Google Scholar]
  21. Ishikawa, A.; Amagasa, M.; Shiga, T.; Tomizawa, G.; Tatsuta, R.; Mieno, H. The Max-Min Delphi method and Fuzzy Delphi method via fuzzy integration. Fuzzy Sets Syst. 1993, 55, 241–253. [Google Scholar] [CrossRef]
  22. Yang, Y.J.; Shao, K.S.; Lee, C.E. The Field Investigation Guideline of Taiwan Anurans; Forestry Bureau, Council of Agriculture, Executive Yuan: Taipei, Taiwan, 2005. [Google Scholar]
  23. Yang, Y.J. Distribution and habitats of Taiwan Anurans. Anim. World 2010, 29, 46–49. [Google Scholar]
  24. Li, C.F.; Lue, K.Y. Altitudinal differences in temporal distribution, spatial preference and timing of breeding climax of frogs and toads in the central Taiwan. TW J. Biodivers. 2004, 6, 39–50. [Google Scholar]
  25. Fang, H.H.; Lin, C.C.; Yang, Y.L.; Cheng, H.C.; Yang, Y.C. Suggestions on developing an investigation scheme for identifying terrestrial animal biodiversity hotspots of Taiwan with the wildlife database. TW J. Biodivers. 2010, 13, 51–68. [Google Scholar]
  26. Chiayi County Government. Report of Assessing Environmental Resource of Farm Ponds in Chiayi County; Chiayi County Government: Chiayi County, Taiwan, 2012.
  27. Wei, W.L.; Chang, W.C. A study on selecting optimal product design solution using fuzzy Delphi method and analytic. J. Des. 2007, 10, 59–76. [Google Scholar]
  28. Chou, W.W. A Study on Evaluation and Strategies for the Conservation Value of Farm Ponds in Yunlin County. Ph.D. Dissertation, National Cheng Kung University, Tainan, Taiwan, 2014. [Google Scholar]
  29. Kam, Y.C.; Wu, C.S.; Hsu, M.Y.; Lin, Y.H.; Chung, M.F. The survey method and technology for amphibians and reptiles. In Symposium of Integrated Biological Resource Survey and Manpower Training; The Plant Protection Society of Republic of China: Taichung, Taiwan, 2004; pp. 1–29. [Google Scholar]
  30. Pearman, P.B.; Velasco, A.M.; Lopez, A. Tropical amphibian monitoring: A comparison of methods for detecting inter-site variation in species composition. Herpetologica 1995, 51, 325–337. [Google Scholar]
  31. Parris, K.M. Amphibian surveys in forests and woodlands. Contemp. Herpetol. 1999, 1, 1–16. [Google Scholar]
  32. Parris, M.K.; Norton, W.T.; Cunningham, B.R. A comparison of techniques for sampling amphibians in the forests of south-east Queensland, Australia. Herpetologica 1999, 55, 271–283. [Google Scholar]
  33. Aichinger, M. Annual activity pattern of anurans in a seasonal neotropical environment. Oecologia 1987, 71, 583–592. [Google Scholar] [CrossRef]
  34. Saito, H.; McKenna, S.A.; Goovaerts, P. Accounting for geophysical information in geostatistical characterization of unexploded ordnance (UXO) sites. Environ. Ecol. Stat. 2005, 12, 7–25. [Google Scholar] [CrossRef]
  35. Lin, Y.P.; Chu, H.J.; Wu, C.F.; Verburg, P.H. Predictive ability of logistic regression, auto-logistic regression and neural network models in empirical land-use change modeling—A case study. Int. J. Geogr. Inform. Sci. 2011, 25, 65–87. [Google Scholar] [CrossRef] [Green Version]
  36. Chuang, M.H. Survey Report of Amphibians in Guantian Pheasant-Tailed Jacana Conservation Area; Wetlands Taiwan: Taichung, Taiwan, 2003; Volume 45, pp. 24–31. [Google Scholar]
  37. Yang, Y.C. Frog-Watching Map, 1st ed.; Morning Star: Taichung, Taiwan, 2009. [Google Scholar]
  38. Chiang, H.J. Study on Food Habits of Six Frog Species Community in a Still Water Pond Located in the Beipu Area, Hsinchu. Master’s Thesis, National Taipei University of Education, Taipei, Taiwan, 2013. [Google Scholar]
  39. Tang, L.C. Identification guidelines for quarantine pest larva of Coleoptera, Lipedoptera and Diptera. In Special Issue or the Symposium on Diagnosis of Plant Pests and Case Study; Bureau of Animal and Plant Health Inspection and Quarantine, Council of Agriculture: Taipei, Taiwan, 2006; Volume 6, pp. 73–103. [Google Scholar]
  40. Wu, C.F.; Li, M.H.; Cheng, S.H.; Chou, W.W. Assessing the Ecological Value and Residents’ Perception of Farm Pond Habitat Conservation. In Proceedings of the Council of Educators in Landscape Architecture Conferences, Baltimore, MD, USA, 26–29 March 2014.
  41. Hanspach, J.; Kühn, I.; Pompe, S.; Klotz, S. Predictive performance of plant species distribution models depends on species traits. Perspect. Plant Ecol. Evol. Syst. 2010, 12, 219–225. [Google Scholar] [CrossRef]
  42. Bennetsen, E.; Gobeyn, S.; Goethals, P.L.M. Species distribution models grounded in ecological theory for decision support in river management. Ecol. Model. 2016, 325, 1–12. [Google Scholar] [CrossRef]
  43. Landis, J.R.; Koch, G.G. The measurement of observer agreement for categorical data. Biometrics 1977, 33, 159–174. [Google Scholar] [CrossRef] [PubMed]
  44. Chen, K.L. Feasibility of an Ecological Corridor Establishment Using the Least-Cost-Analysis—A Case Study between Taroko and Shei-Pa National Parks. Master’s Thesis, National Dong Hwa University, Hualien County, Taiwan, 2003. [Google Scholar]
Figure 1. Location of study area and farm ponds.
Sustainability 09 00278 g001
Figure 2. Schematic diagram of the fuzzy Delphi method: (a) no gray area with huge differences among experts; (b) gray areas stand for the allowance of a few option differences among experts; and (c) not only contains gray areas, but also allows a large gap in cognition among experts.
Sustainability 09 00278 g002
Figure 3. Günther’s frog habitat suitability assessment: (a) distribution of farm ponds with aquatic environment evaluation values; (b) distribution of farm ponds with terrestrial environment evaluation values; (c) distribution of farm ponds with landscape connectivity evaluation values; (d) distribution of farm ponds with the values of the conservation perception of the residents; and (e) distribution of farm ponds with Günther’s frog habitat suitability assessment.
Sustainability 09 00278 g003aSustainability 09 00278 g003b
Figure 4. Total number of Günther’s frog observed in each survey season.
Sustainability 09 00278 g004
Figure 5. Locations and spatial distribution of accumulated records of the presence of Günther’s frog from winter 2013 to spring 2015.
Sustainability 09 00278 g005
Figure 6. Locations of the four types farm ponds.
Sustainability 09 00278 g006
Table 1. Seasonal frog surveys at 69 farm-pond sites from winter 2013 to spring 2015.
FamilyCommon/Species Name201320142014201420142015Total
WinterSpringSummerFallWinterSpring
RanidaeGünther’s frog
Hylarana guentheri
084331098216
Kuhl’s creek frog Limnonectes kuhlii0400004
Latouchti’s frog Hylarana latouchii08220719
RhacophoridaeFarmland tree frog Rhacophorus arvalis089603012164
Brauer’s tree frog Polypedates braueri0300003
Spot-legged tree frog Polypedates megacephalus0000033
MicrohylidaeOrnate narrow-mouthed toad Microhyla fissipes01101390063312
Heymons’ narrow-mouthed toad Microhyla heymonsi0300003
Stejneger’s narrow-mouthed toad Micryletta steinegeri000008080
DicroglossinaeRice field frog Fejervarya limnocharis0258730065396
Chinese bull frog Hoplobatrachus rugulosus0000011
BufonidaeSpectacled toad Duttaphrynus melanosticus03211310087431
HylidaeCommon Chinese tree toad
Hyla chinensis
0600006
Total08863201604161638
Table 2. Weight coefficients of Günther’s frog habitat suitability evaluation for farm ponds.
First-Layer Evaluation CriteriaSecond-Layer Evaluation CriteriaFinal Weight Coefficient (A × B)RankingRef.
Main CategoryRelative Weight Coefficient (A)Sub-Category: Specific IndicatorsRelative Weight Coefficient (B)
Aquatic environments of farm pond0.305Water depth of farm pond0.3450.1054[12,36]
Vegetation coverage on pond banks0.33380.1025[12,37]
Area ratio and distribution of pond water surfaces covered by aquatic plants0.32110.0987[8,37]
Terrestrial environments around pond0.238Terrestrial plant diversity (# of species) within 100-m radius around pond0.5320.1271[38,39]
Terrestrial plant abundance (# of plants) within 100-m radius around pond0.4680.1123[38,39]
Landscape connectivity0.211Farm pond connected with trenches/creeks0.4710.1006[36,37]
Distance to nearby farm pond0.5300.1122[36,37]
Residents’ conservation perception0.247Residents understand that farm pond are frog habitats0.3420.0849[40]
Residents realize frog population decrease or/and habitat degradation0.3040.07510[40]
Residents are willing to participate frog conservation0.3550.0878[40]
Table 3. Evaluation criteria of Günther’s frog habitat suitability assessment.
Evaluation CriteriaScore = 1Score = 2Score = 3Score = 4Score = 5
ExplanationnExplanationnExplanationnExplanationnExplanationn
Aquatic Environments of farm pondWater depth of farm pondWater depth ≥80 cm53
(76.82%)
80 cm > Water depth ≥60 cm12
(17.39%)
60 cm > Water depth ≥40 cm3
(4.35%)
40 cm > Water depth ≥20 cm1
(1.45%)
Water depth <20 cm0
(0%)
Vegetation coverage on pond banksVegetation coverage <20%19
(27.54%)
20%≤ Vegetation coverage <40%13
(18.84%)
40%≤ Vegetation coverage <60%10
(14.49%)
60%≤ Vegetation coverage <80%8
(11.59%)
Vegetation coverage ≥80%19
(27.54%)
Area ratio and distribution of pond water surfaces covered by aquatic plantsArea ratio of water surface covered by aquatic plants <25%, but <50% aquatic plants growing along pond banks31
(44.93%)
Area ratio of water surface covered by aquatic plants <25%, and ≥50 plants growing along pond banks22
(31.88%)
25%≤ Area ratio of water surface covered by aquatic plants <50%, and ≥50% plants growing along pond banks12
(17.39%)
50%≤ Area ratio of water surface covered by aquatic plants < 75%, and ≥50% plants growing along pond banks1
(1.45%)
75%≤ Area ratio of water surface covered by aquatic plants, and ≥50% plants growing along pond banks3
(7.25%)
N/A25%≤ Area ratio of water surface covered by aquatic plants <50%, but <50% aquatic plants growing along pond banks50%≤ Area ratio of water surface covered by aquatic plants <75%, but <50% aquatic plants growing along pond banks75%≤ Area ratio of water surface covered by aquatic plants, but <50% aquatic plants growing along pond banks75%≤ Area ratio of water surface covered by aquatic plants, and ≥50% plants growing along pond banks
Terrestrial environments around pondTerrestrial plant diversity (# of species) within 100-m radius around pondNumber of terrestrial plant species <5018
(26.97%)
50≤ Number of terrestrial plant species <6016
(23.19%)
60≤ Number of terrestrial plant species <7010
(14.49%)
70≤ Number of terrestrial plant species <806
(8.7%)
Number of terrestrial plant species ≥8019
(27.54%)
Terrestrial plant abundance (# of plants) within 100-m radius around pondNumber of terrestrial plants <17027
(39.13%)
170≤ Number of terrestrial plants <19012
(17.39%)
190≤ Number of terrestrial plants <2105
(7.25%)
210≤ Number of terrestrial plants <2304
(5.80%)
Number of terrestrial plants ≥23021
(30.43%)
Landscape connectivityFarm pond connected with trenches/creeksNo trench/creek connected36
(52.17%)
1 dry trench/creek connected9
(13.04%)
1 with-water trench/creek connected11
(15.94%)
1 dry trench/creek and 1 with-water trench/creek connected6
(8.7%)
≥3 trenches/creeks connected, but half of them with water7
(10.14%)
No trench/creek connected1 dry trench/creek connected2 dry trenches /creeks connected≥3 trenches/Creeks connected, but half of them without water2 trenches/creeks connected and both with water
Distances to nearby farm pondNo nearby farm pond44
(63.77%)
Distances <15 m, but separated by roads9
(13.04%)
11 m ≤ Distances ≤15 m, but separated by roads4
(5.80%)
11 m ≤ Distances ≤15 m, and not separated by roads9
(13.04%)
Distances <10 m, and not separated by roads3
(7.25%)
Blocked by buildingsDistances <15 m, but separated by roadsDistances >15 m, and not separated by roadsDistances <10m, but separated by roadsMore than 2 farm ponds within 15 m, and not separated by roads
Residents’ conservation perceptionResidents understand that farm pond are frog habitat.x ≤34
(5.80%)
3< x ≤413
(18.84%)
4< x ≤523
(33.33%)
5< x ≤625
(36.23%)
6< x ≤74
(5.80%)
Residents realize the issue of frog population decrease or/and habitat degradationx ≤33
(7.25%)
3< x ≤44
(5.80%)
4< x ≤525
(26.23%)
5< x ≤635
(50.72%)
6< x ≤72
(2.90%)
Residents are willing to participate frog conservationx ≤30
(0%)
3< x ≤42
(2.9%)
4< x ≤58
(11.59%)
5< x ≤653
(76.82%)
6< x ≤76
Table 4. Kappa test of the habitat suitability assessment and presence of Günther’s frog.
ItemsThreshold of Habitat Suitability: 2.645Total (%)
HigherLower
Presence of Günther’s frogYes201030
(28.99%)(14.49%)(43.48%)
No33639
(4.35%)(52.17%)(56.52%)
Total234669
(33.33%)(66.67%)(100%)

