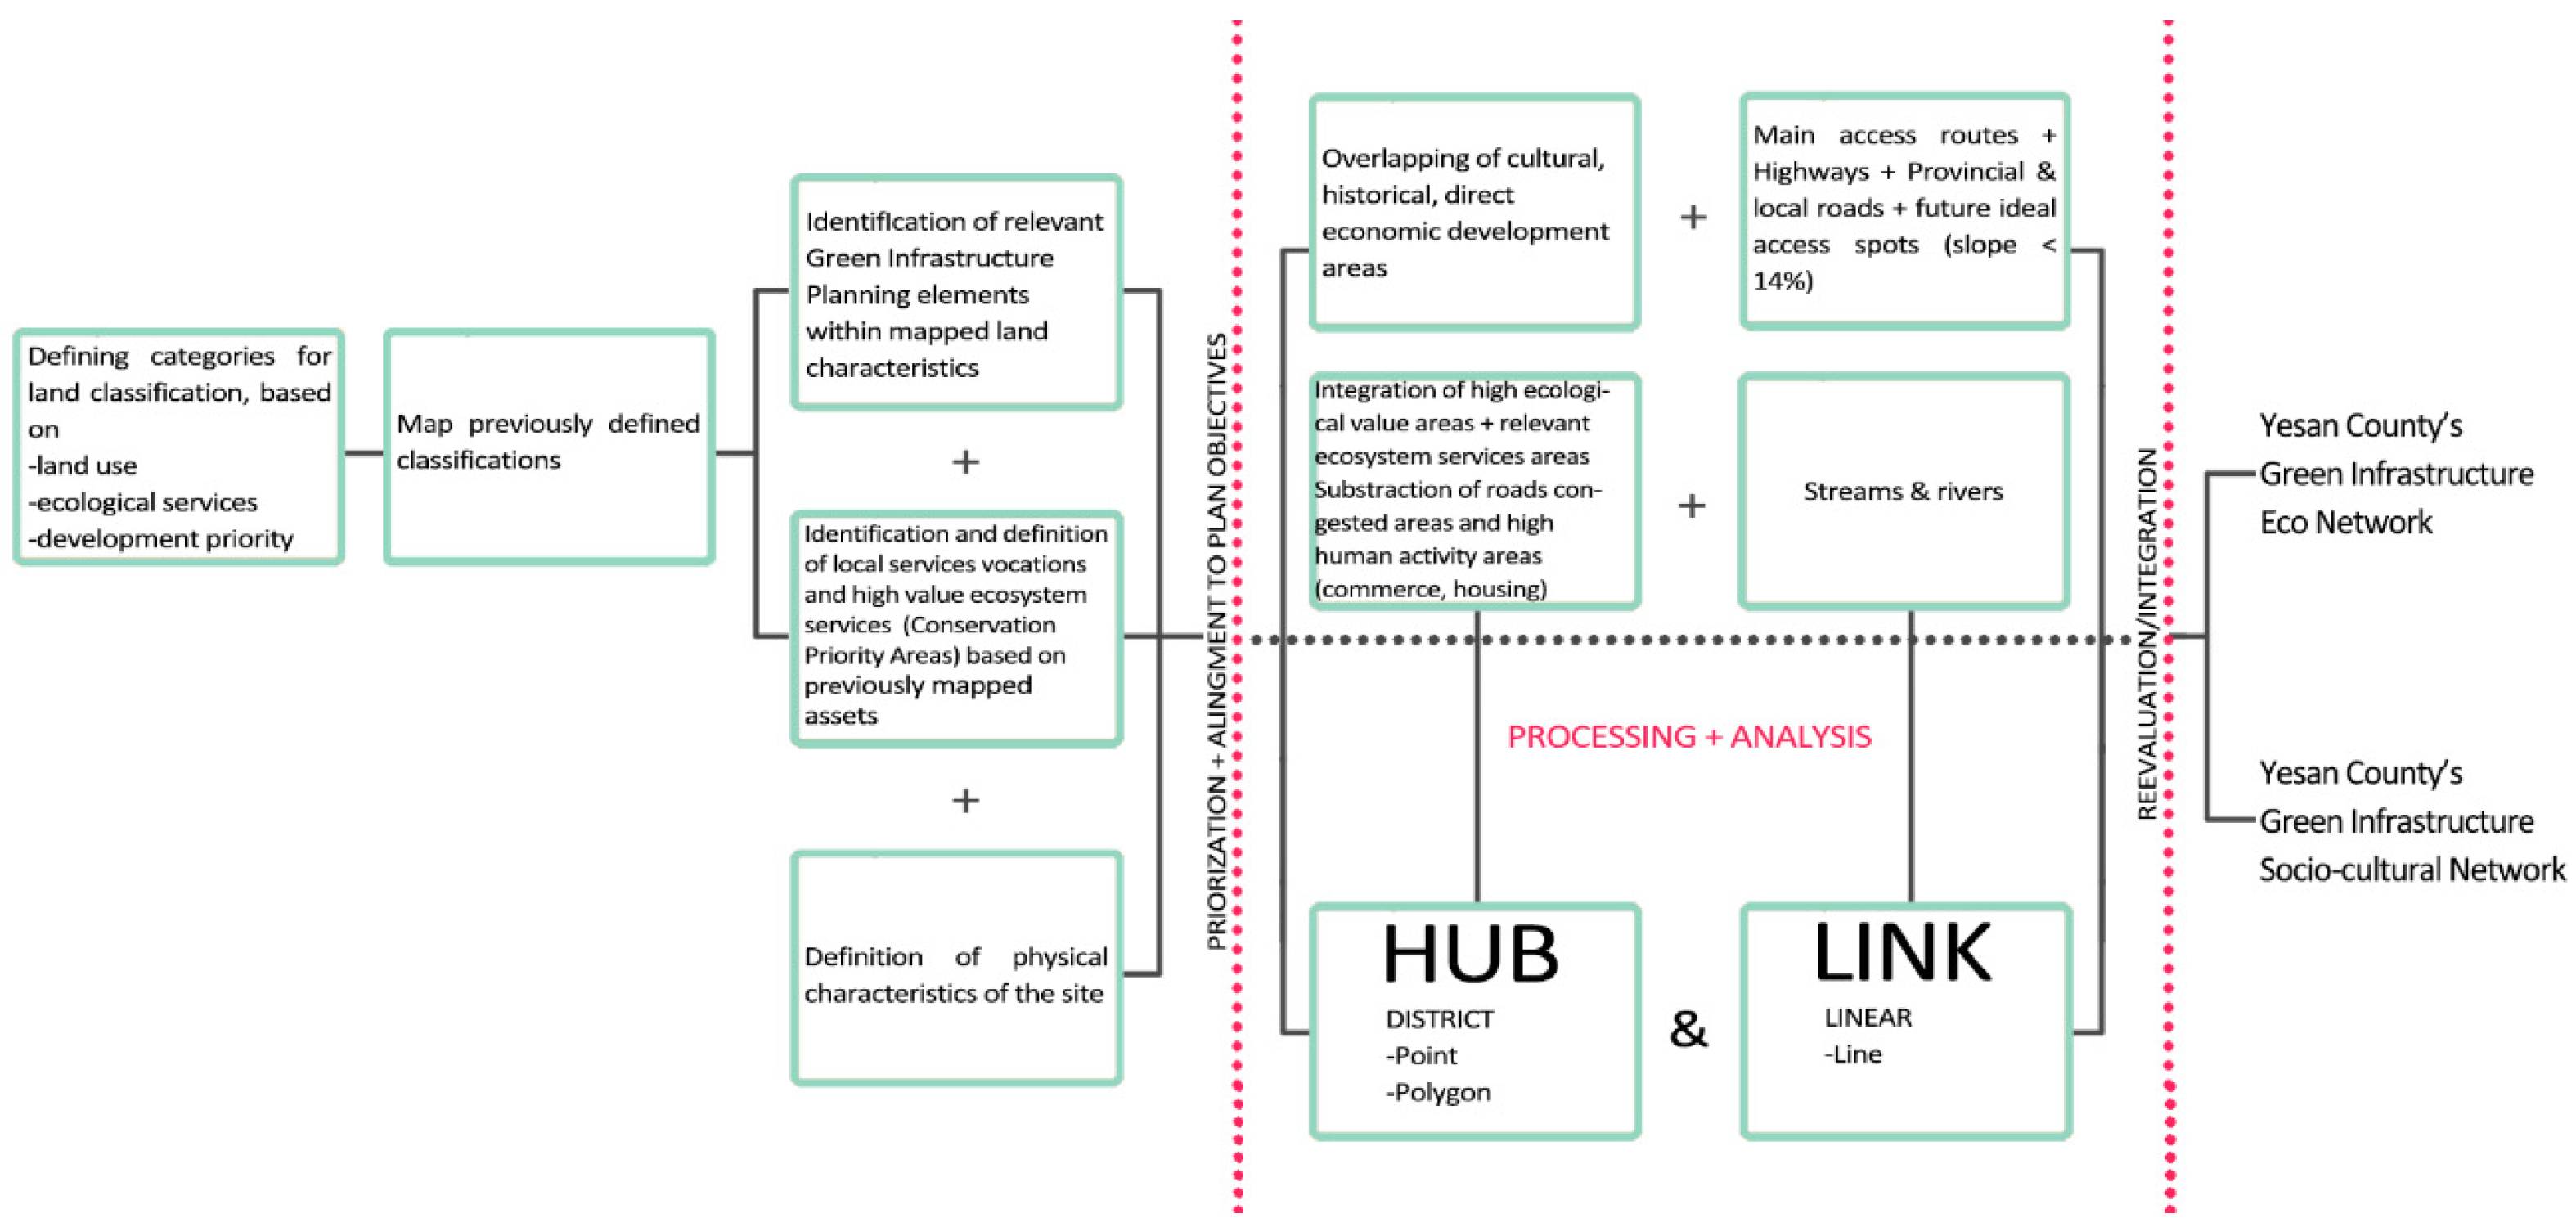
Article

Socio-Cultural Asset Integration for a Green Infrastructure Network Plan in Yesan County, Korea

by
María José Carranza Orantes
1,
Jinki Kim
1,* and
Jiseok Kim
2
1
Department of Landscape Architecture, Kongju National University, 182 Shinkwan-dong, Gongju, Chungcheongnam-do 32588, South Korea
2
Department of Regional Development, Kongju National University, 182 Shinkwan-dong, Gongju, Chungcheongnam-do 32588, South Korea
*
Author to whom correspondence should be addressed.
Sustainability 2017, 9(2), 192; https://doi.org/10.3390/su9020192
Submission received: 29 November 2016 / Revised: 11 January 2017 / Accepted: 19 January 2017 / Published: 28 January 2017
(This article belongs to the Special Issue Local Heritage and Sustainability)

Abstract

:
Green Infrastructure (GI) can be used as a framework for planning human settlements and guiding development away from natural areas that possess high ecological value and provide important Ecosystem Services for society’s development. In this paper, we present a GI Plan for Yesan County (Yesan GI Plan), a small shrinking city in the Republic of Korea. Yesan possesses very rich, but still fairly unexplored natural and cultural resources. Therefore, Yesan’s GI Plan was developed through a multifunctional approach based on the different ecological and socio-cultural characteristics of the region, allowing to connect the core elements that conform the vernacular landscape and get the most out of the Ecosystem Services provided by resources in the area. The plan was defined mainly in two stages: first, applying weights to the different ecological and socio/cultural characteristics; secondly, arranging them through a set of GIS spatial analysis tools using a patch-corridor- matrix model approach. The final outcome is a lean network of ecological value hubs, connected to a set of socio-cultural value assets through a network of water bodies, intrinsic forestry characteristics and wildlife mobility in the area. This was followed in order to connect, facilitate and improve mobility and energy flow in Yesan.

1. Introduction

Worldwide, the rapid and extensive changes generated by human intervention in the development of the economy and technology have influenced the natural capital and ecosystem services. These changes also influence the benefits and costs of public wellbeing [1,2] and affect “not only the biophysical systems that surround us, but also for the connections between those systems and human society in relation to broader, more complex social themes such as economics, social justice, and civic interaction” [3]. This drove the United Nations (UN) to set the Millennium Development Goals in 2000 [4] and to once again make another commitment to the environment, deciding to protect our planet through the 17 Sustainable Development Goals proposed in 2015 [5].
The importance of the relationship between people and the environment can be clearly seen through the efforts of the UN, as they highlight how people obtain certain benefits from ecosystems, which are called Ecosystem Services [6]. These Ecosystem Services are provided through different systems that are an inherent part of the green structures of the landscape [7]. The definitions of Green Infrastructure (GI) have various different sources and approaches. The US President’s Council on Sustainable Development defines GI as a network of open space, air sheds, watersheds, woodlands, wildlife habitat, parks, and other natural areas that provide many vital services that sustain life and enrich the quality of life [8]. Previous research of GI is linked with strategic planning and conservation [9]; valuation of ecological, social, and economic functions of landscapes [8,10]; technological and practical engineered systems mimicking natural processes [11]; and policy and planning with integral benefits for ecological, economic, and social spheres [12].
Thus, a GI planning approach can be considered suitable when planning for development and growth [9] that produces the least effect on natural processes [7], since the origins of GI are related to the ideas and actions taken for nature conservation. At the same time, GI maintains a transversal character for development, focusing on different levels and areas: ecologically [12,13], socially and culturally [2,9,12,14], and economically [8,15,16]. These dimensions allow the creation of a framework for development actions that will place the protection of nature at the center of it, but at the same time, the dimensions also provide an efficient framework for human activity development [17]. With this as background, we present the creational process of a general GI plan for territorial action with a socio-cultural focus in the county of Yesan, Republic of Korea (Korea).
The aim of this study is to explore a plan for highlighting Yesan’s disrupted green assets with a focus on ecological conservation and the reconnection of the socio-cultural assets of the town. The study provides an alternative as a possible tool to be considered for Yesan’s future planning and development, making use of, and focusing on, Yesan’s intrinsic ecological and cultural strengths and character.
In brief, the methodology used was a definition of land categories and planning of such chosen features based on pre-existing law definitions. This then led to the identification of relevant natural assets that would form the ecological network at the same time that the definition of physical characteristics of the site added the vernacular part to the study. Then, the processing using GIS tools was done by overlapping the different cultural, historical, and social assets together with a set of ecological features for obtaining hubs and links of the network (Figure 1). The overarching method was the patch-corridor-matrix model [18]. According to Forman, landscapes are conformed by a series of patterns of patches, corridors, and matrices on land at different scales. These three landscape elements can be either manmade or created by nature. Patches represent larger and wider areas of natural land than that of corridors. In addition, ideally, patches should be of a rounded shape with several small, tentacle-like corridors for creating connections [3], although they can also be of larger or smaller scale, longer or rounder, and are considered the nodes where corridors coalesce [18]. On the other hand, corridors tend to be of a more elongated, linear shape that help connect the disperse patches along the landscape [18]. Together, patches and corridors form a matrix in the mosaics of the land in order to create an intertwined network.

2. Materials and Methods

2.1. Study Area: Yesan County

Yesan is a small industrial farming county located less than two hours away from Korea’s capital city, Seoul, in the western Chungcheong-nam Province (Chungnam) (Figure 2). Home to valuable ecological resources (e.g., the Yedang Reservoir and Muhan Stream), the county also includes several cultural assets such as Imjeong Fortress and Prince Namyeon’s Tomb. Despite its diverse character, Yesan’s population has notably decreased from 157,294 in 1975 to 77,000 in the present day, with an average percentage of depopulation of 26% every five years [19]. As depopulation represents one of Yesan’s main concerns, measures and policies to avoid the declining of the area are an urgent matter [20].
Another main concern is connectivity related challenges, whether they refer to mobility or environmental and socio-cultural energy flows. Because urban growth has been placed at the center of major agendas around the globe, declining and shrinking spaces have not received much attention from policy makers or urban residents until recently [21]. This lack of attention has resulted in a lack of studies on these shrinking areas even though they have benefits, opportunities, and strengths for development. Nevertheless, declining, Yesan has many intrinsic socio-cultural, environmental, and physical characteristics that construct the value of the county, form its identity, and that can be used to propel the sense of ownership by its inhabitants (Table 1).

2.2. Methodology

A literature review of Ecosystem Services was conducted in order to identify the characteristics of the amenities involved in the provision of benefits that come from nature. The patch-corridor-matrix model [18] was employed for the definition of the system.
Based on Yesan’s special characteristics, two main categories were selected as the focus of the investigation: “Ecology” and “Society and Culture”. Considering Table 1, the “Physical” category was not explicitly taken as one of the categories to incorporate in the research, as the challenges previously mentioned for “Physical” (public transportation and taxi problems) were assimilated and could be treated indirectly by focusing on the Socio-cultural and Environmental categories, providing a background tool for the definition of more ecologically friendly and efficient transportation routes.
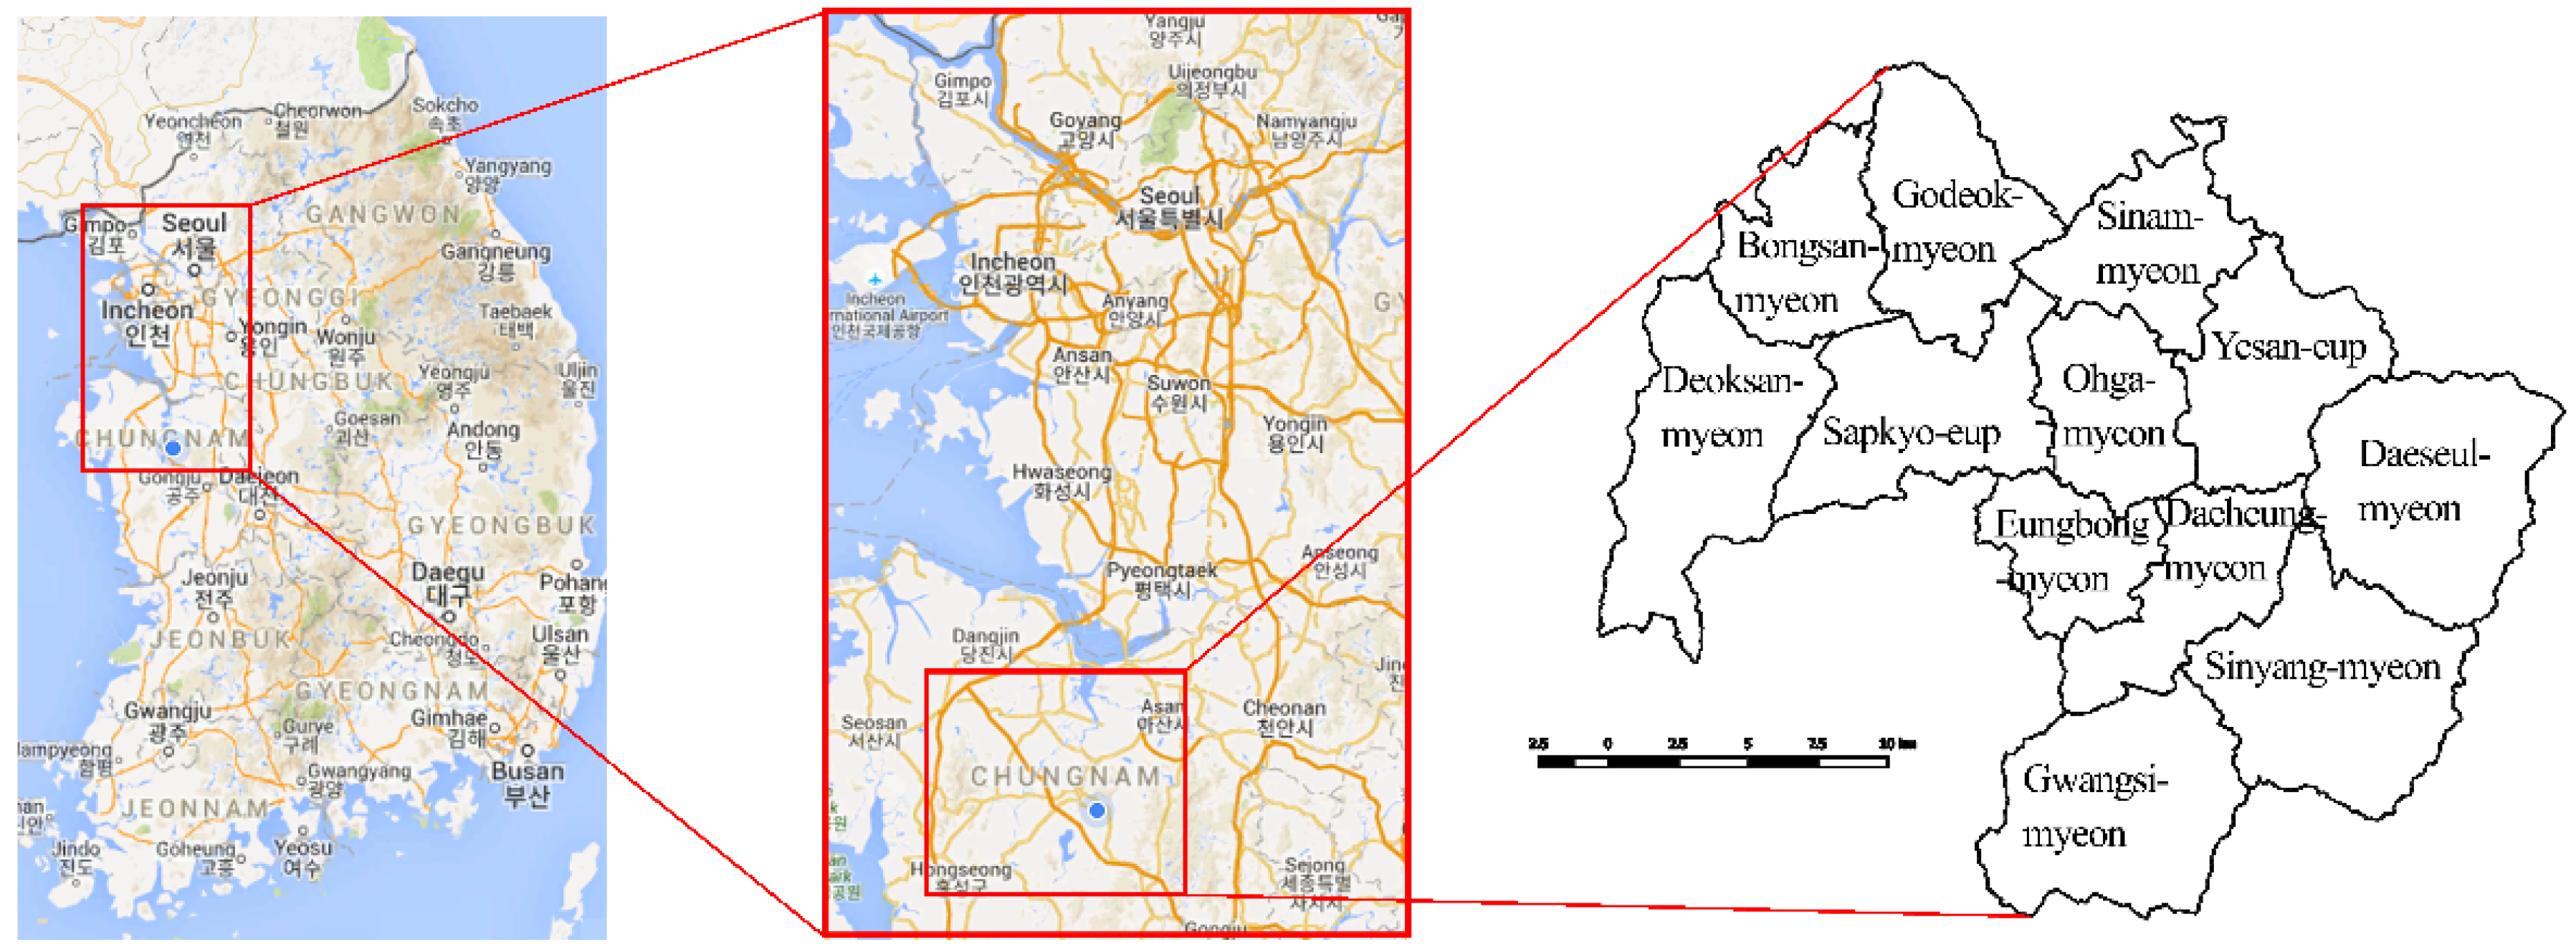
As for the opportunities mentioned, they are mainly connected to Yesan’s location in relation to Seoul and its metropolitan area. This is linked with the importance and influence the project will exert by being located at the heart of Chungnam area, connecting Seoul, its metropolitan area, Daejeon (Fifth biggest city in Korea and the center of its transportation routes), Sejong (Korea’s administrative capital) and the South-west area of the Korean peninsula. Taking this consideration, the analysis and definition of the system was summed to two main categories only.
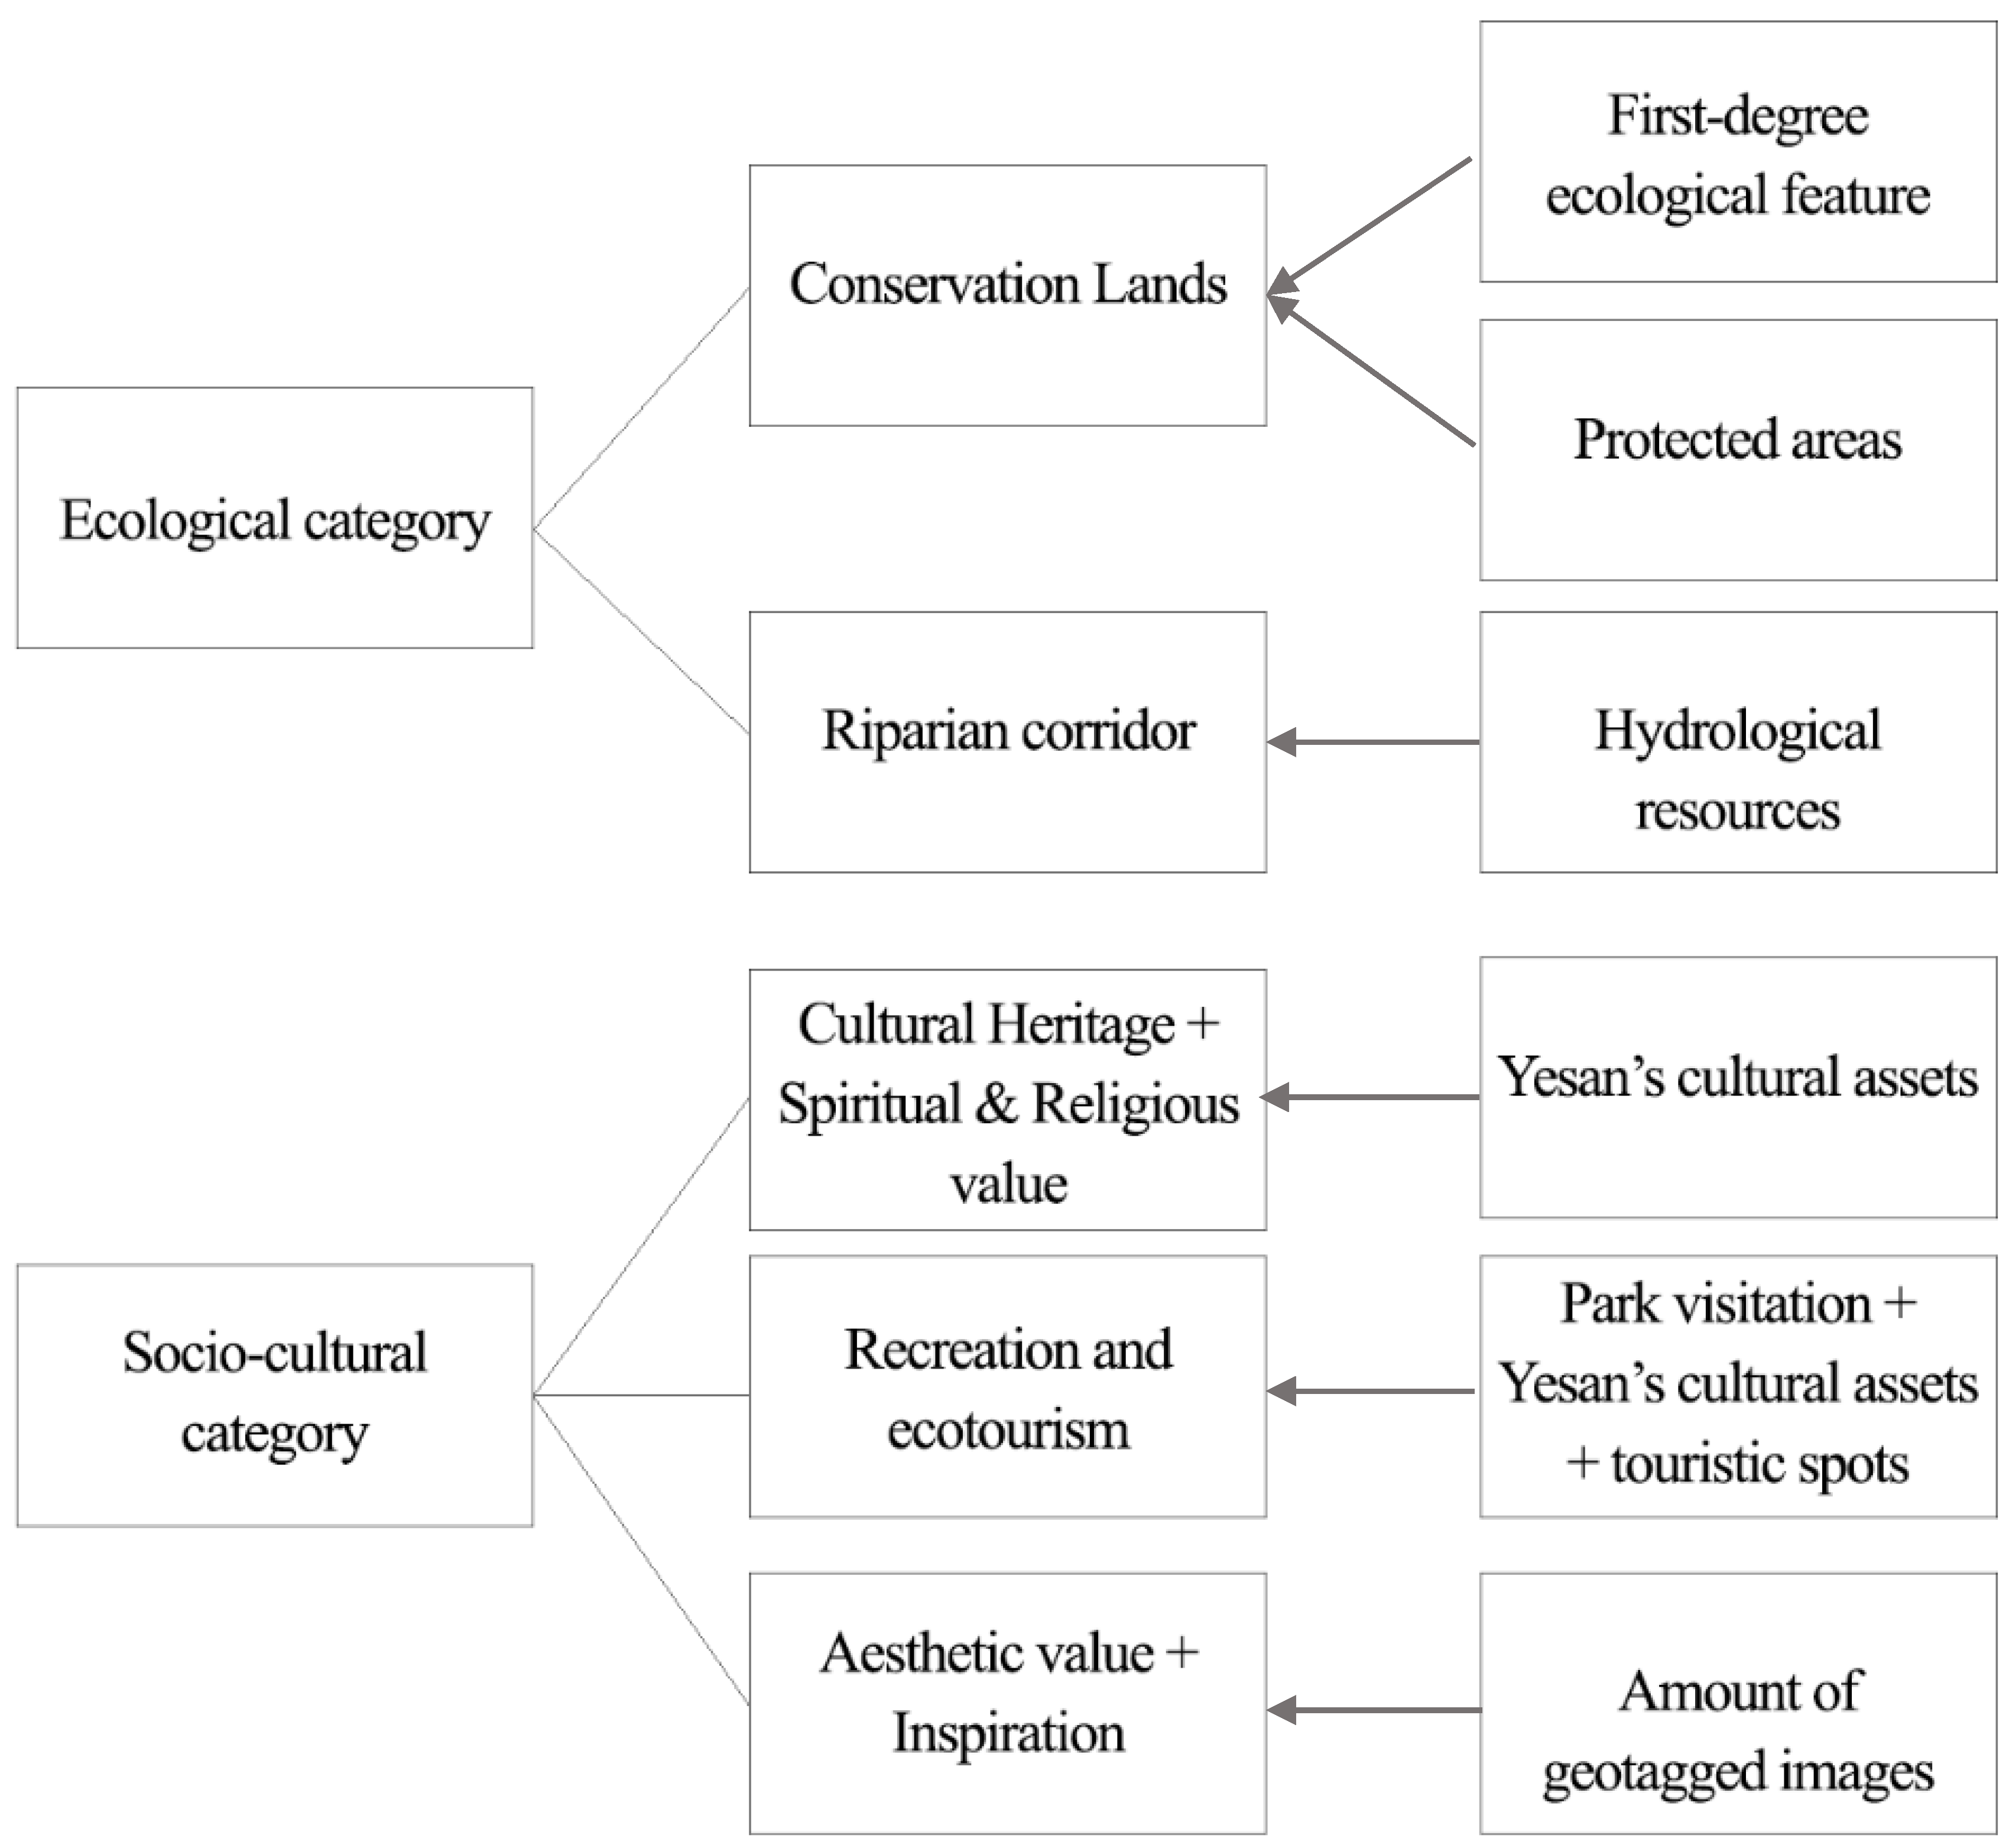
Summarily, the Ecology category is comprised of two sub-categories: (1) Conservation Lands; and (2) Riparian Corridors. The Conservation Lands are composed of the First-Degree Ecological Features and the Protected Areas maps. As for the Riparian Corridors, they are composed of the Hydrological Resources map.
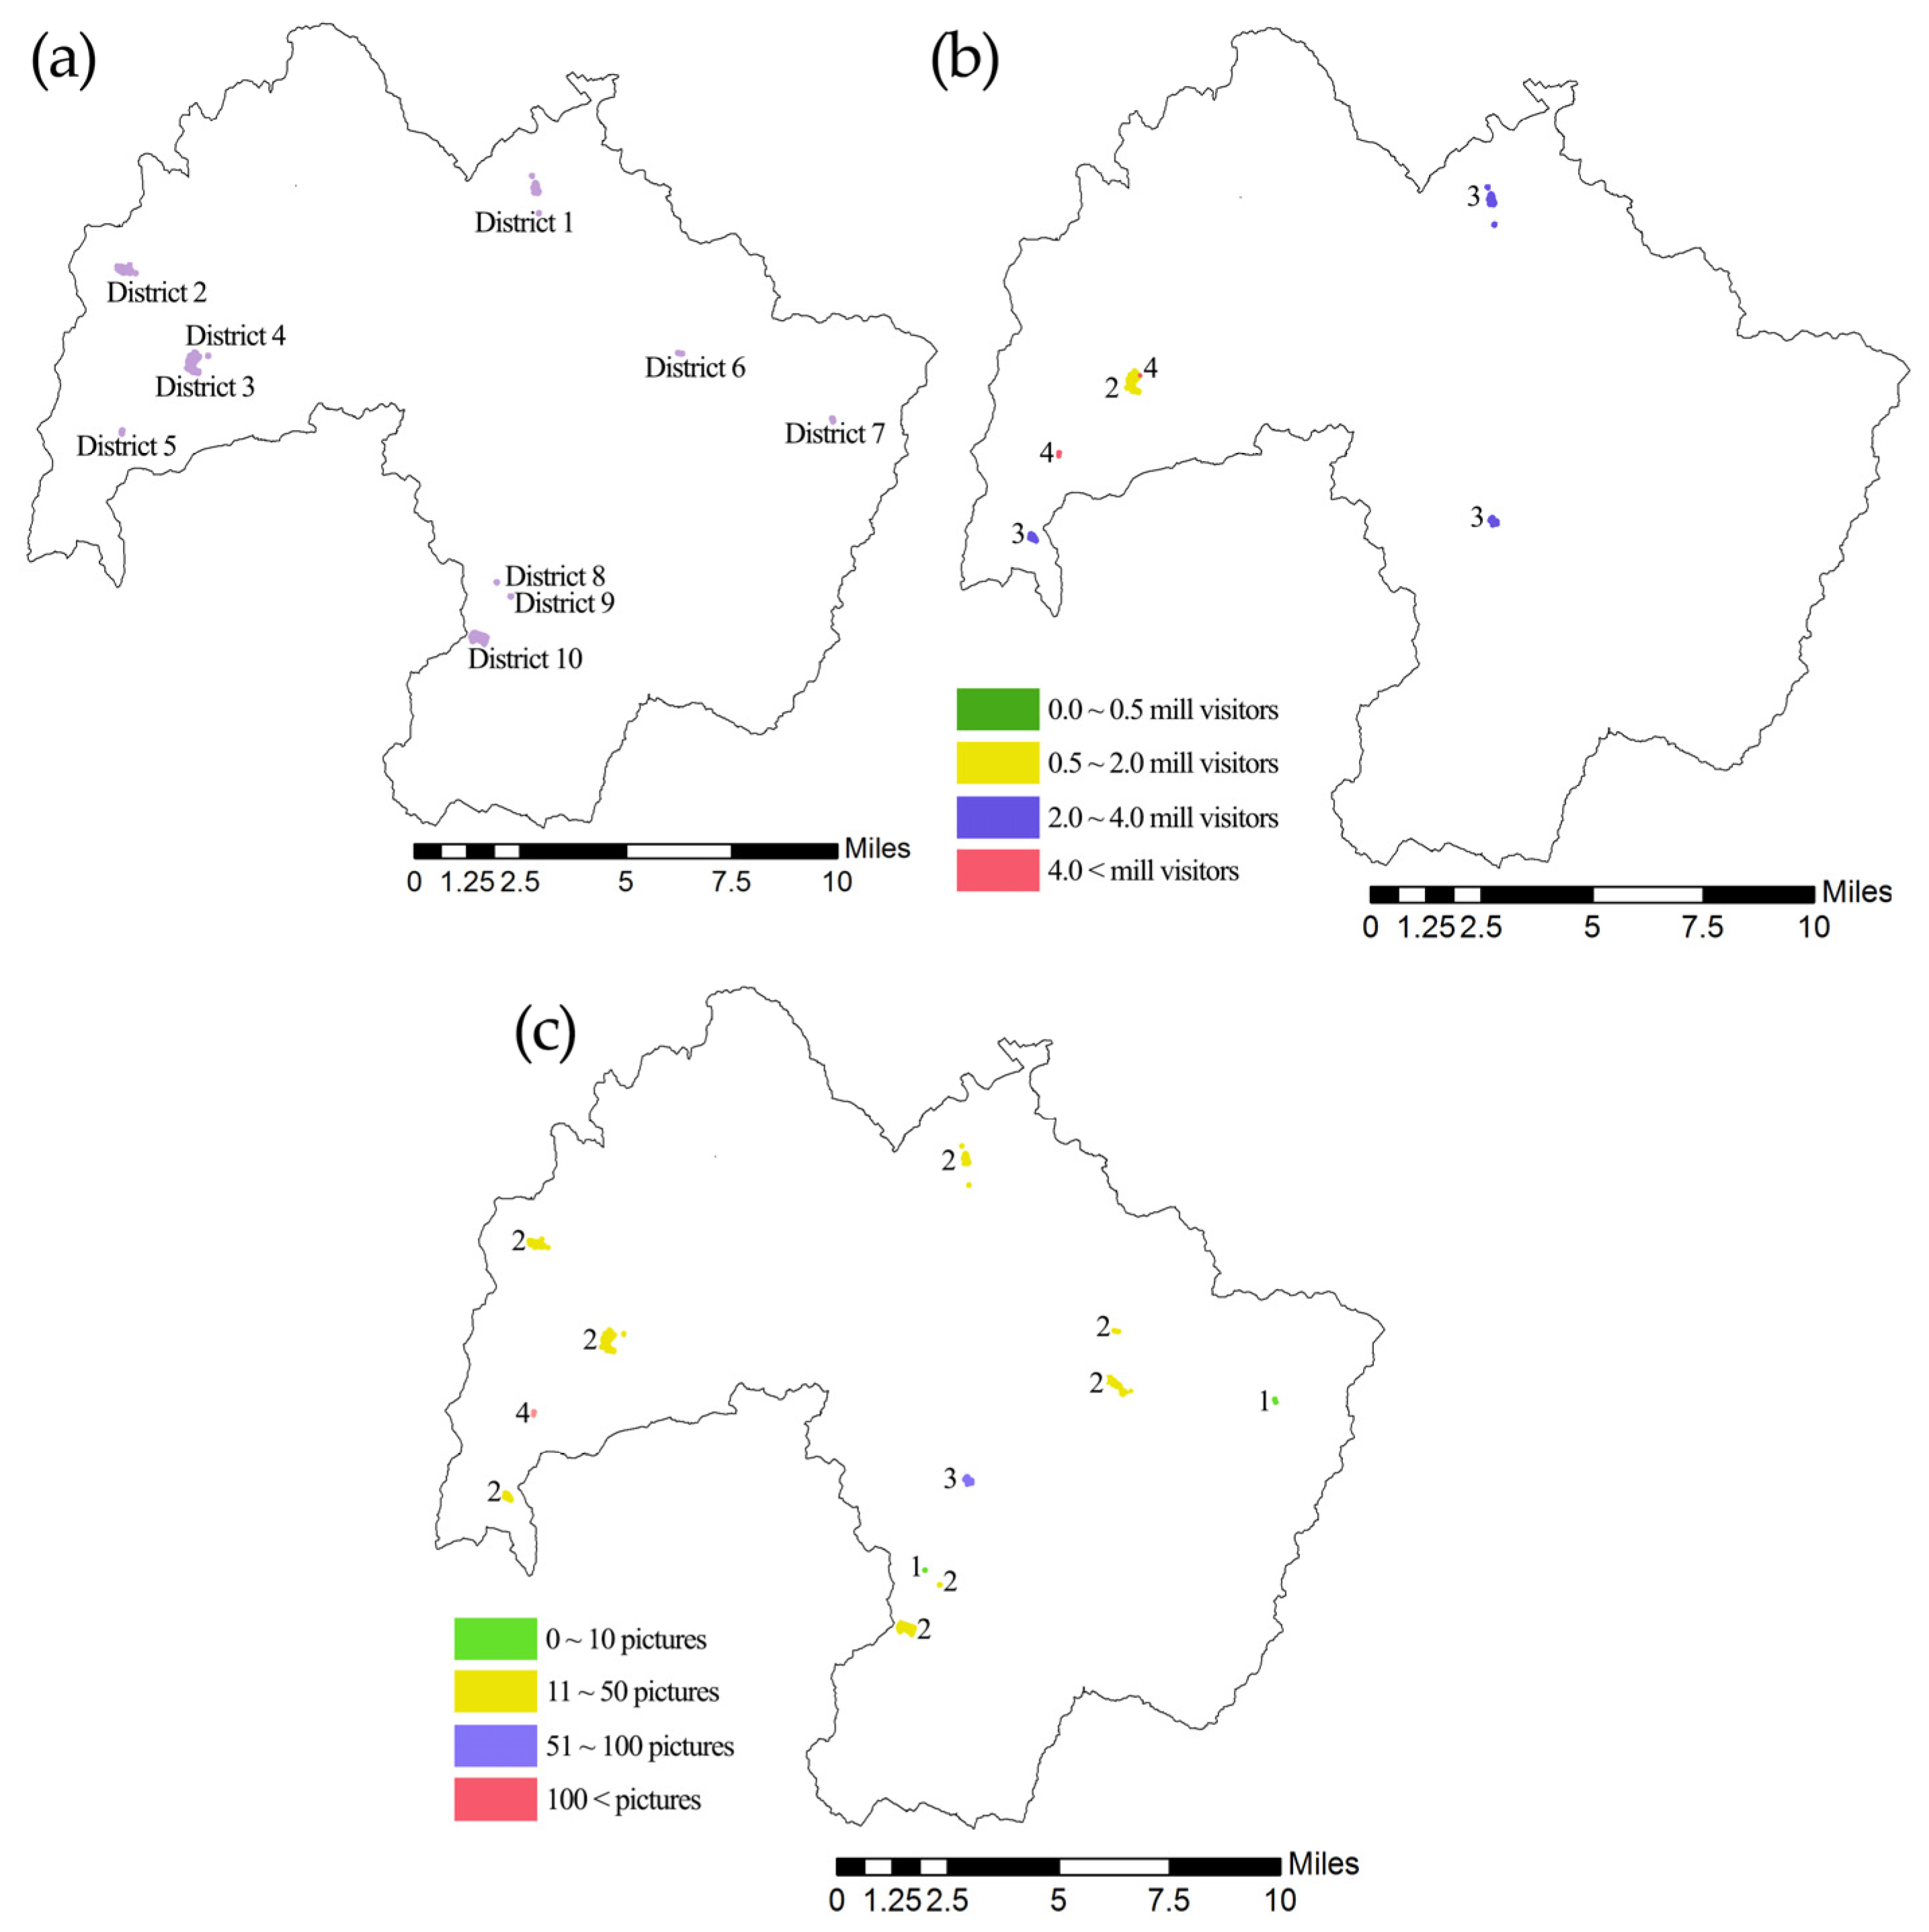
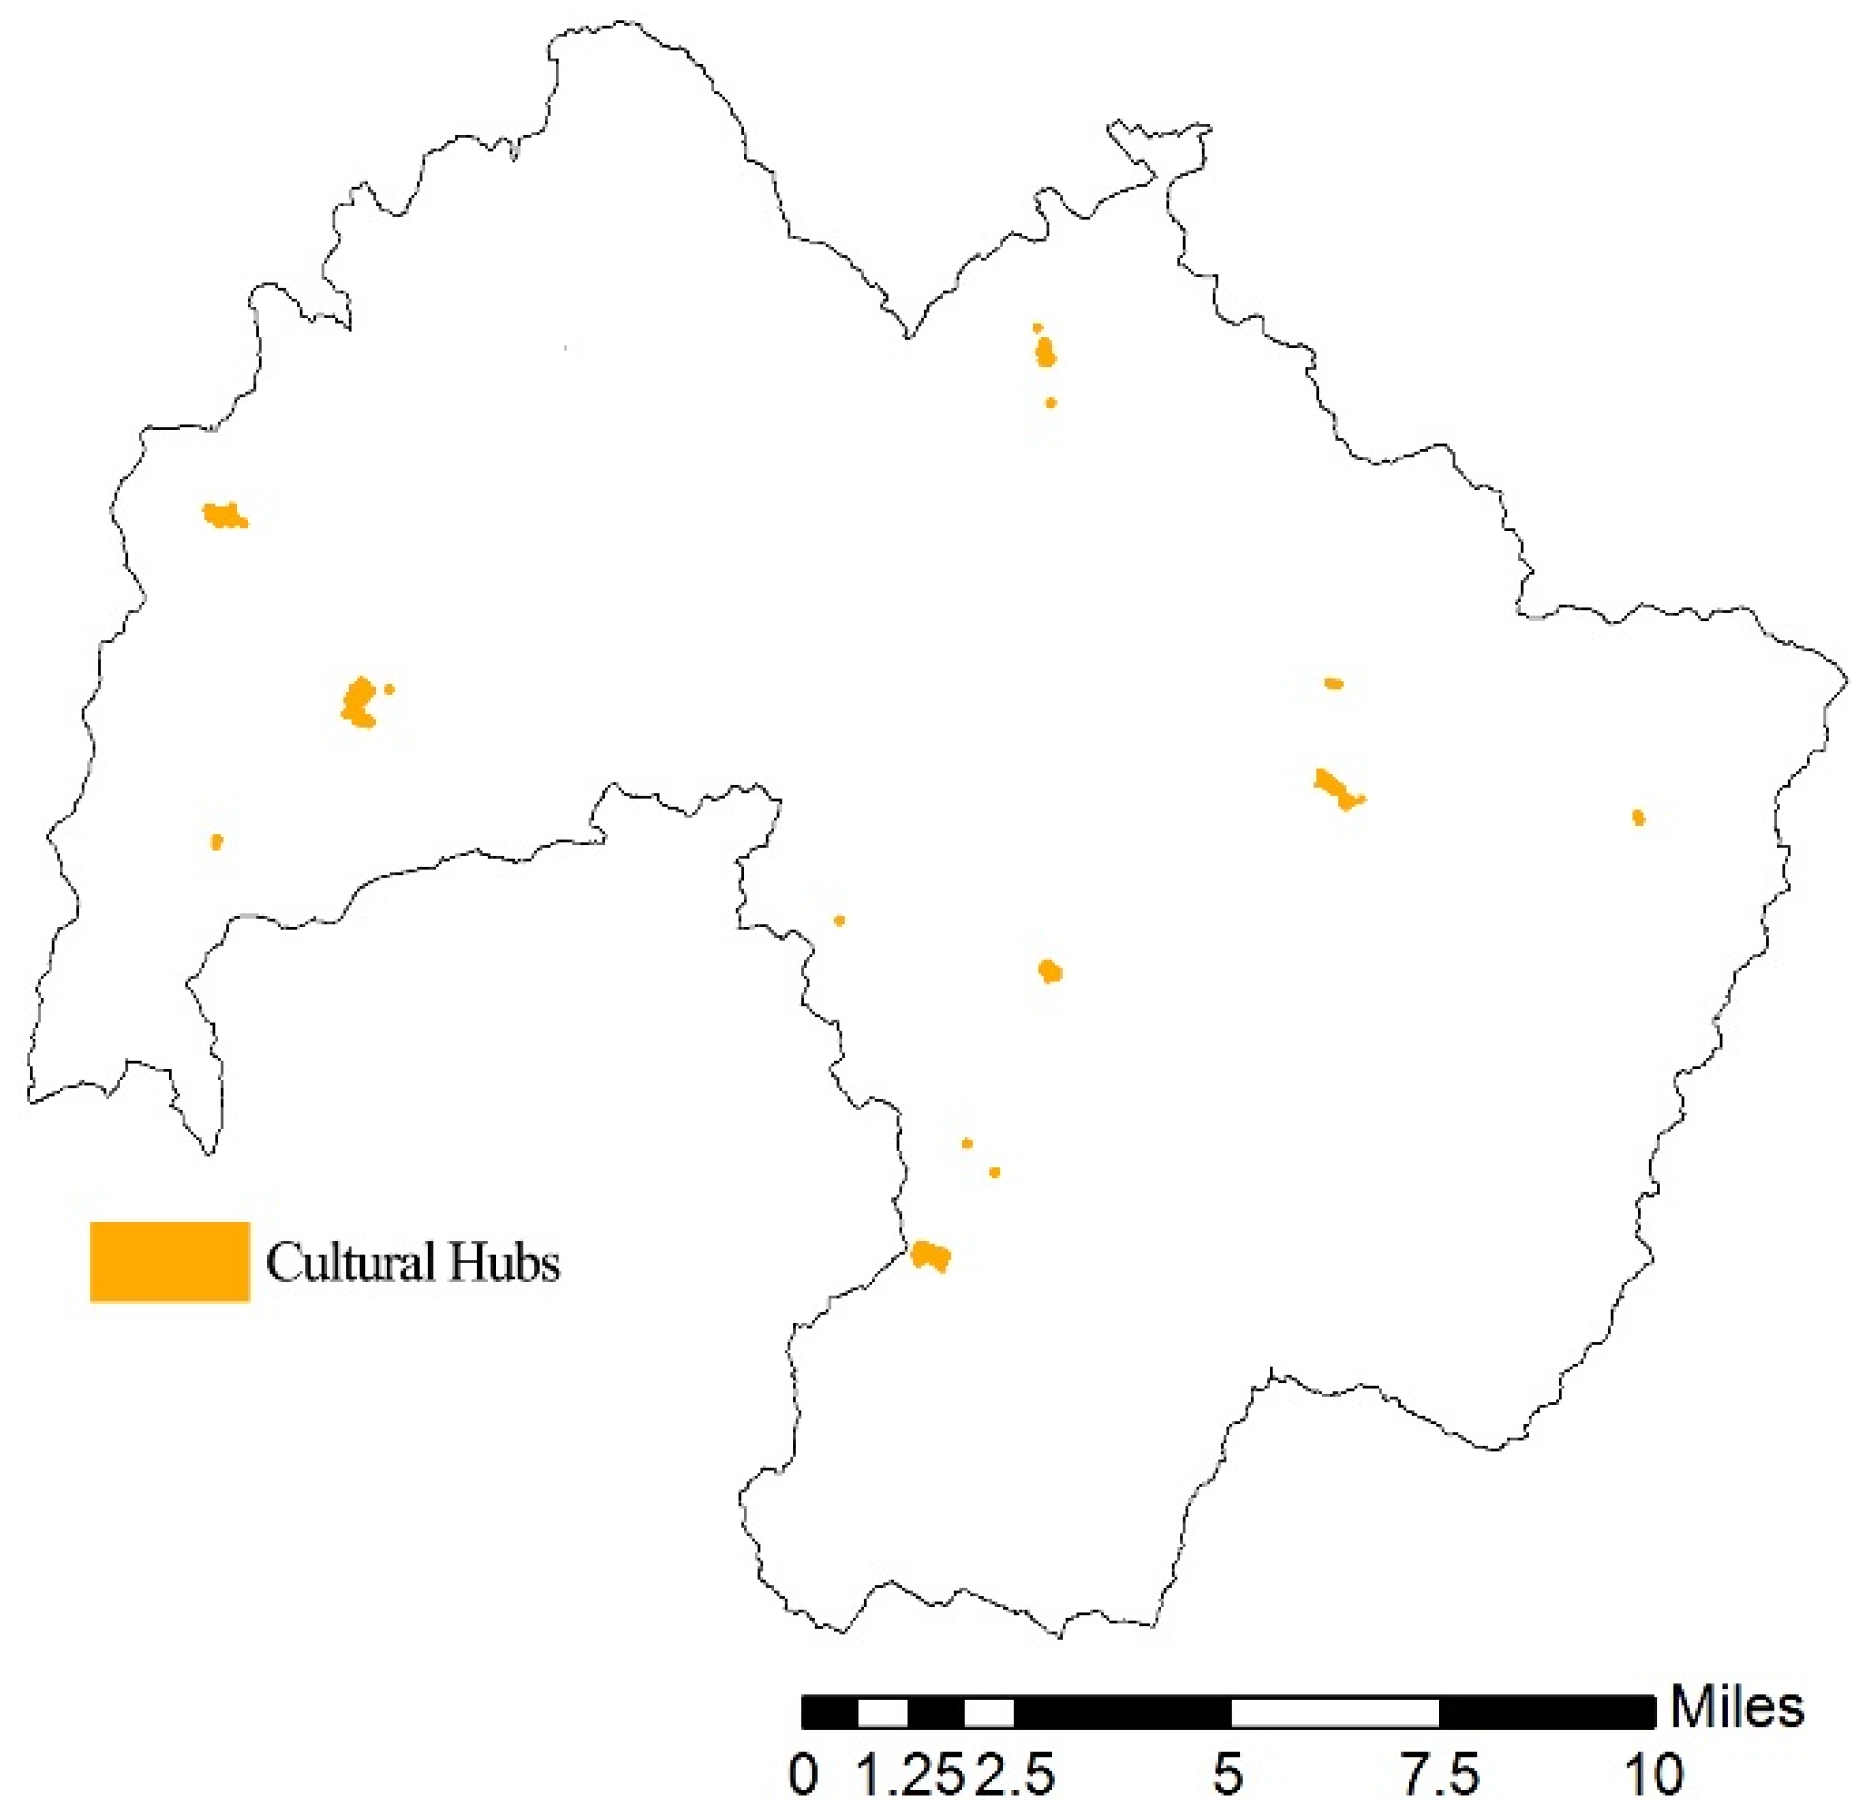
For the Socio-cultural category, the resulting three subcategories are: (1) Recreation and Ecotourism; (2) Aesthetic value + Inspiration; and (3) Cultural Heritage + Spiritual and Religious value. Recreation and Ecotourism was defined based on the indicators of Park Visitation, Cultural Assets, and Touristic Spots mapping. The Aesthetic value + Inspiration category is based on the indicator of the Amount of geotagged images. As for the Cultural Heritage + Spiritual and Religious value, Yesan’s cultural value assets were the base (Figure 3).
The Ecology category of this GI plan encompasses high ecological value natural resources and areas in Yesan, and the Ecological Ecosystem Services that they provide. The categorization of the areas was based on pre-existing land classification, a rank of ecological features defined by the National Land Planning and Utilization Act of the Republic of Korea. This criterion was selected as the method of mapping classification for the ecological character of the land, since the National Land Planning and Utilization Act is established around land characteristics. As such, Yesan is a part of the subject of the law, matching the background and special characteristics of it. The categories considered for the mapping of the ecological categories of the Yesan GI Plan were the First-Degree Ecological Features, Conservation Priority areas, Forestry and Agriculture, and Hydrological Resources. To these four categories, ad-hoc data on roadkill were added in order to analyze areas where further ecological intervention should be proposed for protection of the native fauna. As a final step, a slope categorization through Digital Elevation Model (DEM) was created through GIS processing tools, along with a set of base maps for the spatial analysis of Yesan’s territorial characteristics (Figure 4).
For the classification of both the Ecology and Social and Cultural categories, a scale from 1 (lowest value) to 3 (highest value) was used for the pre-weighting of the layers in GIS software. In the case of the Social and Cultural category, this pre-weighting was performed specifically for the main categories defined through a diverse set of indicators. In order to give priority to nature preservation, a weight of 3 was applied to the layers of physiological characteristics of the terrain, giving it the highest value in comparison to the socio-cultural layers to be used.
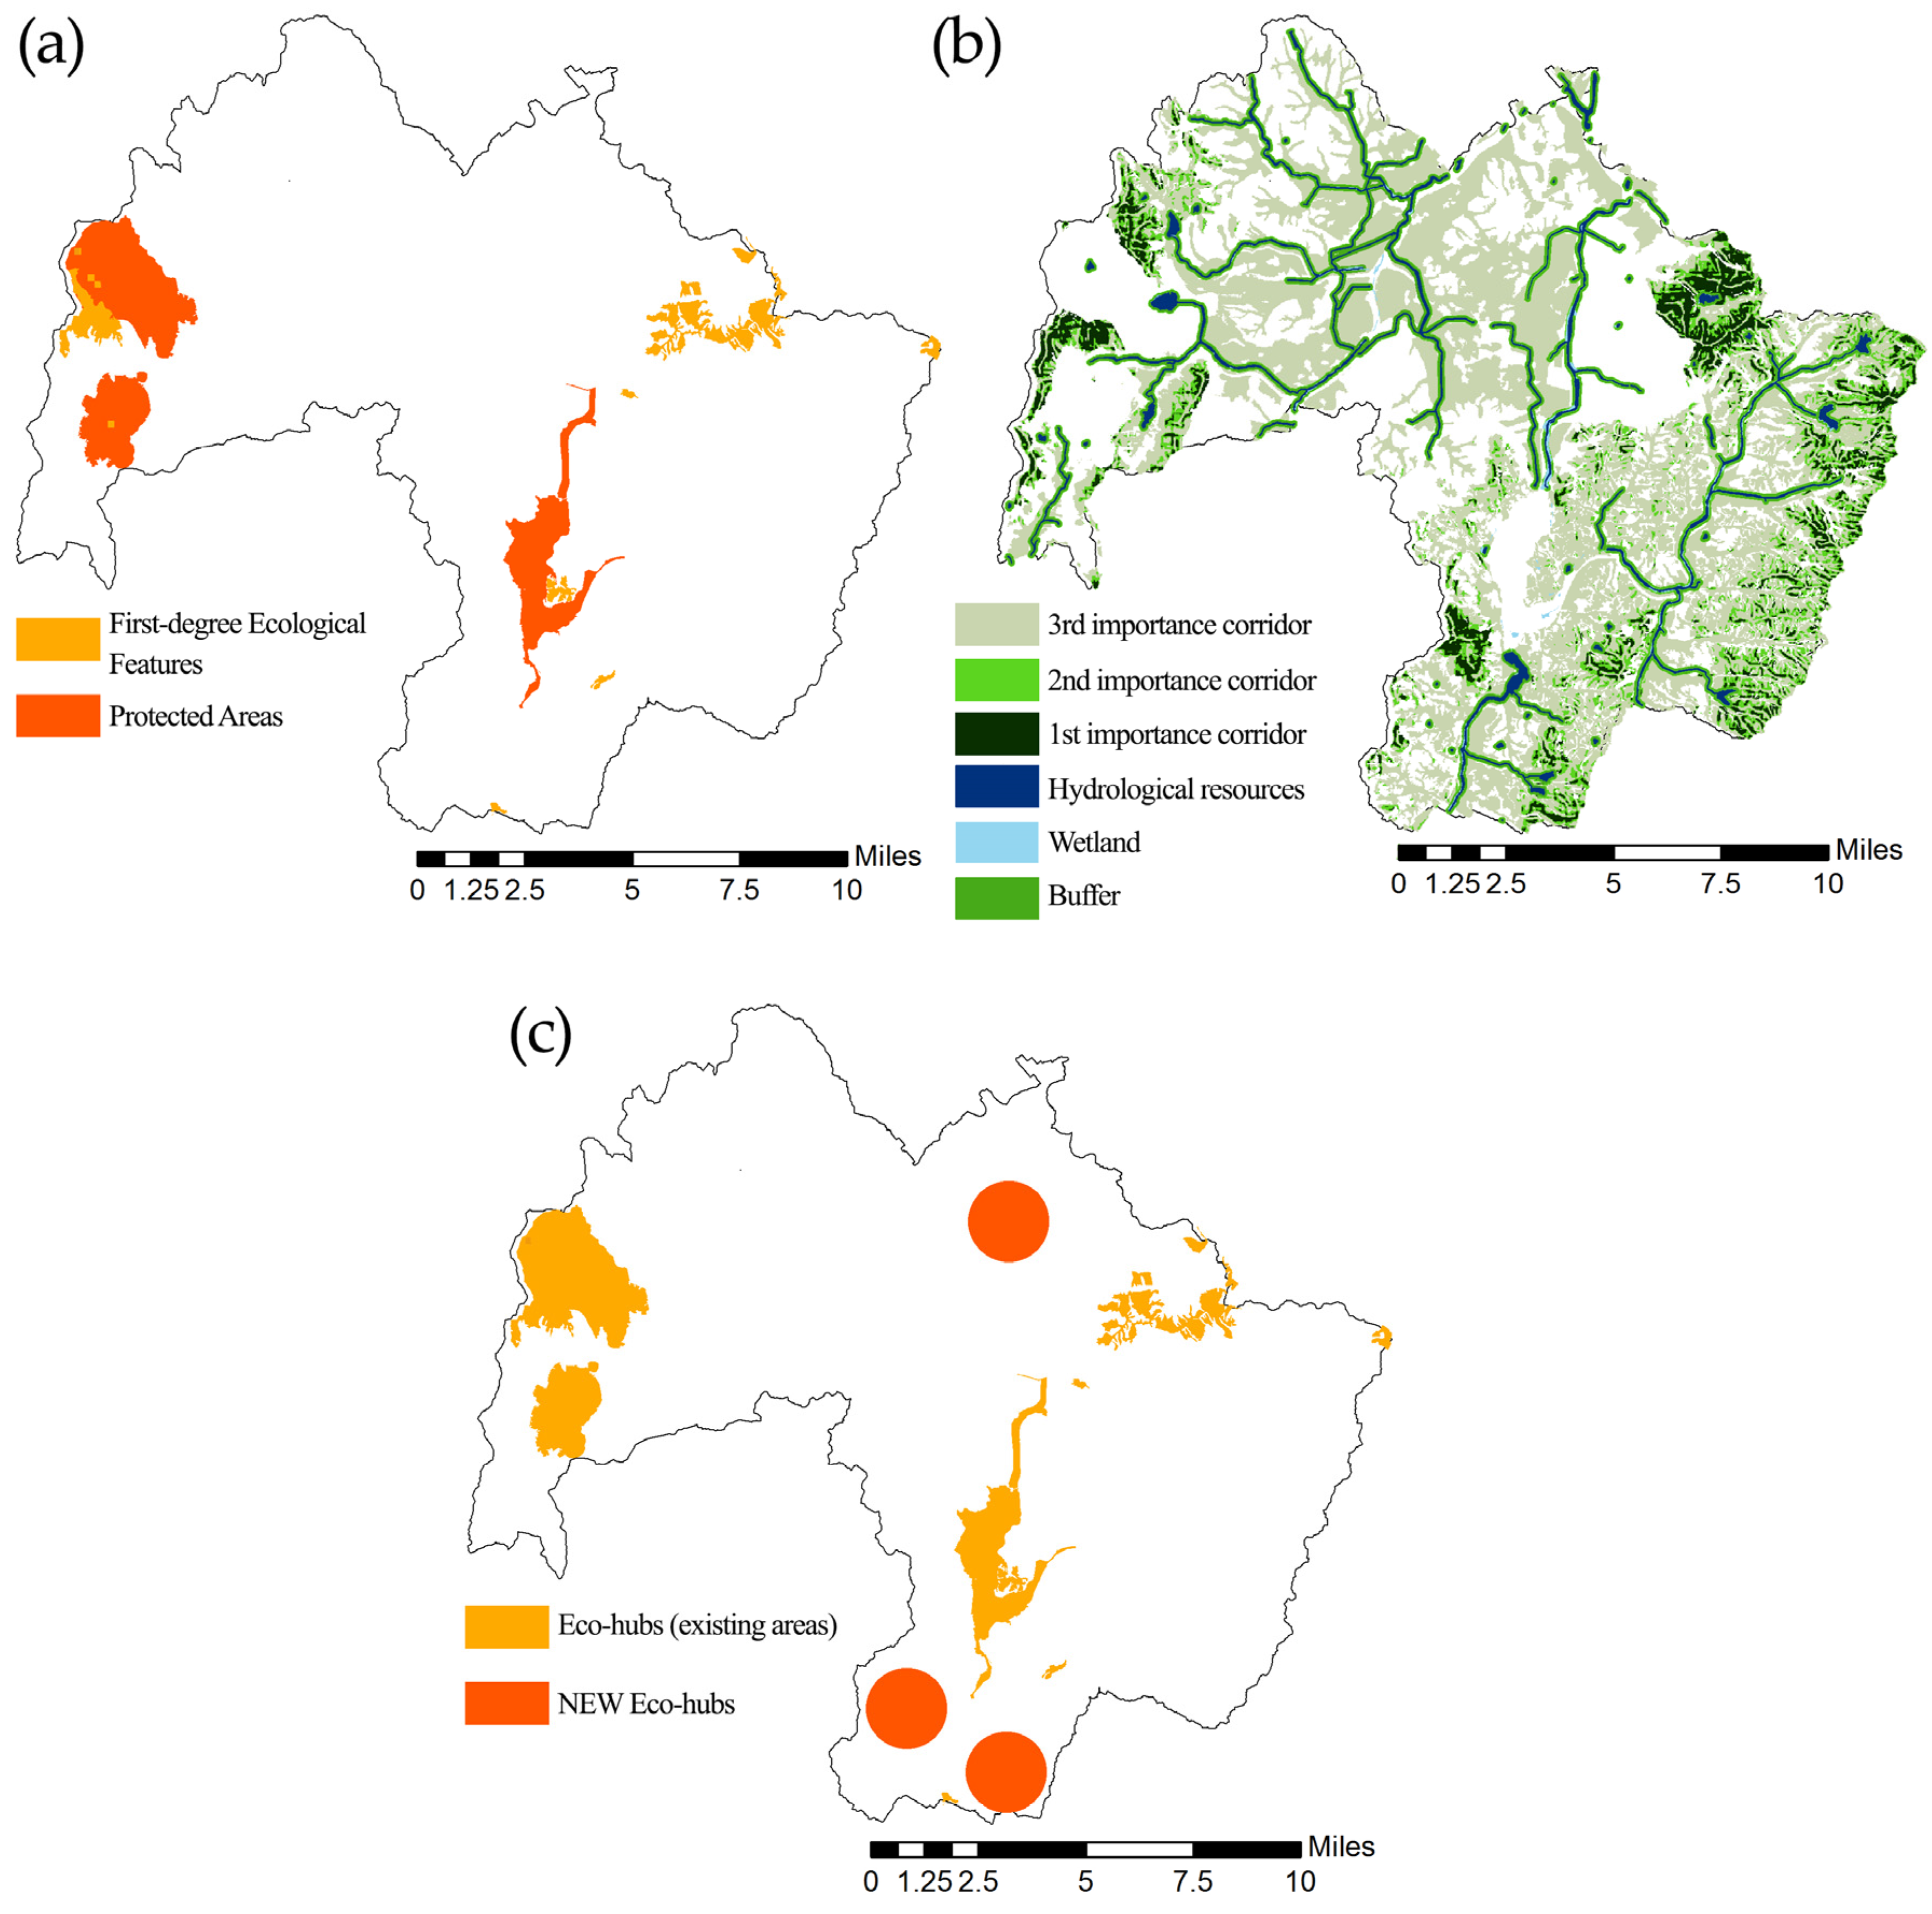
For the following analysis process, first, the ecological hubs were chosen under the base of the First-Degree Ecological Features and Protected Areas (Figure 5a). Second, following the patch-corridor model, the corridors were defined using an overlaying method with GIS application software. This was done while avoiding areas with a lot of human activity influence, such as expressways, secondary roads, and heavily urbanized areas for the ecological network, and areas with rugged terrain that complicated the access for the socio-cultural network. The Forestry and Agriculture layer was introduced as a vector layer, weighted with a qualification of 3 points, rasterized, and then reclassified into an overall value of 2. Thirdly, the slope was obtained through the DEM raster and classified into five different categories as per a classification defined by Ahn et al. [22] in their Forest Management book about Korean forestry. The Slope Classification layer was also reclassified into five classes, assigning a value in between 1 and 5 for each category.
As a fourth step, both the Forestry and Agriculture Reclassification layer and the Slope Reclassification layer were overlaid using the Weighted Overlay method. A 50% influence from each layer was chosen, as both of them exert the same influence over the configuration of the land. Then, for the considered values, the first, second, and last levels of the Slope raster were designated as Restricted area values. This was defined according to two different criteria: (1) Levels 1 and 2 are composed of a 10° or less slope, which are the regular areas where existing roads cross the landscape and human activity exerts a big influence on the fragmentation of the land; and (2) a slope above 40°, which belongs to Level 5, represents a challenge of mobility either for humans or for fauna. After the Weighted Overlay method was applied, three different areas were obtained according to the 1–3 weights previously assigned, which resulted in three different orders of corridor importance.
Fifth, the Hydrological Resources and Wetland layers were added to the map with a buffer of 100 m to complete the corridors layer (Figure 5b). After the Patch and Corridors were defined based on existing conditions, the roadkill data were included, taking into consideration where the concentration of roadkill was higher. This marked an indication of where New Eco Hubs should be added for fauna conservation (Figure 5c). These New Eco Hubs were defined by the concentration of roadkill points in an area, choosing the central point to the concentration area and defining a double ring buffer around it, with 500 m for the critical areas and 1500 m for its maximum reach [23,24].
As for the socio-cultural division of Yesan’s GI Plan, the category includes: (1) the natural resources that provide Cultural Ecosystem Services (CES); and (2) the social and cultural amenities that have the potential to become an integral part of Yesan’s GI by complementing the uses of the ecological value areas and providing similar Cultural Services as those provided by natural resources.
In order to identify indicators for the CES of Yesan’s GI Plan, a comprehensive review of indicators realized by La Rosa et al. in 2015 [25] was employed. The study included a recent and extensive analysis of CES papers throughout Scopus and ISI Web of Knowledge and provided an important tool for future planning. It also highlighted the fact that, among the analyzed papers, no indicator was designed specifically for urban areas, allowing the use of their analyzed criteria for rural towns and their own particular socio-cultural characteristics.
Out of the final set of indicators, a weight between 1 and 3 was assigned to each category according to the correspondence to the different problems and opportunities in Yesan and the number of indicators linked to the service (Table 2). This weighting between 1 and 3 was realized in order to maintain the correspondence with the pre-weighting performed over the Ecological category layers classification. However, within each category, a classification between 1 and 4 was executed in order to run more precise results that would encompass and define better the diverse socio-cultural aspects and amenities being analyzed.
After assigning the correspondent values to the weight, five categories were selected among those of the study from La Rosa [25], as they are the most relevant to Yesan’s case study: Cultural Heritage, Spiritual and Religious value, Recreation and Ecotourism, Aesthetic Value, and Inspiration. However, the Inspiration and Aesthetic Value categories were unified as one, as inspiration is defined by a place or person that makes someone want to do or create something, making it possible to consider aesthetically beautiful places as inspiring sources of contemplation. At the same time, the Spiritual and Religious values category was incorporated into the Cultural Heritage division, by considering spiritual beliefs a part of a person’s cultural expression system (Table 3).
For each of the different CES categories selected, a different proxy was chosen based on previous studies.

2.3. Cultural Heritage + Spiritual and Religious Value

Cultural Heritage + Spiritual and Religious value was mapped by identifying the diverse cultural districts in the area that represent part of Yesan’s particular character and history. A Cultural District will be understood as the area comprised of the facilities that enclose two or more diverse cultural value structures and a 100 m buffer area around the pertaining structures.
The information on the cultural assets in Yesan was obtained through pre-existing information provided by governmental agencies of Korea. A total of 55 different points was identified as cultural value assets according to the local government. However, among these 55 points, several structures were agglomerated into the same Cultural District according to the physical closeness (up to 300 m). After analyzing the list of assets and grouping them into their respective Cultural Districts, a final list of 10 Cultural Districts was obtained in order to be included into the Cultural Heritage CES category (Table 4 and Figure 6a).

2.4. Recreation and Ecotourism

The proxies used were Park Visitation [26] along with the mapping of the Cultural Assets and Touristic Spots. This gives us crucial information about the collective importance of a site by measuring the number of people who are interested in visiting such an area. The number of visitors in touristic and cultural attractions in Yesan was obtained through the Touristic Information System [27].
Such method provided a list of six different touristic spots that are part of the governmental database. The tourist number information from four years was used (2009–2012) for data consistency.
The valuation method utilized was the weighting of the number of visitors on a scale from 1 to 4 for the total number of visitors during the period of 2009–2012. For those Touristic Spots with visitation numbers between 0.0 and 0.5 million, a scale of 1 (very low visitation) was assigned; for those between 0.5 and 2.0 million, a scale of 2 (low visitation); a scale of 3 for (medium visitation) those places between 2.0 and 4.0 million; and, finally, for the Touristic Spots with a number above 4.0 million, a scale of 4 (high visitation) (Table 5).
Each of these sites was later mapped in GIS using a buffer zone of 100 m and defining a different color for each of the Park Visitation weights (Figure 6b).

2.5. Aesthetic Value + Inspiration

For this category, the proxy chosen was the Amount of geotagged images [28]. These can be used to accentuate the relationship between people and place attachment, based on the importance they put on the visual value of a place by taking an image.
First, the Cultural Districts were defined based on pre-existing GIS data obtained through governmental offices. Second, after analyzing the information in the GIS software, the existing shapefile (.shp) with Yesan’s Cultural Districts information was inserted into Google Earth by converting the shapefile into a. kml file using GIS in order to be viewed in Google Earth. The number of pictures taken into consideration for the procurement of the information included the ones within the border of the Cultural Districts and a 1 km buffer zone for pictures that could include such landscapes (pictures reviewed as of 5 January 2017 for Google Earth and as of 6 January 2017 for Google Maps). At the same time, three other landmarks were added to the list for the geotagged pictures references: Yedang Reservoir and Kongju National University’s Yesan Campus (KNU Yesan Campus) due to the social influence they exert on Yesan’s social dynamics; and Korea’s Architectural Museum, as a keeper of Korea’s architectural tradition.
Once the pictures were accounted for, each area was ranked from 1 to 4 as 1 (very low Aesthetic value) between 0 and 10 pictures; 2 (low Aesthetic value) between 11 and 50 pictures; 3 (medium Aesthetic value) for areas with 51–100 pictures; and 4 for areas with 100 pictures and above (Table 6 and Figure 6c).

3. Results

Yesan’s GI Network was the product of a multifunctional, integral focus that incorporated both ecological and socio-cultural categories’ features into its framework. The final outcome is composed of a series of hubs, links and a series of stepping stones. The hubs were the result of the identification and selection of intersected layers that helped define the borders of the most ecologically, socially, and culturally important assets within Yesan’s territory.
For the web of links and corridors, as they were also identified with the help of an Overlaying Method through GIS, Yesan’s GI Network ended up being comprised of a total of four existing areas defined as Eco Hubs, 13 Cultural districts, three New Eco Hubs and a network of Hydrological Resources and Agricultural and Forestry lands.
When realizing the Overlaying through GIS, a series of small, scattered patches of ecologically valuable areas pertaining to the water bodies, wetlands and conservation lands also were shown in the software in less suitable areas. Originally, as they were not big enough to account as Hubs within the Network, they were not incorporated into it, however, after a final consideration of the value they might add to it, they were added as a final step to the network, as they add important ecological value to the flow of energies in the matrix, allowing certain species (particularly birds) to mobilize from one point to another within the network [18].
For the ecological assets information, the elements were determined directly based on the previous classifications made by the National Land Planning and Utilization Act. In particular, two categories were taken into consideration: Protected Areas and First-Degree Ecological Features. This resulted in the designation of four major hubs for the Yesan GI Network. The ecological characteristics of Yesan that conform the Eco Hubs were all designated with the highest weight, placing a strong emphasis on the role of nature for Yesan’s future development.
As for the socio-cultural characteristics, the different methods of data procurement resulted in 13 main socio-cultural spots that formed the Cultural Districts and Culture Hubs for the Yesan GI Network (Figure 7). These areas are directly linked to diverse cultural assets that form part of Yesan’s history, and are also linked to particular ecological characteristics, especially thanks to the different feng shui used at the time of their construction.
The final result for the Yesan Cultural Assets is a list of 13 different areas, defined mainly through the use of previously mentioned tools in GIS and the previously defined weights (Aesthetic value and Visitation weight). One area represented the highest value of 4 (on a scale from 1 to 4), two areas had a value of 3, four areas represented the value of 2 and the remaining five areas had a value of 1 (Table 7).

4. Discussion

The final Yesan GI Network (Figure 8) is a combination of the Eco Hubs and the Culture Hubs, interconnected by a web of a water bodies’ network, wetlands, and some of the manmade roads in order to connect and facilitate mobility in the area, and which promote tourism and economic activity as well. In addition, we considered forestry areas with a slope between 10° and 40°, which responds to the needs for mobility ease presented in Table 1, and it also considers fragmentation of the land by the existing roads, so it gives priority to those areas where the fragmentation can be easily controlled and further influence re-oriented.
Most papers on GI focus only on the ecological part of its functioning, neglecting the multifunctional aspect that truly defines the GI approach [7]. Due to this, the incorporation of socio-cultural factors and assets has been relegated to areas related to human health [2]. This paper presents an approach for GI planning incorporating diverse CES indicators analysis. In addition, the proposal responds to natural conditions of the terrain and social synergies observed around the area. Two out of the three methods for CES indicators analysis (Park visitation and Amount of geotagged images) were selected based on a pre-existing review work by La Rosa et al. (2015) [25], as it included a comprehensive overview of several recent papers related to the topic. The methods selected were based on the ease of access to information. The third method (Mapping of cultural assets) was an inventory of the cultural assets and Cultural Districts and 31 Cultural Heritage structures within them.
The Internet information related to Park Visitation was limited to just certain assets that are part of the cultural structures in Yesan County, as some others do not belong to complexes where there might be visitation counting. For this reason, the original list of 10 Cultural Districts was modified to incorporate assets not contemplated by the local authorities in their listings, as their importance was evident through the number of recorded visitors.
The Final Weights of the Cultural Districts (Table 7) show the influence each of these areas exerts and their importance within the Yesan GI Plan. However low weight they may represent (1), as they all carry certain socio-cultural value, their importance resides in the opportunities they represent within the network. Adding these areas into the Yesan GI Plan would allow for a better management of the social amenities and facilities, as well as the redirection of public funds towards the areas in most need of exploration and promotion for those assets that represent a Final Weight of 1.
However, the depth of this investigation, the GI approach, being a multidisciplinary action, requires different experts from different fields. Since the plan has been developed at a relatively conceptual level, it is necessary for other options to be studied more deeply as a posteriori work, and the documentation and analysis generated constitute an input for the proceeding development plans.
The main input this paper contributes is providing a guiding tool for the definition of appropriate areas for human (non-motorized) and wildlife transit that would be protected from direct harsh influence of gray areas development. The multifunctionality of the Green Infrastructure approach allows for the creation of areas where people can directly experience nature and acquire sensitivity about their natural surroundings and the value and services they can provide for the everyday life. This is the case principally with the defined corridors for Yesan’s GI Plan, where they are not completely isolated natural refuges for fauna conservation, but more of a guideline that would allow for an integration of mild human activity in ecologically valuable areas.
It is advised that, due to the intervention process time, the specific target areas need the active participation of other areas’ experts in order to create definitive design proposals. This would also carry the meaning of creating a participative design process for specific targets. This is a process to be put into practice after the master plan for GI is defined in Yesan County. This would require the fabrication of a wide-ranging program of communication and sensitization addressed to the population and different social change agents to incentivize their participation in the definition and establishment of the system and transformations that would involve the urban part of the county. Specially, there would be a need of incorporating the defined areas of the Yesan GI Plan to the Treatment Areas category for the areas that are still not part of the conservation and protection lands under the National Land Planning and Utilization Act of the Republic of Korea. Among these areas still not part of the conservation and protection lands are the Socio-cultural Hubs, corridors and New Eco Hubs.
It would be expected for some urbanized land in Sapgyo-eup, Deoksan-myeon and Daeheung-myeon to change their use from bare ground soils to forested areas. In addition, the farming areas should be regulated, adopt ecological farming methods and the government should create policies to promote and facilitate them.

5. Conclusions

Yesan’s GI Plan provides essential guidelines for the county’s future development. It allows for planners and designers to have access to a basic outline that considers the multifunctionality of the green infrastructure in Yesan. Considering both Ecological and Socio-cultural assets within the county, the Yesan GI Plan allowed the identification, valuation and prioritization of those areas (socio-cultural assets and ecological areas) that need more attention by the local government for their development.

Author Contributions

María José Carranza Orantes and Jinki Kim conceived the investigation, analyzed data and wrote the paper; María José Carranza Orantes realized literature review, analyzed GIS data sets and performed image and tables production; and Jiseok Kim provided revision of the written paper and analysis of data.

Conflicts of Interest

The authors declare no conflict of interest.

References

  1. Costanza, R.; d’Arge, R.; de Groot, R.; Farber, S.; Grasso, M.; Hannon, B.; Limburg, K.; Naeem, S.; O’Neill, R.; Paruelo, J.; et al. The value of the world’s Ecosystem Services and Natural Capital. Nature 1997, 387, 253–260. [Google Scholar] [CrossRef]
  2. Tzoulas, K.; Korpela, K.; Venn, S.; Yli-Pelkonen, V.; Kazmierczak, A.; Niemela, J.; Philip, J. Promoting ecosystem and human health in urban areas using Green Infrastructure: A literature review. Landsc. Urban Plan. 2007, 81, 167–178. [Google Scholar] [CrossRef]
  3. Hellmund, P.C.; Smith, D.S. Designing Greenways: Sustainable Landscapes for Nature and People; Island Press: Washington, DC, USA, 2006; pp. 42–205. [Google Scholar]
  4. Griggs, D.; Stafford-Smith, M.; Gaffney, O.; Rockström, J.; Öhman, M.C.; Shyamsundar, P.; Steffen, W.; Glaser, G.; Kanie, N.; Noble, I. Policy: Sustainable development goals for people and planet. Nature 2013, 495, 305–307. [Google Scholar] [CrossRef] [PubMed]
  5. Måns, N.; Costanza, R. Review of Targets for the Sustainable Development Goals: The Science Perspective; Stockholm Environment Institute: Paris, France, 2015; pp. 13–82. [Google Scholar]
  6. Millennium Ecosystem Assessment. Ecosystems and Human Well-Being: Synthesis; Island Press: Washington, DC, USA, 2005; pp. 1–6. [Google Scholar]
  7. Weber, T.; Sloan, A.; Wolf, J. Maryland’s Green Infrastructure Assessment: Development of a comprehensive approach to land conservation. Landsc. Urban Plan. 2005, 77, 94–1110. [Google Scholar] [CrossRef]
  8. Anderson, R.; Lash, J. Toward a Sustainable America; The President’s Council: Washington, DC, USA, 1999; pp. 64–65. [Google Scholar]
  9. Benedict, M.; McMahon, E. Green Infrastructure: Linking Landscapes and Communities; Island Press: Washington, DC, USA, 2006; pp. 57–84. [Google Scholar]
  10. Vandermeulen, V.; Verspecht, A.; Vermeire, B.; Van Huylenbroeck, G.; Gellynck, X. The use of economic valuation to create public support for green infrastructure investments in urban area. Landsc. Urban Plan. 2011, 103, 198–206. [Google Scholar] [CrossRef]
  11. US Environmental Protection Agency. Managing Wet Weather with Green Infrastructure; USEPA: Washington, DC, USA, 2011; pp. 5–7.
  12. Mell, I. Green Infrastructure: Concepts and planning. FORUM 2008, 8, 69–80. [Google Scholar]
  13. Gill, S.; Handley, J.; Ennos, A.; Pauleit, S. Adapting Cities for Climate Change: The Role of the Green Infrastructure. Built Environ. 2007, 33, 115–133. [Google Scholar] [CrossRef]
  14. Schilling, J.; Logan, J. Greening the Rust Belt. A Green Infrastructure Model for Right Sizing America’s Shrinking Cities. J. Am. Plan. Assoc. 2008, 74, 451–466. [Google Scholar] [CrossRef]
  15. Gómez-Baggethun, E.; de Groot, R.; Lomas, P.L.; Montes, C. The history of ecosystem services in economic theory and practice: From early notions to markets and payment schemes. Ecol. Econ. 2009, 69, 1209–1218. Available online: http://www.cepal.org/ilpes/noticias/paginas/7/40547/the_history_of_ecosystem.pdf (accessed on 25 April 2016). [Google Scholar] [CrossRef]
  16. Kiker, C.F.; Hodges, A.W. Economic Benefits of Natural Land Conservation: Case Study of Northeast Florida; University of Florida, Institute of Food & Agricultural Sciences: Gainsville, FL, USA, 2002; pp. 16–41. [Google Scholar]
  17. Grimm, N.B.; Grove, M.J.; Pickett, S.T.; Redman, C.L. Integrated approaches to long-term studies of urban ecological systems. BioScience 2000, 50, 571–584. [Google Scholar] [CrossRef]
  18. Forman, R.T.T. Land Mosaics: The Ecology of Landscapes and Regions; Cambridge University Press: Cambridge, UK, 1995. [Google Scholar]
  19. Korean Statistical Information Service (KOSIS). Available online: http://kosis.kr/eng/statisticsList/statisticsList_01List.jsp?vwcd=MT_ETITLE&parentId=A#SubCont (accessed on 19 March 2016).
  20. Cho, Y. Chungnam Report; Chungnam Development Research Center: Kongju, Korea, 2014; Volume 101, pp. 6–10. Available online: http://www.cdi.re.kr/report/view.asp?id=E1&code=040200&sid=E102&page=1&ori_keyword=&keyword1=101&cd=gNeKHDVO22p1hSAFT0vhaA%3D%3D&S5=&xx=0 (accessed on 16 June 2016).
  21. Hasse, D. Urban Ecology of Shrinking Cities: An Unrecognized Opportunity? Nat. Cult. 2008, 3, 1–8. [Google Scholar] [CrossRef]
  22. Ahn, J.; Woo, J.; Yoon, H.; Lee, D.; Lee, S.; Lee, Y.; Lee, Y.; Lee, W.; Lim, Y. Forest Management; Hyangmunsa: Seoul, Korea, 2007. [Google Scholar]
  23. Choi, J.; Park, H.M.; Lee, S.D. An analysis of wildlife roadkill based on land cover in south korea expressway: In case of jungbu expressway. In Proceedings of the Int’l Conference on Waste Management, Ecology and Biological Sciences (WMEBS’15), Kuala Lumpur, Malaysia, 13–15 May 2015; Available online: http://erpub.org/siteadmin/upload/4514ER1515235.pdf (accessed on 10 May 2016).
  24. Seo, C.; Thorne, J.H.; Choi, T.; Kwon, H.S.; Park, C.H. Disentangling roadkill: The influence of landscape and season on cumulative vertebrate mortality in South Korea. Landsc. Ecol. Eng. 2015, 11, 87–99. [Google Scholar] [CrossRef]
  25. La Rosa, D.; Spyra, M.; Inostroza, L. Indicators of Cultural Ecosystem Services for urban planning: A review. Ecol. Indic. 2015, 61, 74–89. [Google Scholar] [CrossRef]
  26. Brandt, P.; Abson, D.J.; DellaSala, D.A.; Feller, R.; von Wehrden, H. Multifunctionality and biodiversity: Ecosystem services in temperate rainforests of the Pacific Northwest, USA. Biol. Conserv. 2014, 169, 362–371. [Google Scholar] [CrossRef]
  27. Korea Culture and Tourism Institute, Tourism Knowledge and Information System. Available online: http://know.tour.go.kr/stat/visitReportStatAfterReportDis.do?enterCode=1 (accessed on 2 June 2016). (In Korean)
  28. Casalegno, S.; Inger, R.; DeSilvey, C.; Gaston, K.J. Spatial Covariance between Aesthetic Value & Other Ecosystem Services. PLoS ONE 2013, 8, 1–5. Available online: http://journals.plos.org/plosone/article?id=10.1371/journal.pone.0068437 (accessed on 24 May 2016). [Google Scholar]
Figure 1. Research framework. The basic categories for mapping and selection of cultural assets were based on pre-existing information compiled by Korean Government agencies. After the mapping and weighing of such characteristics through GIS mapping software and application of the Overlay Method, Hubs and Links were defined, and two main categories (Ecological and Socio-cultural) formed the Yesan GI Plan.
Sustainability 09 00192 g001
Figure 2. Yesan County’s location within the Republic of Korea and in relation to Seoul. Yesan is composed of two eup (town) and ten myeon (township).
Sustainability 09 00192 g002
Figure 3. Ecological and Socio-cultural category subdivisions scheme for Yesan’s GI Network Plan and its indicators.
Sustainability 09 00192 g003
Figure 4. Yesan’s physiological characteristics: (a) First-Degree ecological features, which integrates areas with high ecological value; (b) Protected Areas, areas with wildlife and hydrological resources worthy of protection; (c) Forestry and agriculture areas, comprised of forest-protected lands and farmlands; (d) Hydrological resources, which includes rivers, wetlands and a 100 m buffer around them; (e) Roadkill information, conjoint information of mammal, amphibian, and bird population roadkill incidents; and (f) Slope, Yesan’s slope divided into five classes.
Sustainability 09 00192 g004
Figure 5. (a) Yesan Eco Hubs, comprised of the First-Rank Ecological Features and the Protected Areas; (b) Green Corridors, with the three levels of corridors’ importance and Hydrological Resources; and (c) Yesan’s New Eco Hubs, defined by roadkill information data.
Sustainability 09 00192 g005
Figure 6. Yesan’s socio-cultural assets characteristics: (a) Yesan cultural districts with their 100 m protection buffer; (b) Recreation and ecotourism: Yesan cultural districts’ visitation weight; and (c) Aesthetic value and inspiration: Aesthetic value weights for touristic areas.
Sustainability 09 00192 g006
Figure 7. Yesan GI Network Culture Hubs. Culture Hubs defined based on Yesan Cultural Districts definition, Cultural District’s visitation weight and Aesthetic value of the touristic areas.
Sustainability 09 00192 g007
Figure 8. Yesan’s final Green Infrastructure Network comprised of the existing ecological value areas (Eco-hubs), new designated important ecological areas (NEW Eco-hubs), social and cultural value areas, stepping stones provided by wetlands and corridors defined by hydrological areas and the first and second importance corridors.
Sustainability 09 00192 g008
Table 1. Yesan’s connectivity challenges and opportunities.
Challenges and OpportunitiesPhysicalSocio-CulturalEnvironmental
Connectivity challenges
  • Infrequent public transportation
  • Scarcity of green public spaces destined to promote social interaction within the core of the town
  • Natural ecosystems interruption due to segregated development projects
  • Higher taxi prices compared to bigger cities (e.g., Seoul, Daegu Metropolitan city)
  • Cultural/historical value assets not easily accessible from main town areas
  • Disruption of high ecosystem value areas through agricultural practices and road construction
  • Lack of proper pedestrian roads between local towns/villages
  • Disturbance in wildlife mobility areas (roadkill)
Opportunities
  • Located less than 2 hours away from capital city, Seoul (bus, train)
  • Existence of various cultural/historical assets
  • Various natural assets classified as First-Degree Ecological Features
  • Express-ways, secondary, and tertiary roads connecting to surrounding areas
  • Diverse touristic spots
  • Natural scenery with high aesthetic value
  • Slope
  • Considered a life-long education town
  • One first-degree Provincial Stream (Sapgyo stream)
  • Large farming areas, which occupy approximately 21% of Yesan’s territory
  • 11 lakes and marsh reservoirs
  • Breathtaking views
  • Forest resources represent 69.1% of Yesan’s land
Table 2. Set of Cultural Ecosystem Services Categories [25] and weights assigned.
Cultural Ecosystem Services Categories # Number of Indicators Found Linked to the ServiceWeight
Recreation and Ecotourism35 (95%)3
Aesthetic value18 (53%)2
Spiritual and Religious values4 (11%)2
Cultural Heritage5 (13%)2
Inspiration4 (11%)2
Sense of place2 (5%)2
Cultural diversity-1
Educational value-2
Knowledge systems1 (3%)2
Social relations1 (3%)2
Table 3. Cultural Ecosystem Services categories final selection.
Cultural Ecosystem Services CategoriesWeight
Cultural Heritage + Spiritual and Religious values2
Recreation and Ecotourism3
Aesthetic value + Inspiration2
Table 4. Yesan’s Cultural Districts.
Cultural District NumberCultural Assets within the Districts
1
  • Kim Jeonghee’s relics, house, remains, Rock Inscription and tomb
  • Wolseongwi Tomb
  • Yesans’s White Pine
  • Hwasunongju’s door
2
  • Prince Namyeon’s Tomb and Epitaph
  • Yesan’s Gayasaji
  • Sanggari’s Buddha statue
3
  • Relics related to Yun Bong-gil
  • Chungeuisa
4
  • Deoksan Thermal Waters area
5
  • Sudeoksa’s 3 and 7 story Stone Pagodas and Main Temple
6
  • Hyangcheon Temple, temple’s Budo Tower and 9 story Stone Pagoda
7
  • Lee Nam-gyu’s house
  • Yesan’s Sanghangni Stone Buddha
8
  • Daeheung Confucian Shrine and shrine’s Gingko Tree
9
  • Yi Seong-man brothers’ monument
  • Yesan’s Daeheung Government offices
10
  • Daeheungimjon Fortress
Table 5. Yesan’s Touristic Spots’ visitation weight.
Touristic SpotCultural DistrictTotal VisitorsVisitation Weight
Chusa GotaekDistrict 12,778,5443
ChungeuisaDistrict 31,564,3402
Deoksan Thermal Waters’ Touristic areaDistrict 415,739,2114
SudeoksaDistrict 512,194,5614
Korea’s architectural museum--2,632,0133
Yedang Reservoir Touristic area--2,195,0513
Table 6. No. of geotagged images for the 10 Cultural Districts found in Google Earth and Google Maps.
District NumberNo. of Geotagged ImagesAesthetic Value
Google EarthGoogle MapsTotal
1273302
2315182
317 *20 *37 *2
4
5811392204
6320232
70001
81341
9103132
10126272
Yedang Reservoir3138693
KNU Yesan Campus213242
Korea’s Architectural Museum020202
* Districts 3 and 4 were combined as per the overlapping of their buffering zones.
Table 7. Final list of cultural assets in Yesan County that comprise Culture Hubs.
Cultural AssetFinal Weight
Cultural District 12
Cultural District 21
Cultural District 32
Cultural District 43
Cultural District 54
Cultural District 61
Cultural District 71
Cultural District 81
Cultural District 91
Cultural District 101
Yedang Reservoir3
KNU Yesan Campus2
Korea’s Architectural Museum2

