Article

Efficiency Allocation of Provincial Carbon Reduction Target in China’s “13·5” Period: Based on Zero-Sum-Gains SBM Model

1
College of Accounting, Nanjing University of Finance & Economics, Nanjing 210046, China
2
College of Economics and Management, Research Institute of Financial Development, Nanjing University of Aeronautics and Astronautics, Nanjing 211106, China
3
College of Economics and Management, Huainan Normal University, Huainan 232038, China
*
Author to whom correspondence should be addressed.
Sustainability 2017, 9(2), 167; https://doi.org/10.3390/su9020167
Submission received: 18 November 2016 / Revised: 12 January 2017 / Accepted: 17 January 2017 / Published: 24 January 2017

Abstract

:
Firstly, we introduce the “Zero Sum Gains” game theory into the SBM (Slacks-based Measure) model, and establish the ZSG-SBM model. Then, set up 4 development scenarios for the China’s economic system in “13·5” (The Chinese government formulates a Five-Year Planning for national economic and social development every five years, “13·5” means 2016 to 2020.) period through two dimensions as economic growth and energy consumption structure, and make the efficient allocation in provincial level of carbon reduction target by using the above ZSG-SBM model based on the China’s overall carbon reduction constraint (18%) which is set in “13·5” planning. Finally, we analyze the provincial development path of low-carbon economy by comparing the economic development status with the allocated result of carbon reduction target. Results show that: After the ZSG-SBM model being applied to the efficiency allocation of carbon emission, the input and output indicators of the 30 provinces realize the effective allocation, and the carbon emission efficiency reaches the efficiency frontier. The equity-oriented administrative allocation scheme of government will bring about efficiency loss in a certain degree, and the efficiency allocation scheme, based on the ZSG-SBM model, fits better with the long-term development requirement of low-carbon economy. On the basis of carbon intensity constraint, the re-constraint of energy intensity will force the provinces to optimize their energy consumption structure, thereby enhancing the overall carbon emission efficiency of China. Sixteen provinces’ allocation results of carbon reduction target are above China’s average (18%) in “13·5” period, all the provinces should select appropriate development path of low-carbon economy according to the status of their resource endowment, economic level, industrial structure and energy consumption structure.

1. Introduction

Greenhouse gases are the source of global warming, and energy conservation and emission reduction has become a global consensus [1,2,3]. Owing to reconcile the demands of both economic development and energy saving and emission reduction, China’s government actively implemented the sustainable development path of low-carbon economy since the global climate conference in Copenhagen, and firstly definitely stipulate the reduction target (17%) of carbon intensity in China’s “12·5” Planning. Namely, we would decrease 17% of CO2 emission on the same level of economic outputs. The China’s “13·5” Planning further clearly put forward that the national carbon intensity at the end of 2020 should have an 18% lower than the end of 2015 [4,5]. Visibly, low-carbon economy will be the basic trend of China’s economic development in future period. However, a large number of studies have indicated that due to great differences in economic scale, resource endowment, industrial structure and energy consumption structure of China’s different provinces, there are great differences in carbon intensity among China’s provinces [6,7,8,9]. Miao et al. [10] found that setting the same emission reduction target may cause the low efficiency of each province. Therefore, it is necessary to allocate the provincial CO2 emission reduction target according to the actual situation of provincial carbon intensity. In addition, it has important guiding significance for setting the corresponding economic development planning and industrial structure adjustment strategy.
The following content of this paper is organized as follows. In Section 2, we summarize the literature about this issue. Section 3 discusses the methodology and the data which is used in this paper. Results are calculated in Section 4, respectively. Finally, Section 5 concludes this paper.

2. Literature Review

Carbon emission reduction is an important academic issue concerned by scholars, the relevant research focused on analysis of the evaluation of carbon emission performance, estimation of carbon emission reduction potential and carbon emission reduced cost, so we firstly introduce the related results of existing research in these three aspects.
The research on the performance evaluation of carbon emission was mostly based on Data Envelopment Analysis (DEA) method. DEA was applicable for the efficiency evaluation of complex system which included multi inputs and outputs because of that we didn’t need to set the form of the model in advance when using it [11,12,13]. However, Tone [14] found that the traditional DEA model only estimated the efficiency of each decision making unit, it could not reflect the improvement path of the inefficiency decision making unit, he proposed the SBM model. With the carbon emission problem become more and more prominent in the world, the problem of carbon emission also become the focus academic issue. Yang et al. [15], Zhang et al. [16] and Wu et al. [17] believed that the carbon emission was produced associated with economic outputs, it was the inevitable environmental externality of economic production system. Therefore, they applied carbon emission into the efficiency evaluation model as a “bad output” to construct undesirable SBM model. At present, the undesirable SBM model was widely used in the study about the performance evaluation of carbon emission [18,19,20,21,22]. There were also many research took attention to China’s provincial carbon emission efficiency, the basic conclusion was that China’s provincial carbon performance were differences, and showed gradually rising space trend from the west to the east areas at present [23,24].
On the basis of the performance evaluation of carbon emission, a large number of domestic and foreign scholars analyzed the China’s overall, regional, provincial and industrial carbon emission reduction potential. Du [25], Zhang et al. [26] respectively used undesirable SBM model and non-radial Malmquist index to calculate China’s overall and regional carbon emission reduction potential, they found that reduction potential of China’s overall and regional carbon emission were great. Li [27] also obtained the similar conclusion, the results showed that the overall carbon emission reduction potential of China reached more than 35%, and it was greater in central and western areas where their economy were relatively backward. The research results about China’s provincial carbon emission reduction potential also tend to be same, namely carbon emission reduction potential of central and western provinces were significantly greater than the reduction potential of Beijing, Shanghai, Jiangsu and other economically developed provinces because their economic development level and per capita income were low [28,29,30]. In addition, the analysis on the industry level, Feng et al. [31], Zhang et al. [22] calculated carbon emission reduction potential of China’s power industry and the whole industries. They found different industries had different carbon emission reduction potential.
At present, there were mainly three types of methods for calculating carbon emission reduction cost as bottom-up model, top-down model and mixed model, mainly included the dynamic optimization model [32,33], input-output analysis [34], computable general equilibrium model, mixed model [35,36] and efficiency analysis model [37], and so on. We focused on the relevant literature based on the efficiency analysis model since we also used it in this paper. The theoretical basis of the efficiency analysis model were the dual theory and distance functions, it took the shadow price of carbon emission to represent the marginal cost (opportunity cost) of carbon emission reduction. Maradan et al. [38] and Fāre et al. [39] established the directional distance function to measure the shadow price of CO2 emission, and then calculated the carbon emission reduction cost. Their conclusion was that the carbon emission decreased cost would decrease with the increase of per capita income, and it was significantly higher in low-income countries than in high-income countries. Therefore, economic development level was an important factor affected carbon emission decreased cost, and it may be great differences between all provinces in China due to the heterogeneity in economic development levels.
In conclusion, there were great gaps of carbon performance, carbon emission reduction potential and carbon abatement cost between various provinces in China, averagely distributed the national carbon emission reduction target to all the provinces would inevitably bring the loss of carbon emission reduction efficiency. In addition, performance evaluation of carbon emission, analysis of carbon emission reduction potential and determination of carbon emission reduction cost were the basis of setting carbon emission reduction target. Carbon performance evaluation outlined logic relationship between “economic output, energy consumption and carbon emission” by mathematical model, and calculated current situation of provincial performance of carbon emission [23]. Analysis of carbon emission reduction potential provided the possible direction and path for national carbon reduction policy [40]. Measurement of carbon emission reduction cost was represented the expense for implementation of carbon emission reduction target in each stage. All of them were further service to decision-making problem of setting carbon emission reduction targets [41]. The existing research have provided the theoretical basis and quantitative measurement methods for determining the carbon emission reduction targets, however, determination the carbon emission reduction target in practice was always the total target in national level. Such as, carbon emission reduction target which setting in China’s “13·5” and “13·5” Planning. Therefore, the allocation of provincial carbon emission reduction targets in China’s “13·5” period from perspective of efficiency had important significance. Therefore, how to allocate national carbon emission target to each province? How to ensure the efficiency in the allocated process? These problems needed to be studied to ensure the realization of above carbon emission reduction target.
There are some problems in the existing research. Such as, the number of articles, which aimed at provincial allocation of carbon emission reduction targets, was few. In addition, performance evaluation of carbon emission, analysis of carbon emission reduction potential and the calculation of carbon emission reduction cost problem were posterior analysis based on historical data, these research were lack of forward-looking results. Therefore, we do the provincial allocation of carbon emission reduction target in China’s “13·5” period based on carbon emission reduction targets which setting in China’s “13·5” Planning through setting several scenarios and combining the forecast of amount of labor, energy consumption, fixed assets and other inputs and economic outputs in China’s “13·5” period. In addition, we calculate the total carbon emissions in China’s “13·5” period while determining the national total carbon emission reduction target and setting above scenario hypothesizes, and then make the provincial allocation. Therefore, the summary of provincial carbon emissions is equal to national total carbon emissions, the distribution process is similar to the game theory of “zero sum gains”. Therefore, we construct a SBM model based on zero and return (zero sum gains SBM, ZSG-SBM) to allocate provincial carbon emission reduction target in this paper. ZSG-SBM model combines with the traditional SBM model and the thought of “zero sum gains”.

3. Methodology and Data

3.1. Output-Oriented SBM

Slacks of input and output of decision making units are the decision variables in SBM model. It intuitively reflects the efficiency improved path of decision making units, and it has significant advantages in efficiency evaluation and resources’ efficiency allocation of the economic system while comparing with traditional DEA model [42]. There appeared several SBM models as input-oriented SBM, output-oriented SBM and input-output oriented SBM model [43,44] after Tone [14] firstly proposed the SBM model. In this paper, we take China’s provincial carbon emissions as the research object, establish the ZSG-SBM model based on the output-oriented SBM model. Therefore, the following section, we focus on the output-oriented SBM model.
For an economic system which includes m decision-making units D M U i ( i = 1 , , m ) , each unit has k inputs, l 1 desirable outputs and l 2 undesirable outputs. Its production set T can be represented as:
T = { ( x , y g , y b ) | x i = 1 m x i λ i , y g i = 1 m y i g λ i , y b i = 1 m y i b λ i , x i 0 , y i g 0 , y i b 0 , λ i 0 }
Then, according to the modeling ideas of Tone et al. [45] and Du et al. [25]. The output-oriented SBM model based on the undesirable outputs can be expressed as:
θ o = min 1 1 k k = 1 K ( s o b y o b ) s . t . : i = 1 m x i λ i + s o = x o , i = 1 m y i g λ i s o g + = y o g , i = 1 m y i b λ i + s o b = y o b , λ i = 1 , s o 0 , s o g + 0 , s o b 0 , λ i 0
In the Formulas (1) and (2), θ o represents efficiency of decision-making units D M U o . x , y g , y b represent matrix of inputs, desirable outputs and undesirable outputs. s o , s o g , s o b represent slacks matrix of decision making units. K represents number of undesirable outputs. λ i is a column vector. In this paper, we only consider the carbon emission as the undesirable output. Namely, K = 1 . In addition, then, the output-oriented SBM model based on taking carbon emission as the only undesirable output can be expressed as Formula (3) while assuming that: h o = ( y o b s o b ) / y o b , ( o = 1 , ... , m ) .
θ o = min h o s . t . : i = 1 m x i λ i + s o = x o , i = 1 m y i g λ i s o g + = y o g , i = 1 m y i b λ i = h o y o b , λ i = 1 , s o 0 , s o g + 0 , λ i 0

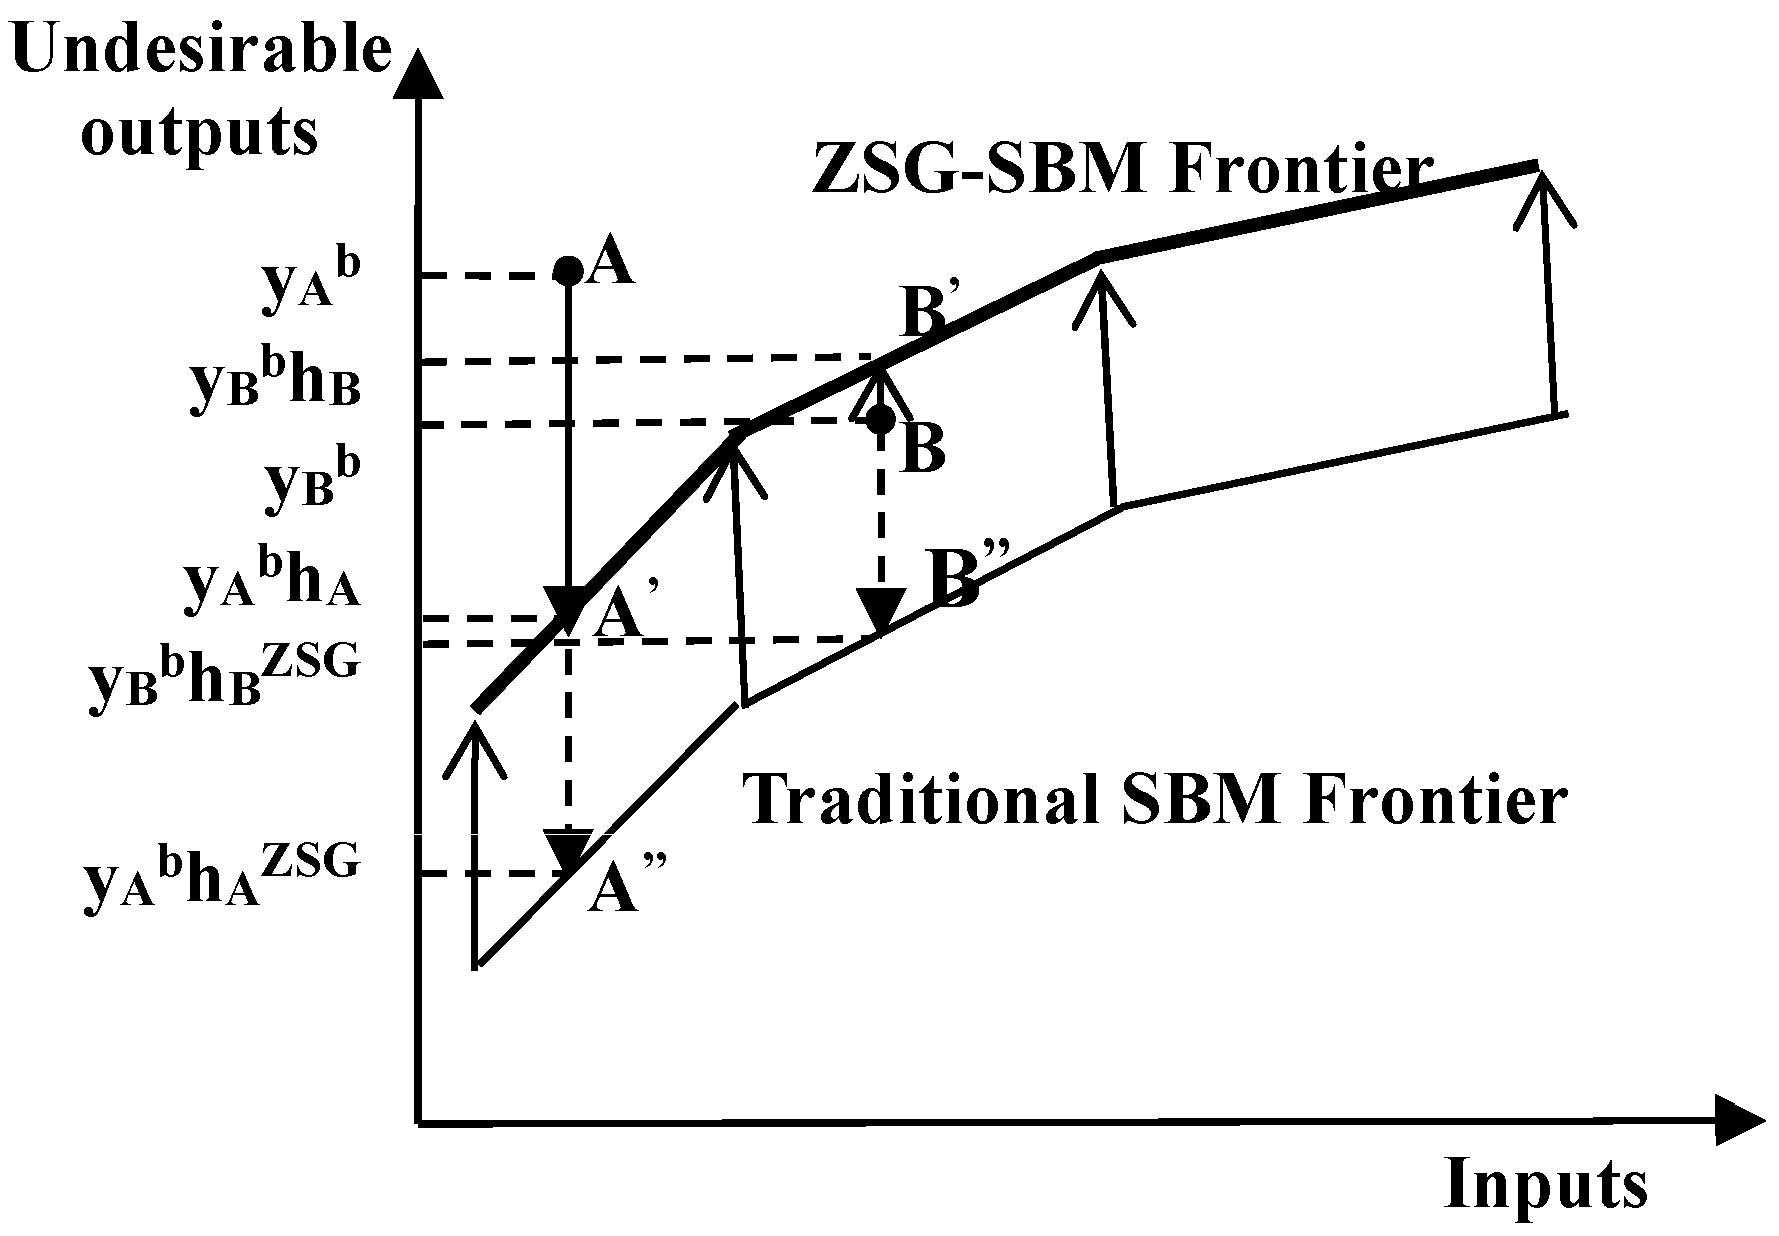
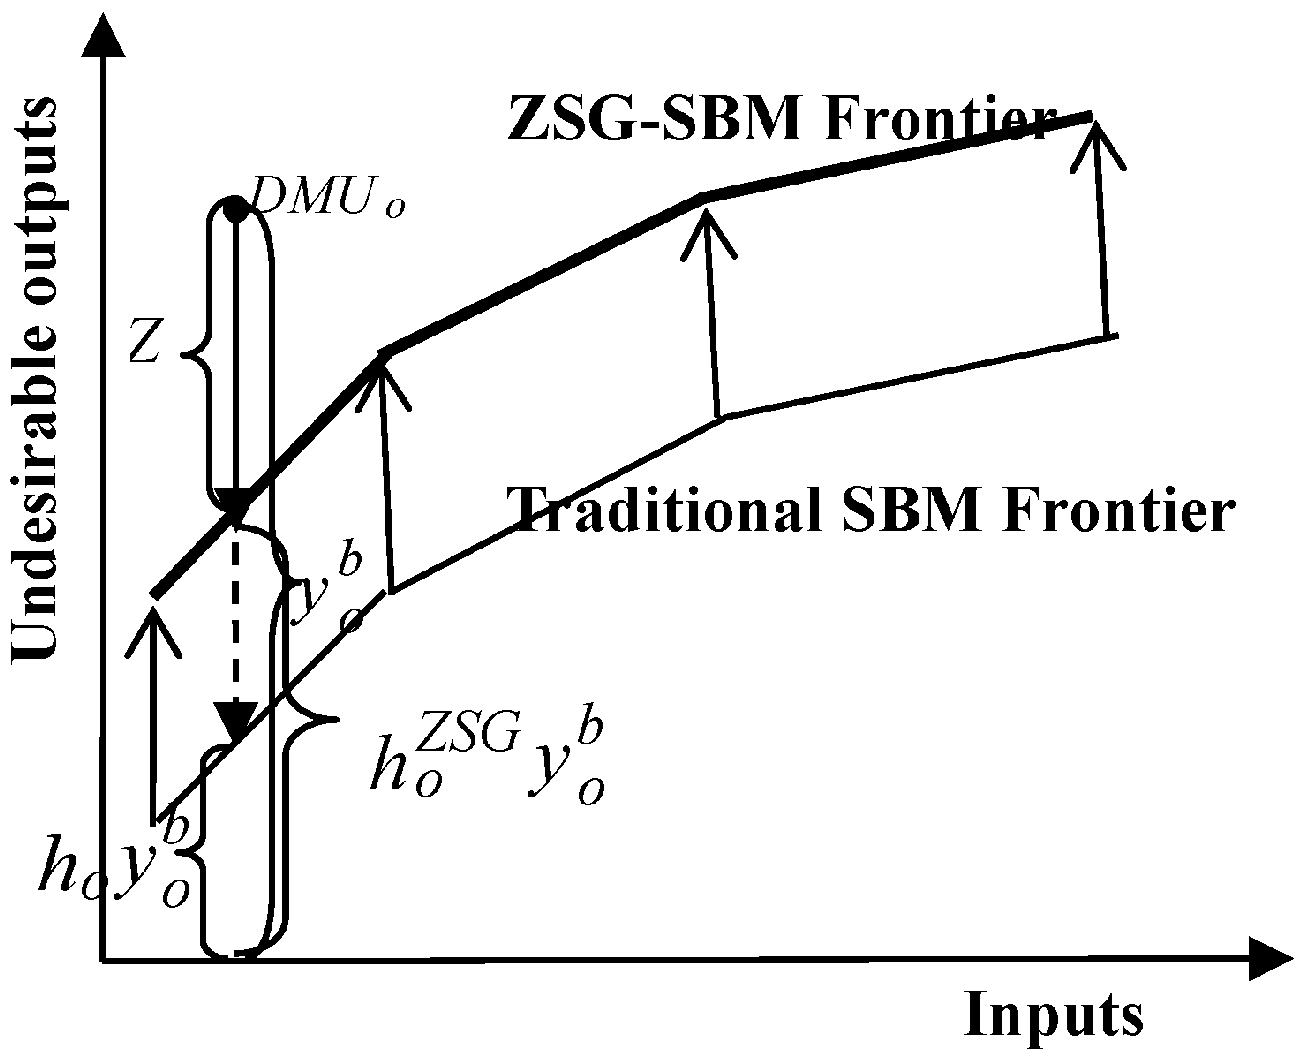
3.2. Output-Oriented ZSG-SBM

(1) Basic principles. In this paper, we take provincial distribution of carbon reduction targets which is specified by China’s “13·5 Planning” as the research object. The distribution of carbon emissions among provinces has certain competitive while overall carbon emissions and GDP is determined in China’s “13·5” period. Namely, the increase of carbon emissions in one province will cause the reduction of carbon emissions in other provinces. It reflects the “Zero Sum Gains” game theory as the total carbon emissions is unchanged. In this paper, we construct an output-oriented ZSG-SBM model based on “Zero Sum Gains” and traditional output-oriented SBM model, and its basic principle is as shown in Figure 1.
According to Figure 1, we find that due to make all the decision-making units to realize the efficiency frontier, the output-oriented ZSG-SBM model reallocates the undesirable outputs slacks of inefficiency decision making units based on the evaluation results of the output-oriented SBM model. Namely, we realize distribution of the undesirable outputs in condition of optimal efficiency.
(2) Mathematical model. We assume that D M U o need to reduce Z unit of undesirable output, and the increase of undesirable output of D M U i ( i o ) is z i . Use y o b to indicate the undesirable output of D M U i after distribution, so:
y i b = y i b + z i , Z = i = 1 , i o m z i
According to basic principle of “Zero Sum Gains” theory, we deduce the general form ZSG-SBM model as:
θ o = min h o Z S G s . t . : i = 1 m x i λ i + s o = x o , i = 1 m y i g λ i s o g + = y o g , i = 1 m y i b λ i = h o Z S G y o b , λ i = 1 , s o 0 , s o g + 0 , λ i 0
In Formula (5), h o Z S G represents efficiency value of D M U o after efficiency distribution, it reflects the gap between efficiency value of D M U o after efficiency distribution and the ZSG-SBM frontier. D M U o needs to reduce Z units outputs to reach the ZSG-SBM frontier, so Z = f ( h o Z S G ) . In addition, Z is needed to be distributed among other decision making units, so y i b = f 1 ( Z ) = f 2 ( h o Z S G ) . Therefore, different allocation strategies may bring the different results while we considering the distribution of Z among other decision making units. We choose proportional allocation strategy which was used by Lins et al. [46] and Gomes et al. [47].
(3) Model solving. We distribute Z according to proportion of undesirable output of D M U i ( i o ) while using proportional allocation strategy. Namely, z i = Z ( y i b / i = 1 , i o m ( y i b ) ) Undesirable output of D M U i ( i o ) after distribution is y i b = y i b + Z ( y i b / i = 1 , i o m ( y i b ) ) . The following Figure 2 shows the relationship between the variables Z , y i b , y i b , h o Z S G based on the proportion of distribution strategy.
According to Figure 2, we find that Z , y i b , y i b , h o Z S G meet the following relationship:
Z = y o b h o Z S G y o b = ( 1 h o Z S G ) y o b y i b = y i b + Z ( y i b / i = 1 , i o m ( y i b ) ) = y i b + ( 1 h o Z S G ) y o b y i b i = 1 , i o m ( y i b ) = y i b ( i = 1 m ( y i b ) h o Z S G y o b i = 1 , i o m ( y i b ) )
Then, undesirable output-oriented ZSG-SBM model in proportional distribution strategy is:
θ o = min h o Z S G s . t . : i = 1 m x i λ i + s o = x o , i = 1 m y i g λ i s o g + = y o g , i = 1 m ( i = 1 m ( y i b ) h o Z S G y o b i = 1 , i o m ( y i b ) ) y i b λ i = h o Z S G y o b , λ i = 1 , s o 0 , s o g + 0 , λ i 0
Assume the optimal solution vector of D M U o in Formulas (3) and (7) are ( h o * , λ i * ) , ( h o Z S G * , λ i * ) , then:
h o * y o b = i = 1 m y i b λ i * h o Z S G * y o b = i = 1 m y i b λ i * ( i = 1 m ( y i b ) h o Z S G * y o b i = 1 , i o m ( y i b ) )
Azadi et al. [48], Paradi et al. [49] believed that changes of output factors of each decision units in equal proportion didn’t affect the reference set of the system frontier in output-oriented SBM model, so:
i = 1 m y i b λ i * = i = 1 m y i b λ i *
Plugging Formula (9) into the Formula (8), we can obtain:
h o Z S G * y o b = h o * y o b ( i = 1 m ( y i b ) h o Z S G * y o b i = 1 , i o m ( y i b ) ) n a m e l y : h o Z S G * = h o * ( i = 1 m ( y i b ) h o Z S G * y o b i = 1 , i o m ( y i b ) )
Formula (10) can be further converted to:
h o Z S G * = h o * i = 1 m ( y i b ) i = 1 , i o m ( y i b ) + h o * y o b
Conducting the iterative calculation according to above solution process until all the decision-making units reached the system frontier, namely h o Z S G * = h o * = 1 . In addition, the distribution of the output has achieved the optimal efficiency.

3.3. Variables and Data

Similar to the existing research, we choose labor, capital and energy consumption as the inputs, choose GDP as the desirable output, and carbon emission as the undesirable output in this paper. We take distribution of provincial carbon emissions as the research object in China’s “13·5” period, and the following calculation involves the relevant data in China’s “13·5” period. Therefore, we firstly set the several scenarios about the condition of economic development, energy consumption structure in “13·5” period.
(1) Setting scenarios. In 2015, China’s “13·5” Planning stressed the economic growth target by 6.5%~7% during the “13·5” period. Therefore, we set two scenarios for the economic growth level as low speed (6.5%) and high speed (7%). At the same time, a large number of studies showed that the energy consumption structure was an important factor affecting carbon emissions and carbon intensity. Therefore, we also set two scenarios for energy consumption structure as changed and unchanged. Under the condition of unchanged of energy consumption structure, the calculation of provincial energy consumption is based on the coefficient of carbon emission in “12·5” period. However, in the condition of changed of energy consumption structure, we calculate provincial energy consumption in “13·5” period by the decrease constraints of energy intensity (15%) which set in China’s “13·5” Planning. Finally, the follow-up study will comprehensively consider all four scenarios.
(2) Indicators and data. Firstly, using the total population of the provinces to represent labor indicators, we calculate it according to average growth rate of provincial population in “12·5” period and the provincial total population at end of 2015. Similar to Li [27], we use the perpetual inventory method to estimate the capital indicators. Combine with the average investment of fixed assets in “12·5” period and the depreciation rate (10.96%), which was calculated by Miao et al. [10] to calculate the provincial capital in “13·5” period. The calculation of energy consumption and GDP indicators is based on the above set of four scenarios. Finally, according to provincial carbon intensity during“12·5” period, the GDP and reduction target (18%) of carbon intensity to push down the carbon emissions indicators during“13·5” period. Through collection and calculation of the data, we obtain the forecast data of inputs and outputs during “13·5” period as shown in Table 1.
Explanation: due to the lack of energy statistic data in Tibet, we do not include it in the sample. In addition, the data of Capital and GDP indictors are treated by taking 2011 as the base year, the treated indictors are the “average consumer price index” and “average price index of investment in fixed assets” respectively.

4. Results and Discussion

4.1. Estimation of Provincial Carbon Emission Efficiency

According to the Formula (3) and above 4 scenarios, we calculate the carbon emission efficiency of various provinces in China by using Matlab2009a software. Due to limited space, we only take the results of 2020 as an example to show its calculation process (Table 2).
The results show that:
(1) In all of the 4 scenarios, the differences of carbon emission efficiency among China’s 30 provinces will be great while using the average distribution principle to allocate carbon emission reduction target. The maximum gap will achieve 54.56% between Beijing and Shanxi province.
(2) The efficiency value of Beijing, Hainan and Qinghai province are 1.0000, it shows that the above three provinces are always on the data envelopment frontier, and their carbon emissions, amount of labor, capital, energy consumption and GDP achieve the Pareto optimal state. This is consistent with the existing literatures. The advantage of Beijing in carbon emission efficiency mainly originated from its strict environmental regulation policy, optimization of its industrial structure and the advanced production technology. In addition, the environmental situation of Hainan province and Qinghai province has been at the forefront in China.
(3) The efficiency of developed eastern provinces, such as Tianjin, Shanghai Jiangsu, Zhejiang, Fujian, Shandong and Guangdong are high, especially in scenario 1, Tianjin, Shanghai, Jiangsu and Guangdong province reach the data envelopment frontier. However, carbon emission efficiency of central, western provinces and the three provinces in Northeast of China where the economic are not so developed were generally low. The main reason may be that the development path of low-carbon economy has been implemented in China for many years, due to the advantage of economic and technical level, the developed provinces such as Beijing, Tianjin and Shanghai have been pioneers in the low-carbon economy and green economy, they also undertake the most stringent constraint target (18%–20%) of carbon emission intensity during China’s “12·5” period. All of these laid the foundation for these developed provinces obtaining higher efficiency of carbon emissions in China’s “13·5” period, and even more distant future.
(4) Through comparing the calculated results in scenario 1 and scenario 2, scenario 3 and scenario 4. We find that, the greater the economic growth level, the higher the provincial carbon emission efficiency while amount of population and capital scale are fixed. However, the average growth rate of carbon emission efficiency (0.18%) is far lower than the economic growth rate (0.50%), it shows that the effect is poor while seeking the economic growth alone for improving the efficiency of China’s provincial carbon emission, we should pay attention to the distribution and matching of labor, capital, energy, carbon emissions and GDP in economic production system. At the same time, through comparing the calculated results in scenario 1 and scenario 3, scenario 2 and scenario 4, we find that the carbon emission efficiency of 30 provinces under the condition of dual constraints as provincial carbon emission intensity and energy intensity constraint are better than the constraint of carbon emission intensity alone. It shows that, on the basis of the constraint of carbon emission intensity, re-constraint of energy intensity will force the provinces to adjust and optimize the energy consumption structure, thus more close to the efficiency data envelopment frontier.

4.2. Allocation of Provincial Carbon Emission Reduction Target

On the basis of measurement of carbon emission efficiency in China’s 30 provinces, we calculate the efficiency distribution lines of provincial carbon emission and the change of provincial carbon emission intensity based on ZSG-SBM model through two iterations in all of the above 4 scenarios. The results are shown in Table 3.
According to Table 3, we find that:
(1) In the four scenarios, respectively through iterative calculating by using ZSG-SBM model. The China’s provincial carbon emission ZSG-SBM efficiency ( h o Z S G * ) are 1.0000 finally. It shows that all the provinces have reached the frontier after efficiency distribution of carbon emission among provinces, and realize the efficient collocation of all the inputs and outputs in 30 provinces.
(2) There are 16 provinces need to further allocated reduce their carbon emissions which include Hebei, Shanxi provinces, and so on. Most of them have low carbon emission efficiency and underdeveloped economic. A part of them are the main industrial provinces of our country, such as the three provinces located northeast China. In these provinces, the high pollution industry accounts for a larger proportion, and the economy are underdeveloped, their environmental processing technology are also backward. Therefore, their carbon emission efficiency is always low. A part of them are the provinces which with good resource endowment, such as Shanxi province. Good resource endowment causes relatively low cost of regional energy resources, then their energy consumption is larger than other provinces, also cause their low carbon emission efficiency. Some of them are the western regions as Gansu, Guangxi province. Due to the backward production technology, the economic production efficiency of these provinces are lowest, their carbon emission efficiency is low too. Therefore, these provinces should reduce carbon emissions from view of carbon emission efficiency distribution.
(3) There are 16 provinces need to further allocated increase their carbon emissions which includes Beijing, Tianjin provinces, and so on. These provinces are mostly developed economy, and located in the eastern area, their carbon emission efficiency are high, such as Beijing and Shanghai. Due to the developed economy, people in these provinces have relatively higher income, and pay more attention and stronger requirement to the living environment. Therefore, these provinces pay more attention to the investment and technology improvement of environmental pollution. All of these cause high carbon emission efficiency in these provinces. A small number of provinces have less secondary industry and good environmental condition, such as Hainan and Qinghai province. The carbon emission efficiency of these provinces are high, these provinces can increase carbon emissions from view of carbon emission efficiency distribution in “13·5” period. Namely, we can reduce the carbon emission constraint target of these provinces.
(4) The last line of Table 3 lists overall total carbon emissions, total carbon emissions after ZSG-SBM distribution and increase or decrease of amount of carbon emissions in 30 provinces based on scenario 1 which corresponding to condition of high-speed economic growth and energy structure changed at end of “13·5” period. The results show that, the increase or decrease amount of total carbon emissions is 0, namely total carbon emission (8532.40 million tons) remain unchanged under the carbon emission intensity constraint in “13·5” period, and overall carbon emission intensity keeps unchanged too. This result reflects the modeling thought of “zero sum gains”, namely efficiency distribution of carbon emissions was among provinces based on the overall carbon emission reduction target. Moreover, results in conditions of scenario 2, scenario 3 and scenario 4 are similar to scenario 1, and we do not repeat them in this paper.

4.3. Analysis of Differences between Efficiency Allocation and Administrative Allocation

In 2016, the “greenhouse gas emission controlling program during 13·5 period”, issued by the State Council, determined the carbon emission reduction targets of China’s various provinces. Beijing, Tianjin, Hebei, Shanghai, Jiangsu, Zhejiang and Guangdong provinces obtained the largest carbon emission intensity constraint (20.5%). Followed by Fujian, Jiangxi, Henan, Hubei, Chongqing and Sichuan provinces (19.5%). while the carbon emission intensity constraint were 18% in provinces of Shanxi, Liaoning, Jilin, Anhui, Hunan, Guizhou, Yunnan and Shaanxi. Neimenggu, Heilongjiang, Guangxi, Gansu and Ningxia fell by 17%; and finally, the carbon emission intensity constraint of Hainan, Qinghai and Xinjiang were 12%. We compare the differences between ZSG efficiency distribution target and above administrative distribution target of carbon emission intensity in all provinces. The results are showed in Table 4 as follows.
The results show that:
(1) There is large difference between the ZSG distribution target and state administrative allocation target in carbon emission intensity during “13·5” period. There are 15 provinces’ ZSG distribution target are lower than their state administrative allocation target which included Beijing, Tianjin provinces. The other 15 provinces are in contrast. It is noteworthy that ZSG distribution target of Hainan and Qinghai province in carbon emission intensity are relatively low. However, their state administrative allocation target are far lower than other provinces due to their well foundation of environmental protection, it causes that their ZSG distribution target are higher than their state administrative allocation target in carbon emission intensity.
(2) In the case of scenario 1, Guangdong, Jiangsu, Beijing and Shanghai obtain the biggest positive differences. These provinces have a high economic development level, and leading environmental pollution treatment technology. The state government give them higher carbon emission intensity reduction target to make them continue to play their advantage, excavate reduction potential, and play an exemplary role in China low-carbon economy transformation process. Xinjiang, Shanxi, Gansu, and Heilongjiang provinces obtain the biggest negative differences. Shanxi province is the largest energy producing and exporting province of China, the good natural resource endowment may cause its low energy cost, and the cost controlling of the enterprises in Shanxi province are more dependent on input of energy resource. Heilongjiang province is China’s heavy industry province, and there is a large proportion of polluting industries. Xinjiang and Gansu province are economic backward provinces, and their pollution controlling technology is relatively backward. All of these may be possible explanations for their low carbon emission efficiency. Therefore, they should undertake high responsibility for carbon emissions reduction from the calculated results of “efficiency oriented”. However, the administrative allocation mechanism of government was based on “fairness oriented” of provincial carbon emission reduction targets, paid more attention to the status of resource endowment, economic development level and industry structure in these provinces. Therefore, the government appropriate to reduce these provinces’ responsibility in carbon emission reduction, thus leading the results of biggest negative differences in these provinces. Carbon emission intensity reduction target allocation through “fairness oriented” is bound to lead efficiency loss in a certain degree. Therefore, the carbon emission reduction target allocation method based on “efficiency oriented” is more satisfy to the concept and requirement of low-carbon economy from the long-term goal of economic development in China. It realizes efficient configuration of labor, capital, energy, GDP and carbon emission of all the 30 provinces, and achieves Pareto optimal of the inputs and outputs.
(3) We find that using dual constraints of carbon emission intensity and energy intensity will increase the difference between provincial ZSG distribution target and state administrative allocation target in carbon emission intensity while the level of economic development is fixed through comparing the results of the sixth column (scenario 1) and the ninth column (scenario 3) in Table 4. Namely, their gap will increase in conditions of scenario 1 and scenario 3. The possible reason may be that, dual constraints of carbon emission intensity and energy intensity will cause the efficiency frontier moving down while comparing with the single constraint of carbon emission intensity, there are more carbon emissions need to be allocated, thus widening the gap of carbon emission intensity in all the provinces before and after ZSG allocated.

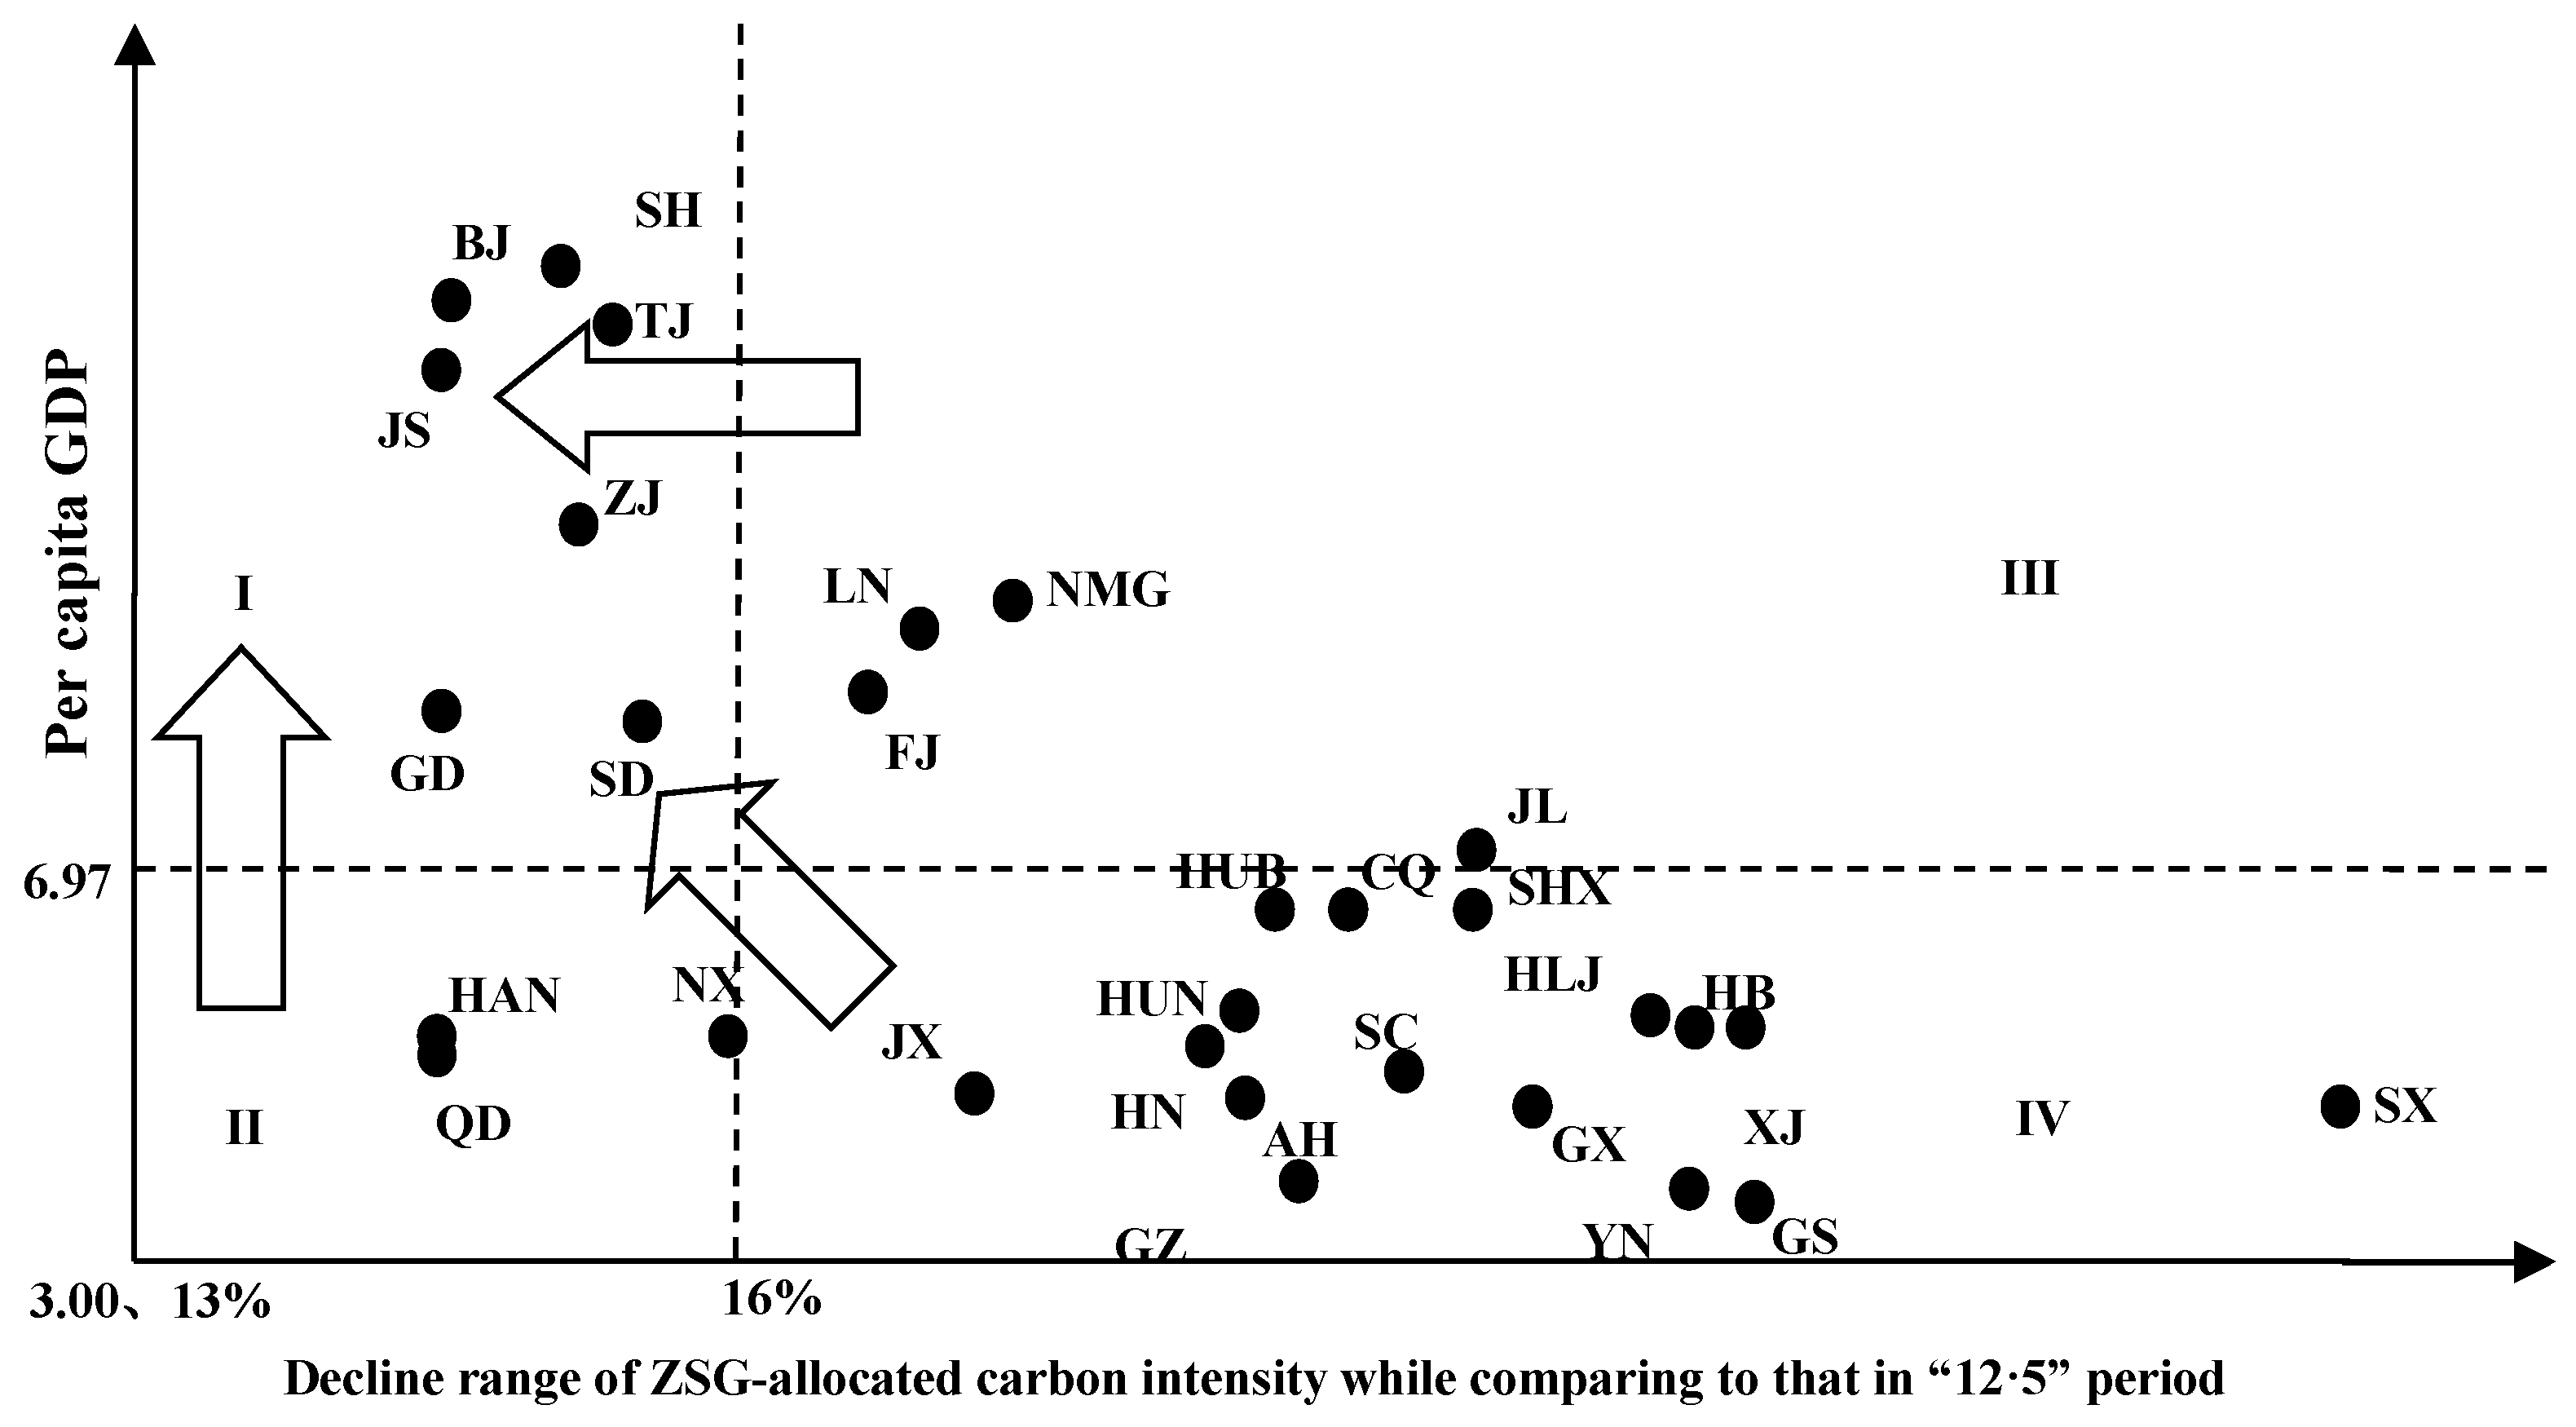
4.4. Analysis on the Development Path of Low-Carbon Economy of All Provinces in “13·5” Period

Development path of low-carbon economy contains two aspects of contents as “economic growth” and “environment friendly”. The previous research results show that, due to provincial heterogeneity in resource endowment, energy consumption structure and other factors, it will make huge difference of provincial carbon emission efficiency while average allocated carbon emission reduction target (18%) what set in China’s “13·5” Planning to all provinces. Although the “13·5 work planning for controlling greenhouse gas emissions” had adjusted provincial carbon emission reduction targets, but the results in Table 4 show that the adjustment results do not achieve the most optimal configuration to the inputs and outputs in provincial “economic-environment- energy” system. Therefore, we take scenario 1 as an example in following contents. In order to explore the development path of low-carbon economic of all the provinces, we respectively take per capita GDP by 69.70 thousand RMB/person and carbon emission reduction target by 16% as the boundary, divide 30 provinces in China into 4 areas as high per capita GDP low pressure of carbon emission reduction, low per capita GDP low pressure of carbon emission reduction, high per capita GDP high pressure of carbon emission reduction and low per capita GDP high pressure of carbon emission reduction form two dimensions of “economic growth” and “environment friendly”. Namely, if the province’s ZSG distribution carbon emission intensity decreases by more than 16%, it indicates that the province’s carbon emission reduction pressure is high. Results are showed in Figure 3.
Explanation: BJ-Beijing, TJ-Tianjin, HB-Hebei, SX-Shanxi, NMG-Neimenggu, LX-Liaoning, JL-Jilin, HLJ-Heilongjiang, SH-Shanghai, JS-Jiangsu, ZJ-Zhejiang, AH-Anhui, FJ-Fujian, JX-Jiangxi, SD-Shandong, HN-Henan, HUB-Hubei, HUN-Hunan, GD-Guangdong, GX-Guangxi, HAN-Hainan, CQ-Chongqing, SC-Sichuan, GZ-Guizhou, YN-Yunnan, SAX-Shaanxi, GS-Gansu, QH-Qinghai, NX-Ningxia, XJ-Xinjiang.
According to Figure 3, we find that:
(1) Beijing, Shanghai, Guangzhou and other 7 provinces are located in area I, which indicates that these provinces have high per capita GDP, and their pressure of carbon emissions reduction are relatively low, almost realize the development model of low-carbon economy. These regions should increase the use of wind power, hydropower and other clean energy to further reduce carbon emission intensity, reduced carbon emissions of per unit energy consumption by adjusting the energy consumption structure and optimizing the carbon emission coefficient.
(2) Hainan, Qinghai and Ningxia provinces are located in area II, which indicates that these 3 provinces’ pressure of carbon emissions reduction is relatively low. They should focus on enhancing its per capita GDP to transform into the development path of low-carbon economy. Among them, Hainan province can catch the development opportunity on taking part in China’s “Sea Silk Road Economic Belt Strategy in 21 Century”. Accelerated the development of modern financial services, modern logistics industries. The unique geographical and climatic characteristics of Qinghai and Ningxia provinces create unique advantages and characteristics of their agriculture and husbandry. They are important provinces of China’s agriculture and husbandry. Therefore, they should highlight their characteristics of agricultural products and advantages of excellent ecological environment, vigorously developed ecological agriculture and husbandry which are characterized, high efficiency and brand effect. In addition, extend to the upstream industry chain, ensure the supply and sale system operated well through the development and optimization of agricultural products processing industry, further improve the level of economic development.
(3) Provinces which are located in area III have high per capita GDP and high carbon emissions pressure, and they should pay more attention to reduce carbon emissions intensity to realize low-carbon economic development. Among them, Fujian province should full play its area advantage of linking two developed economic areas as the Yangtze River Delta and the Pearl River Delta regions and the coastal area advantage itself. On the one hand, strengthen resource sharing with the Yangtze River Delta, Pearl River Delta regions to promote the third industry agglomeration which included financial services industry. On the other hand, full use of the advantages of offshore wind power, speed up the adjustment of energy consumption structure, reduce the carbon emission intensity. Liaoning province is the main industrial province in China, Neimenggu province is also the major coal exporting province, and these two provinces should focus on the upgrading of the industrial structure, play efforts to reduce the proportion of high pollution and high energy consumption industries.
(4) Provinces which are located in area IV had low per capita GDP and high carbon emissions pressure. Among them, per capita GDP of Hubei, Chongqing, Shaanxi and Jilin provinces are closed to China’s overall average per capita GDP. Therefore, these provinces should firstly consider raising their level of local economic development, to close to the area III, and then reduce the carbon emission intensity. However, the per capita GDP of Jiangxi, Hunan, Henan, Anhui, Guizhou and Sichuan provinces are far smaller than China’s overall average per capita GDP. They should firstly focus on the reduction of carbon emission intensity, namely, tap their own potential of energy saving and adjust energy consumption structure, close to area II. The Shanxi province which have large proportion of high energy consumption industries due to its resource endowment, it should accelerate the elimination of coal mining, steel and coal chemical industries’ overcapacity, pay more attention to reshape the industry structure. Finally, the developing provinces as Guangxi, Yunnan, Gansu and Xinjiang should pay equal attention to both economic development and carbon emission reduction targets, and choose the priority objective according to the actual situation themselves.

5. Conclusions

We establish the ZSG-SBM model in this paper by introducing “zero sum gains” game theory into traditional SBM efficiency measurement model. We then set four kinds of scenarios from the two dimensions of economic growth and energy consumption structure on account of actual situation of economic system in “13·5” period. Then, we carry out the efficiency allocation for China’s 30 provinces’ reduction targets of carbon emissions intensity by applying the above ZSG-SBM model. Finally, through comparing the efficiency allocated results with the national administrative allocation planning, we explore the development path of China’s various provinces’ low-carbon economy during “13·5” period. The mainly conclusions of this paper are as follows:
(1) In the four kinds of scenarios, the differences of carbon emission efficiency among China’s 30 provinces are great while using the average distribution principle to allocate carbon emission reduction target which is set in China’s “13·5” Planning (18%). The carbon emission efficiency of the eastern provinces and the provinces, which have a good environmental situation, are high. Their carbon emission efficiency reaches or is close to the frontier of provincial economic system, while the underdeveloped central and western regions are in contrast. While ZSG-SBM model is applied by efficiency allocation of provincial carbon emissions, the efficiency ( h o Z S G * ) of 30 provinces are 1.0000, reaching the efficiency frontier. It indicates that the labor, capital and energy, GDP and carbon emissions of all the provinces realize effective allocation and Pareto optimal.
(2) Due to the heterogeneity of energy resource endowment, economic development level and the existing industrial structure in various provinces of China, at present, the state administrative allocation mechanism on provincial carbon emission reduction targets are mainly based on “fairness oriented”. The government should balance many factors as regional economic growth, the improvement of residents’ living level while setting provincial carbon emission reduction targets, and ensure the feasibility of these provinces to achieve carbon reduction targets in the short term. However, the administrative allocation method which based on “fairness oriented” may cause efficiency loss to a certain extent, and the efficiency distribution method which based on “zero sum gains” is more satisfied to the requirements of low-carbon economy in long-term economic development. Therefore, the government can cross-use both “fairness oriented” and “efficiency oriented” distribution methods while setting allocation methods of carbon emissions reduction target. It can not only ease the pressure on carbon emission reduction of economic underdeveloped provinces in short term, and also approach the condition as Pareto optimal allocation of the inputs and outputs, ultimately achieving the long term goal of low-carbon economy.
(3) Comparing the calculated results under the conditions of 4 scenarios, we find that: firstly, the carbon emission efficiency of 30 provinces under the condition of dual constraints as provincial carbon emission intensity and energy intensity constraint are better than that are restricted to carbon emission intensity alone. It shows that on the basis of the constraint of carbon emission intensity, constraint of energy intensity will force the provinces to adjust and optimize the energy consumption structure, thus being closer to the efficiency data envelopment frontier. Secondly, using dual constraints of carbon emission intensity and energy intensity will lead to increase the difference between provincial ZSG distribution target and state administrative allocation target in carbon emission intensity while the level of economic development is fixed. The possible reason may be that, dual constraints of carbon emission intensity and energy intensity will cause the efficiency frontier to move down, resulting in more carbon emissions need to be allocated, thus widening the gap of carbon emission intensity in all the provinces before and after ZSG allocated.
(4) Due to the heterogeneity of resource endowment, geographical position, economic development level and the existing industrial structure in various provinces of China, the provinces should choose different development path of low-carbon economy. Beijing, Shanghai and other provinces which located in area I should increase the use of wind power, hydropower and other clean energy to further reduce carbon emissions by optimizing the energy consumption structure. Hainan province in area II should accelerate the development of modern financial services and modern logistics industries. Qinghai and Ningxia provinces also in area II should vigorously develop ecological agriculture and husbandry which are characterized by high efficiency and brand effect, and extend to the upstream industry chain. Fujian province located in area III should give full play to its area advantage. On the one hand, it should strengthen resource sharing with the Yangtze River Delta, Pearl River Delta regions. On the other hand, take full advantages of offshore wind power and speed up the adjustment of energy consumption structure. Liaoning and Neimenggu provinces should focus on the upgrading of the industrial structure, make great efforts to reduce the proportion of high pollution and high energy consumption industries. Provinces which located in area IV should pay equal attention to both economic development and carbon emission reduction targets, and choose the priority objective according to the actual situation themselves.

Acknowledgments

This work is financially supported by Funding of National Natural Science Foundation of China (No. 71671080, No. 71571099), Funding of National Natural Science Foundation for Young Scientists of China (No. 71301070), Funding of Science Foundation of Huainan Normal University (No. 2016xj07zd).

Author Contributions

Wen Guo and Hongjun Dai wrote the paper, Wen Guo and Tao Sun analyzed the data.

Conflicts of Interest

The authors declare no conflict of interest.

References

  1. Shine, K.P.; Fuglestvedt, J.S.; Hailemariam, K.; Stuber, N. Alternatives to the Global Warming Potential for Comparing Climate Impacts of Emissions of Greenhouse Gases. Clim. Chang. 2005, 3, 281–302. [Google Scholar] [CrossRef]
  2. Zhao, X. Is Global Warming Mainly Due to Anthropogenic Greenhouse Gas Emissions? Energy Sources 2011, 21, 1985–1992. [Google Scholar] [CrossRef]
  3. Mu, Z.J.; Huang, A.Y.; Ni, J.P.; Li, J.Q.; Liu, Y.Y.; Shi, S.; Xie, D.T.; Hatano, R. Soil greenhouse gas fluxes and net global warming potential from intensively cultivated vegetable fields in southwestern China. J. Soil Sci. Plant Nutr. 2013, 3, 566–578. [Google Scholar] [CrossRef]
  4. Central Compilation & Translation Bureau. The Twelfth Five-Year Plan for National Economic and Social Development of the People’s Republic of China; Central Compilation & Translation Press: Beijing, China, 2011. [Google Scholar]
  5. Central Compilation & Translation Bureau. The Thirteenth Five-Year Plan for National Economic and Social Development of the People’s Republic of China; Central Compilation & Translation Press: Beijing, China, 2016. [Google Scholar]
  6. Wang, Z.; Yin, F.; Zhang, Y.; Zhang, X. An empirical research on the influencing factors of regional CO2 emissions: Evidence from Beijing city, China. Appl. Energy 2012, 4, 277–284. [Google Scholar] [CrossRef]
  7. Dong, F.; Li, X.; Long, R.; Liu, X. Regional carbon emission performance in China according to a stochastic frontier model. Renew. Sustain. Energy Rev. 2013, 8, 525–530. [Google Scholar] [CrossRef]
  8. Guo, W.; Sun, T.; Dai, H. Effect of Population Structure Change on Carbon Emission in China. Sustainability 2016, 3, 225. [Google Scholar] [CrossRef]
  9. Song, M.L.; Zhou, Y.X. Analysis of Carbon Emissions and Their Influence Factors Based on Data from Anhui of China. Comput. Econ. 2015, 3, 359–374. [Google Scholar] [CrossRef]
  10. Miao, Z.; Geng, Y.; Sheng, J. Efficient allocation of CO2 emissions in China: A zero sum gains data envelopment model. J. Clean. Prod. 2015, 112, 4144–4150. [Google Scholar] [CrossRef]
  11. Charnes, A.; Cooper, W.W.; Golany, B. Foundations of data envelopment analysis for Pareto-Koopmans efficient empirical production functions. J. Econom. 1985, 1, 91–107. [Google Scholar] [CrossRef]
  12. Färe, R.; Grosskopf, S.; Tyteca, D. An activity analysis model of the environmental performance of firms-application to fossil-fuel-fired electric utilities. Ecol. Econ. 1996, 18, 161–175. [Google Scholar] [CrossRef]
  13. Hua, Z.; Bian, Y.; Liang, L. Eco-efficiency analysis of paper mills along the Huai River. Omega 2007, 35, 578–587. [Google Scholar] [CrossRef]
  14. Tone, K. A slacks-based measure of efficiency in data envelopment analysis. Eur. J. Oper. Res. 2001, 3, 498–509. [Google Scholar] [CrossRef]
  15. Yang, H.; Pollitt, M. Incorporating both undesirable outputs and uncontrollable variables into DEA: The performance of Chinese coal-fired power plants. Eur. J. Oper. Res. 2009, 3, 1095–1105. [Google Scholar] [CrossRef]
  16. Zhang, C.; Liu, H.; Bressers, H.T.A.; Buchanan, K.S. Productivity growth and environmental regulations-accounting for undesirable outputs: Analysis of China’s thirty provincial regions using the Malmquist-Luenberger index. Ecol. Econ. 2011, 12, 2369–2379. [Google Scholar] [CrossRef]
  17. Wu, F.; Fan, L.W.; Zhou, P.; Zhou, D.Q. Industrial energy efficiency with CO2 emissions in China: A nonparametric analysis. Energy Policy 2012, 49, 164–172. [Google Scholar] [CrossRef]
  18. Zhou, P.; Ang, B.W.; Poh, K.L. Slacks-based efficiency measures for modeling environmental performance. Ecol. Econ. 2006, 1, 111–118. [Google Scholar] [CrossRef]
  19. Zhou, Y.; Liang, D.P.; Xing, X.P. Environmental efficiency of industrial sectors in China: An improved Weighted SBM model. Math. Comput. Model. 2013, 9, 990–999. [Google Scholar] [CrossRef]
  20. Song, M.; Wang, S.; Liu, Q. Environmental efficiency evaluation considering the maximization of desirable outputs and its application. Math. Comput. Model. 2013, 5, 1110–1116. [Google Scholar] [CrossRef]
  21. Song, X.; Zhu, X.; Hao, Y. Analysis of the Environmental Efficiency of the Chinese Transportation Sector Using an Undesirable Output Slacks-Based Measure Data Envelopment Analysis Model. Sustainability 2015, 7, 9187–9206. [Google Scholar] [CrossRef]
  22. Zhang, N.; Wei, X. Dynamic total factor carbon emissions performance changes in the Chinese transportation industry. Appl. Energy 2015, 146, 409–420. [Google Scholar] [CrossRef]
  23. Zhang, N.; Choi, Y. Total-factor carbon emission performance of fossil fuel power plants in China: A meta-frontier non-radial Malmquist index analysis. Energy Econ. 2013, 2, 549–559. [Google Scholar] [CrossRef]
  24. Song, M.; Guo, X.; Wu, K.; Wang, G. Driving effect analysis of energy-consumption carbon emissions in the Yangtze River Delta region. J. Clean. Prod. 2014, 4, 292–300. [Google Scholar] [CrossRef]
  25. Du, J.; Liang, L.; Zhu, J. A slacks-based measure of super-efficiency in data envelopment analysis: A comment. Eur. J. Oper. Res. 2010, 3, 694–697. [Google Scholar] [CrossRef]
  26. Zhang, N.; Zhou, P.; Kung, C.C. Total-factor carbon emission performance of the Chinese transportation industry: A bootstrapped non-radial Malmquist index analysis. Renew. Sustain. Energy Rev. 2015, 41, 584–593. [Google Scholar] [CrossRef]
  27. Li, L.B.; Hu, J.L. Ecological total-factor energy efficiency of regions in China. Energy Policy 2012, 4, 216–224. [Google Scholar] [CrossRef]
  28. Guo, X.D.; Zhu, L.; Fan, Y.; Xie, B.C. Evaluation of potential reductions in carbon emissions in Chinese provinces based on environmental DEA. Energy Policy 2011, 5, 2352–2360. [Google Scholar] [CrossRef]
  29. Bian, Y.; He, P.; Xu, H. Estimation of potential energy saving and carbon dioxide emission reduction in China based on an extended non-radial DEA approach. Energy Policy 2013, 4, 962–971. [Google Scholar] [CrossRef]
  30. Xu, F.; Xiang, N.; Yan, J.; Chen, L.; Nijkamp, P.; Higano, Y. Dynamic Simulation of China’s Carbon Emission Reduction Potential by 2020. Lett. Spat. Resour. Sci. 2015, 1, 15–27. [Google Scholar] [CrossRef]
  31. Feng, X.Z.; Zou, J. Economic Analysis of CO2 Emission Trends in China. China Popul. Resour. Environ. 2008, 3, 43–47. [Google Scholar]
  32. Vaillancourt, K.; Loulou, R.; Kanudia, A. The Role of Abatement Costs in GHG Permit Allocations: A Global Stabilization Scenario Analysis. Environ. Model. Assess. 2008, 2, 169–179. [Google Scholar] [CrossRef]
  33. Jones, A.; Clark, J. Cost of energy and environmental policy in Portuguese CO2 abatement—Scenario analysis to 2020. Energy Policy 2008, 9, 3598–3611. [Google Scholar]
  34. Minihan, E.S.; Wu, Z. Economic Structure and Strategies for Greenhouse Gas Mitigation. Energy Econ. 2012, 1, 350–357. [Google Scholar] [CrossRef]
  35. Chen, W. The Costs of Mitigating Carbon Emissions in China: Findings from China MARKAL-MACRO Modeling. Energy Policy 2005, 7, 885–896. [Google Scholar] [CrossRef]
  36. Färe, R.; Grosskopf, S.; Noh, D.W.; Weber, W. Characteristics of a Polluting Technology: Theory and Practice. J. Econom. 2005, 2, 469–492. [Google Scholar] [CrossRef]
  37. Zhou, P.; Zhou, X.; Fan, L.W. On Estimating Shadow Prices of Undesirable Outputs with Efficiency Models: A Literature Review. Appl. Energy 2014, 1, 799–806. [Google Scholar] [CrossRef]
  38. Maradan, D.; Vassiliev, A. Marginal Costs of Carbon Dioxide Abatement: Empirical Evidence from Cross-Country Analysis. Swiss J. Econ. Stat. 2005, 3, 377–410. [Google Scholar]
  39. Fāre, G.; Grosskopf, S.; Pasurka, C.A. Environmental Production Functions and Environmental Directional Distance Functions. Energy 2007, 7, 1055–1066. [Google Scholar] [CrossRef]
  40. Rietbergen, M.G.; Blok, K. Assessing the potential impact of the CO2, Performance Ladder on the reduction of carbon dioxide emissions in the Netherlands. J. Clean. Prod. 2013, 4, 33–45. [Google Scholar] [CrossRef]
  41. Wang, Q.; Cui, Q.; Zhou, D.Q.; Wang, S. Marginal abatement costs of carbon dioxide in China: A nonparametric analysis. Energy Procedia 2011, 5, 2316–2320. [Google Scholar] [CrossRef]
  42. Tone, K. A slacks-based measure of super-efficiency in data envelopment analysis. Eur. J. Oper. Res. 2002, 1, 32–41. [Google Scholar] [CrossRef]
  43. Zhu, Z.; Miao, J.; Cui, W. Measuring regional eco-efficiency: A non-oriented slacks-based measure analysis. Int. J. Earth Sci. Eng. 2014, 6, 2520–2527. [Google Scholar]
  44. Zhang, N.; Choi, Y. Environmental energy efficiency of China’s regional economies: A non-oriented slacks-based measure analysis. Soc. Sci. J. 2013, 2, 225–234. [Google Scholar] [CrossRef]
  45. Tone, K. Variations on the theme of slacks-based measure of efficiency in DEA. Eur. J. Oper. Res. 2010, 3, 901–907. [Google Scholar] [CrossRef]
  46. Lins, M.P.E.; Gomes, E.G.; Soares de Mello, J.C.C.B.; Soares de Mello, A.J.R. Olympic ranking based on a zero sum gains DEA model. Eur. J. Oper. Res. 2003, 2, 312–322. [Google Scholar] [CrossRef]
  47. Gomes, E.G.; Lins, M.P.E. Modelling Undesirable Outputs with Zero Sum Gains Data Envelopment Analysis Models. J. Oper. Res. Soc. 2008, 5, 616–623. [Google Scholar] [CrossRef]
  48. Azadi, M.; Saen, R.F. Developing an Output-Oriented Super Slacks-Based Measure Model with an Application to Third-Party Reverse Logistics Providers. J. Multi-Crit. Decis. Anal. 2011, 5, 267–277. [Google Scholar] [CrossRef]
  49. Paradi, J.C.; Wilson, D.; Yang, X. Data Envelopment Analysis of Corporate Failure for Non-Manufacturing Firms Using a Slacks-Based Measure. J. Serv. Sci. Manag. 2014, 4, 277–290. [Google Scholar] [CrossRef]
  50. National Bureau of Statistics of China. China Statistical Yearbook; China Statistics Press: Beijing, China, 2001–2015.
  51. National Bureau of Statistics of China. China Energy Statistical Yearbook; China Statistics Press: Beijing, China, 2004–2015.
Figure 1. Schematic figure of the undesirable output-oriented ZSG-SBM model.
Sustainability 09 00167 g001
Figure 2. Schematic figure of the undesirable output-oriented ZSG-SBM model in proportional distribution strategy.
Sustainability 09 00167 g002
Figure 3. Schematic figure of provinces’ CO2 emission reduction path at end of “13·5” period.
Sustainability 09 00167 g003
Table 1. Predicted data of inputs and outputs of the China’s provinces in “13·5” period.
VariablesSituationsMaxMinMeanStandard Deviation
Population (ten thousand persons) 11,175.88613.834683.432794.83
Capital (hundred million RMB) 254,288.6414,699.6793,117.9258,924.22
Energy (ten thousand tons of coal equivalent)RapidChanged43,816.882620.2016,247.509491.95
Unchanged51,549.273082.5919,114.7011,167.00
LowChanged41,816.452500.5815,505.739058.60
Unchanged49,195.832941.8618,242.0310,657.18
GDP (hundred million RMB)Rapid98,542.303274.4133,409.7424,734.41
Low88,303.682934.1929,998.4422,160.63
Carbon (ten thousand tons)Rapid83,198.963677.9429,112.1017,167.94
Low74,554.533295.8026,110.9915,360.57
Data sources: the author sorted and obtained data through collecting initial data from the China Statistical Yearbook [50] in 2011–2015, China Energy Statistical Yearbook [51] in 2011–2015.
Table 2. China’s provincial carbon emission efficiency in 2020 under the above four scenarios.
ProvincesScenario 1Scenario 2Scenario 3Scenario 4
Beijing1.00001.00001.00001.0000
Tianjin1.00000.97920.98030.9069
Hebei0.55670.55500.54390.4988
Shanxi0.45440.43470.44400.4072
Neimenggu0.74990.73750.73270.6720
Liaoning0.75450.75060.73710.6761
Jilin0.57570.55350.56380.5218
Heilongjiang0.55100.52730.53830.4937
Shanghai1.00000.98770.98110.9088
Jiangsu1.00001.00000.99850.9919
Zhejiang0.96570.95940.96340.9509
Anhui0.64760.62810.64630.6056
Fujian0.79600.76920.79200.7398
Jiangxi0.73750.69320.73620.6912
Shandong0.89010.89010.86960.7976
Henan0.66390.66180.66010.6465
Hubei0.66370.65960.64840.5947
Hunan0.65410.64250.63910.5862
Guangdong1.00001.00000.99900.9790
Guangxi0.57750.55370.57610.5396
Hainan1.00001.00001.00001.0000
Chongqing0.61270.58090.59850.5490
Sichuan0.61500.60740.60090.5511
Guizhou0.66010.62300.64490.5915
Yunnan0.55040.52170.53770.4932
Shaanxi0.58780.57260.57610.5301
Gansu0.52770.49940.51550.4728
Qinghai1.00001.00001.00001.0000
Ningxia0.83260.81950.81820.7976
Xinjiang0.53800.50650.52560.4821
Explanation: Scenario 1, Scenario 2, Scenario 3, Scenario 4 are corresponding to four scenarios four scenarios as high-speed economic growth and energy structure changed, low-speed economic growth and energy structure changed, high-speed economic growth and energy structure unchanged, low-speed economic growth, energy structure unchanged.
Table 3. China’s provincial carbon emission ZSG efficiency allocation in 2020 under the above four scenarios.
ProvincesExpected Carbon Emission (Ten Thousand Tons) h o Z S G * (Two Iterations)Increase/Decrease (Ten Thousand Tons)ZSG-Allocated Emission (Ten Thousand Tons)Expected Carbon Intensity (Ton/Ten Thousand RMB)ZSG-Allocated Carbon Intensity (Ton/Ten Thousand RMB)
Beijing11,907.13391.0000503.516312,410.65020.39440.4111
Tianjin15,799.97791.0000520.988516,320.96640.68460.7072
Hebei63,020.57681.0000−2145.823860,874.75301.53411.4819
Shanxi34,391.17211.0000−2567.677731,823.49451.99211.8434
Neimenggu27,700.89211.0000245.934527,946.82661.12601.1360
Liaoning41,181.47701.0000516.622341,698.09921.00751.0201
Jilin15,807.54871.0000−355.293015,452.25570.80010.7821
Heilongjiang22,329.90051.0000−715.673521,614.22701.05851.0246
Shanghai19,153.93801.0000685.891019,839.82900.57370.5942
Jiangsu45,579.86691.00001957.572147,537.43890.47340.4938
Zhejiang27,076.83481.0000945.796028,022.63080.46870.4851
Anhui25,987.48231.0000−144.479025,843.00330.85590.8511
Fujian21,653.93271.0000354.907522,008.84020.61560.6257
Jiangxi17,508.82061.0000179.499017,688.31960.77700.7850
Shandong81,282.01921.00002525.583183,807.60220.95130.9808
Henan35,145.90701.0000−125.869535,020.03750.70980.7073
Hubei44,868.60011.0000−351.108144,517.49201.14051.1316
Hunan35,633.33361.0000−194.811935,438.52170.91580.9108
Guangdong47,970.85131.00002060.260550,031.11180.50570.5274
Guangxi21,728.68671.0000−509.782121,218.90450.95690.9345
Hainan3593.19431.0000154.321137,47.51550.72170.7527
Chongqing19,923.54961.0000−256.957319,666.59240.96110.9487
Sichuan42,096.63851.0000−657.779141,438.85941.02031.0043
Guizhou27,528.22431.0000−266.891627,261.33271.95921.9402
Yunnan23,692.96541.0000−791.839822,901.12561.27711.2344
Shaanxi23,425.17581.0000−486.964022,938.21180.92470.9055
Gansu15,102.77871.0000−570.232914,532.54581.56511.5060
Qinghai7113.28521.0000305.50267418.78782.22362.3191
Ningxia7545.09541.0000189.48197734.57731.95432.0034
Xinjiang27,490.35411.0000−1004.693026,485.66122.05741.9823
Summary85,3240.2137--0.000085,3240.21370.87140.8714
Explanation: Due to limited space, we only list the calculated results under the condition of Scenario 1. If necessary, the author can provide the calculated results of four scenarios.
Table 4. Comparison of provincial ZSG-allocated carbon intensity in 2020 and that in 2015 under the above four scenarios.
ProvincesEnd of “12·5” PeriodScenario 1Scenario 3
Carbon Intensity in 2015 (Ton/Ten Thousand RMB)Government Decline Range (%)ZSG-Allocated Carbon Intensity (Ton/Ten Thousand RMB)Decline Range than 2015 (%)Gap (%)ZSG-Allocated Carbon Intensity (Ton/Ten Thousand RMB)Decline Range than 2015 (%)Gap (%)
Beijing0.481020.500.411114.535.970.408115.165.34
Tianjin0.834920.500.707215.305.200.705715.475.03
Hebei1.870920.501.481920.79−0.291.478520.97−0.47
Shanxi2.429418.001.843424.12−6.121.852823.73−5.73
Neimenggu1.373117.001.136017.27−0.271.137217.18−0.18
Liaoning1.228618.001.020116.971.031.016617.260.74
Jilin0.975818.000.782119.85−1.850.788419.20−1.20
Heilongjiang1.290917.001.024620.63−3.631.032420.02−3.02
Shanghai0.699620.500.594215.075.430.593115.225.28
Jiangsu0.577420.500.493814.486.020.490515.055.45
Zhejiang0.571620.500.485115.135.370.481415.784.72
Anhui1.043818.000.851118.46−0.460.854618.13−0.13
Fujian0.750719.500.625716.652.850.624716.782.72
Jiangxi0.947619.500.785017.162.340.788416.802.70
Shandong1.160120.500.980815.465.040.975415.924.58
Henan0.865619.500.707318.291.210.705818.461.04
Hubei1.390819.501.131618.640.861.131918.620.88
Hunan1.116818.000.910818.45−0.450.911918.35−0.35
Guangdong0.616720.500.527414.486.020.523815.065.44
Guangxi1.167017.000.934519.92−2.920.941219.35−2.35
Hainan0.880112.000.752714.48−2.480.747615.06-3.06
Chongqing1.172119.500.948719.060.440.957418.321.18
Sichuan1.244219.501.004319.280.221.004619.260.24
Guizhou2.389218.001.940218.79−0.791.954318.20−0.20
Yunnan1.557518.001.234420.74−2.741.244420.10−2.10
Shaanxi1.127718.000.905519.70−1.700.909219.38−1.38
Gansu1.908617.001.506021.09−4.091.523220.19−3.19
Qinghai2.711712.002.319114.48−2.482.303615.05−3.05
Ningxia2.383417.002.003415.941.061.997016.210.79
Xinjiang2.509112.001.982321.00−9.002.002520.19−8.19
Explanation: Due to limited space, we only listed the compared results under the condition of Scenario 1 and Scenario 3. If necessary, the author can provide the compared results of four scenarios.

