Article

Cover Crop Residue Amount and Quality Effects on Soil Organic Carbon Mineralization

1
Department of Entomology, Plant Pathology and Weed Science, New Mexico State University, Las Cruces, NM 88003, USA
2
Department of Plant and Environmental Sciences, New Mexico State University, Las Cruces, NM 88003, USA
3
Agricultural Science Center, New Mexico State University, 2346 State Road 288, Clovis, NM 88003, USA
4
Economics, Applied Statistics and International Business Department, New Mexico State University, Las Cruces, NM 88003, USA
*
Author to whom correspondence should be addressed.
Sustainability 2017, 9(12), 2316; https://doi.org/10.3390/su9122316
Submission received: 16 September 2017 / Revised: 8 December 2017 / Accepted: 8 December 2017 / Published: 13 December 2017
(This article belongs to the Special Issue Carbon Input into Agricultural Soils)

Abstract

:
Decline in soil organic carbon (SOC) and the associated impacts on crop production under conventional farming raises concerns on how alternative management practices increase SOC sequestration and improve agricultural sustainability. This study aimed to understand SOC mineralization kinetics with different cover crop (CC) residue amendments. Soil samples were collected from a fallow and three CC (pea, oat, and canola) plots. Soil samples from the CC plots were manipulated with zero, five, and 10 Mg ha−1 of the respective CC residues. All soil samples were incubated for eight weeks, SOC mineralization was monitored, and the first order kinetic and parabolic equation models were fitted to the observed data for estimating labile SOC (C0), and the decomposition rate constant (k). Subsequent comparisons of fitted model parameters were based on the first order kinetic model. The C0 varied with the residue amount while k varied with CC type. C0 was 591–858% greater with 10 Mg ha−1 and 289–456% greater with five Mg ha−1 residue additions while k was 122–297% greater with 10 Mg ha−1 and 94–240% greater with five Mg ha−1 residue additions when compared to the fallow treatment. The CC residue stimulated cumulative carbon mineralization (Cmin) irrespective of CC type, suggesting that cover cropping has potential to improve SOC cycling in agroecosystems.

1. Introduction

Crop residues are the main input in maintaining soil organic carbon (SOC) and nutrients in agricultural soils. The long-term balance between soil carbon inputs through organic residues and losses through mineralization and oxidation determines the SOC storage and nutrient cycling in agroecosystems [1]. Crop residues and biomass management alone can sequester 11–67 million metric tons of carbon per year in the US while cover cropping can sequester an additional 5.1–15.3 million metric tons of carbon per year [2]. Cover crops (CCs) have been increasingly considered for improving soil health and agroecosystem sustainability across the US in recent years. However, improvements in SOC storage and soil health due to CC are primarily observed in areas where water is not a limiting factor for crop production [3]. In the drylands of the Southern High Plains region of the US, SOC cycling is primarily limited by biomass carbon inputs. Soil carbon inputs through crop residue and cover crops increase soil microbial biomass and activity, soil water storage, and in the long-term improve SOC sequestration [4]. Carbon dioxide (CO2) efflux has been observed during organic residue decomposition due to microbial action on the added residues [5]. Typically, the rates of CO2 efflux from the undisturbed soils directly depend on the amount and quality of organic residues [6]. However, in disturbed soils such as in conventional agricultural crop fields, the high efflux of CO2 may be associated with organic inputs as well as soil cultivation that breaks aggregates and brings organic residues in contact with soil microorganisms [7]. The latter process may not necessarily increase SOC storage, but may accelerate residue decomposition and nutrient cycling. The SOC accumulation in agricultural soils relies on organic residue inputs and characteristics as well as the level of soil disturbance [8,9]. Residue quality as defined by their chemical composition (carbon to nitrogen ratio, lignin content, and the size of residue particles) strongly influences the residue decomposition rate [10]. There are discrepancies in the literature regarding the effects of soil type, amendments, environmental conditions, residue inputs, and tillage practices on SOC mineralization kinetics, which warrants further study [11,12,13,14,15].
Controlled experiments such as laboratory incubation studies hold environmental factors constant and help in understanding SOC mineralization kinetics with inputs of diverse residue quality and quantity [12]. In these studies, SOC mineralization kinetic models are used to estimate the C0 where the labile pool SOC and k—the decomposition rate are constant. The C0 represents the easily decomposable fraction of SOC that facilitates nutrient cycling and supports crop production. The decomposition rate constant is proportional to the initial amount of plant material added [16], and is inversely related to the residence time of the substrate and measures the turnover period of carbon [17,18].
Fitting the observed cumulative SOC mineralization data in the kinetic models such as the first order kinetic equation can estimate the benefits of applying crop residues to the soil [19] and the amount of mineralizable substrates available for decomposers following residue additions. This is specifically important for the water limited Southern High Plains ecosystems as soil moisture and carbon availability determine the SOC mineralization kinetics and soil carbon storage [20]. Crop residues not only provide ground cover and regulate soil temperatures, but also minimize soil moisture loss and support SOC sequestration [21]. The improved understanding of SOC dynamics and decomposition kinetics as indicated by C0 and k under different quality and quantity of residue amendments can increase SOC storage and nutrient cycling, thereby increasing agricultural sustainability in the region. Therefore, the main objective of this study was to evaluate SOC mineralization with kinetic models under different CC residue types and application rates. The first hypothesis of this study was that Cmin increased with the addition of aboveground CC residue; the second hypothesis was that SOC mineralization kinetic models could predict the labile SOC pool and decomposition rate in semiarid soils.

2. Materials and Methods

2.1. Study Site and Treatments

The study was conducted during summer 2016 at the New Mexico State University Agricultural Science Center, Clovis, NM, USA (34°35’ N, 103°12’ W, 1348 m elevation). The study site had a semiarid climate with a mean annual temperature of 15 °C and a mean annual precipitation of 470 mm. More than 70% of the annual precipitation occurs between May and September. The soil is Olton clay loam (fine, mixed, superactive, thermic Aridic Paleustolls) according to USDA soil classification [22].
The field experiment was established in February 2016 under an irrigation pivot. The study was laid out as a randomized complete block design with four treatments and three replications. The treatments in the field were fallow (no cover crop) and three cover crops: pea (Pisum sativum L.), oat (Avena sativa L.), and canola (Brassica napus L.). The plot size was 12.2 m × 18.9 m for each treatment. Cover crops were no-till planted in a previous year’s sorghum (Sorghum bicolor L.) stubble and maintained for three months. The seeding rates for pea, oat, and canola were 22.4 kg ha−1, 44.8 kg ha−1 and 2.3 kg ha−1, respectively. All cover crops were chemically terminated at the flowering stage of oat in May 2016 using a mixture of sharpen (a.i. saflufenacil 29.74%) at the rate of 0.15 L ha−1 and glyphosate (N-phosphonomethyl glycine 53.8%) at the rate of 3.7 L ha−1. Fallow plots were sprayed with glyphosate (N-phosphonomethyl glycine 53.8%) and Sterling blue at the rate of 2.3 L ha−1 and 0.75 L ha−1, respectively, to control weeds and did not have any crop during the time of the CC field experiment.

2.2. Cover Crop Biomass Sampling and Analysis

The CC aboveground biomass samples were collected from a 1-m2 area using quadrants a day prior to CC termination. Three replicated samples were collected from the pea, oat, and canola plots to estimate the fresh biomass, and approximately 500 g of sub-samples were taken from each biomass sample, and oven dried at 65.5 °C for 72 h to calculate the dry biomass. Half of the air-dried samples were ground to pass through a 2-mm sieve using a grinder (Thomas-Wiley laboratory mill, model 4, Arthur H. Thomas Company, Swedesboro, NJ, USA). The ground samples were composited and sent to a commercial laboratory (Ward Laboratories, Inc., Kearney, NE, USA) for the analysis of biomass carbon, nitrogen, carbon to nitrogen ratio, and lignin content (Table 1). The second half of the samples were ground to pass through a 5-mm sieve and used for the incubation study.

2.3. Soil Sampling and the Establishment of the Laboratory Experiment

Soil samples were collected from five randomly selected spots within each treatment to a depth of 0–15 cm, homogenized, and composited by treatment in February 2016 for baseline soil characteristics. Similarly, soil samples were collected from each CC plot (including the fallow field) in May 2016 a day before cover crop termination, then were homogenized and composited by each plot and brought to the laboratory for further analysis.
In the laboratory, approximately 20 g subsamples were taken to estimate the soil water content and available soil nitrogen. The remainder of the samples were stored at 4 °C in a refrigerator until the incubation setup was established for the SOC mineralization study. Laboratory analysis for the baseline soil properties included analysis of the soil particle size distribution, soil bulk density, SOC content, soil pH, and electrical conductivity (EC). Gravimetric soil water content, available soil nitrogen and phosphorus were also analyzed for the samples used in the incubation study.
Soil particle size distribution was determined by the hydrometer method [23]. Soil bulk density was determined by collecting three 2.3 cm diameter cores (15 cm depth) using a core sampler (Clements Associates Inc., Newton, IA, USA). The dry weight of the cores was estimated by oven drying soil samples at 105 °C for 24 h. The SOC content was analyzed by the dry combustion of 20 mg soils in a LECO CNS analyzer (Ellington and Associates, Inc., Houston, TX, USA). Soil pH and EC were determined on a 1:5 soil to water suspension using benchtop pH and conductivity meters [24]. Available soil nitrogen was analyzed by extracting 5 g of soil in 25 mL 1 M KCl, and measured as a sum of KCl extractable NO3 (nitrate) and NH4+ (ammonium) in an automated flow injection Nitrogen Analyzer (Timberline Instruments, LLC, Boulder, CO, USA). The available phosphorous was analyzed by extracting 2.5 g of soil in 50 mL 0.5 M sodium bicarbonate and measured using the Olsen Phosphorous method [25]. Soil water content was determined by oven drying 10 g of field moist soil samples at 105 °C for 24 h.
Soil incubation setups were established on the refrigerated soil samples within three weeks of sample collection from the field. Thirty incubation setups (ten treatments × three replications) were established using 20 g soils with and without cover crop biomass samples. Soil samples from the fallow plots were used as a control to monitor the amount of SOC mineralization without addition of CC residues. Soil samples from the canola, pea, and oat fields were incubated with 0 Mg ha−1, 5 Mg ha−1, and 10 Mg ha−1 of canola, pea, and oat residues, respectively. All soil samples were placed in plastic specimen cups and brought to a field capacity moisture (~23% gravimetric soil water content) by adding deionized water. Crop residues were added and mixed well with soil samples for CC residue added treatments. The amount of CC residue dry mass (g) needed in the residue addition treatments were calculated using a dry mass of soil, soil bulk density, and dry matter content of a CC biomass.
Each specimen cup was placed in a 1-L canning jar with a lid modified to hold a 1.5 cm long butyl rubber stopper. Each incubation jar was added to 5 mL of deionized water to maintain the relative humidity inside the jar. All jars were stored in a dark cabinet at room temperature (23.5 ± 1 °C) with an air pressure of 1.01 atm. One blank jar (no soil) was incubated to monitor the background CO2 concentration. From each jar, a headspace air sample was collected in a 35-mL syringe using a 22-gauge needle on a rubber stopper. The CO2 enriched air samples were collected on days 1, 3, 6, 10, 14, 21, 30, 43, and 57 from the incubation jars. During each sampling, the CO2 enriched air inside the jar was mixed thoroughly by plunging the syringe up and down three times, and a 35-mL aliquot was extracted from each incubation jar at the end. After each gas sampling, the lids were opened and the jars were thoroughly flushed with a vacuum air pump to re-equilibrate the CO2 concentration and air pressure. All samples were then incubated again until the next reading. The specimen cups were weighed in two week intervals to determine the soil moisture loss, and the soil water content was brought to 23% by adding deionized water. The difference in headspace volume was accounted for by calculating the CO2-C released from each treatment. The CO2-C concentration in each sample was measured in an infrared gas analyzer (LICOR INC., Lincoln, NE, USA) calibrated at >98% precision, and SOC mineralization was calculated by subtracting the CO2-C concentration in the blank jar from the CO2-C concentration in the jar with soil samples.

2.4. Soil Carbon Mineralization Kinetics

The observed values of SOC mineralization (Cmin) over an eight-week incubation period were fitted with two models. The first model was a simple exponential model (first order kinetic model) described by only one pool of labile SOC (C0) decomposing at a rate proportional to its concentration [26], and the second model was a parabolic equation model that used empirical equitation to estimate the Cmin [27].
C m i n = C 0 ( 1 e k t )   ( model   1 ) .
C m i n = C 0 t k                   ( model   2 )
where Cmin is the cumulative SOC mineralization; C0 is the labile pool SOC (mg C kg−1); k is the decomposition (first order) rate constant (day−1); and t is the decomposition time in days. Both models consider that Cmin is described by C0, but the first order kinetic model tends to better fit the observed values where the experimental data approaches the asymptote. The parabolic model, on the other hand, continues to increase indefinitely and may provide a poor fit when the experimental data approaches the asymptote [28].

2.5. Statistical Analysis

The model parameters, C0 and k, were estimated by pooling the observed SOC mineralization data over three replications using Statistical Analysis System Proc Nlin software (SAS version 9.4, SAS Institute Inc., Cary, NC, USA, 2013). Proc Nlin fits non-linear regression models using an iterative method (Gauss Newton method), and produces least square estimates, mean square error (MSE) and other quantities associated with least square estimation. Both models were compared using Pearson’s correlation coefficient (r) between the observed and predicted values, root mean square error (RMSE) [29] and normalized root mean square error (NRMSE). The RMSE was estimated as a mean squared error between the model predicted values and the observed values obtained by taking the square root of the MSE obtained from the Proc Nlin analysis. The NRMSE is a RMSE value standardized with the means of the observed values [30]. The best model fit has lower values of RMSE and NRMSE, and greater values of r. A secondary analysis based on fitting the nonlinear model to each individual replication was undertaken to allow for a formal comparison of the estimated parameters between treatments while appropriately acknowledging the Randomized Complete Block Design (RCBD) with only three experimental units using a general linear model (GLM) procedure in SAS (version 9.4, SAS Institute Inc., 2013). The secondary analysis used the values of C0 and k estimated for each replication, with the exception of treatment P0, where one replication of P0 did not meet the convergence criteria to fit the model to estimate the respective values. The Cmin data was analyzed as a RCBD. Regression analysis was done between the observed cumulative SOC mineralization (Cmin) and predicted labile SOC pool (C0) within different CC residue addition treatments. All statistical analyses were performed at significant probability (p) < 0.05.

3. Results

3.1. Cover Crop Biomass

The carbon content in the pea and oat biomass was 12% greater than that in canola (Table 1). The total nitrogen content was 77% and 108% greater in pea and canola, respectively, than in oat, resulting in a difference in carbon to nitrogen ratio of CC residues. The carbon to nitrogen ratio in oat was 77% greater than that in pea and 133% greater than that in canola. The lignin content was the least in oat, followed by canola and pea.

3.2. Basic Soil Properties

The baseline soil analysis showed a particle size distribution of 43.7% sand, 21.5% silt, and 34.8% clay, SOC content ranged between 7.54 and 9.28 g kg−1, soil bulk density 1.10–1.30 g cm−3, soil pH 7.9–8.1, and electrical conductivity between 0.28 and 0.51 dS m−1. Soil water content was significantly lower in pea and oat than in fallow (Table 2). Soil water content in canola, however, was not significantly different to that of fallow. Similarly, there was no significant difference in soil pH and EC among the treatments. Soil available nitrogen was significantly greater (40–47%) in fallow than in the CC plots, and the available phosphorous was significantly lower in the canola treatment than in fallow.

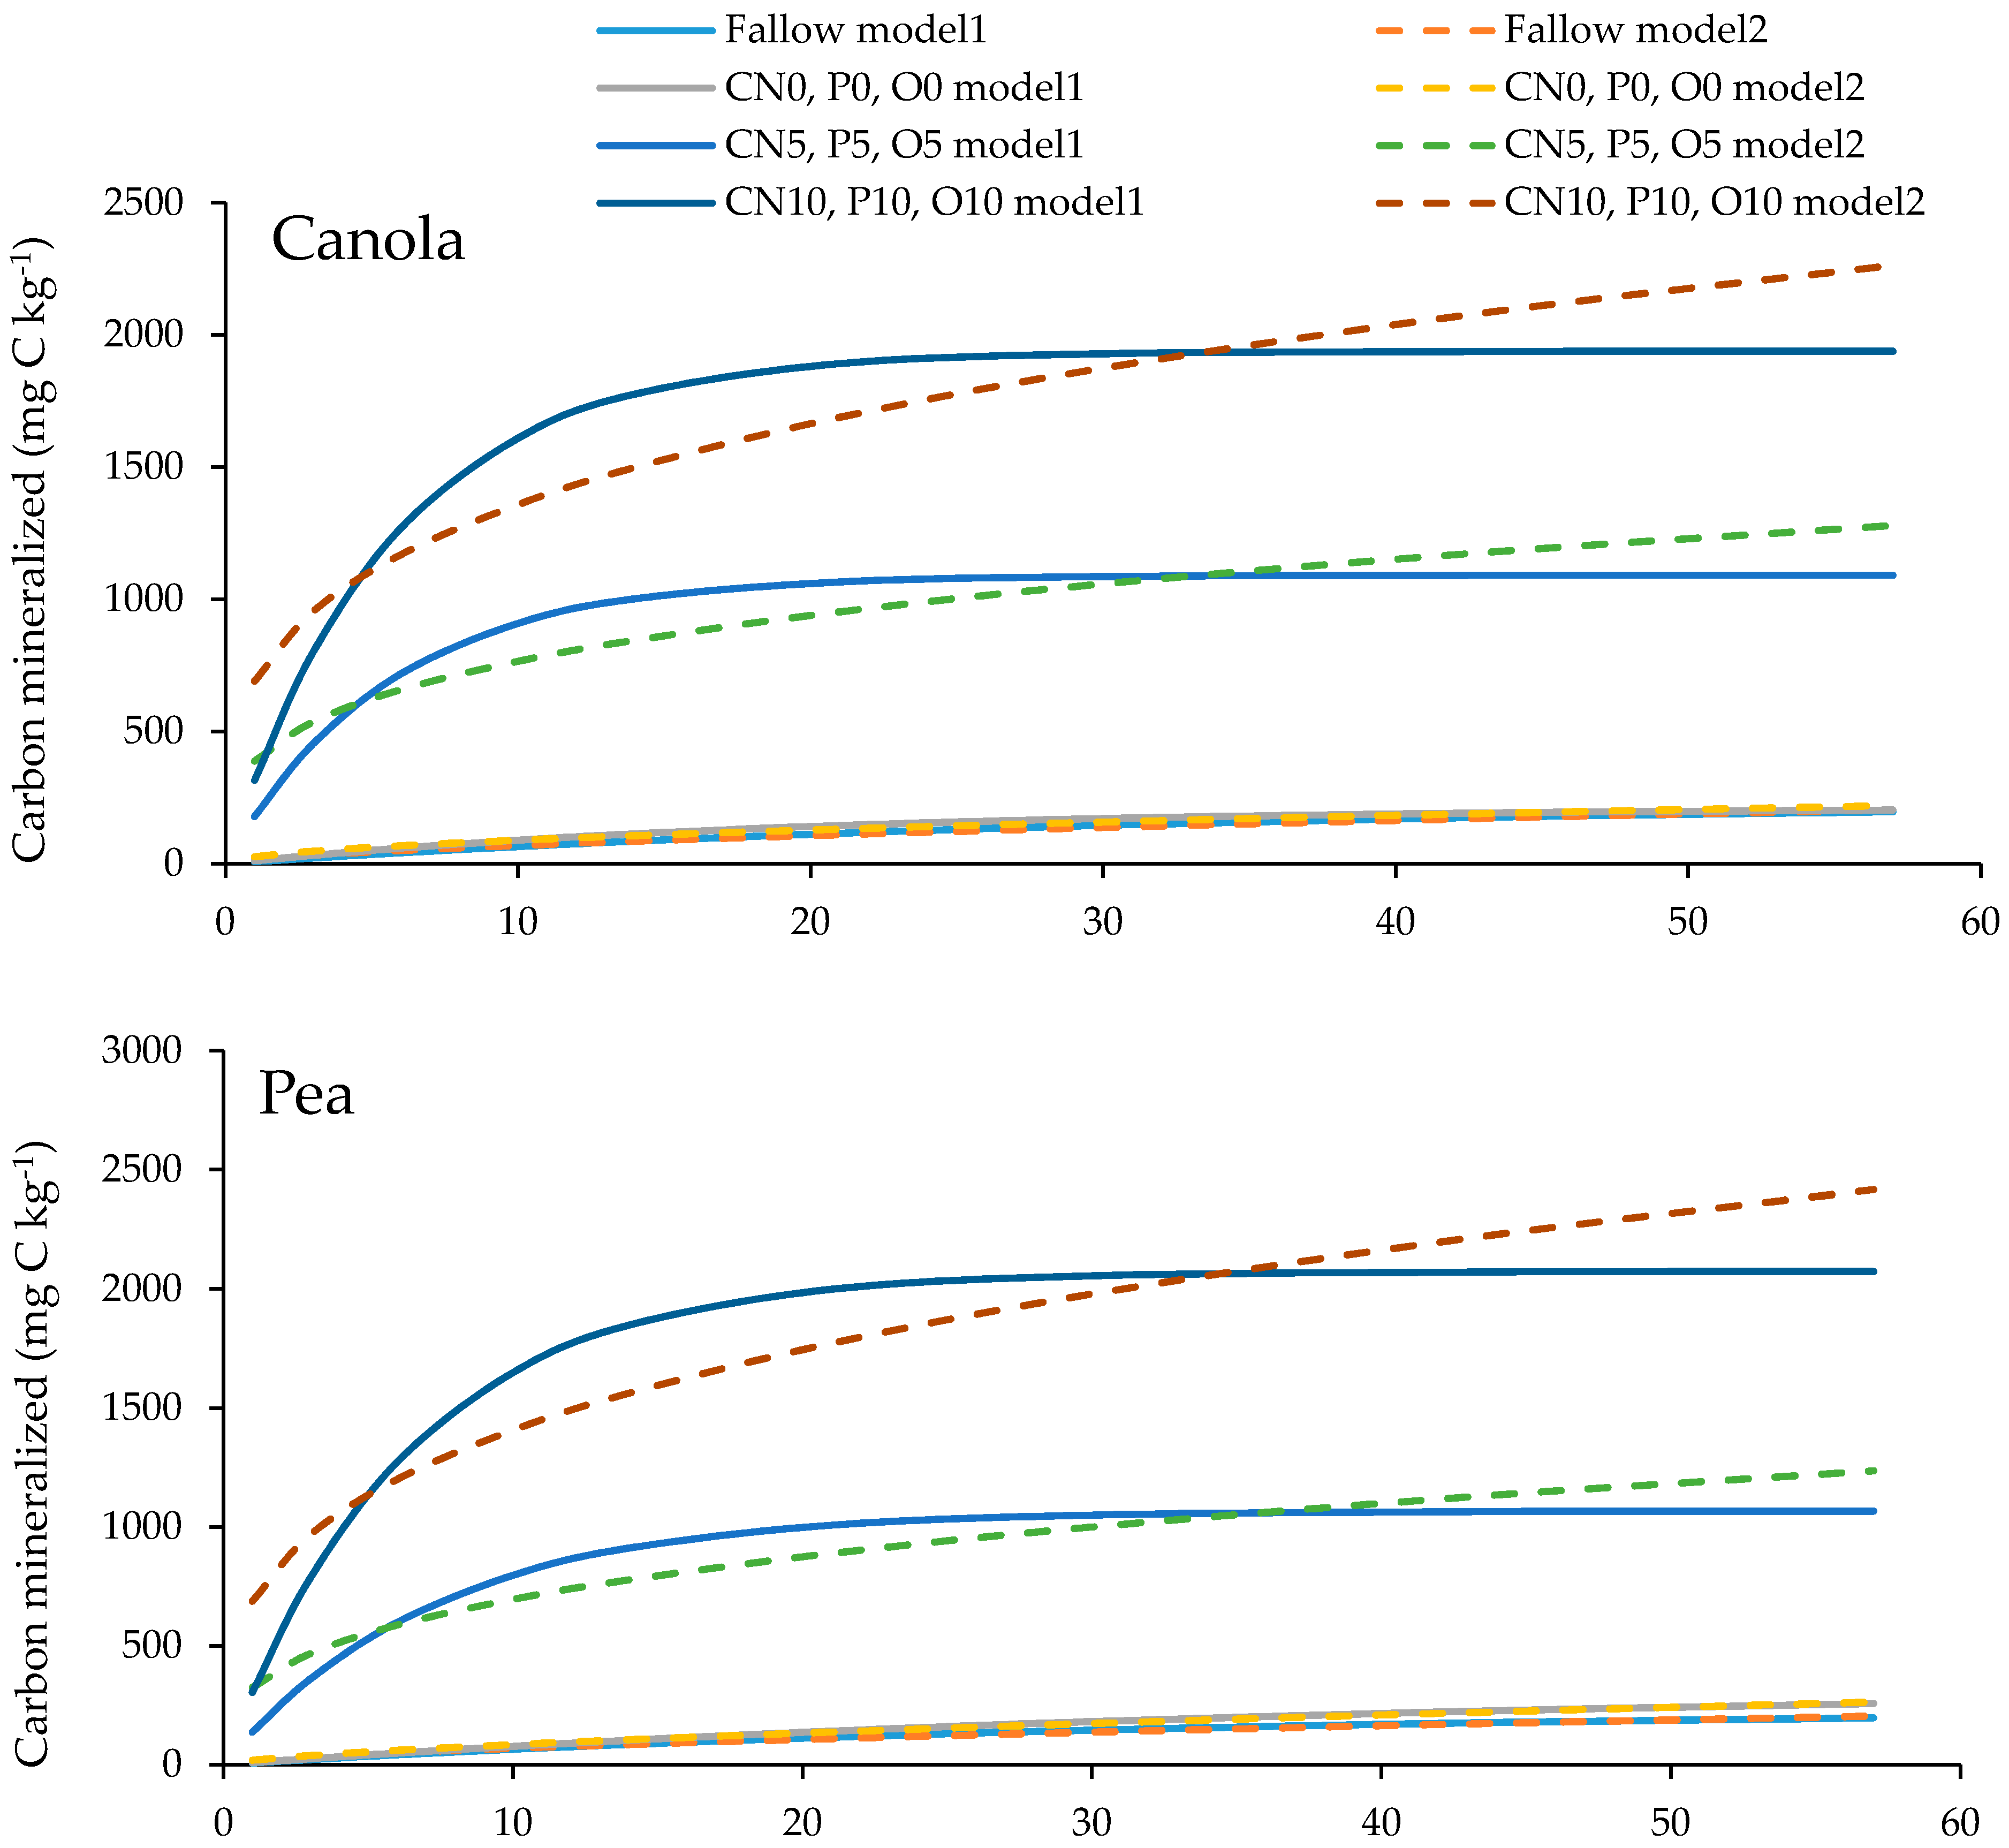
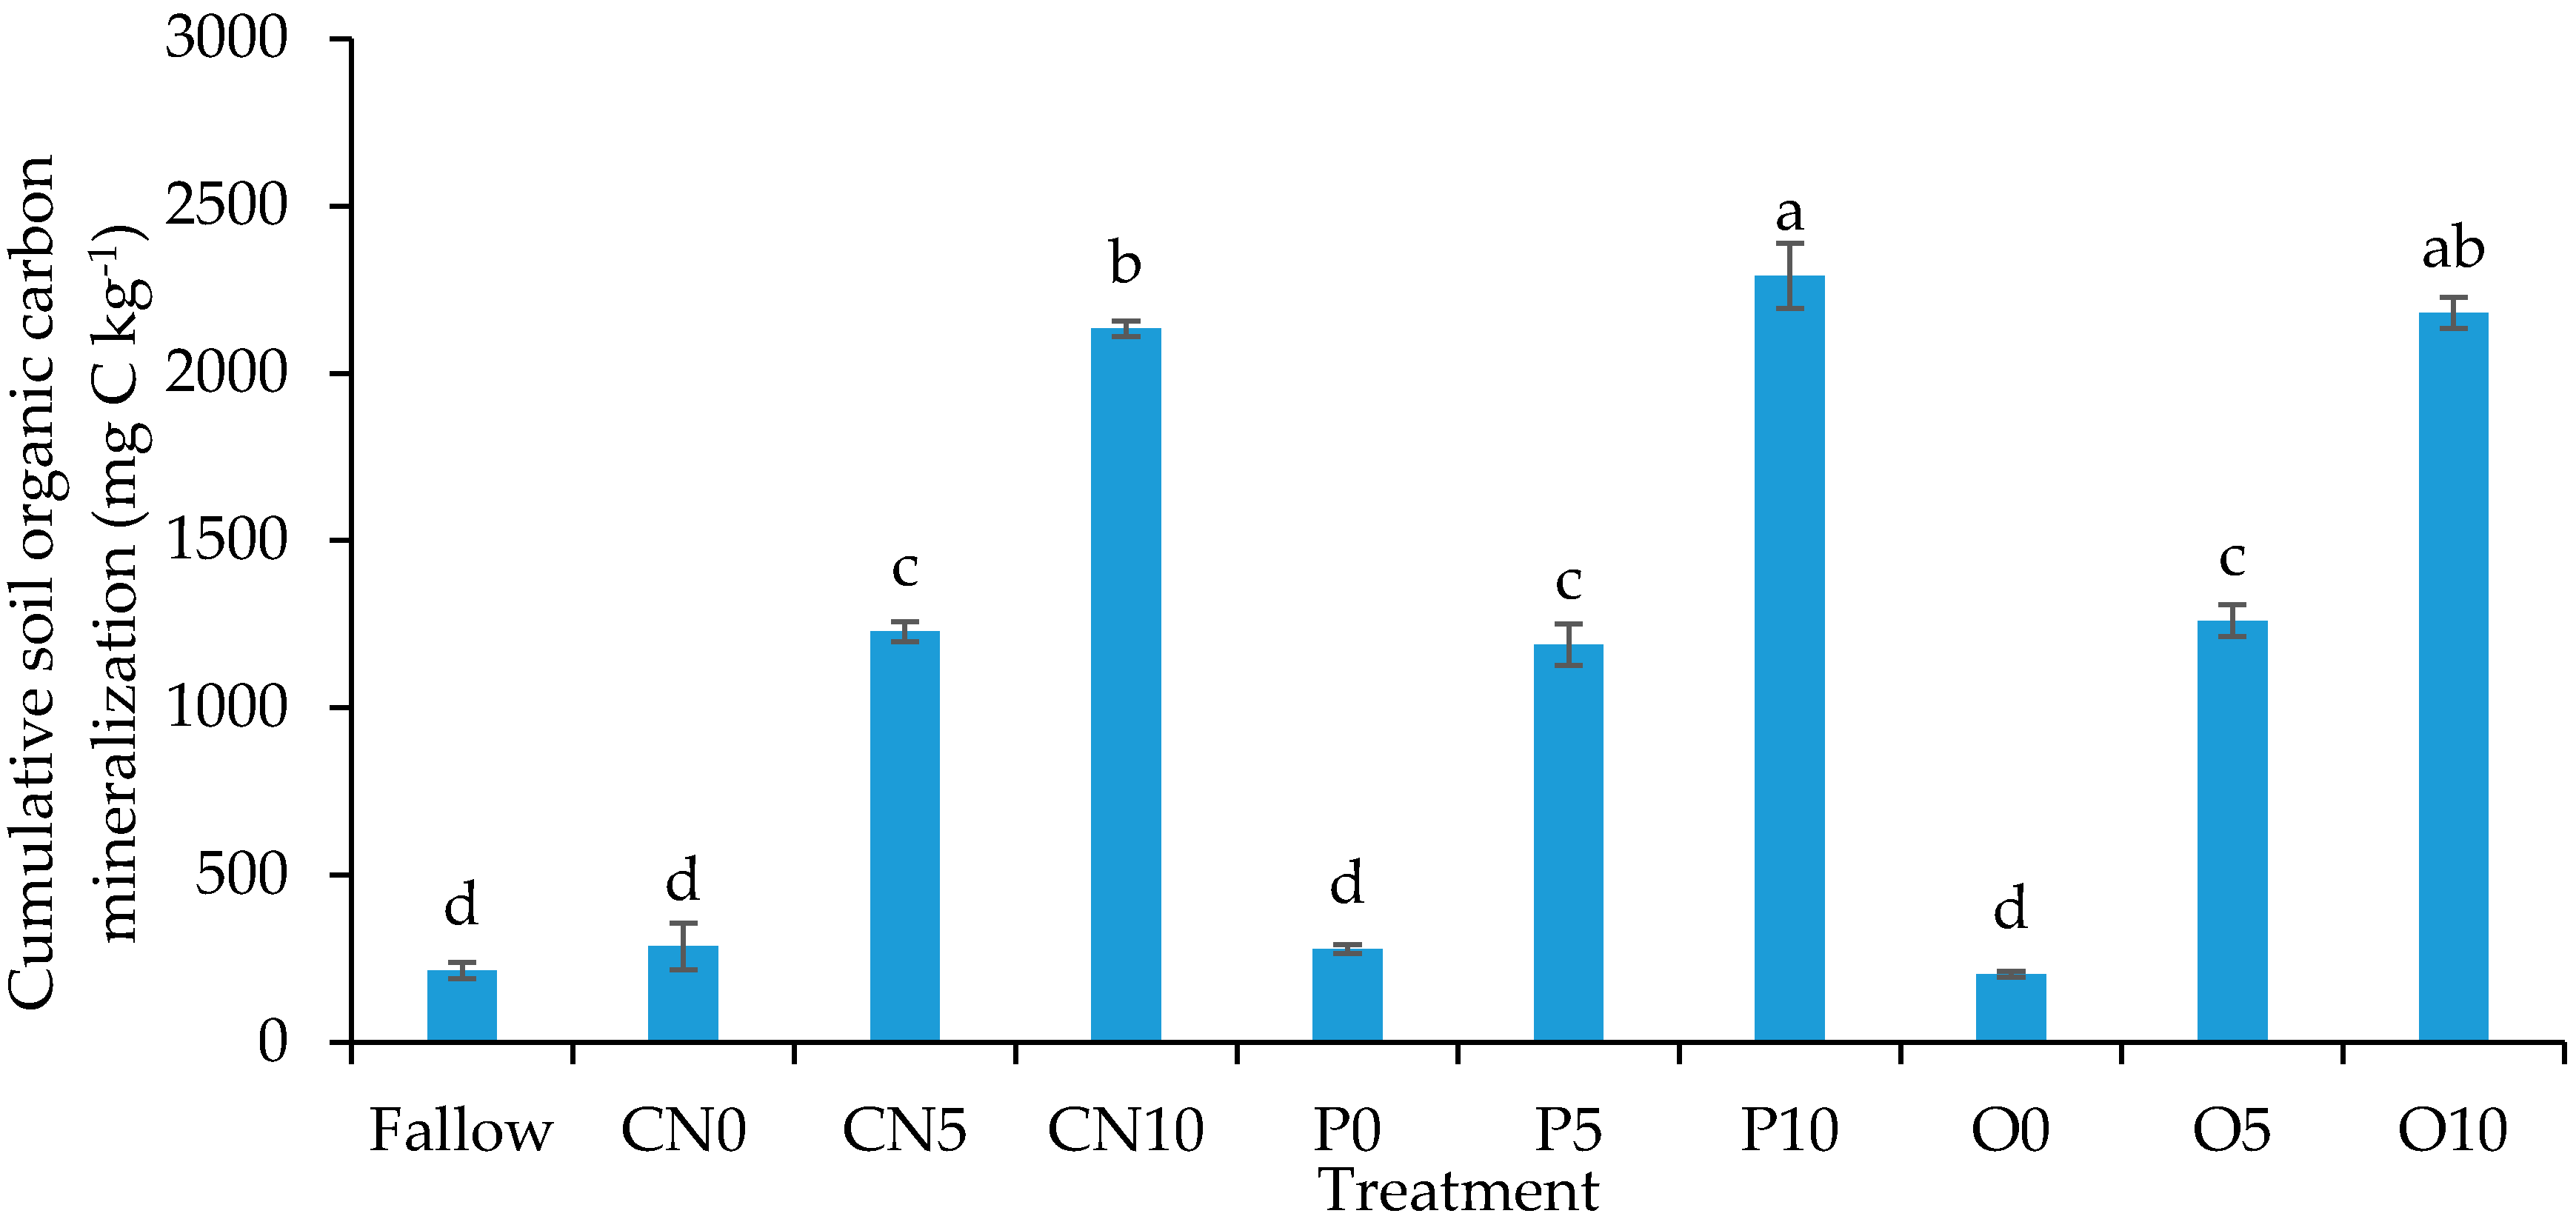
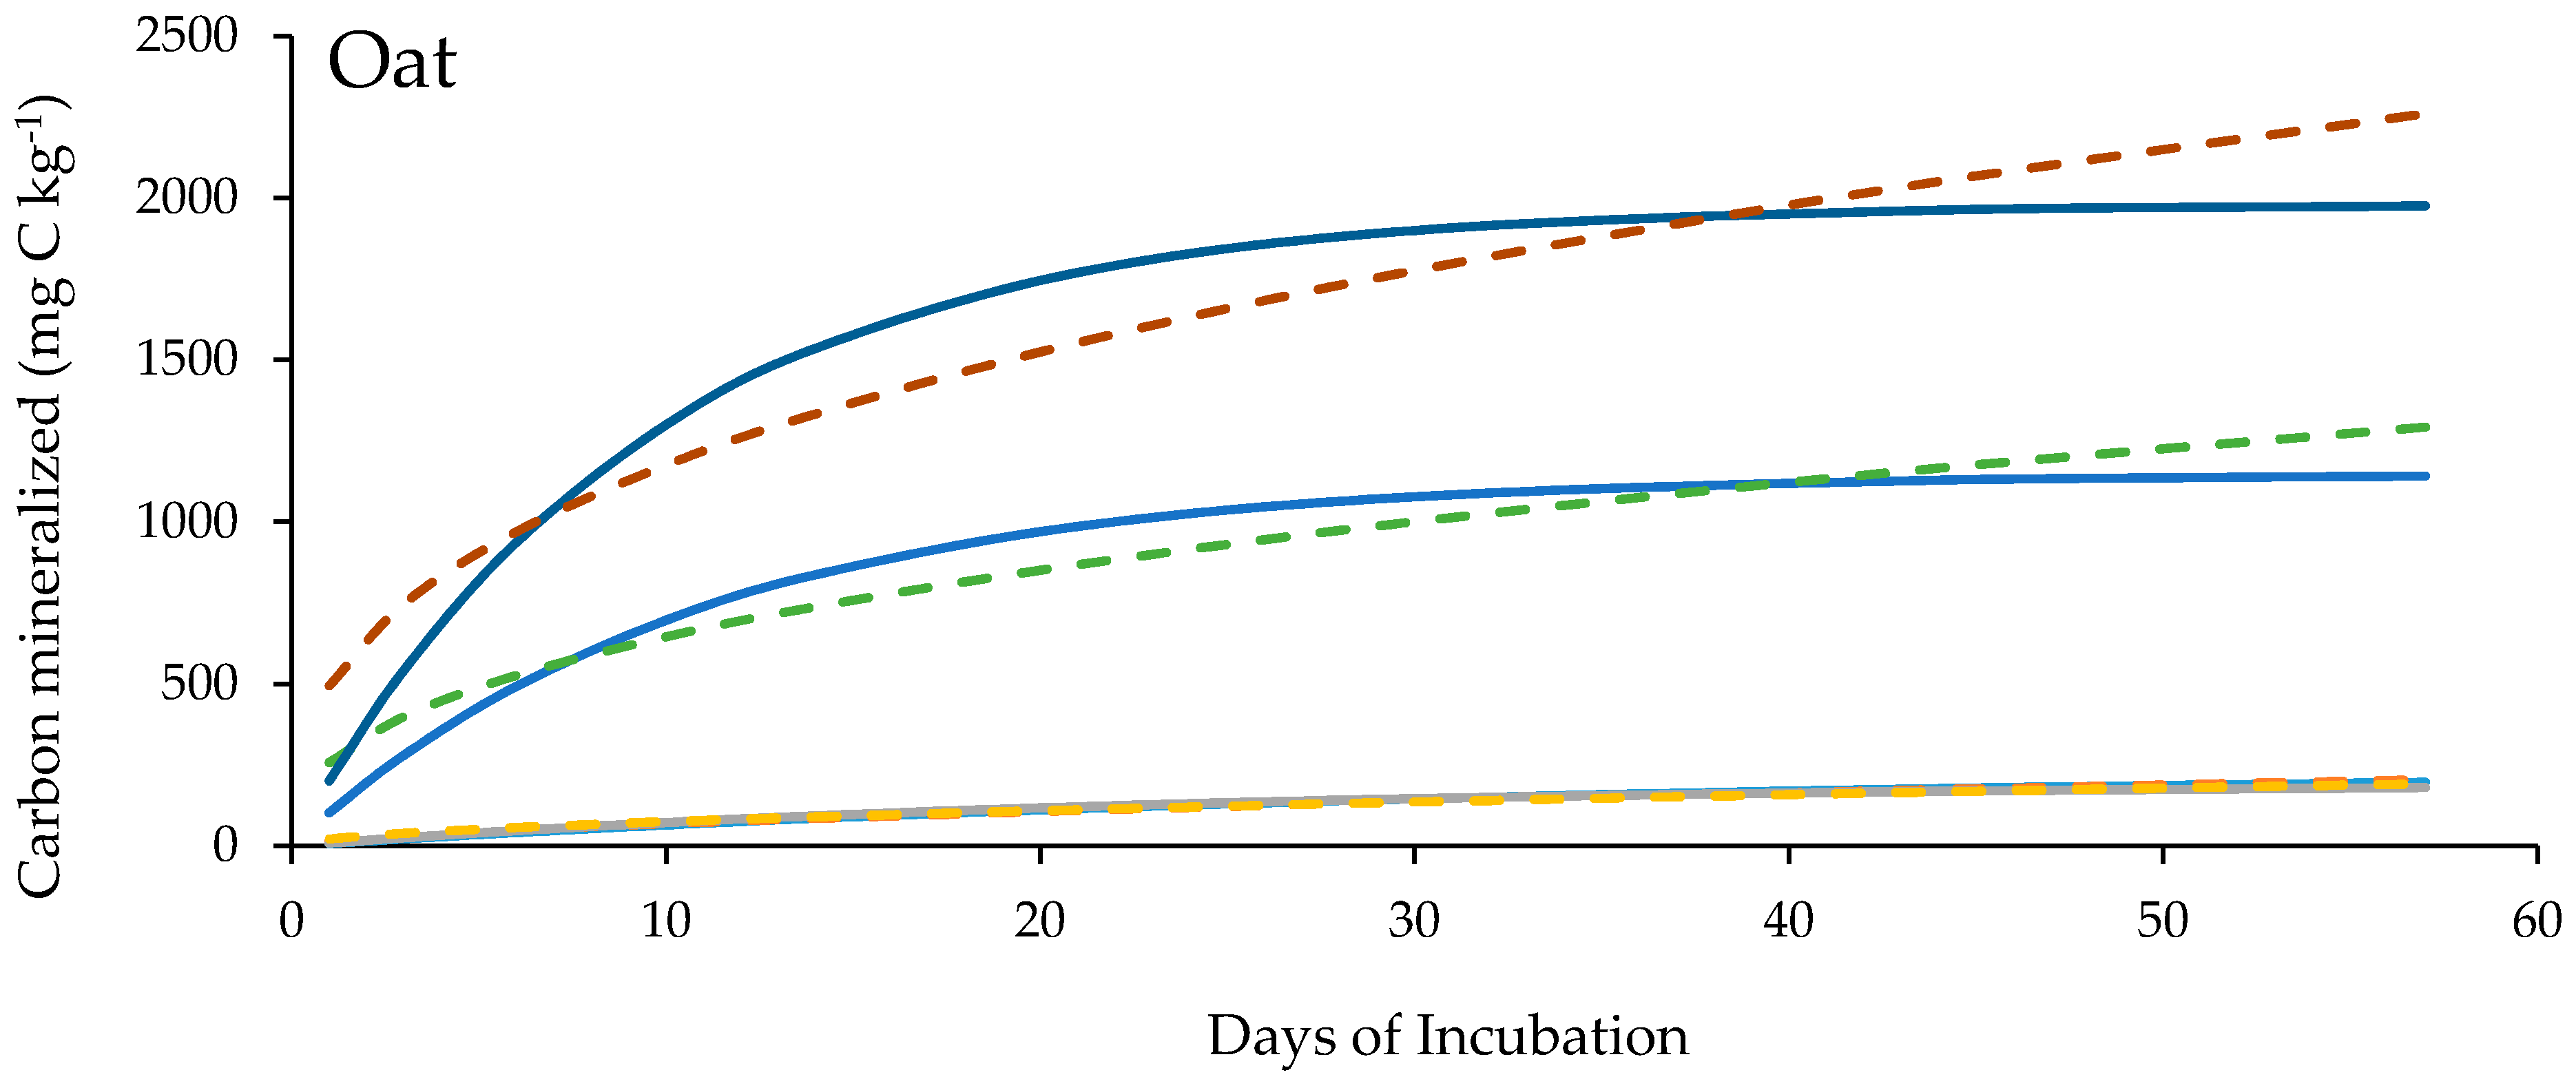
3.3. Cumulative Soil Organic Carbon Mineralization

The addition of CC residues significantly influenced the cumulative SOC mineralization, the Cmin (Figure 1). There was a linear increase in Cmin with the amount of residue added, suggesting that Cmin was dependent on the amount of residue input. It was significantly greater in all treatments with CC residue additions (CN5, P5, O5, CN10, P10, O10) when compared to CC treatments with no residue additions (CN0, P0, O0) as well as fallow. The Cmin was 643%, 721%, and 967% greater in CN10, P10, and O10 when compared to CN0, P0, and O0, respectively. Similarly, Cmin was 328%, 326%, and 517% greater in CN5, P5, and O5 when compared to CN0, P0, and O0 respectively. Doubling the rate of CC residue addition increased Cmin by 74%, 93%, and 73% for canola, pea and oat, respectively. Among the residue types, Cmin was significantly greater with pea than canola at 10 Mg ha−1. However, there was no significant difference in Cmin between the different CC types at lower rates of residue addition treatments. Similarly, there was no significant difference in the cumulative SOC mineralization between no CC residue added treatments and fallow plots. Cmin was 472%, 453%, and 486% greater in CN5, P5 and O5 while it was 892%, 966% and 914% greater in CN10, P10 and O10, respectively, when compared to fallow.

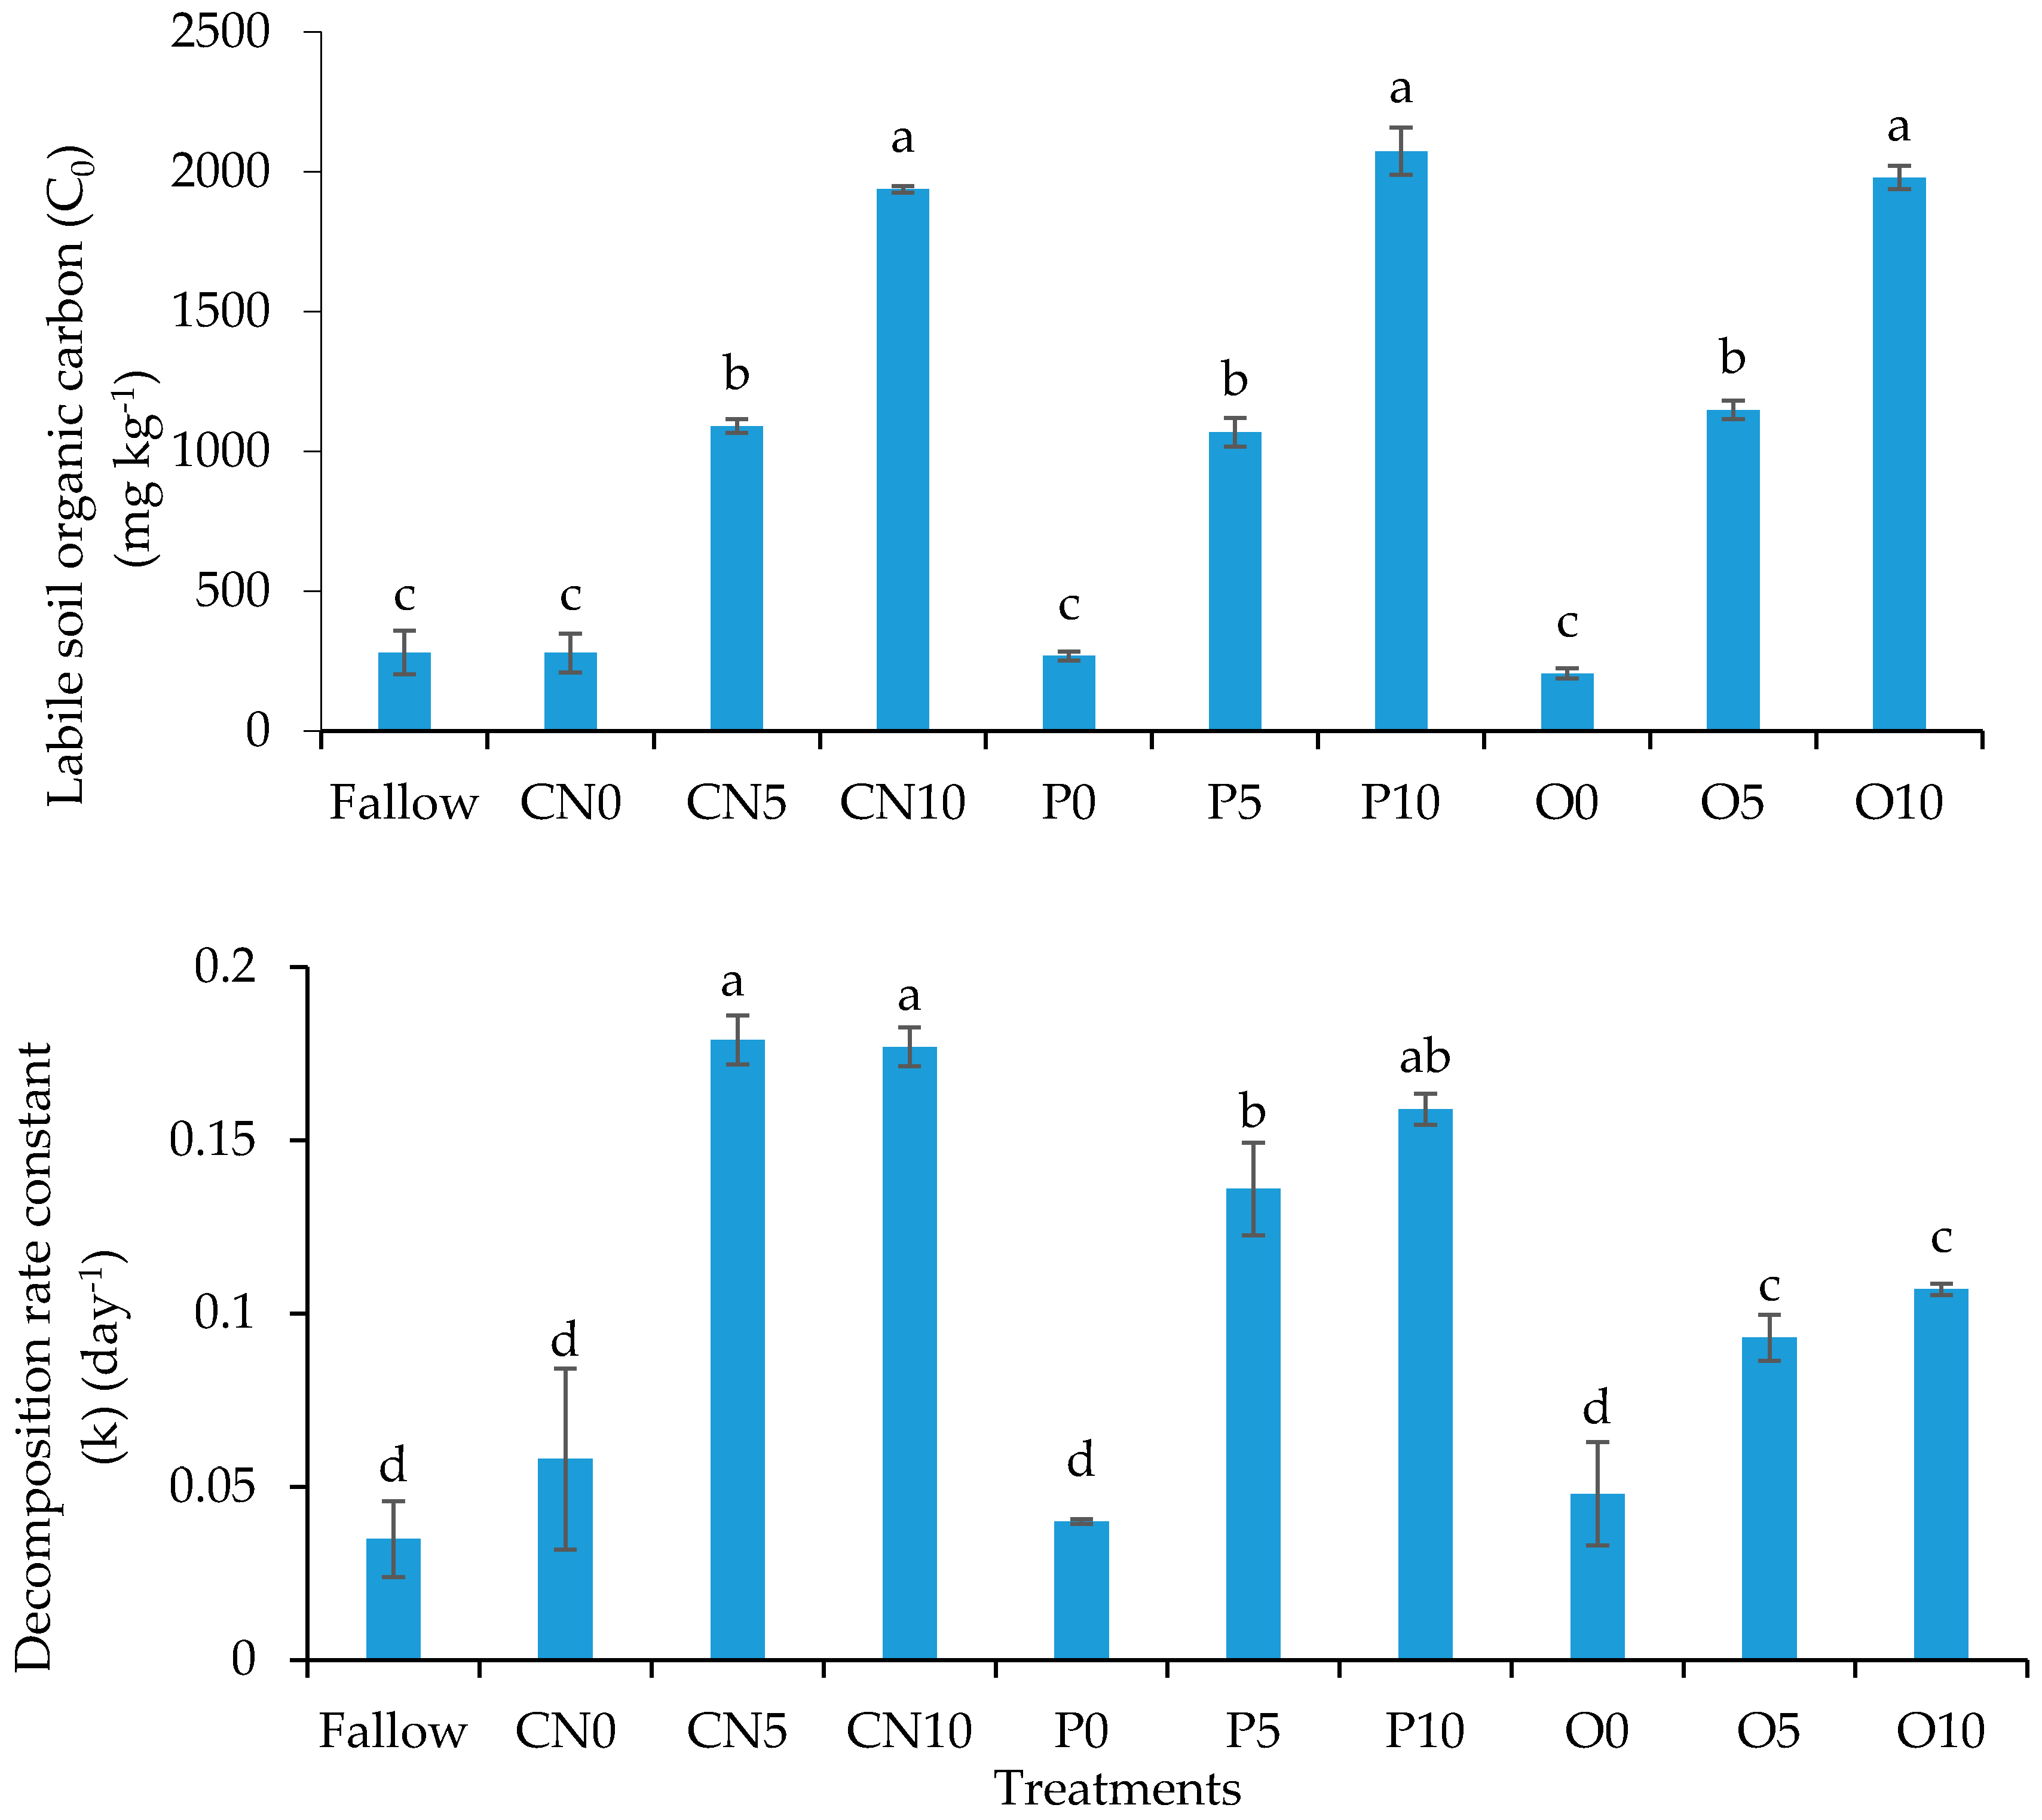
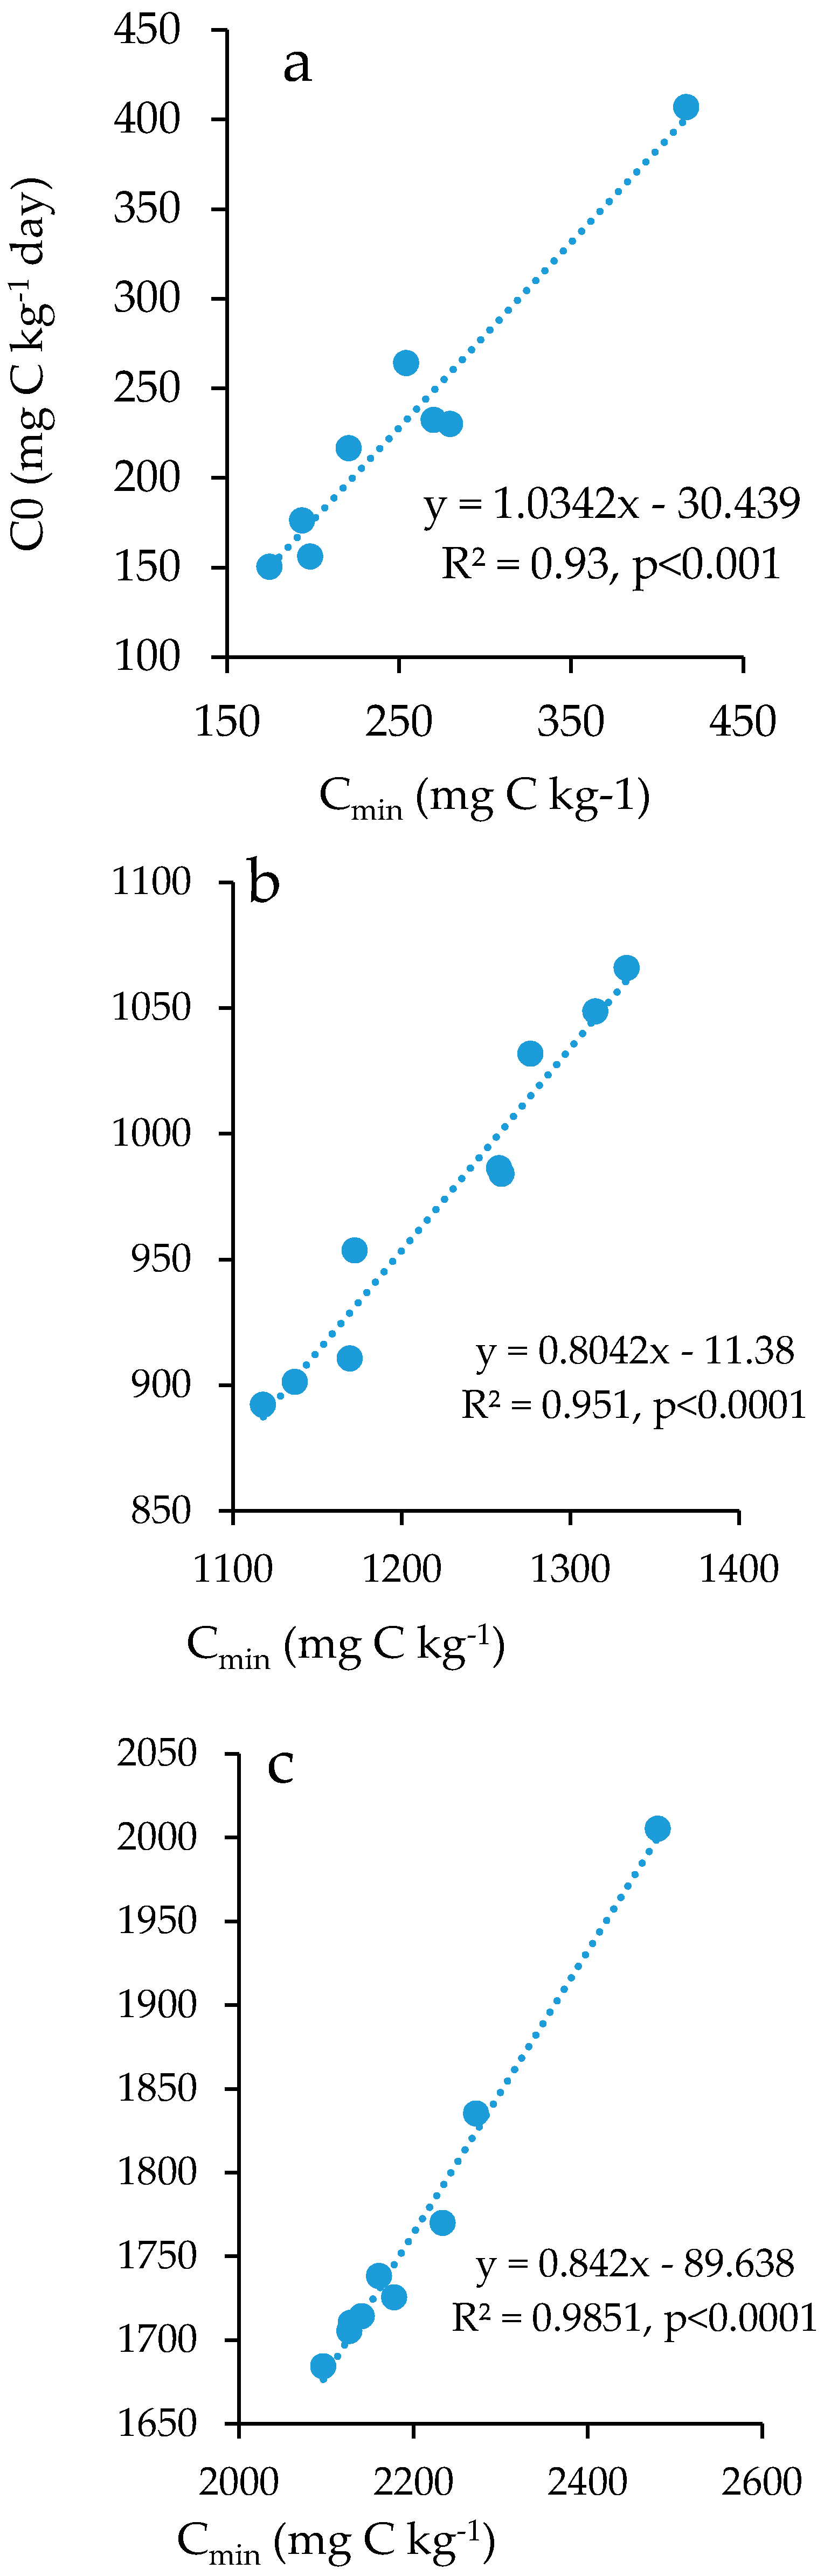
3.4. Soil Organic Carbon Mineralization Kinetics

Crop residue amendments apparently stimulated the cumulative flux of CO2 during the eight weeks of incubation. The SOC mineralization followed a curvilinear pattern. The first order kinetic model as well as curvilinear model predicted SOC mineralization with a good fit (Figure 2). Model 1 showed a high mineralization rate for the first 10 days, followed by a tendency to level off for the remaining period of incubation, whereas Model 2 showed a continuous increase in SOC mineralization throughout the study (Model 2). The observed data fitted to Models 1 and 2 revealed contrasting results for the values of the estimated parameters (C0 and k) between the two models (Table 3), but showed a similar trend in SOC mineralization. Greater values of C0 were observed for Model 1 than for Model 2, irrespective of the treatment. The response was opposite for k. Among the parameters used for the model comparisons, r ranged from 0.93 to 0.98 for Model 1 while it ranged from 0.93 to 0.97 for Model 2. The NRMSE ranged from 8.64 to 25.4 for Model 1 and 12.3–22.3 for Model 2. Neither of these models best fit across all treatments; however, the first order kinetic model (Model 1) explained the results better where the observed Cmin data approached an asymptote. The parabolic model generally continued to increase indefinitely [28], and may not approach an asymptote. Therefore, we used Model 1 for subsequent comparisons of treatments. Model 1 also had lower RMSE and NRMSE values and a higher r value in treatments with residue addition.
A comparison of C0 and k between the different CC residue treatments using Model 1 revealed that C0 and k was dependent on the amount and type of CC residue added to the soil (Figure 3). The C0 was significantly greater for treatments with residue added at the rate of 10 Mg ha−1 than at 5 Mg ha−1 and 0 Mg ha−1 residue addition and fallow. Similarly, C0 was significantly greater with treatments at 5 Mg ha−1 residue addition when compared to no residue addition treatments and fallow. The C0 was 591–858% greater in the 10 Mg ha−1 CC residue addition treatments than in the no CC residue treatments. The C0 was 72–94% greater in the 10 Mg ha−1 CC residue addition treatments than in the 5 Mg ha−1 CC residue addition treatments. Similarly, C0 was 289–456% greater in the 5 Mg ha−1 CC residue addition treatments than the no CC residue addition treatments. However, there was no significant difference in C0 between no residue-treated soils and fallow. Within the same rate of residue addition, there was no significant difference in C0 between the different CC types. In contrast, such an increasing trend was not observed with the decomposition rate constant (k). No significant difference in the values of k was observed when the amount of CC residue was doubled within the same CC type. However, the k values were significantly greater with treatments at 5 Mg ha−1 and 10 Mg ha−1 when compared to no CC residue addition treatments and fallow. Furthermore, it was 122–297% greater with the 10 Mg ha−1 CC residue addition treatments and 94–240% greater with the 5 Mg ha−1 CC residue addition treatments in comparison to the no residue addition treatments. Additionally, k was significantly greater in pea and canola when compared to oat at both 5 Mg ha−1 and 10 Mg ha−1 residue addition. No significant difference was observed for the values of k under no residue treated soil and no CC treated fallow.
The regression analysis of the Cmin (observed) with the C0 (predicted) with Model 1 showed significant relations between C0 and Cmin across treatments with residue addition (Figure 4). The slope from this regression suggested that approximately 103%, 80%, and 84% of Cmin was derived from the labile pool of SOC under 0, 5, and 10 Mg ha−1 CC residue addition, respectively.

4. Discussion

The results of this study supported our hypothesis that SOC mineralization characteristics varied between CC residue types and application rates. We observed a rapid rate of SOC mineralization in the first few weeks of incubation, irrespective of the CC residue type and amount. This suggested that the rapid breakdown of labile substrates such as organic acids, amino acids, and simple sugars in the first few weeks of residue addition was followed by a gradual decrease in SOC mineralization in the later weeks. These results agreed with previous studies [31,32,33] and suggested that labile organic matter decomposed rapidly and produced a large flux of CO2 in the first few weeks of incubation [34]. The recalcitrant fraction of SOC such as lignin, cellulose, etc. decomposed slowly and produced a small CO2 fluxes over a long time [35].
A comparison between these two models revealed similar values for the fit statistics. Higher r values and lower RMSE and NRMSE for treatments with CC residue addition treatments in Model 1 and lower r values and higher RMSE and NRMSE values in Model 2 suggested that neither model was ideal in describing the decomposition characteristics of CC residues in this study. However, the parameters (C0 and k) estimated by Model 1 were consistent with the results from previous SOC mineralization studies [11,36], and the model was able to better explain the results where the observed Cmin data approached an asymptote. The parabolic model generally continued to increase indefinitely, and was not expected to asymptote [28]. Therefore, selecting a model for studying SOC mineralization characteristics should be based on the objective of the study, residue type used, observed decomposition trend, and model fit parameters. In this study, Model 1 was selected for the comparisons of estimated parameters between residue type and rate treatments.
While Cmin was influenced by both the quantity and quality of CC residues, the difference was greater in magnitude between the residue rates than between the residue types, suggesting that soil microbial activity increased with the increase in CC residue input. The increased Cmin with CC residue addition at higher rates might have been due to the presence of a large amount of readily available biological substrates for microbial activity. Soil respiration increased by 33.5% when the rate of corn residue addition was doubled and reduced by 81% when corn residue was removed from a no-till field [4]. Similarly, soil CO2 efflux was up to 8.5 times greater with the addition of straw than without. However, a higher Cmin in soils amended with a higher rate of residue addition also occurred due to the positive priming of already existing organic matter if there was a limited nitrogen environment [37,38]. Therefore, greater mineralization does not necessarily mean a higher rate of SOC sequestration. Further research may confirm the priming effects of CC residues. The results of this study suggested that increased carbon supply under a greater amount of residue addition may have stimulated microbial activities and increased SOC mineralization [39]. In a study comparing crop residue management for diverse soil quality indicators, microbial biomass carbon was reduced to 330 mg C kg−1 when corn residue was removed in comparison to 696 mg C kg−1 in soil where normal corn residue was maintained, and 1060 mg C kg−1 in soil where corn residue was doubled [4]. However, the increase in microbial biomass and fungal to bacterial ratios were strongly positively correlated with substrate availability (dissolved organic carbon) and quality (carbon to nitrogen ratio of dissolved substrates) [40]. Although we did not measure microbial biomass in this study, the response of SOC mineralization with the CC residue additions strongly support the increase in microbial activity and SOC cycling with CC residue addition.
There was no difference in SOC mineralization between the fallow and no CC residue addition (e.g., CN0, P0, O0) treatments, and the Cmin was low when compared to residue added treatments suggesting that SOC mineralization under these treatments was potentially limited by microbial substrate availability. Hot, dry agroecosystems such as the Central and the Southern High Plains of the USA are often limited by biomass carbon inputs and readily available microbial substrates, which leads to smaller microbial biomass and activity [41]. No significant difference in Cmin between these treatments also suggests that carbon inputs from aboveground biomass play an important role in SOC dynamics in highly depleted agroecosystems. An improved understanding of the role of aboveground biomass on SOC mineralization is especially important in semiarid soils with very low SOC content (<1%) such as the drylands of the Southern High Plains region because agroecosystems in these types of environment are often carbon limited. The roots were present in samples with no CC residue addition, which could supply biomass carbon inputs. However, studies have shown that roots decompose more slowly than aboveground plant parts, leading to a smaller Cmin value [42].
Legume CC residues typically decompose faster than grass CC residues, and contribute to SOC cycling and sequestration [43,44]. In line with these observations, we found a greater decomposition rate constant ‘k’ with pea than with the oat residue addition. Grasses are composed of more recalcitrant materials than legume and brassica. Legume and brassica residues, on the other hand, have greater nitrogen and bioavailable carbon pools like lower cellulose, hemicellulose, and acid soluble lignin [10]. Studies have shown that residue quality plays a greater role than residue quantity on SOC sequestration and associated agroecosystem services and functions [10,11,34]. The cumulative SOC mineralization (Cmin) for oat, however, was intermediate between pea and canola while being significantly greater in pea than in the canola residue. This suggests a difference in microbial carbon use efficiency under different residue types. Soils with greater microbial carbon use efficiency and nutrient availability are often reported to have greater SOC sequestration [40]. Green and Blackmer [45] found that the decomposition rate constant per unit carbon was independent of the quantity of residue added under both field and laboratory conditions, instead, it was influenced by residue quality. In this study, canola residue had the lowest, and oat residue had the highest carbon to nitrogen ratio while the observed Cmin was greatest with the addition of pea residue. Despite these differences, CC residues increased SOC mineralization, an index of soil microbial activity associated with SOC and nutrient cycling. Further research may confirm the amount of residue needed to improve SOC sequestration under diverse CC residues and their quality traits. This study emphasized the need for cover cropping and CC residue addition to improve SOC cycling. An increase in decomposition rate constant ‘k’ up to 5 Mg ha−1 and no difference between the 5 Mg ha−1 and 10 Mg ha−1 residue addition treatments suggest the need for at least 5 Mg ha−1 of residue to maintain SOC in these types of hot, dry agroecosystems.

5. Conclusions

SOC mineralization is a function of residue inputs and quality. This study elucidated SOC dynamics with CC residue additions in the context of apparent incoherencies in the SOC mineralization kinetics of diverse crop residues. The results of this study revealed that amending soil with a higher rate of crop residue increased potential carbon mineralizable, an indicator of labile soil organic matter. The first order kinetic model could describe the decomposition characteristics of the crop residues. Large pools of easily decomposable carbon in canola and pea reflected the quick turnover of these residues, which are crucial for nutrient cycling and availability to the subsequent crop. In contrast, oat had a relatively slower decomposition rate and its residue could provide soil cover for a long time. The results of this study suggested that the choice of the cover crops affected SOC mineralization and nutrient cycling in agroecosystems. Long-term field studies into cover cropping and their residue decomposition in semiarid agroecosystems may help in developing management strategies that best optimize nutrient cycling and support crop production. In the semi-arid agroecosystems of the Southern High Plains and other similar regions, management options that consider diverse cover crops and increases in the amount of residue returned to soils can increase SOC accumulation and improve agricultural sustainability.

Acknowledgments

Funding for this research was provided by the New Mexico State University Agricultural Experiment Station and the Agricultural Science Center at Clovis. The research was partially supported by Project # 2016-68007-25066 of the USDA National Institute for Food and Agriculture’s Agriculture and Food Research Initiative.

Author Contributions

R.G. Conceived and designed the experiments; B.G. performed the experiments; B.G., D.V. and R.G. analyzed the data; A.M. and R.G. contributed reagents/materials/analysis tools; B.G. and R.G. wrote the paper, A.M. and D.V. reviewed, and all authors revised the manuscript.

Conflicts of Interest

The authors declare no conflict of interest. The funding sponsors had no role in the design of the study; in the collection, analyses, or interpretation of data; in the writing of the manuscript, and in the decision to publish the results.

References

  1. Liu, X.; Herbert, S.J.; Hashemi, A.M.; Zhang, X.; Ding, G. Effects of agricultural management on soil organic matter and carbon transformation—A review. Plant Soil Environ. 2006, 52, 531–543. [Google Scholar]
  2. Follett, R.F. Soil management concepts and carbon sequestration zin cropland soils. Soil Tillage Res. 2001, 61, 77–92. [Google Scholar] [CrossRef]
  3. Nielsen, D.C.; Lyon, D.J.; Hergert, G.W.; Higgins, R.K.; Holman, J.D. Cover crop biomass production and water use in the central great plains. Agron. J. 2015, 107, 2047–2058. [Google Scholar] [CrossRef]
  4. Karlen, D.L.; Wollenhaupt, N.C.; Erbach, D.C.; Berry, E.C.; Swan, J.B.; Eash, N.S.; Jordahl, J.L. Crop residue effects on soil quality following 10-years of no-till corn. Soil Tillage Res. 1994, 31, 149–167. [Google Scholar] [CrossRef]
  5. Gougoulias, C.; Clark, J.M.; Shaw, L.J. The role of soil microbes in the global carbon cycle: Tracking the below-ground microbial processing of plant-derived carbon for manipulating carbon dynamics in agricultural systems. J. Sci. Food Agric. 2014, 94, 2362–2371. [Google Scholar] [CrossRef] [PubMed]
  6. Miyittah, M.; Inubushi, K. Decomposition and CO2-C evaluation of okara, sewage sludge, cow and poultry manure compost in soils. Soil Sci. Plant Nutr. 2003, 49, 61–68. [Google Scholar] [CrossRef]
  7. Ellert, B.H.; Janzen, H.H. Short-term influence of tillage on CO2 fluxes from a semi-arid soil on the Canadian Prairies. Soil Tillage Res. 1999, 50, 21–32. [Google Scholar] [CrossRef]
  8. Govaerts, B.; Verhulst, N.; Castellanos-Navarrete, A.; Sayre, K.; Dixon, J. Conservation agriculture and soil C sequestration: Between myth and farmer reality. Crit. Rev. Plant Sci. 2009, 28, 97–122. [Google Scholar] [CrossRef]
  9. Kumar, K.; Goh, K.M. Crop residues and management practices: Effects on soil quality, soil nitrogen dynamics, crop yield, and nitrogen recovery. Adv. Agron. 2000, 68, 197–319. [Google Scholar]
  10. Johnson, J.M.F.; Barbour, N.W.; Weyers, S.L. Chemical composition of crop biomass impacts its decomposition. Soil Sci. Soc. Am. J. 2007, 71, 155–162. [Google Scholar] [CrossRef]
  11. Li, L.J.; Han, X.Z.; You, M.Y.; Yuan, Y.R.; Ding, X.L.; Qiao, Y.F. Carbon and nitrogen mineralization patterns of two contrasting crop residues in a Mollisol: Effects of residue type and placement in soils. Eur. J. Soil Biol. 2013, 54, 1–6. [Google Scholar] [CrossRef]
  12. Martin, J.V.; de Imperial, R.M.; Calvo, R.; Garcia, M.C.; Leon-Cofreces, C.; Delgado, M.M. Carbon mineralization kinetics of poultry manure in two soils. Soil Res. 2012, 50, 222–228. [Google Scholar] [CrossRef]
  13. Chen, X.; Wang, X.; Liebman, M.; Cavigelli, M.; Wander, M. Influence of residue and nitrogen fertilizer additions on carbon mineralization in soils with different texture and cropping histories. PLoS ONE 2014, 9, e103720. [Google Scholar] [CrossRef] [PubMed]
  14. Mohanty, S.; Nayak, A.K.; Kumar, A.; Tripathi, R.; Shahid, M.; Bhattacharyya, P.; Raja, R.; Panda, B.B. Carbon and nitrogen mineralization kinetics in soil of rice-rice system under long term application of chemical fertilizers and farmyard manure. Eur. J. Soil Biol. 2013, 58, 113–121. [Google Scholar] [CrossRef]
  15. Hatten, J.A.; Zabowski, D. Changes in soil organic matter pools and carbon mineralization as influenced by fire severity. Soil Sci. Soc. Am. J. 2009, 73, 262–273. [Google Scholar] [CrossRef]
  16. Six, J.; Conant, R.T.; Paul, E.A.; Paustian, K. Stabilization mechanisms of soil organic matter: Implications for C-saturation of soils. Plant Soil 2002, 241, 155–176. [Google Scholar] [CrossRef]
  17. Jenkinson, D.S. Studies on decomposition of plant material in soil. Effect of rate of addition. J. Soil Sci. 1977, 28, 417–423. [Google Scholar] [CrossRef]
  18. Ladd, J.N.; Amato, M.; Jackson, R.B.; Butler, J.H.A. Utilization by wheat crops of nitrogen from legume residues decomposing in soils in the field. Soil Biol. Biochem. 1983, 15, 231–238. [Google Scholar] [CrossRef]
  19. Ajwa, H.A.; Tabatabai, M.A. Decomposition of different organic materials in soils. Biol. Fertil. Soils 1994, 18, 175–182. [Google Scholar] [CrossRef]
  20. Hooker, T.D.; Stark, J.M. Soil C and N cycling in three semiarid vegetation types: Response to an in situ pulse of plant detritus. Soil Biol. Biochem. 2008, 40, 2678–2685. [Google Scholar] [CrossRef]
  21. Baumhardt, R.L.; Schwartz, R.; Howell, T.; Evett, S.R.; Colaizzi, P. Residue management effects on water use and yield of deficit irrigated corn. Agron. J. 2013, 105, 1035–1044. [Google Scholar] [CrossRef]
  22. Web Soil Survey. Available online: https://websoilsurvey.sc.egov.usda.gov (accessed on 10 August 2017).
  23. Gee, G.W.; Bauder, J.W. Particle-size analysis by hydrometer—Simplified method for routine textural analysis and a sensitivity test of measurement parameters. Soil Sci. Soc. Am. J. 1979, 43, 1004–1007. [Google Scholar] [CrossRef]
  24. Rayment, G.; Higginson, F.R. Australian Laboratory Handbook of Soil and Water Chemical Methods; Inkata Press Pty Ltd.: Melbourne, Australia, 1992. [Google Scholar]
  25. Olsen, S.R. Estimation of Available Phosphorus in Soils by Extraction with Sodium Bicarbonate; United States Department of Agriculture: Washington, DC, USA, 1954.
  26. Stanford, G.; Smith, S. Nitrogen mineralization potentials of soils. Soil Sci. Soc. Am. J. 1972, 36, 465–472. [Google Scholar] [CrossRef]
  27. Broadbent, F. Empirical modeling of soil nitrogen mineralization. Soil Sci. 1986, 141, 208–213. [Google Scholar] [CrossRef]
  28. Marion, G.; Black, C. The effect of time and temperature on nitrogen mineralization in arctic tundra soils. Soil Sci. Soc. Am. J. 1987, 51, 1501–1508. [Google Scholar] [CrossRef]
  29. Smith, P.; Smith, J.U.; Powlson, D.S.; McGill, W.B.; Arah, J.R.M.; Chertov, O.G.; Coleman, K.; Franko, U.; Frolking, S.; Jenkinson, D.S.; et al. A comparison of the performance of nine soil organic matter models using datasets from seven long-term experiments. Geoderma 1997, 81, 153–225. [Google Scholar] [CrossRef]
  30. Janssen, P.H.M.; Heuberger, P.S.C. Calibration of process-oriented models. Ecol. Model. 1995, 83, 55–66. [Google Scholar] [CrossRef]
  31. Huang, Y.; Zou, J.W.; Zheng, X.H.; Wang, Y.S.; Xu, X.K. Nitrous oxide emissions as influenced by amendment of plant residues with different C:N ratios. Soil Biol. Biochem. 2004, 36, 973–981. [Google Scholar] [CrossRef]
  32. Abera, G.; Wolde-Meskel, E.; Bakken, L.R. Carbon and nitrogen mineralization dynamics in different soils of the tropics amended with legume residues and contrasting soil moisture contents. Biol. Fertil. Soils 2012, 48, 51–66. [Google Scholar] [CrossRef]
  33. Rochette, P.; van Bochove, E.; Prevost, D.; Angers, D.A.; Cote, D.; Bertrand, N. Soil carbon and nitrogen dynamics following application of pig slurry for the 19th consecutive year: II. Nitrous oxide fluxes and mineral nitrogen. Soil Sci. Soc. Am. J. 2000, 64, 1396–1403. [Google Scholar] [CrossRef]
  34. Trinsoutrot, I.; Recous, S.; Bentz, B.; Lineres, M.; Cheneby, D.; Nicolardot, B. Biochemical quality of crop residues and carbon and nitrogen mineralization kinetics under nonlimiting nitrogen conditions. Soil Sci. Soc. Am. J. 2000, 64, 918–926. [Google Scholar] [CrossRef]
  35. Staaf, H.; Berg, B. Accumulation and release of plant nutrients in decomposing scots pine needle litter—Long-term decomposition in a scots pine forest. Can. J. Botany 1982, 60, 1561–1568. [Google Scholar] [CrossRef]
  36. Mohammed, A.; Naab, J.; Nartey, E.; Adiku, S. Carbon mineralization from plant residue-amended soils under varying moisture conditions. J. Exp. Biol. Agric. Sci. 2014, 1, 492–498. [Google Scholar]
  37. Kirkby, C.A.; Richardson, A.E.; Wade, L.J.; Passioura, J.B.; Batten, G.D.; Blanchard, C.; Kirkegaard, J.A. Nutrient availability limits carbon sequestration in arable soils. Soil Biol. Biochem. 2014, 68, 402–409. [Google Scholar] [CrossRef]
  38. Bingeman, C.W.; Varner, J.E.; Martin, W.P. The effect of the addition of organic materials on the decomposition of an organic soil. Soil Sci. Soc. Am. Proc. 1953, 17, 34–38. [Google Scholar] [CrossRef]
  39. Lou, Y.S.; Ren, L.X.; Li, Z.P.; Zhang, T.L.; Inubushi, K. Effect of rice residues on carbon dioxide and nitrous oxide emissions from a paddy soil of subtropical China. Water Air Soil Pollut. 2007, 178, 157–168. [Google Scholar] [CrossRef]
  40. Kallanbach, C.M.; Frey, S.D.; Grandy, S.A. Direct evidence for microbial-derived soil organic matter formation and its ecophysiological controls. Nat. Commun. 2016, 7, 13630. [Google Scholar] [CrossRef] [PubMed]
  41. Ghimire, R.; Norton, J.B.; Stahl, P.D.; Norton, U. Soil microbial substrate properties and microbial community responses under irrigated organic and reduced-tillage crop and forage production systems. PLoS ONE 2014, 9, e103901. [Google Scholar] [CrossRef] [PubMed]
  42. Austin, E.E.; Wickings, K.; McDaniel, M.D.; Robertson, G.P.; Grandy, A.S. Cover crop root contributions to soil C in a no-till corn bioenergy cropping system. GCB Bioenergy 2017, 9, 1252–1263. [Google Scholar] [CrossRef]
  43. Quemada, M.; Cabrera, M.L. Carbon and nitrogen mineralized from leaves and stems of 4 cover crops. Soil Sci. Soc. Am. J. 1995, 59, 471–477. [Google Scholar] [CrossRef]
  44. Vestgarden, L.S. Carbon and nitrogen turnover in the early stage of Scots pine (Pinus sylvestris L.) needle litter decomposition: Effects of internal and external nitrogen. Soil Biol. Biochem. 2001, 33, 465–474. [Google Scholar] [CrossRef]
  45. Green, C.J.; Blackmer, A.M. Residue decomposition effects on nitrogen availability to corn following corn or soybean. Soil Sci. Soc. Am. J. 1995, 59, 1065–1070. [Google Scholar] [CrossRef]
Figure 1. Cumulative soil organic carbon mineralization (Cmin) during the eight-week incubation study. Treatments were fallow and canola, pea, and oat residue addition at 0 Mg ha−1 (CN0, P0, O0), 5 Mg ha−1 (CN5, P5, O5), and 10 Mg ha−1 (CN10, P10, O10). Bars above the mean are mean ± standard error (n = 3). Mean separated by the same lowercase letters are not significantly different at p < 0.05.
Sustainability 09 02316 g001
Figure 2. Predicted cumulative soil organic carbon mineralization (Cmin) with the first order kinetic model (Model 1) and parabolic equation model (Model 2) in a fallow and canola, pea, and oat cover crop residue addition at 0 Mg ha−1 (CN0, P0, O0), 5 Mg ha−1 (CN5, P5, O5), and 10 Mg ha−1 (CN10, P10, O10) treatments.
Sustainability 09 02316 g002aSustainability 09 02316 g002b
Figure 3. Comparison of the labile soil organic carbon pool (C0); and the decomposition rate constant (k) values between fallow and canola, pea, and oat residue addition at 0 Mg ha−1 (CN0, P0, O0), 5 Mg ha−1 (CN5, P5, O5), and 10 Mg ha−1 (CN10, P10, O10) treatments. Bars above the mean are mean ± standard error. Mean separated by the same letters are not significantly different at p < 0.05.
Sustainability 09 02316 g003
Figure 4. Relationship between the observed cumulative soil organic carbon mineralization (Cmin) and predicted labile SOC (C0) using Model 1 under (a) 0 Mg ha−1; (b) 5 Mg ha−1; and (c) 10 Mg ha−1 CC residue addition during the eight week SOC mineralization study.
Sustainability 09 02316 g004
Table 1. Summary of the biomass carbon, nitrogen, and lignin content of cover crop residue used for the incubation study.
Cover CropBiomass Carbon (%)Biomass Nitrogen (%)Carbon to Nitrogen RatioLignin (%)
Pea 46.34.4910.35.16
Oat 46.12.5318.22.85
Canola 41.25.287.83.30
Table 2. Summary of the basic soil properties of the soil samples used for laboratory incubation.
TreatmentSoil Water Content (%)Available Nitrogen (kg ha−1)Phosphorous (kg ha−1)
Fallow13.1 ± 0.67 a,†20.1 ± 2.45 a21.4 ± 2.96 a
Pea10.5 ± 0.40 b11.9 ± 0.81 b15.9 ± 2.35 a,b
Oat11.3 ± 0.26 b11.3 ± 0.86 b17.7 ± 5.36 a,b
Canola 11.9 ± 0.10 a,b10.5 ± 0.90 b14.7 ± 3.51 b
Data in the table are means ± standard error. Values followed by the same lowercase letter indicate no significant difference between treatments (p < 0.05).
Table 3. Model parameters (C0 and k), correlation coefficient (r), root mean square error (RMSE), and normalized root mean square error (NRMSE) estimated by Model 1 (first order kinetic model) and Model 2 (parabolic equation model) for fallow and different rates (0 Mg ha−1, 5 Mg ha−1, and 10 Mg ha−1) of canola, pea, and oat residue addition treatments in a soil organic carbon mineralization study.
ModelsParameterFallow (F)Treatment
CN0CN5CN10P0P5P10O0O5O10
Model 1C0233277109119383401067207419311471979
k0.030.050.180.180.020.140.160.050.090.11
r0.9600.780.9700.980.950.940.970.950.970.97
(C = C0 (1 − ekt)MSE372678606412,98477413,24925,773368949019,798
RMSE19.292677.911427.811516019.297.4141
NRMSE22.919.310.48.6425.416.611.622.114.511.7
Model 2C014.227.438969118.932568821.6257495
k0.620.510.290.290.650.330.310.540.390.38
r0.960.780.940.940.960.930.940.960.970.97
(C = C0 × tk)MSE29060311,54538,95559514,40147,699239807021,796
RMSE1724.610719724.412021815.590148
NRMSE20.318.214.414.922.317.315.717.813.412.3

