Effects of Soft Loans and Credit Guarantees on Performance of Supported Firms: Evidence from the Czech Public Programme START


Department of Entrepreneurship, University of Economics in Prague, W. Churchill Sq. 1938/4, 130 67 Prague 3, Czech Republic
Sustainability 2017, 9(12), 2293; https://doi.org/10.3390/su9122293
Submission received: 15 November 2017
/
Revised: 7 December 2017
/
Accepted: 8 December 2017
/
Published: 10 December 2017
(This article belongs to the Section Economic and Business Aspects of Sustainability)
Abstract
:The purpose of this article was to conduct an empirical evaluation of the Czech public programme START, which was funded from the European Regional Development Fund. The programme lasted from 2007–2011, and supported new entrepreneurs through the zero interest soft loans and credit guarantees. The counterfactual analysis (using three matching techniques: propensity score, nearest neighbour, and kernel) was conducted on the firm level and investigated the changes in financial performance (net profits, return on assets (ROA), return on equity (ROE), sales, assets turnover, and debt ratio) of the supported firms four years after the end of intervention. The obtained findings could not support the hypothesis assuming a positive impact of the programme on the firm’s performance. On the contrary, supported companies reported on average lower sales and lower return on assets, when compared to the control group. The remaining variables could not prove any statistically significant impact of the programme. Indicators measuring firm’s profitability (net profit, return on assets, and return on equity) suggested a negative influence of the programme and the variable representing debt ratio further indicated that firms that were supported by the programme reported on average higher debt ratio in comparison with the control group. Several policy implications are discussed in the study.
1. Introduction
1.1. Background
The idea of supporting entrepreneurial activity through the system of public policies originated in the scientific empirical evidence, indicating a positive influence of entrepreneurship on economic growth and job creation, e.g., [1,2,3,4,5,6,7]. Policymakers mainly turn their attention towards the support of small and medium-sized enterprises (SMEs), which are considered as those, bearing innovation and increasing regional competitiveness, through the various entrepreneurship policies and public interventions, e.g., [8,9,10,11,12]. To better understand entrepreneurship policies, one can recall a definition by Stevenson and Lundström [13], who explain entrepreneurship policies as “policy measures taken to stimulate entrepreneurship that are aimed at the pre-start, the start-up and post-start-up phases of the entrepreneurial process” [13] (p. 23). Policymakers often use a variety of tools to stimulate entrepreneurial activity, such as soft loans, credit guarantees, payable and non-repayable capital grants, investment incentives, tax deductions, and different forms of entrepreneurial education and trainings to achieve higher economic growth and increased employment by “picking-up winners”, e.g., [9,14,15,16,17]. Foreman-Peck [18] and others, e.g., [19,20,21,22], report the positive effects of the participation in the governmental programmes, boosting entrepreneurship on the firm level. However, outcomes of entrepreneurship policies do not have to be always as positive, as they would be expected by the policymakers. There are researchers, e.g., [5,23,24], who point out that the usage of public policies promoting entrepreneurship should be reduced since impacts of policies may be ambiguous and even could have zero impact on the supported individuals and companies. To shed more light onto this issue, one needs to dive into the empirical field and to investigate the outcomes of concrete programs and policies, e.g., [25]. Recently published reviews of empirical literature by Grimm and Paffhausen [1] and by Cho and Honorati [26] show that it is important to establish access to capital for the new entrepreneurs, nevertheless the authors also point out that the entrepreneurial education and business training programmes have larger positive impacts on supported entrepreneurs when compared to the capital grants and other policies. Both of the studies also indicate that entrepreneurship policies have more significant impacts when it comes to the support of founding enterprises/new start-ups than in expanding of employment of already established companies. Their main conclusion is that there is an overall lack of empirical studies conducted on the firm level, and especially those that aim to assess the long-term impacts of the governmental programmes.
One way to allocate the financial capital to the new entrepreneurs and to help them with the establishment of their own business is through the system of soft loans and credit guarantees that are provided by the public sector. Soft loans aim to “finance businesses or projects over a period of time and at an agreed rate of return, typically on the basis of the quality of cash flow and strength of the underlying assets on subsidized terms” [27] (p. 108), based on Michie and Wishlade [28]. Credit guarantees aim to “provide security for firms that are unable to obtain financing otherwise; may cover all or part of the capital. May take the form of guarantees on bank loans, micro-credit or equity. May involve a fee or higher interest rate for the borrower” [27] (p. 108) based on Michie and Wishlade [28].
The reasoning behind this form of public support, which has become an interest in this article, is to facilitate an access to the financial capital and to remove the financial barriers of high interest rates, collateral requests and other disadvantageous conditions offered by the regular market based financial institutions. This “financial gap”, known as the problem of information asymmetry, originates in the market imperfections. Financial institutions are not capable to obtain all of the relevant information about the loan applicants, therefore, they over-qualify applicant’s risk of bankruptcy, especially for new projects/start-ups and as a result, entrepreneurs aiming to deliver innovation to the market, do not get enough of financial resources. Because of information asymmetries and high transaction costs, financial institutions are reluctant to lend to entrepreneurs, or they lend at very high interest rates, and, therefore, public intervention through soft loans and credit guarantees might be an option as to how to alleviate some of the market imperfections, e.g., [29,30,31,32,33,34].
For the supported SMEs is gained capital a chance to grow, to offer new jobs and to expand their business activities, since they receive a competitive advantage through the public intervention. Accordingly, their support may lead to an increased economic growth and reduction of unemployment. When compared to the capital grants and to other non-repayable forms of entrepreneurship support, in the case of soft loans and credit guarantees, all of the resources that are allocated by the state do not have to necessarily imply a negative cash flow for the state, because not all supported individuals result in bankruptcy, e.g., [9,35,36,37,38,39].
On the other hand, there are still high monitoring costs for the loan provider. If the supported business owners lose their entrepreneurial alertness or start acting riskier, then the borrowed credit might be lost. Stiglitz and Weiss [40] described this behaviour as a moral hazard. In addition to moral hazard, the success of public intervention might be endangered by the adverse selection problem. Therefore, the public authorities need to be cautious when entering the market as financial providers, e.g., [41,42,43,44]. Overall, the effects of public interventions might differ (across countries or over time), and therefore it is important to evaluate the specific programme with respect to the local conditions, e.g., [17].
Evaluations of the financial forms of entrepreneurship support in Europe on the firm level were in the past years mostly investigated by the scholars from the Southern European countries, such as Italy or Spain, e.g., [7,20,30,45,46,47,48]. However, the empirical evidence investigating the outcomes of the soft loans and credit guarantees and generally questioning the outcomes of entrepreneurship policies in the Central and especially Eastern European countries have not deserved much research attention so far, e.g., [27,49,50,51,52,53,54,55,56,57,58,59]. This increasing research gap attracts researchers, who strive to form policy recommendations that are based on the empirical evidence, and those who are willing to be trained as evaluators since a lot of programmes need to be assessed.
Most of the recent studies in the Central and Eastern European region have been focused on the evaluation of cohesion R&D policies and those aimed at the elimination of the regional disparities, e.g., [60,61,62,63,64,65,66,67,68,69,70], policies facilitating trainings and education [71,72] and effectivity of the self-employment programmes for the unemployed [73,74,75]. However, based on a search in the databases of previously published academic articles and research reports, no study has been focused on the evaluation of entrepreneurship support through the financial instruments yet. Therefore, the main aim of this study is to contribute to the regional knowledge, by the assessment of the outcomes of the Czech public programme START, funded from the European Regional Development Fund [76], which was providing credit guarantees and soft loans to the newly established entrepreneurs during the period of years 2007–2011 in the Czech Republic [77]. The empirical analysis is conducted on the firm level (from micro-econometric perspective) and it investigates the changes in the financial performance of the supported firms based on the application of the counterfactual impact analysis (quantitative approach).
The article is structured as follows, in the Section 1.2, the findings of the previously published empirical studies are presented. In the following part (Section 1.3) of the article, the programme START is described and analysed from the economic perspective and the regional allocation of the financial resources is depicted. The second section (Section 2) describes the collected dataset of firms, analysed outcome variables (net profits, return on assets (ROA), return on equity (ROE), assets turnover and debt ratio), and applied empirical strategy. In the third part (Section 3), micro-econometric analysis of the data, employing the framework of counterfactual analysis is conducted. Obtained results are discussed with respect to the previous empirical findings in the fourth part (Section 4). The last part of the article (Section 5) is focussed on the policy recommendations and it provides suggestions for future research.
1.2. Review of Empirical Studies
This section presents the findings of the past studies that are focused on the analysis of the outcomes of the public policies facilitating financial instruments on the firm level. The methodology of the previous scholars is mostly quantitative and it is based on the implementation of econometric methods. Maggioni et al. [78] analysed the outcomes of the Italian programme supporting new ventures through loans with reduced interest rates. They were unable to prove any significant influence of the programme on the sales, their growth, or on a number of employees. Honjo and Harada [79] investigated the impact of the Japanese Creative Business Promotion Law (CBPL) on the growth of sales, assets, and employment of the supported businesses. Their results confirm a positive influence of the programme on the growth of assets. Kang and Heshmati [80] studied the effects of the credit guarantee policy in Korea on the productivity, sales, and employees of the supported enterprises. They found no impact of the policy on the employment, however, positive influence was observed for the variables that were measuring firm performance (productivity and sales). Zecchini and Ventura [81] investigated the effects of the Italian credit guarantees scheme on the assets, sales, number of employees, and debt-ratio of the supported enterprises. Obtained empirical results confirm the positive influence of the scheme on the sales and assets of the supported companies. However, no influence was found on a number of employees. Furthermore, the authors of the study observed a higher debt ratio for the supported firms in comparison with the control group. Oh et al. [82] analysed the outcomes of the Korean programme facilitating credit guarantees. Investigated variables accounted for survival rates, growth rates of productivity, employment, sales, R&D status, and investment intensity. The authors conclude that the programme positively influenced a firm’s survival rate, but no effect was observed for R&D activity and productivity. Kösters [83] studied the effects of the Eastern German programme supporting firms with soft loans and credit guarantees. She finds no statistically significant impact of the programme on the survival rates and growth in employment of the supported companies. On the contrary, Garcia-Tabuenca and Crespo-Espert [48], found a positive influence of the Spanish programme facilitating financial instruments on the productivity, sales, value added, and profitability of the supported firms. Gubert and Roubaud [84] investigated the outcomes of the micro-finance loan schemes in Madagascar. They conclude that the programme had a positive influence on the turnover, productivity, value added, profit, and number of employees of the supported enterprises. One of the more recent studies was conducted by Cowling and Siepel [85] who analysed the outcomes of the Loan Guarantee Scheme (SFLG) in the United Kingdom. They report positive effects of the programme on the sales, exports, and job creation of the supported enterprises.
Based on the presented outcomes of the previously published studies, it is very difficult to derive any conclusions regarding the outcomes of the programmes facilitating financial instruments. Public schemes could have both positive and negative effects on the firm’s profitability, performance, and amount of employees. Previous studies serve as an inspiration for the analysed outcome variables and empirical approach towards the programme evaluation. The presented study contributes to this research debate by the assessment of the Czech public programme START, which is described in the following section.
1.3. Public Programme START
The programme START took place in the Czech Republic in the two subsequent calls, during the period of years 2007–2011. As requested for the European Union (EU) public support, the programme was following the principle de minimis. The programme was a part of the Operational Programme Enterprises and Innovation (OPEI) funded from the European Regional and Development Fund (ERDF) during the EU programming period of years 2007–2013 [76,86]. The main organizing institutions, which were responsible for the programme, were the Czech-Moravian Guarantee and Development Bank [87] and the Ministry of Industry and Trade [77]. The programme that START intended to support completely new entrepreneurs or those who were starting a business activity seven years after they ended their previous one. The programme’s objective was to increase the competitiveness of the Czech Republic. The idea behind the programme was to facilitate access to financial capital for new business ideas through the system of zero interest soft loans and credit guarantees. Applicants had to meet several criteria to obtain public support. Business activity of applicants could not be focused on the sector of agriculture (with exceptions) and they could not have any liabilities against the Czech public authorities. Entrepreneurs aiming to start a business in the Capital Prague were also excluded from the application process. In the first step of the selection process, a risk profile, business authorization and financial history of the clients have been assessed. Applications were assessed by external evaluators, who made decisions about the acceptance of the business proposals (criteria included preparedness of the project, its feasibility, and cost structure). Each of the evaluators had to provide a brief summary of the strengths and weaknesses of the proposal, together with his/her recommendation. Finally, the approved requests were executed by the Czech-Moravian Guarantee and Development Bank [77,87,88].
Applicants could choose between the two forms of support from the programme START. The first one offered them a zero interest soft loan, covering up to 90% of the project costs, up to 0.75 mil. CZK (29,528 EUR) in the case of a solo entrepreneur, or up to 1.5 mil. CZK (59,055 EUR) in the case of an entrepreneurial team. Please note, that all of the financial amounts were converted into Euros by the average exchange rate for the analysed period of years 2007–2014. Data were collected from Eurostat [89] and the calculated average exchange rate was 27.54 EUR/CZK. The maximum possible maturity was set up to be seven years. The second scheme offered applicants a credit guarantee covering up to 80% of the loan. The maximum amount of the loan was 1.5 mil. CZK (59,055 EUR) and the maturity had to be longer than three years. The recipient of the guarantee had to pay 0.1% p. a. of the guarantee for the service, however, at the same time, he/she received a public support that was worth 3% of the guarantee. If the guarantee was not applied, then the project was implemented successfully within two years, and the supported entrepreneur(s) was/were repaying the loan, then the recipient received an extra bonus making 15% of the loan [77,88].
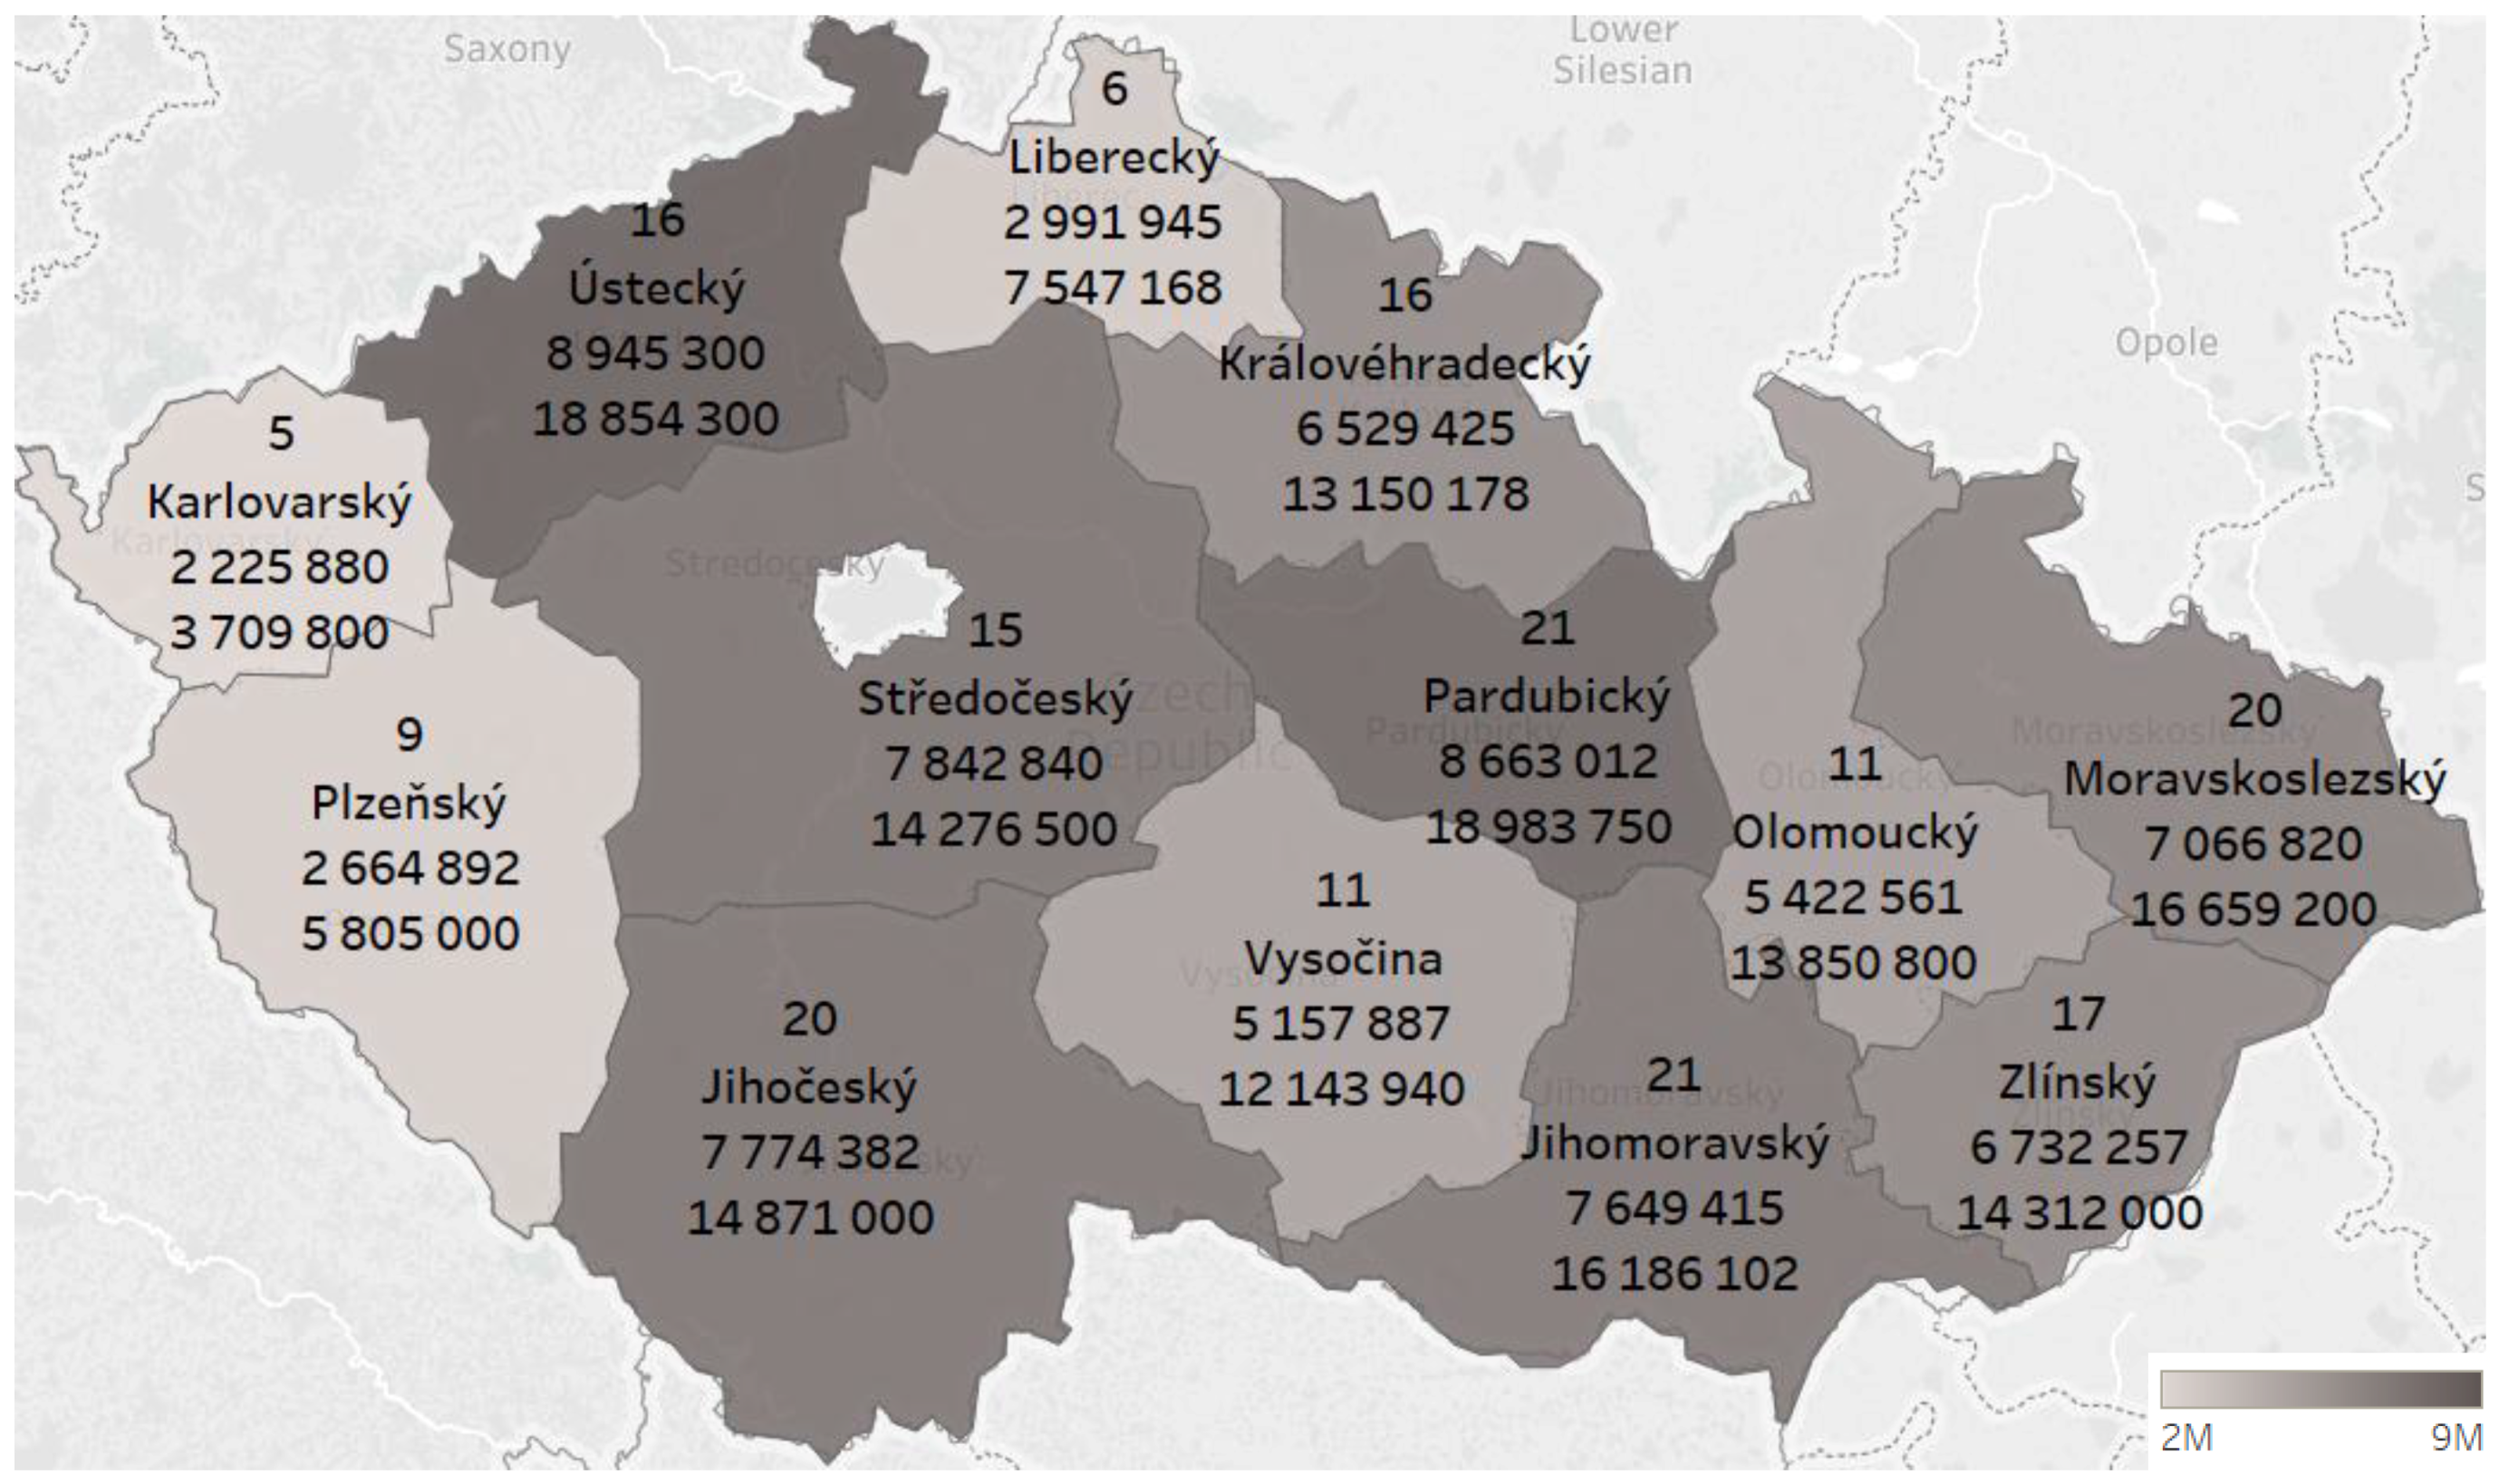
The total amount of funds that was allocated to the projects from public resources was 79.7 mil. CZK (3.1 mil. EUR); however, the projects got financial capital worth 170.3 mil. CZK (6.7 mil. EUR) in total, since the loans and guarantees were organized within the partnerships with other market based financial institutions. 88 projects were supported by the credit guarantees and 100 projects got zero interest soft loans. The highest share of the projects was supported in 2008 and the last projects were supported in 2010. The majority of the supported were self-employed/freelances (107), and the rest of them represented a business company. From the projects supported by the credit guarantees, the most frequent project was the construction of the photovoltaic power plants, and out of the projects that were supported by the zero interest soft loans, it was the foundation of a store. When it comes to the number of employees, the majority of the supported businessmen (112) reported that they have fewer than five employees. Regional allocation of the projects across the Czech NUTS three regions is depicted in Figure 1. The highest amounts of public resources have been allocated to the regions Ústecký, Pardubický, and Středočeský. On average, each of the projects received 0.9 mil. CZK (35,433 EUR), out of which 0.4 mil. CZK (15,748 EUR) was obtained from public funds [88].
To see whether this remarkable allocation of financial capital had any impact on the financial performance of the supported enterprises, I run the following counterfactual analysis, applying the methodology of previous scholars, e.g., [19,20,83,90], assuming a quasi-experimental research framework. The following key performance indicators were selected based on the previously published studies and based on the data availability. My research hypothesis is formally stated as follows:
Hypotheses 1 (H1):
Firms participated in the programme START reported better financial performance in terms of higher profits, higher return on assets (ROA), higher return on equity (ROE), higher sales and higher assets turnover, in comparison with the control group.
2. Materials and Methods
The empirical analysis is based on the firm level data, covering the period of years 2006−2014. Based on the list of supported projects [88], 188 supported companies were identified (for sectoral distribution, see Table A1). As a second step, the database Albertina [92] was used to collect the data. To ensure that the selection of companies in the control group would not affect the results, a control group of 18,499 firms was selected randomly from the population of active enterprises and their data were collected from the database. Collected variables are depicted in Table 1. After the data collection, the descriptive statistics have been inspected and several adjustments have been made. All entities that are not considered as business units (e.g., schools, foundations, or associations) were removed. To make sure that the extreme values (outliers) would not affect the results, the main financial outcome variables of the control group (return on assets, assets turnover, and debt ratio) have been restricted by the interval (−400; 400). This aimed to achieve that “value leaders and losers” were excluded from the sample as suggested by the previous researchers, e.g., [93]. Unfortunately, the dataset suffers from an extreme amount of missing values. No data could be obtained for the self-employed/freelancers (107) participating in the programme, which do not have any obligation to report their financial records. Out of the 81 remaining business companies, I was able to collect data for 57 firms, having in total data for 30% of all supported enterprises and for 70% of the supported business companies. Therefore, I am able to evaluate the programme only with respect to the supported business companies. Control sample finally consisted out of 10,681 firms, having complete data.
To evaluate the impact of the participation in the programme on the performance of the supported firms, I apply a quasi-experimental approach and perform a counterfactual analysis based on the established research methodology. The idea behind the counterfactual impact evaluation is to match two hypothetically identical individuals/companies, one with the treatment (support) and one without it and to observe the effect of the particular intervention. Because we do not have two identical individuals/companies, we use the matching procedures to make pairs with the most similar characteristics. The estimated effect of the participation in the programme START (Average Treatment Effect on the Treated—ATET) is thus quantified after the application of the matching procedures (kernel matching, propensity score matching and nearest neighbour matching). Matching procedures are implemented to connect with each of the supported firm (Treated) a partner non-supported firm (Control) with the most possible similar characteristics that were based on the estimated propensity score. The propensity score is quantified based on the results of the logistic regression estimating the probability of the participation in the programme. Each pair is then matched based on the characteristics before the programme started, and the average treatment effect on the treated (ATET) is quantified after the programme ended, as a difference between the Treated firms and the Control group. Implementation of the three different matching techniques serves as an additional robustness check, since there are slight differences between the three matching techniques. Especially nearest neighbour matching (matching firm that is closest in terms of the propensity score) is different from the two previous techniques (based on weighted averages of nearly all of the available firms) and it is usually employed to help in reducing bias [38,94,95,96,97].
3. Results
My empirical approach begins with the estimation of the logistic regression needed for a calculation of the propensity score, then the different matching procedures are applied and finally the results are interpreted in the line of existing research [98]. All of the calculations were made in the software STATA 14. Estimated logistic regression is presented in Table 2. The dependent (outcome) variable in the model was the probability of the participation (Treated) in the programme START, and as explanatory variables (covariates) were used Year of Registration, Company Size, Sector and Region applied commonly in the previous empirical studies, e.g., [9]. The model fit is quite good, the Pseudo R-Squared informs us that the model was able to explain 36% of the variability of the dependent variable. Despite that all coefficients were not found to be statistically significant, the covariates are kept in the model in order to calculate the most appropriate propensity score [98]. The model supported the previously presented descriptive evidence. Likelihood of the participation in the programme START is higher for younger companies, enterprises doing business in Pardubický region, and when it comes to a sector, the higher probability was observed for firms in services, manufacturing or motor vehicles sectors.
Given the fact that the selected covariates were found to be statistically significant when it comes to the participation in the public programme START, I proceed with the estimation of the ATET with the usage of the three matching techniques—propensity score matching (PSM), kernel matching, and nearest neighbour matching. However, before I present the results after the matching, it is worth having a look at the raw results as they occur in the sample. The outcomes are analysed as four-year averages after the intervention was over (averages for years 2011–2014), allowing for me to discuss particular effects of the programme. Initially, it looks like the supported firms reported a lower net profit, lower return on assets (ROA), lower return on equity (ROE), lower sales, lower assets turnover, and higher debt ratio, as can be seen in Table 3.
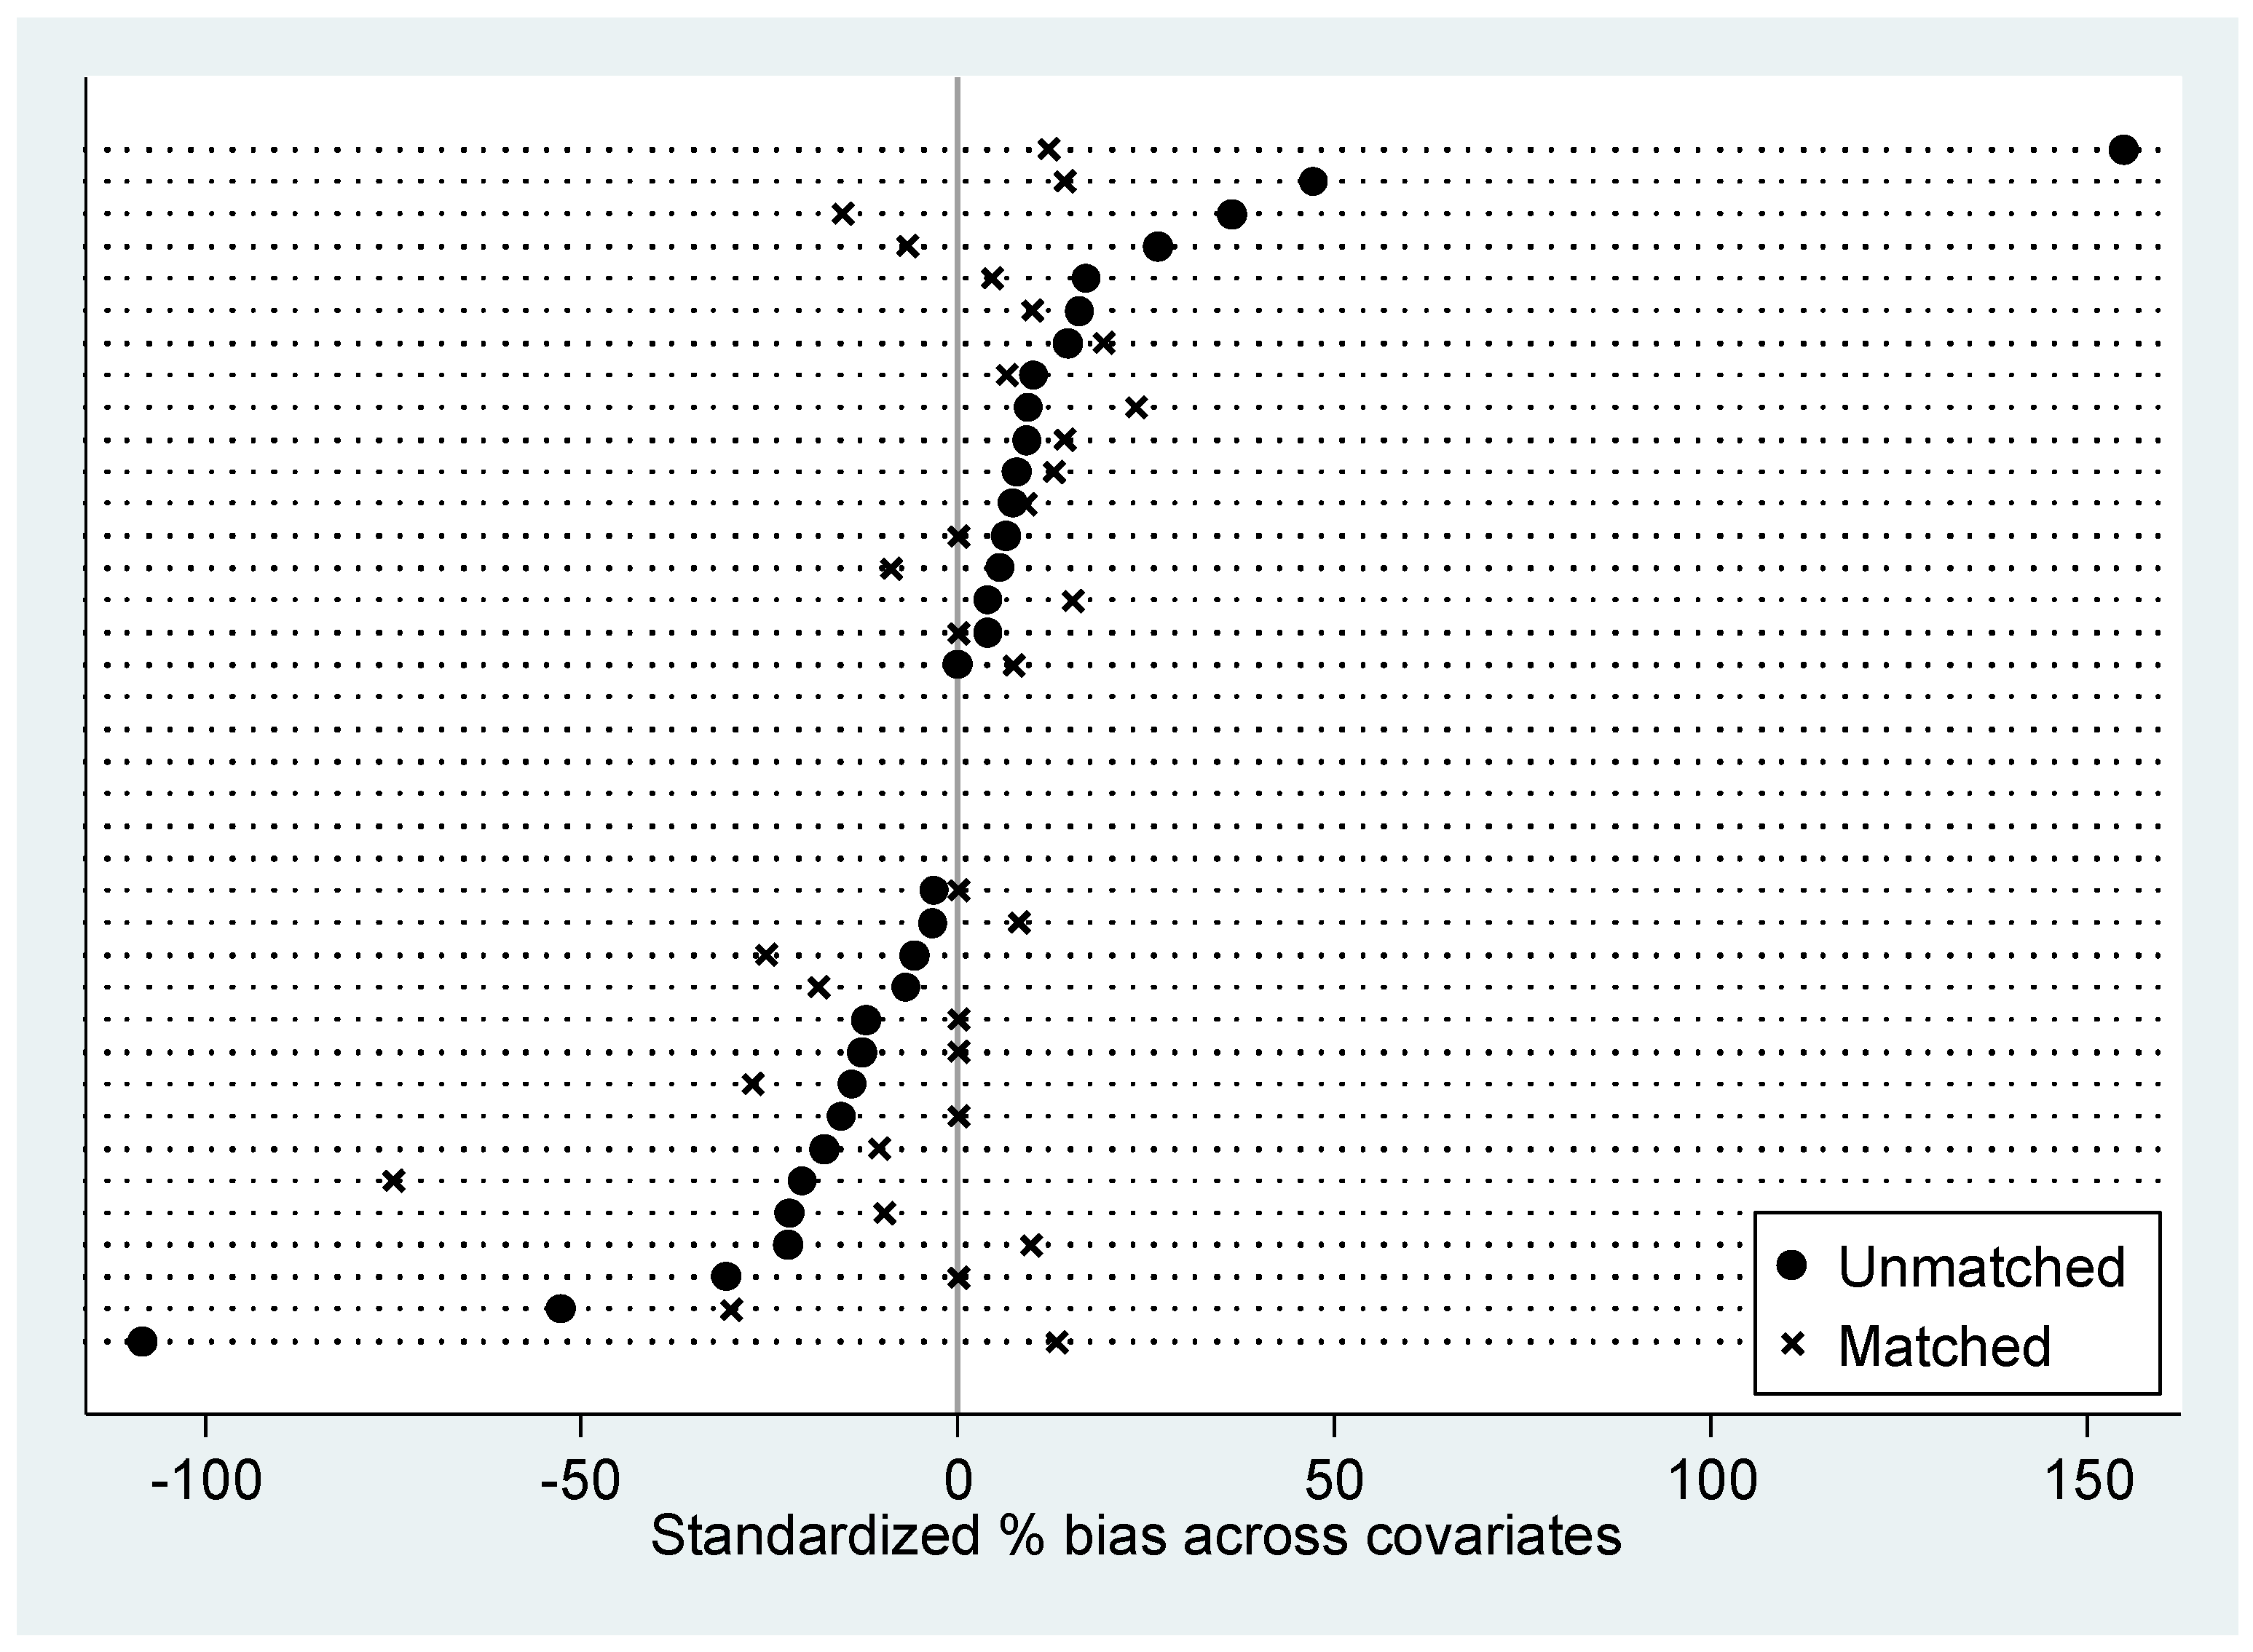
Obviously, the former results depicted in Table 3 suffer from the large heterogeneity, and therefore it is very useful to implement matching techniques to reduce the bias. Following the methodology of the previous researchers, e.g., [38,94,95,96,97]. I used the three matching techniques mentioned above to achieve the lowest possible bias between the Treated and Control groups. After the estimation of the propensity score, I have checked the mean and median bias and I conclude that the matching procedures substantially reduced the bias (for standardized percentage bias across covariates, see Figure A1 in Appendix A). Therefore, I am allowed to proceed with the interpretation of the estimated ATETs, which are reported in Table 4. Out of the six indicators, the variable representing sales (and a natural logarithm of sales—Log(Sales)—as a robustness check) was found to be the most statistically significant, proving that when compared to the control group, firms that participated in the programme START (Treated) reported on average lower sales during the period of four years after the participation in the programme (2011–2014). The second statistically significant outcome variable, representing assets turnover, confirmed that firms that participated in the programme START (Treated) reported on average lower assets turnover during the period of four years after the participation in the programme (2011–2014). The remaining indicators could not prove any statistically significant impact of the programme. Noteworthy is that all three variables measuring a firm’s profitability (net profit, return on assets, and return on equity) suggested a negative influence of the programme, regardless of the applied matching technique. The variable representing debt ratio further suggested that firms that were supported by the programme reported on average higher debt ratio in comparison with the control group.
4. Discussion
As I have already mentioned in the introduction, such an analysis has not been conducted in the Czech Republic so far, and therefore the only remaining option is to compare the results with the findings of scholars from abroad. For instance, Gubert and Roubaud [84] and Cowling and Siepel [85] report a statistically significant positive impact of the participation in the programme on the performance of the supported enterprises, which was not a case in this study. Presented results are also against the findings of Honjo and Harada [79], Zecchini and Ventura [81], or Garcia-Tabuenca and Crespo-Espert [48], who are in favour of the positive impact of interventions on sales and profitability of the supported companies. Obtained results can be compared with the findings of Maggioni et al. [78] or Kösters [83], who were also unable to find positive outcomes on the performance of the supported companies by the public policies. Concretely, Maggioni et al. [78] were unable to prove any impact of the programme on sales and they also report a higher debt ratio for the treated firms, in comparison with the control group. Furthermore, Kösters [83] report even higher failure rates for the group of supported firms. Stated hypothesis (H1), assuming a better financial performance of the supported (Treated) firms, in comparison with the control group, in terms of higher net profits, higher return on assets (ROA), higher return on equity (ROE), higher sales and higher assets turnover, based on the obtained results cannot be supported.
Despite the fact that there is a theoretical justification of the policies facilitating access to the financial capital, based on the existence of information asymmetry and market imperfections, the presented results fit more to the point of view of scholars, who are sceptical about the public support of entrepreneurship, e.g., [23,99]. Companies that are supported by the programme START do not seem to be new unicorns or high-growth enterprises [100] increasing the competitiveness of the Czech economy. They even underperform the regular (non-supported) companies. Therefore, the public policy does not seem to be fulfilling its main objective. Perhaps, the supported projects would not have been normally supported by the regular-market based financial institutions due to their higher risk of default or in-sufficient profitability, which cannot be appropriately assessed by the public evaluators and representatives. The owners of companies might tend to use this opportunity more than necessary and get even a higher amount of financial capital than they would have originally needed, because of the favourable conditions that are provided by the government. This may decrease their entrepreneurial alertness and it may lead to an increase in their risk acceptance rates. The more risk-taking that firms are, the higher probability that there is a default. Decades ago, Stiglitz and Weiss [40] described this behaviour as a moral hazard. In addition to the moral hazard, this might also be a case of adverse selection problem, e.g., [43,44]. Therefore, the supported enterprises may report even higher rates of the default and worse financial results when compared to the regular non-supported companies, which is of course not favourable for the taxpayers who have to pay the costs of the programme, e.g., [30,33,81,82].
5. Conclusions
The recent empirical evidence suggests that the facilitation of financial capital towards the new entrepreneurs as a way to achieve higher entrepreneurial activity, higher economic growth, and higher employment rates may work. This approach is theoretically justified by an existence of the “finance gap”, which is caused by the presence of information asymmetries on the financial markets for small and medium-sized enterprises (SMEs), which are unable to gain enough of financial capital for their business activities, e.g., [31,33,34]. Allocation of the financial resources is often mediated through the system of zero interest soft loans and credit guarantees provided by the governmental institutions. However, the researchers also point out that it is necessary to evaluate the concrete programmes implemented in the particular regions with respect to the local conditions. A well-designed programme might boost the supported companies, nevertheless, the programme that is dominated by a moral hazard and adverse selection problems might lead to a waste of public resources on the burden of taxpayers. The outcomes of the programmes may, therefore, vary over the time and across the regions, e.g., [9,20,30,39,90,101].
Evaluations of the entrepreneurship policies in the Central and Eastern European countries have not received much research attention so far and therefore there is a substantial research gap, which needs to be fulfilled, e.g., [54,55,59,102,103,104,105]. The main purpose of this article was to contribute to this perceived research gap by the performance of an empirical evaluation of the programme START, funded from the European Regional Development Fund (ERDF), which was providing credit guarantees and zero interest soft loans to the newly established entrepreneurs during the period of years 2007–2011 in the Czech Republic. The total amount of funds allocated to the projects from the public resources was 79.7 mil. CZK (3.1 mil. EUR), however, the projects received financial capital worth 170.3 mil. CZK (6.7 mil. EUR) in total, since the loans and guarantees have been organized within the partnerships with other market based financial institutions. Obtained results from the evaluation may be used as a support material for the future policy adjustments, and as a retrospective feedback for the local policy representatives [106,107,108]. The empirical analysis was conducted on the firm level and investigated changes in the financial performance of the supported firms in comparison with other non-supported firms. As for the methods, the counterfactual analysis was implemented. The obtained findings could not support the hypothesis assuming a better financial performance of the supported (Treated) firms, in comparison with the control group, in terms of higher profits, higher return on assets (ROA), higher return on equity (ROE), higher sales, and higher assets turnover four years after the end of programme. Supported companies reported on average lower sales and lower return on assets, when compared to the control group. The remaining variables could not prove any statistically significant impact of the programme. Indicators measuring firm’s profitability (net profit, return on assets, and return on equity) suggested a negative influence of the programme and the variable representing debt ratio further indicated that firms that were supported by the programme reported on average a higher debt ratio in comparison with the control group. Moreover, four years after the end of the programme 9% of the supported firms have already been listed as economically inactive.
Nevertheless, the conducted analysis suffers from at least two limitations that need to be stated. Firstly, the outcomes of the programme could have been analysed only on the smaller share of all the supported firms due to the missing data. Since only 70% of the supported business companies had available data for the evaluation, the presented findings might be also influenced by the sample bias, which could be mitigated by having complete data for the supported companies. Secondly, the supported companies were not matched with the rejected participants, who applied for the same programme and who would have been the best control group for the analysis. Having rejected participants as a second control group would have definitely increased the reliability of the empirical analysis, e.g., [108,109].
Based on this empirical experience, there are many requests that need to be transferred to policymakers. It looks like public authorities and external evaluators of the programme START failed to support projects with a growth potential. From a theoretical perspective, adverse selection and moral hazard have dominated the programme START. Therefore the public authorities should more carefully inspect the cost structures of the projects and judge whether the amounts of requested funds are adequate for the business intentions and to filter out requests that only aim to collect as much funding as possible for the given favourable conditions [40,43,44,110]. Furthermore, Kaplan and Strömberg [111] or Denis [34] argue, that entrepreneurs would less likely abandon businesses with a high potential/value. Therefore, the sustainability and potential growth of the project proposals should be more carefully assessed by the evaluation team. In order to increase the quality of the evaluation process and due diligence of the project proposals, additional training of the evaluation team might be useful. Nevertheless, there are researchers, e.g., [42], who doubt that public sector employees could better or equally correctly screen the project proposals and to minimize information asymmetries, when compared to the banks and regular market based financial institutions.
For future evaluations of the public programmes in Central and Eastern Europe, researchers need to have reliable data, which may result from the narrow cooperation between the research community and public authorities, e.g., [16]. Such cooperation would help policymakers to establish a set of outcome indicators and pathways to their evaluation. Presented experience revealed that it is very difficult to assess the data, which are not available. It is therefore impossible to assess employment outcomes of the programme. Thus, it is necessary for policymakers, setting up the rules of the programme, to include a reporting duty on the supported companies on a number of employees, or to extract the data from the social security system. Reporting duty also needs to be imposed on financial variables and on all forms of entrepreneurship (e.g., self-employed/freelances), otherwise, their data cannot be included in the evaluation, serving as a remedy to mitigate the threat of moral hazard and adverse selection. Additionally, the list of rejected participants should be available for research purposes as well. It would be excellent if the public authorities (in the case of this particular study the Czech Ministry of Industry and Trade), would collect the key financial indicators (from the balance sheets, profit and loss statements, cash flow, and employees reports) by themselves and based on a mutual confidential agreement would facilitate the data to the particular research teams.
Follow-up research could investigate the potential effects of the public programmes on other outcome variables. Interesting variables might be growth in employment, productivity, investment intensity, and assets. Another suggestion might be to investigate outcomes of the programme with respect to sectors to see, which sectors mostly benefit from the public interventions. Future research should also concentrate on the collection of the best policy practices, in order to improve quality of the programmes, facilitating financial instruments and access to financial capital.
Acknowledgments
Author thanks to Ilan Alon, Ivana Blažková, Jan Čadil, Rangamohan Eunni, Martin Lukeš and to the three anonymous referees for their contributions to paper development. This research was funded under the EU collaborative research project CUPESSE (Cultural Pathways to Economic Self-Sufficiency and Entrepreneurship; Grant Agreement No. 613257).
Conflicts of Interest
The author declares no conflict of interest.
Appendix A

Table A1.
Sectoral distribution of the supported companies (21 NACE categories, N = 176).
| Sector | Frequency (%) |
|---|---|
| Administrative and Support Service Activities | 1.14 |
| Transportation and Storage | 1.70 |
| Information and Communication | 2.70 |
| Arts, Entertainment and Recreation | 0.00 |
| Other Service Activities | 10.23 |
| Financial and Insurance Activities | 1.14 |
| Professional, Scientific and Technical Activities | 6.25 |
| Construction | 10.23 |
| Mining and Quarrying | 0.00 |
| Accommodation and Food Service Activities | 5.68 |
| Wholesale and Retail Trade, Repair of Motor Vehicles | 19.32 |
| Public Administration and Defence | 0.00 |
| Education | 0.57 |
| Electricity, Gas, Steam and Air Conditioning Supply | 7.39 |
| Human Health and Social Work Activities | 5.68 |
| Agriculture, Forestry and Fishing | 3.41 |
| Manufacturing | 21.02 |
| Water Supply, Sewerage, Waste management | 1.70 |
| Real Estate Activities | 2.27 |
Figure A1.
Standardized percentage bias across covariates.

References
- Grimm, M.; Paffhausen, A.L. Do interventions targeted at micro-entrepreneurs and small and medium-sized firms create jobs? A systematic review of the evidence for low and middle income countries. Labour Econ. 2015, 32, 67–85. [Google Scholar] [CrossRef] [Green Version]
- Dvouletý, O. Can Policy Makers Count with Positive Impact of Entrepreneurship on Economic Development of the Czech Regions? J. Entrepreneurship Emerg. Econ. 2017, 9, 286–299. [Google Scholar] [CrossRef]
- Dvouletý, O. Determinants of Nordic Entrepreneurship. J. Small Bus. Enterp. Dev. 2017, 24, 12–33. [Google Scholar] [CrossRef]
- Van Stel, A.; Storey, D. The link between firm births and job creation: Is there a Upas tree effect? Reg. Stud. 2004, 38, 893–909. [Google Scholar] [CrossRef]
- Shane, S.A. (Ed.) Economic Development through Entrepreneurship: Government, University and Business Linkages; Edward Elgar Publishing: Cheltenham, UK, 2007. [Google Scholar]
- Craig, B.R.; Jackson, W.E.; Thomson, J.B. Small Firm Finance, Credit Rationing, and the Impact of SBA-Guaranteed Lending on Local Economic Growth. J. Small Bus. Manag. 2007, 45, 116–132. [Google Scholar] [CrossRef]
- Van Praag, C.M.; Versloot, P.H. What is the value of entrepreneurship? A review of recent research. Small Bus. Econ. 2007, 29, 351–382. [Google Scholar] [CrossRef]
- Boesenkopf, F.A. Entrepreneurial Ecosystem: How to Improve Your Local Ecosystem with Political Initiatives. In Handbook of Cyber-Development, Cyber-Democracy, and Cyber-Defense; Springer: Cham, Switzerland, 2017; pp. 1–24. [Google Scholar]
- Pergelova, A.; Angulo-Ruiz, F. The impact of government financial support on the performance of new firms: The role of competitive advantage as an intermediate outcome. Entrepreneurship Reg. Dev. 2014, 26, 663–705. [Google Scholar] [CrossRef]
- Millán, J.M.; Congregado, E.; Román, C. Persistence in entrepreneurship and its implications for the European entrepreneurial promotion policy. J. Policy Model. 2014, 36, 83–106. [Google Scholar] [CrossRef]
- Lukeš, M. Entrepreneurs as Innovators: A Multi-Country Study on Entrepreneurs’ Innovative Behaviour. Prague Econ. Pap. 2013, 22, 72–84. [Google Scholar] [CrossRef]
- Thurik, A.R. Entreprenomics: Entrepreneurship, economic growth and policy. In Entrepreneurship, Growth and Public Policy; Cambridge University Press: Cambridge, UK, 2009; pp. 219–249. [Google Scholar]
- Stevenson, L.; Lundström, A. Patterns and Trends in Entrepreneurship/SME Policy and Practice in Ten Economies; Swedish Foundation for Small Business Research: Stockholm, Sweden, 2001. [Google Scholar]
- Román, C.; Millán, A.; Millán, J.M.; van Stel, A. Does the effectiveness of employment incentive programs vary by firm size? J. Econ. Issues 2017, 51, 222–237. [Google Scholar] [CrossRef]
- Lee, S.H.; Lim, E.S.; Hwang, J. Do credit guarantees for small and medium enterprises mitigate the business cycle? Evidence from Korea. Empir. Econ. 2017, 52, 1367–1378. [Google Scholar] [CrossRef]
- Dvouletý, O.; Lukeš, M. Review of Empirical Studies on Self-Employment out of Unemployment: Do Self-Employment Policies Make a Positive Impact? Int. Rev. Entrepreneurship 2016, 14, 361–376. [Google Scholar]
- Bosma, N.S.; Stam, F.C.; Terjesen, S.A. Advancing Public Policy for High-Growth, Female, and Social Entrepreneurs. Public Admin. Rev. 2016, 76, 230–239. [Google Scholar]
- Foreman-Peck, J. Effectiveness and efficiency of SME innovation policy. Small Bus. Econ. 2013, 41, 55–70. [Google Scholar] [CrossRef]
- Kim, Y.; Oh, I.; Lee, J.D. Economic Impact Assessment of Public–Private Matching Fund Programs Using Firm-Level Data. Singap. Econ. Rev. 2015, 60, 1550060. [Google Scholar] [CrossRef]
- Biagi, F.; Bondonio, D.; Martini, A. Counterfactual Impact Evaluation of Enterprise Support Programmes; Evidence from a Decade of Subsidies to Italian Firm; European Regional Science Association: Louvain-la-Neuve, Belgium, 2015. [Google Scholar]
- Antonioli, D.; Marzucchi, A.; Montresor, S. Regional innovation policy and innovative behaviour: Looking for additional effects. Eur. Plan. Stud. 2014, 22, 64–83. [Google Scholar] [CrossRef]
- Sternberg, R. Success factors of university-spin-offs: Regional government support programs versus regional environment. Technovation 2014, 34, 137–148. [Google Scholar] [CrossRef]
- Åstebro, T. The private financial gains to entrepreneurship: Is it a good use of public money to encourage individuals to become entrepreneurs? Small Bus. Econ. 2017, 48, 323–329. [Google Scholar] [CrossRef]
- Mason, C.; Brown, R. Creating good public policy to support high-growth firms. Small Bus. Econ. 2013, 40, 211–225. [Google Scholar] [CrossRef]
- Acs, Z.; Åstebro, T.; Audretsch, D.; Robinson, D.T. Public policy to promote entrepreneurship: A call to arms. Small Bus. Econ. 2016, 47, 35–51. [Google Scholar] [CrossRef] [Green Version]
- Cho, Y.; Honorati, M. Entrepreneurship programs around the developing world: A meta analysis. Labour Econ. 2014, 28, 110–130. [Google Scholar] [CrossRef]
- Nyikos, G. The Role of Financial Instruments in Improving Access to Finance. Eur. Struct. Invest. Funds J. 2015, 3, 105–121. [Google Scholar]
- Michie, R.; Wishlade, F. Between Scylla and Charybdis: Navigating Financial Engineering Instruments through Structural Fund and State Aid Requirements; IQ-Net Thematic Paper; University of Strathclyde: Glasgow, UK, 2012. [Google Scholar]
- Ughetto, E.; Scellato, G.; Cowling, M. Cost of capital and public loan guarantees to small firms. Small Bus. Econ. 2017, 49, 319–337. [Google Scholar] [CrossRef]
- Gaia, L.; Ielasi, F.; Rossolini, M. SMEs, public credit guarantees and mutual guarantee institutions. J. Small Bus. Enterp. Dev. 2016, 23, 1208–1228. [Google Scholar] [CrossRef]
- Buckland, R.; Davis, E.W. Finance for Growing Enterprises; Routledge: Abingdon, UK, 2016. [Google Scholar]
- Gozzi, J.C.; Schmukler, S. Public Credit Guarantees and Access to Finance. Eur. Econ. 2015, 27, 101–117. [Google Scholar]
- Tucker, J.; Lean, J. Small firm finance and public policy. J. Small Bus. Enterp. Dev. 2003, 10, 50–61. [Google Scholar] [CrossRef]
- Denis, D.J. Entrepreneurial finance: An overview of the issues and evidence. J. Corpor. Financ. 2004, 10, 301–326. [Google Scholar] [CrossRef]
- Cowling, M.; Ughetto, E.; Lee, N. The innovation debt penalty: Cost of debt, loan default, and the effects of a public loan guarantee on high-tech firms. Technol. Forecast. Soc. Chang. 2017, in press. [Google Scholar] [CrossRef]
- Cumming, D.J.; Grilli, L.; Murtinu, S. Governmental and independent venture capital investments in Europe: A firm-level performance analysis. J. Corpor. Financ. 2017, 42, 439–459. [Google Scholar] [CrossRef]
- Rahman, A.; Belas, J.; Kliestik, T.; Tyll, L. Collateral requirements for SME loans: Empirical evidence from the Visegrad countries. J. Bus. Econ. Manag. 2017, 18, 650–675. [Google Scholar] [CrossRef]
- Bondonio, D. Impact Identification Strategies for Evaluating Business Incentive Programs; POLIS Working Paper; POLIS: Jerusalem, Israel, 2009; Volume 129. [Google Scholar]
- Arping, S.; Lóránth, G.; Morrison, A.D. Public initiatives to support entrepreneurs: Credit guarantees versus co-funding. J. Financ. Stab. 2010, 6, 26–35. [Google Scholar] [CrossRef]
- Stiglitz, J.E.; Weiss, A. Credit rationing in markets with imperfect information. Am. Econ. Rev. 1981, 71, 393–410. [Google Scholar]
- Rai, A.; Klonner, S. Adverse Selection in Credit Markets: Evidence from a Policy Experiment; No. 2007-01; Department of Economics, Williams College: Williamstown, MA, USA, 2007. [Google Scholar]
- Parker, S.C.; Van Praag, C.M. Schooling, capital constraints, and entrepreneurial performance: The endogenous triangle. J. Bus. Econ. Stat. 2006, 24, 416–431. [Google Scholar] [CrossRef]
- Janda, K. Agency theory approach to the contracting between lender and borrower. Acta Oecon. Prag. 2006, 14, 32–45. [Google Scholar]
- Janda, K. The comparison of credit subsidies and guarantees in transition and post-transition economies. Ekonomický Časopis 2005, 53, 383–398. [Google Scholar]
- Chatzouz, M.; Gereben, Á.; Lang, F.; Torfs, W. Credit Guarantee Schemes for SME Lending in Western Europe; No. 2017/02; EIB Working Papers; EIB: Luxembourg, 2017. [Google Scholar]
- Wishlade, F.; Michie, R.; Familiari, G.; Schneiderwind, P.; Resch, A. Ex-Post Evaluation of Cohesion Policy Programs 2007-13, Focusing on the European Regional Development Fund (ERDF) and Cohesion Fund (CF): Work Package 3: Financial Instruments for Enterprise Support; Publications Office of the European Union: Luxembourg, 2016. [Google Scholar]
- Asdrubali, P.; Signore, S. The Economic Impact of EU Guarantees on Credit to SMEs Evidence from CESEE Countries; No. 002; Directorate General Economic and Financial Affairs (DG ECFIN), European Commission: Brussels, Belgium, 2015. [Google Scholar]
- Garcia-Tabuenca, A.; Crespo-Espert, J.L. Credit guarantees and SME efficiency. Small Bus. Econ. 2010, 35, 113–128. [Google Scholar] [CrossRef]
- Sauka, A.; Chepurenko, A. Entrepreneurship in Transition Economies: Diversity, Trends, and Perspectives; Springer: Berlin, Germany, 2017. [Google Scholar]
- Polok, D.; Michalski, P.; Szewczyk, D.; Keil, D.; Wieczore, S.; Kaciakova, P.; Incze, Z.; Rycerz, J.; Nisztuk, T.; Dvouletý, O.; et al. Future of the Visegrad Group. 2016. Available online: http://paga.org.pl/projekty/raport-future-of-the-visegrad-group/future-of-the-visegrad-group/report?lang=en (accessed on 17 October 2016).
- Dvouletý, O. Relationship between Unemployment and Entrepreneurship Dynamics in the Czech Regions: A Panel VAR Approach. Acta Univ. Agric. Silvic. Mendel. Brun. 2017, 65, 987–995. [Google Scholar] [CrossRef]
- Dvoulety, O. What is the Relationship between Entrepreneurship and Unemployment in Visegrad Countries? Cent. Eur. Bus. Rev. 2017, 6, 42–53. [Google Scholar] [CrossRef]
- Dvouletý, O.; Mareš, J. Determinants of regional entrepreneurial activity in the Czech Republic. Econ. Stud. Anal./Acta VSFS 2016, 10, 31–46. [Google Scholar]
- Dvouletý, O.; Mareš, J. Relationship between unemployment and entrepreneurial activity: Evidence found among Visegrad countries. In Proceedings of the Innovation Management, Entrepreneurship and Corporate Sustainability (IMECS 2016), Prague, Czech Republic, 26–27 May 2016; pp. 146–156. [Google Scholar]
- Karsai, J. Are CEE States Successful as Venture Capitalists? No. 1539; Institute of Economics, Centre for Economic and Regional Studies, Hungarian Academy of Sciences: Budapest, Hungary, 2015. [Google Scholar]
- Cieślik, J.; van Stel, A. Comparative analysis of recent trends in private sector development in CEE transition economies. Entrepreneurship Res. J. 2014, 4, 205–235. [Google Scholar] [CrossRef]
- Welter, F.; Smallbone, D. (Eds.) Handbook of Research on Entrepreneurship Policies in Central and Eastern Europe; Edward Elgar Publishing: Cheltenham, UK, 2011. [Google Scholar]
- Manolova, T.S.; Eunni, R.V.; Gyoshev, B.S. Institutional environments for entrepreneurship: Evidence from emerging economies in Eastern Europe. Entrepreneurship Theory Pract. 2008, 32, 203–218. [Google Scholar] [CrossRef]
- Klonowski, D. Venture capital as a method of financing enterprise development in Central and Eastern Europe. Int. J. Emerg. Mark. 2006, 1, 165–175. [Google Scholar] [CrossRef]
- Mateut, S. Subsidies, financial constraints and firm innovative activities in emerging economies. Small Bus. Econ. 2017, in press. [Google Scholar] [CrossRef]
- Čadil, J.; Mirošník, K.; Rehák, J. The lack of short-term impact of cohesion policy on the competitiveness of SMEs. Int. Small Bus. J. 2017, 35, 991–1009. [Google Scholar] [CrossRef]
- Stonkute, E.; Vveinhardt, J. Rural Development Policy Incentives encouraging Entrepreneurship in selected EU Countries. In Economic Science for Rural Development Conference Proceedings; No. 44; Latvijas Lauksaimniecības Universitātes Ekonomikas un Sabiedrības attīstības fakultāte: Jelgava, Latvia, 2017; pp. 197–204. [Google Scholar]
- Papadimitriou, D.; Baltag, D.; Surubaru, N.C. Assessing the Performance of the European Union in Central and Eastern Europe and in its Neighbourhood. East Eur. Polit. 2017, 33, 1–16. [Google Scholar] [CrossRef]
- Blažková, I. The Impact of the Public Support for R & D on the Economic Performance of SMEs. Acta Univ. Agric. Silvic. Mendel. Brun. 2016, 64, 213–222. [Google Scholar]
- Dvouletý, O.; Blažková, I. Are Publicly Supported Companies in the Czech Food and Drink Industry Performing Better? Initial Findings from the Microdata. In Proceedings of the Innovation Management, Entrepreneurship and Sustainability (IMES 2017), Prague, Czech Republic, 25–26 May 2017; pp. 168–179. [Google Scholar]
- Mirošník, K.; Čadil, J.; Čermáková, K. Small business and cohesion policy-statistical evidence from the Czech Republic. Int. J. Entrepreneurship Small Bus. 2016, 29, 398–415. [Google Scholar] [CrossRef]
- Krause, J. Evaluation of the Impact of Innovative Activites on Productivity–Example from the Czech Republic. Pol. J. Manag. Stud. 2016, 13, 101–109. [Google Scholar] [CrossRef]
- Srholec, M.; Žížalová, P. Mapping the Geography of R&D: What Can We Learn for Regional Innovation Policy in the Czech Republic and Beyond? Eur. Plan. Stud. 2014, 22, 1862–1878. [Google Scholar]
- Potluka, O.; Brůha, J.; Špaček, M.; Loun, J. The Impacts of Subsidies on Czech Firms. Statistika 2013, 50, 56–62. [Google Scholar]
- Hartsenko, J.; Sauga, A. The role of financial support in SME and economic development in Estonia. Bus. Econ. Horiz. 2013, 9, 10–22. [Google Scholar] [CrossRef]
- Kopečná, V. Counterfactual Impact Evaluation of the Project Internships for Young Job Seekers. Cent. Eur. J. Public Policy 2016, 10, 48–66. [Google Scholar] [CrossRef]
- Potluka, O.; Brůha, J.; Špaček, M.; Vrbová, L. Counterfactual Impact Evaluation on EU Cohesion Policy Interventions in Training in Companies. Ekonomický Časopis 2016, 64, 575–595. [Google Scholar]
- Dvouletý, O. Does the Self-employment Policy Reduce Unemployment and Increase Employment? Empirical Evidence from the Czech Regions. Cent. Eur. J. Public Policy 2017, 11. [Google Scholar] [CrossRef]
- Hora, O.; Suchanec, M. Zhodnocení Programů Aktivní Politiky Zaměstnanosti Realizovaných v České Republice v Období Krize; Česká politika zaměstnanosti v době krize a po krizi; MUNIpress/Albert: Brno, Czech Republic, 2014; pp. 143–182. [Google Scholar]
- Saxonberg, S.; Sirovátka, T.; Janoušková, M. When do policies become path dependent? The Czech example. J. Eur. Soc. Policy 2013, 23, 437–450. [Google Scholar] [CrossRef]
- European Commission. Operational Programme Entrepreneurship and Innovation. 2016. Available online: http://ec.europa.eu/regional_policy/en/atlas/programmes/2007-2013/czech-republic/operational-programme-enterprises-and-innovations (accessed on 5 August 2016).
- Ministry of Industry and Trade. Programme START. 2016. Available online: http://www.mpo-oppi.cz/start/ (accessed on 5 August 2016).
- Maggioni, V.; Sorrentino, M.; Williams, M. Mixed consequences of government aid for new venture creation: Evidence from Italy. J. Manag. Gov. 1999, 3, 287–305. [Google Scholar] [CrossRef]
- Honjo, Y.; Harada, N. SME policy, financial structure and firm growth: Evidence from Japan. Small Bus. Econ. 2006, 27, 289–300. [Google Scholar] [CrossRef]
- Kang, J.W.; Heshmati, A. Effect of credit guarantee policy on survival and performance of SMEs in Republic of Korea. Small Bus. Econ. 2008, 31, 445–462. [Google Scholar] [CrossRef]
- Zecchini, S.; Ventura, M. The impact of public guarantees on credit to SMEs. Small Bus. Econ. 2009, 32, 191–206. [Google Scholar] [CrossRef]
- Oh, I.; Lee, J.D.; Heshmati, A.; Choi, G.G. Evaluation of credit guarantee policy using propensity score matching. Small Bus. Econ. 2009, 33, 335–351. [Google Scholar] [CrossRef]
- Kösters, S. Subsidizing start-ups: Policy targeting and policy effectiveness. J. Ind. Compet. Trade 2010, 10, 199–225. [Google Scholar] [CrossRef]
- Gubert, F.; Roubaud, F. The Impact of Microfinance Loans on Small Informal Enterprises in Madagascar. A Panel Data Analysis; Social Protection Discussion Paper Series; No. 77931; World Bank: Washington, DC, USA, 2011. [Google Scholar]
- Cowling, M.; Siepel, J. Public intervention in UK small firm credit markets: Value-for-money or waste of scarce resources? Technovation 2013, 33, 265–275. [Google Scholar] [CrossRef]
- European Commission. European Regional Development Fund. 2016. Available online: http://ec.europa.eu/regional_policy/EN/funding/erdf/ (accessed on 5 August 2016).
- Czech-Moravian Guarantee and Development Bank. Czech-Moravian Guarantee and Development Bank. 2016. Available online: http://www.cmzrb.cz/?lang=2/ (accessed on 5 August 2016).
- Ministry of Industry and Trade. List of Supported Companies. 2016. Available online: http://www.mpo.cz/dokument141459.html (accessed on 5 August 2016).
- Eurostat. Nominal Exchange Rate CZK/EUR. 2016. Available online: http://ec.europa.eu/eurostat/data/database (accessed on 5 January 2017).
- Bondonio, D.; Greenbaum, R.T. Revitalizing regional economies through enterprise support policies: An impact evaluation of multiple instruments. Eur. Urban Reg. Stud. 2014, 29, 79–103. [Google Scholar] [CrossRef]
- Brealey, R.; Myers, S.; Allen, F. Principles of Corporate Finance, 12th ed.; McGraw-Hill Education: New York, NY, USA, 2017. [Google Scholar]
- Bisnode. Database Albertina—Gold Edition. 2016. Available online: http://www.albertina.cz/ (accessed on 5 August 2016).
- Hawawini, G.; Subramanian, V.; Verdin, P. Is performance driven by industry-or firm-specific factors? A new look at the evidence. Strateg. Manag. J. 2003, 24, 1–16. [Google Scholar] [CrossRef]
- Dehejia, R.H.; Wahba, S. Causal effects in nonexperimental studies: Reevaluating the evaluation of training programs. J. Am. Stat. Assoc. 1999, 94, 1053–1062. [Google Scholar] [CrossRef]
- Becker, S.O.; Ichino, A. Estimation of average treatment effects based on propensity scores. Stata J. 2002, 2, 358–377. [Google Scholar]
- Abadie, A.; Drukker, D.; Herr, J.L.; Imbens, G.W. Implementing matching estimators for average treatment effects in Stata. Stata J. 2004, 4, 290–311. [Google Scholar]
- Caliendo, M.; Kopeinig, S. Some practical guidance for the implementation of propensity score matching. J. Econ. Surv. 2008, 22, 31–72. [Google Scholar] [CrossRef]
- Angrist, J.D.; Pischke, J.S. Mostly Harmless Econometrics: An Empiricist’s Companion; Princeton University Press: Princeton, NJ, USA, 2008. [Google Scholar]
- Shane, S. Why encouraging more people to become entrepreneurs is bad public policy. Small Bus. Econ. 2009, 33, 141–149. [Google Scholar] [CrossRef]
- Henrekson, M.; Johansson, D. Gazelles as job creators: A survey and interpretation of the evidence. Small Bus. Econ. 2010, 35, 227–244. [Google Scholar] [CrossRef]
- Czemiel-Grzybowska, W. Barriers to financing small and medium business enterprises in Poland. Bus. Econ. Horiz. 2013, 9, 44–52. [Google Scholar] [CrossRef]
- Bruothová, M.; Hurný, F. Selected Characteristics of Business Environment in Visegrad Region. Cent. Eur. J. Manag. 2016, 3, 23–35. [Google Scholar] [CrossRef]
- Dvouletý, O.; Mareš, J. Entrepreneurial activity in the Czech regions: Are business companies and self-employed individuals affected by the same factors? In Proceedings of the 10th International Days of Statistics and Economics, Prague, Czech Republic, 8–10 September 2016; pp. 418–428. [Google Scholar]
- Radosevic, S. Upgrading technology in Central and Eastern European economies. IZA World Labor 2017, 338, 1–11. [Google Scholar]
- Ostapenko, N. Perceptions of government actions and entrepreneurship performance: An indirect effect of national culture/comparative analysis of Ukraine and Slovak Republic. J. Enterp. Community People Places Glob. Econ. 2012, 10, 363–396. [Google Scholar] [CrossRef]
- Bia, M.; Mattei, A. Assessing the effect of the amount of financial aids to Piedmont firms using the generalized propensity score. Stat. Methods Appl. 2012, 21, 485–516. [Google Scholar] [CrossRef]
- De Blasio, G.; De Mitri, S.; D’Ignazio, A.; Finaldi Russo, P.; Stoppani, L. Public Guarantees to SME Borrowing; A RDD Evaluation; Working Papers; Bank of Italy: Rome, Italy, 2016. [Google Scholar]
- Pellegrini, G.; Bernini, C.; Cerqua, A. Public subsidies, TFP and Efficiency: A Tale of Complex Relationships; ERSA Conference Papers; No. ERSA15p461; European Regional Science Association: Brussels, Belgium, 2015. [Google Scholar]
- Potluka, O.; Brůha, J. Zkušenosti s kontrafaktuální dopadovou evaluací v České republice. Evaluační Teorie a Praxe 2013, 1, 53–68. [Google Scholar]
- Jensen, M.C.; Meckling, W.H. Theory of the firm: Managerial behavior, agency costs and ownership structure. J. Financ. Econ. 1976, 3, 305–360. [Google Scholar] [CrossRef]
- Kaplan, S.N.; Strömberg, P. Financial contracting theory meets the real world: An empirical analysis of venture capital contracts. Rev. Econ. Stud. 2003, 70, 281–315. [Google Scholar] [CrossRef]
Figure 1.
Allocation of Resources from the Program START across the Czech NUTS 3 regions in CZK (Legend from the top: number of projects, name of the region, public support, total amount of resources). Source: [88].
Figure 1.
Allocation of Resources from the Program START across the Czech NUTS 3 regions in CZK (Legend from the top: number of projects, name of the region, public support, total amount of resources). Source: [88].

Table 1.
List of Variables.
| Variable | Definition |
|---|---|
| Treated | Dummy variable indicating, whether the particular firm participated in the program START (188 participating enterprises). |
| Net Profit | Outcome variable, calculated as an average of net profits of the firm during the years 2011–2014. |
| Return on Assets (ROA) | Outcome variable, calculated as an average percentage share of net profits of the firm and its assets during the years 2011–2014. |
| Return on Equity (ROE) | Outcome variable, calculated as an average percentage share of net profits of the firm and its own capital during the years 2011–2014. |
| Sales | Outcome variable, calculated as an average sales for own products and services during the years 2011–2014. |
| Assets Turnover | Outcome variable, calculated as an average ratio of sales/turnover and assets during the years 2011–2014. |
| Debt Ratio | Outcome variable, calculated as an average percentage share of liabilities of the firm and its assets during the years 2011–2014. |
| Year of Registration | Control variable, referring to a year when the company was officially established. |
| Company Size | Control variable, dividing firms into the four dummy categories, according to a number of employees reported: Micro (less than 10 employees), Small (10–49 employees), Medium (50–249 employees) and Large (more than 250 employees). |
| Sector | Control variable, dividing firms into the 21 NACE dummy categories according to their business activity. |
| Region | Control variable, dividing firms into the 14 NUTS3 dummy categories according to the Czech region, where they operate. |
Table 2.
Robust Logistic Regression Used for Calculation of the Propensity Score.
| Variable | Coefficient | Std. Error | P > z |
|---|---|---|---|
| Year of Registration | 0.18 *** | 0.01 | 0.00 |
| Region Praha | (omitted) | ||
| Region Jihomoravský | −1.03 *** | 0.39 | 0.01 |
| Region Jihočeský | 0.28 | 0.41 | 0.48 |
| Region Karlovarský | −0.25 | 0.69 | 0.71 |
| Region Královéhradecký | −0.18 | 0.41 | 0.66 |
| Region Liberecký | −0.30 | 0.59 | 0.71 |
| Region Moravskoslezský | −0.60 | 0.40 | 0.14 |
| Region Olomoucký | 0.09 | 0.44 | 0.84 |
| Region Pardubický | 0.74 * | 0.40 | 0.07 |
| Region Plzeňský | −0.34 | 0.49 | 0.49 |
| Region Středočeský | 0.24 | 0.41 | 0.56 |
| Region Vysočina | 0.15 | 0.48 | 0.75 |
| Region Zlínský | 0.53 | 0.41 | 0.20 |
| Region Ústecký | (omitted) | ||
| Micro | −2.34 *** | 0.24 | 0.00 |
| Small | −5.14 *** | 0.38 | 0.00 |
| Medium | (omitted) | ||
| Large | (omitted) | ||
| Administrative and Support Service Activities | −0.77 | 0.95 | 0.41 |
| Transportation and Storage | −0.66 | 0.76 | 0.39 |
| Information and Communication | 0.06 | 0.73 | 0.94 |
| Arts, Entertainment and Recreation | (omitted) | ||
| Other Service Activities | 1.81 *** | 0.58 | 0.00 |
| Financial and Insurance Activities | 0.57 | 0.97 | 0.56 |
| Professional, Scientific and Technical Activities | 1.53 *** | 0.59 | 0.01 |
| Construction | 0.95 * | 0.58 | 0.10 |
| Mining and Quarrying | (omitted) | ||
| Accommodation and Food Service Activities | 1.11 * | 0.60 | 0.07 |
| Wholesale and Retail Trade, Repair of Motor Vehicles | 1.37 *** | 0.53 | 0.01 |
| Public Administration and Defence | (omitted) | ||
| Education | −0.39 | 1.56 | 0.80 |
| Electricity, Gas, Steam and Air Conditioning Supply | 0.90 | 0.65 | 0.16 |
| Human Health and Social Work Activities | 1.58 *** | 0.63 | 0.01 |
| Agriculture, Forestry and Fishing | 0.81 | 0.69 | 0.24 |
| Manufacturing | 1.50 *** | 0.53 | 0.01 |
| Water Supply, Sewerage, Waste management | −0.52 | 0.84 | 0.53 |
| Real Estate Activities | (omitted) | ||
| Constant | −362.99 *** | 26.72 | 0.00 |
| Wald chi2(32) | 458.51 | Number of Obs. | 4715 |
| Prob > chi2 | 0.0000 | Pseudo R2 | 0.364 |
| L. P. Likelihood | −477.98 | ||
*** stat. significance of 1%, ** on 5%, * 10%., (omitted) refers to a reference category or to a category with no observations.
Table 3.
Average Outcomes over the Years 2011–2014 before the Matching Procedures.
| Outcome | Net Profit | Return on Assets | Return on Equity | |||
| Group | Control | Treated | Control | Treated | Control | Treated |
| N | 10,681 | 57 | 10,681 | 57 | 10,681 | 57 |
| mean | 6182.45 | −112.497 | 1.48 | −27.67 | 12.97 | −70.87 |
| min | −5,613,094 | −11,200 | −264.48 | −1624.55 | −398.90 | −3701.49 |
| max | 2,583,422 | 3008.75 | 256.67 | 33.56 | 387.37 | 499.41 |
| Outcome | Sales | Assets Turnover | Debt Ratio | |||
| Group | Control | Treated | Control | Treated | Control | Treated |
| N | 10,681 | 57 | 10,681 | 57 | 10,681 | 57 |
| mean | 124,803.8 | 3715.8 | 0.82 | 0.43 | 67.60 | 743.85 |
| min | −2577 | 0 | −0.05 | 0.00 | −290.04 | 3.72 |
| max | 6.15 × 10⁷ | 58,995.5 | 132.79 | 4.22 | 399.47 | 37,250.63 |
Table 4.
Estimated Average Treatment Effect on the Treated (ATET) over the Years 2011–2014.
| Outcome Variable | Matching | ATET | Std. Error | P > abs. Z | N |
|---|---|---|---|---|---|
| Net Profit | Nearest Neighbour (1) | −525.137 | 342.190 | 0.125 | 9238 |
| Net Profit | PSM | −665.338 | 510.174 | 0.192 | 4595 |
| Net Profit | Kernel | −466.281 | 330.221 | 0.136 | 4595 |
| Return on Assets | Nearest Neighbour (1) | −28.715 | 29.078 | 0.323 | 9238 |
| Return on Assets | PSM | −29.068 | 22.731 | 0.201 | 4595 |
| Return on Assets | Kernel | −20.666 | 36.692 | 0.573 | 4595 |
| Return on Equity | Nearest Neighbour (1) | −84.544 | 69.570 | 0.224 | 9238 |
| Return on Equity | PSM | −92.416 | 64.924 | 0.155 | 4595 |
| Return on Equity | Kernel | −87.592 | 71.600 | 0.221 | 4595 |
| Sales | Nearest Neighbour (1) | −7816.04 *** | 3168.15 | 0.014 | 9238 |
| Sales | PSM | −12,807.15 ** | 6021.29 | 0.033 | 4595 |
| Sales | Kernel | −16,402.37 *** | 4168.82 | 0.000 | 4595 |
| Log(Sales) | Nearest Neighbour (1) | −0.807 *** | 0.080 | 0.000 | 9213 |
| Log(Sales) | PSM | −0.883 *** | 0.602 | 0.001 | 4573 |
| Log(Sales) | Kernel | −0.982 ** | 0.427 | 0.022 | 4573 |
| Assets Turnover | Nearest Neighbour (1) | −0.770 *** | 0.277 | 0.005 | 9238 |
| Assets Turnover | PSM | −0.645 | 0.427 | 0.131 | 4595 |
| Assets Turnover | Kernel | −0.512 *** | 0.145 | 0.000 | 4595 |
| Debt Ratio | Nearest Neighbour (1) | 677.685 | 657.62 | 0.303 | 9238 |
| Debt Ratio | PSM | 675.783 | 717.82 | 0.346 | 4595 |
| Debt Ratio | Kernel | 709.764 | 689.15 | 0.303 | 4595 |
Note: *** stat. significance of 1%, ** on 5%, * 10%., besides NN matching, bootstrapped standard errors with 100 replications were used.
© 2017 by the author. Licensee MDPI, Basel, Switzerland. This article is an open access article distributed under the terms and conditions of the Creative Commons Attribution (CC BY) license (http://creativecommons.org/licenses/by/4.0/).
Share and Cite
MDPI and ACS Style
Dvouletý, O. Effects of Soft Loans and Credit Guarantees on Performance of Supported Firms: Evidence from the Czech Public Programme START. Sustainability 2017, 9, 2293. https://doi.org/10.3390/su9122293
AMA Style
Dvouletý O. Effects of Soft Loans and Credit Guarantees on Performance of Supported Firms: Evidence from the Czech Public Programme START. Sustainability. 2017; 9(12):2293. https://doi.org/10.3390/su9122293
Chicago/Turabian StyleDvouletý, Ondřej. 2017. "Effects of Soft Loans and Credit Guarantees on Performance of Supported Firms: Evidence from the Czech Public Programme START" Sustainability 9, no. 12: 2293. https://doi.org/10.3390/su9122293
Note that from the first issue of 2016, this journal uses article numbers instead of page numbers. See further details here.