Article

Analysis of the Potential Impacts on China’s Industrial Structure in Energy Consumption

School of Environment and Energy, Peking University Shenzhen Graduate School, Shenzhen 518055, China
*
Authors to whom correspondence should be addressed.
Sustainability 2017, 9(12), 2284; https://doi.org/10.3390/su9122284
Submission received: 13 November 2017 / Revised: 5 December 2017 / Accepted: 5 December 2017 / Published: 8 December 2017
(This article belongs to the Section Energy Sustainability)

Abstract

:
Industrial structure is one of the main factors that determine energy consumption. Based on China’s energy consumption in 2015 and the goals in 13th Five-Year Plan for Economic and Social Development of the People’s Republic of China (The 13th Five-Year Plan), this paper established an input–output fuzzy multi-objective optimization model to estimate the potential impacts of China’s industrial structure on energy consumption in 2015. Results showed that adjustments to industrial structure could save energy by 19% (1129.17 million ton standard coal equivalent (Mtce)). Second, China’s equipment manufacturing industry has a large potential to save energy. Third, the development of several high energy intensive and high carbon intensive sectors needs to be strictly controlled, including Sector 25 (electricity, heat production, and supply industry), Sector 11 (manufacture of paper and stationery, printing), and Sector 14 (non-metallic mineral products industry). Fourth, the territory industry in China has a great potential for energy saving, while its internal structure still needs to be upgraded. Finally, we provide policy suggestions that may be adopted to reduce energy consumption by adjusting China’s industrial structure.

1. Introduction

As the country with the largest amount of greenhouse gas emissions, China is facing enormous pressure to reduce the consumption of fossil energy. In 2014, China proposed decreasing energy intensity in 2020 to 15% of the 2015 level. Therefore, it is very important to study the issue of energy conservation.
Industrial structure is an important factor affecting energy consumption. Many researchers have studied the impact of industrial structure change in energy consumption. Fernández González [1] used the Logarithmic Mean Divisia Index method to analyze the factors behind the change in aggregate energy consumption in 27 European member states. These results showed that Mediterranean countries, especially former communist states, increased their energy consumption, most of them favored by structural change. Hammond and Norman [2] employed the activity refactorization (AR) approach to track efficiency improvements through the intensity effect, and to separate the effect on energy demand from such improvements from changes in activity and structure in the industrial sector. Results also showed that changes in the industrial sector could reduce the annual growth rates in energy demand. Llop [3] used the demand-driven input–output model and proposed a simple method to decompose the changes in energy gross output into different determinants. The results showed a positive contribution of technology to increasing energy output, while the contribution of the final demand for energy was negative. Likewise, many scholars are concerned about such impacts in China. Wang et al. [4] used energy decomposition analysis to estimate the total industrial energy consumption and energy-related carbon emissions in Tianjin from 2003–2012. The results showed that energy-saving efforts and the optimization of the industrial structure increased energy efficiency. Xiao et al. [5] used the Computable General Equilibrium model to analyze the background and overall situations of energy consumption and CO2 emissions in China. The results showed that the decline of a secondary industry could cause an emission reduction effect, but was at the expense of the gross domestic product whereas the development of a tertiary industry could boost the economy and help save energy.
Thus, adjusting the industrial structure is of great significance when realizing energy saving.
Industrial structure adjustment is an optimization problem where the proportions of various types of industry are adjusted to satisfy one or more goals [6]. In this paper, the goal was to achieve energy saving and economic development.
Many researchers have studied structural upgrading. Based on data from the European Union, Janger et al. [7] developed a unique conceptual framework for measuring innovative outcomes that distinguished structural change and structural upgrading as two key dimensions in both manufacturing and services. They found that the results for the modified indicator differed substantially for a number of countries, with potentially wide-ranging consequences for innovation and industrial policies. Sadhukhan and Smith [8] presented a novel methodology for the flexible design of industrial systems based on their detailed differential value analysis. Yun et al. [9] evaluated the micro- and macro-economic effects with the hybrid mixed complementary approach they designed to take account of these unique features of the Korean electricity industry. Results showed that the micro- and macro-economic indices were negatively impacted, especially in cases where the share of nuclear power was lower than that of the basis case. For saving energy in China, many scholars have studied the optimizing of China’s industrial structure. Mao et al. [10] calculated the 2007 industrial influence coefficients (IIC) and the industrial carbon emission coefficients (ICEC) of all industries in China. Scenario analyses showed that the industrial structure adjustment based on the calculations of IIC and ICEC was better than the one based on the Chinese Industrial Restructuring Catalog. Using provincial panel data from the period 1995–2009 to analyze the relationship between the industrial structural transformation and carbon dioxide emissions in China, Zhou et al. [11] found that the first-order lag of industrial structural adjustment effectively reduced emissions. Wu and Xu [12] provided a system dynamics and fuzzy multi-objective programming integrated approach for the prediction of energy consumption at a regional level in China, which revealed that the energy consumption increased dramatically with rapid economic growth.
However, most of the research did not take into account the relationships between the industry sectors. From a policy perspective, information on sectoral relations and dependence helps us to better understand the structure of an economy and how it changes over time, which in turn is important in formulating industrial policies [13]. Obviously, it is necessary to consider inter-departmental relationships when optimizing the industrial structure to achieve energy conservation.
The input–output model (I–O model) [14] has been employed in this task and the main purpose of the I–O model is to establish an I–O table and a system of linear equations. An I–O table shows the interactions between the economic sectors and therefore their interdependence. Li et al. [15] developed an integrated evaluation model based on Input–Output Analysis and Social Network Analysis to quantify the evolutionary trends of industrial structure, demonstrate the inter-relationship between different sectors, and investigate the industrial structure-related carbon emissions. Results showed that industrial structure was gradually improved in China and various connections were established between different sectors. Borghi and Alexandre [16] used the I–O model to address the Brazilian productive structure and the major economic policies undertaken in the face of the international economic crisis. Results showed that industrial sectors had stronger linkages in terms of production and employment maintenance in the economy, but have been losing ground in the productive structure. Mi et al. [6] used an optimization model based on the I–O model to assess the potential impacts of industrial structure on energy consumption in Beijing. Results showed that industrial structure adjustment could save energy by 39.42% in Beijing in 2020 and it was possible to decrease energy intensity (energy consumption per unit GDP) through reasonable industrial structure adjustment without negatively affecting economic growth.
Most importantly, in industrial structure optimization models, many system parameters and their interrelationships may appear uncertain. Moreover, when the model consists of more than one policy objective, the optimum solution usually does not exist. The uncertainty can be further multiplied by the complexity of the system components and their relevance to economic implications if they violate the goal of policies. Therefore, with the above uncertainties and complexities, more advanced methods need to be adopted to effectively manage the industrial system. The multi-objective fuzzy optimization model has the advantages of tackling the above problems [17], and has been widely used in helping plan energy systems under uncertainty. Rong and Lahdelma [18] proposed a fuzzy chance constrained linear programming model for optimizing the scrap charge in European steel production. Zhou and Chen [17] developed an inexact fuzzy multi-objective programming model and applied it to a real case of planning the industrial structure of the South Four Lake watershed in Shandong Province, China. However, there is no current research focusing on the whole industrial structure adjustment of China based on energy consumption, which is a research gap that needs to be filled.
Against this background, according to the goals set by the Chinese government [19], this paper used a fuzzy multi-objective optimization model based on the input–output model to assess the potential impacts of industrial structure on energy consumption in China in 2020. The rest of the paper is organized as follows: Section 2 introduces the methodology and presents the data; Section 3 shows the results; while Section 4 provides some concluding remarks.

2. Materials and Methods

2.1. Methods

The adjusted industrial structure of China in 2020 (the target year) was obtained by a fuzzy optimizing model based on an input–output model. The initial industrial structure in 2015 (the initial year) was chosen as the baseline. The potential impacts of industrial structure were assessed by comparisons between the adjusted industrial structure and initial structure.
First, a multi-objective model for industrial structure optimization was established as follows:
  • Objective 1: Economic objective
  • Objective 2: Energy consumption objective
Subject to:
  • Constraint 1: Economic constraints
  • Constraint 2: Energy consumption constraints
  • Constraint 3: Input–output model constraints
  • Constraint 4: Structure adjustment constraints
Maximizing the whole industrial system’s economic benefit was chosen as the economic objective, and minimizing the total energy consumption was chosen as the energy consumption objective. The restriction of the total energy consumption set by policy makers in China was chosen as the constraints of the model. Thus, by using the added value of each sector as a decision variable, a mathematical multi-objective model for industrial structure optimization was formulated.

2.1.1. Objectives of the Optimization Model

Objective 1: Maximization of Gross Domestic Product
Max   G = i = 1 n v i 1 ,
Objective 2: Minimization of energy consumption
Min   E = i = 1 n e i t v i t ,
where G is the GDP; v i is the added value of sector i; n is the number of sectors; E is the total energy consumption; and e i is the sectoral energy intensity (energy consumption per unit added value) of sector i. The subscripts 0 and t represent the initial year and the target year, respectively. e i t is predicted by the goal of the energy intensity set in The 12th Five-Year Plan [19].

2.1.2. Constraints of the Optimization Model

The establishment of the optimization model requires reasonable constraints. Based on The 13th Five-Year Plan and China’s economic historical data, the constraints were developed as follows:
Constraint 1: Economic constraints
G = i = 1 n v i ,
G = i = 1 n v i ,
Constraint 2: Energy consumption constraints
E = i = 1 n e i v i ,
E t ( 1 + μ ) m E 0 ,
where m is the number of years between the initial year and the target year; and α is the lowest average annual growth rate of GDP. μ is the lowest annual growth rate of energy consumption and is an exogenous parameter.
Constraint 3: Input–output model constraints:
( I A 0 ) ( I A C 0 ) 1 V t Y t ,
The I–O model is used to establish an I–O table and a system of linear equations. In an I–O model, the total output of each sector is:
X A X = Y ,
where (suppose there are n sectors in the economy) X is the total output vector with n dimensions whose element xij is the output of sector j; Y is the final demand vector with n dimensions whose element y i is the final demand of sector j; A is the direct requirement matrix with n × n dimensions whose element denotes the direct requirement of sector i for per unit output of sector j; and aij is obtained through
aij = xij/xj (i, j = 1, 2, …, n),
where xij is the monetary value from sector i to sector j.
Y is obtained though
Y t = ( 1 + π ) m Y 0 ,
where π is the annual growth rate of final demand.
The added value of each sector is:
( I A C ) X = V ,
V is the added value vector in the target year with n dimensions whose element vj is the added value of sector j; and I is the n × n dimension identity matrix. A C is obtained through
A C = ( i = 1 n a i 1 0 0 i = 1 n a i n ) ,
According to Equations (8)–(12), to satisfy the final demand in 2020, we have the input–output model constraints (Equation (7)).
Constraint 4: Structure adjustment constraints
( 1 + ω 1 ) V 0 V t ( 1 + ω 2 ) V 0 ,
Considering that the industrial structure cannot be adjusted freely within a period of time, the lower and upper limits of the proportions of sectoral added value are constrained in the model according to historical data. ω 1 and ω 2 are the exogenous parameters.

2.1.3. Objectives and Constraints of the Fuzzy Optimization Model

Obviously, the above-described model can effectively address issues of industrial structure with environmental constraints.
However, in many real-world problems, uncertainties expressed as fuzzy sets may exist in many system components, and their interactions affect the related decision processes, which have placed industrial structure management problems beyond the above method. Therefore, fuzzy linear model was introduced into the above framework [17]. In this paper, we used a fuzzy multi-objective model for industrial structure optimization. The above model (Equations (1)–(7) and (13)) can be transformed [20] as follows:
Max   λ ,
Subject to:
i = 1 n v i t G + λ ( G + G ) ,
i = 1 n e i t v i t E + λ ( E + E ) ,
i = 1 n v i t ( 1 + α ) t i = 1 n v i 0 ,
i = 1 n e i t v i t ( 1 + μ ) m i = 1 n e i 0 v i 0 ,
( I A 0 ) ( I A C 0 ) 1 V t Y t ,
( 1 + ω 1 ) V 0 V t ( 1 + ω 2 ) V 0 ,
0 λ 1 ,
The λ represents the possibility of satisfying the objectives and constraints under the given system conditions; and superscripts ‘−’ and ‘+’ represent the lower and upper bounds of the interval parameters, respectively. By solving the above model, solutions for optimized industrial added values can be obtained.

2.2. Materials

2.2.1. Energy Consumption Data

As shown in Table S1, the energy consumption data were derived from the China Energy statistical yearbook 2016 [21].

2.2.2. Noncompetitive Import-Oriented Input–Output Table

In this study, the direct requirement matrix of China’s input–output table in 2015 (Table S2) were predicted based on the previous table from 2012 [22] with the Bi-proportional Scaling Method [23], and were revised in the following ways:
First, the competitive input–output tables were adjusted to a non-competitive import-oriented input–output table. The tables created by the National Bureau of Statistics of the People’s Republic of China are competitive input–output tables whose intermediate use and end-use products contain both domestic and imported products. Imported products are produced in countries outside China, as is the case for their energy consumption. In this study, we were only concerned about the energy consumption inside China. Thus, this study assumed that each economic sector and final demand category used imports in the same proportions; therefore, imported goods from the direct requirements table and from components of the GDP of each sector from the input–output table of each year were removed [24].
Second, the national economic subsectors were combined. To make the classification of input–output tables consistent with the energy consumption data according to the Classification and Code Standard of National Economy Industry [25], the national economic subsectors were combined into 34 sectors as shown in Table 1. For convenience, we used the numbers in Table 1 to refer to the sectors.

2.2.3. Exogenous Parameters in the Model

When setting the exogenous parameters, we referenced the Chinese government plans including the work plan for energy conservation during the 13th Five-Year Plan period. Table 2 shows the settings of all the exogenous parameters in the model.

3. Results

Based on the optimization model, the adjusted industrial structure of China in 2020 was obtained. In addition, the initial industrial structure in 2015 was chosen as the baseline as usual (BAU). In the BAU scenario, it was supposed that the annual growth rate of GDP was 6.5%, which was the lowest goal set by the Chinese government in The 13th Five-Year Plan. Figure 1 shows the total amount of GDP and energy consumption by 2020 in China from the optimization model results and BAU, separately. Figure 2 shows the difference in the added value and energy consumption in 2020 in China for each sector between the adjusted industrial structure and BAU, separately.
In our results showed that λ = 0.9, which meant that it was very possible to adjust industrial structure to the results.

3.1. Effects of Industrial Structure Optimization

Figure 1 shows that the energy consumption declined through industrial structure adjustment. Compared to the BAU, the energy consumption of the adjusted industrial structure was smaller. In the adjusted industrial structure, the annual growth rate of GDP was 7%, which was greater than 6.5% in BAU. Energy consumption was 4932.76 million ton standard coal equivalent (Mtce). Using the initial industrial structure, China will consume 6061.93 Mtce; however, industrial structure adjustment can save energy by 19% (1129.17 Mtce). This means that structure adjustment can save energy without negatively affecting economic growth. Such results are consistent with the results of a study in Beijing [6]. Although the energy consumption optimization result was different to the study by Xiong et al. [26], it should be noted that the prediction in [26] as based on data from 1995–2012. Moreover, according to the data in the 2016 China Energy Statistical Yearbook [21], the predicted data of such a study has a three-year-delay, which makes the results of this paper reasonable.

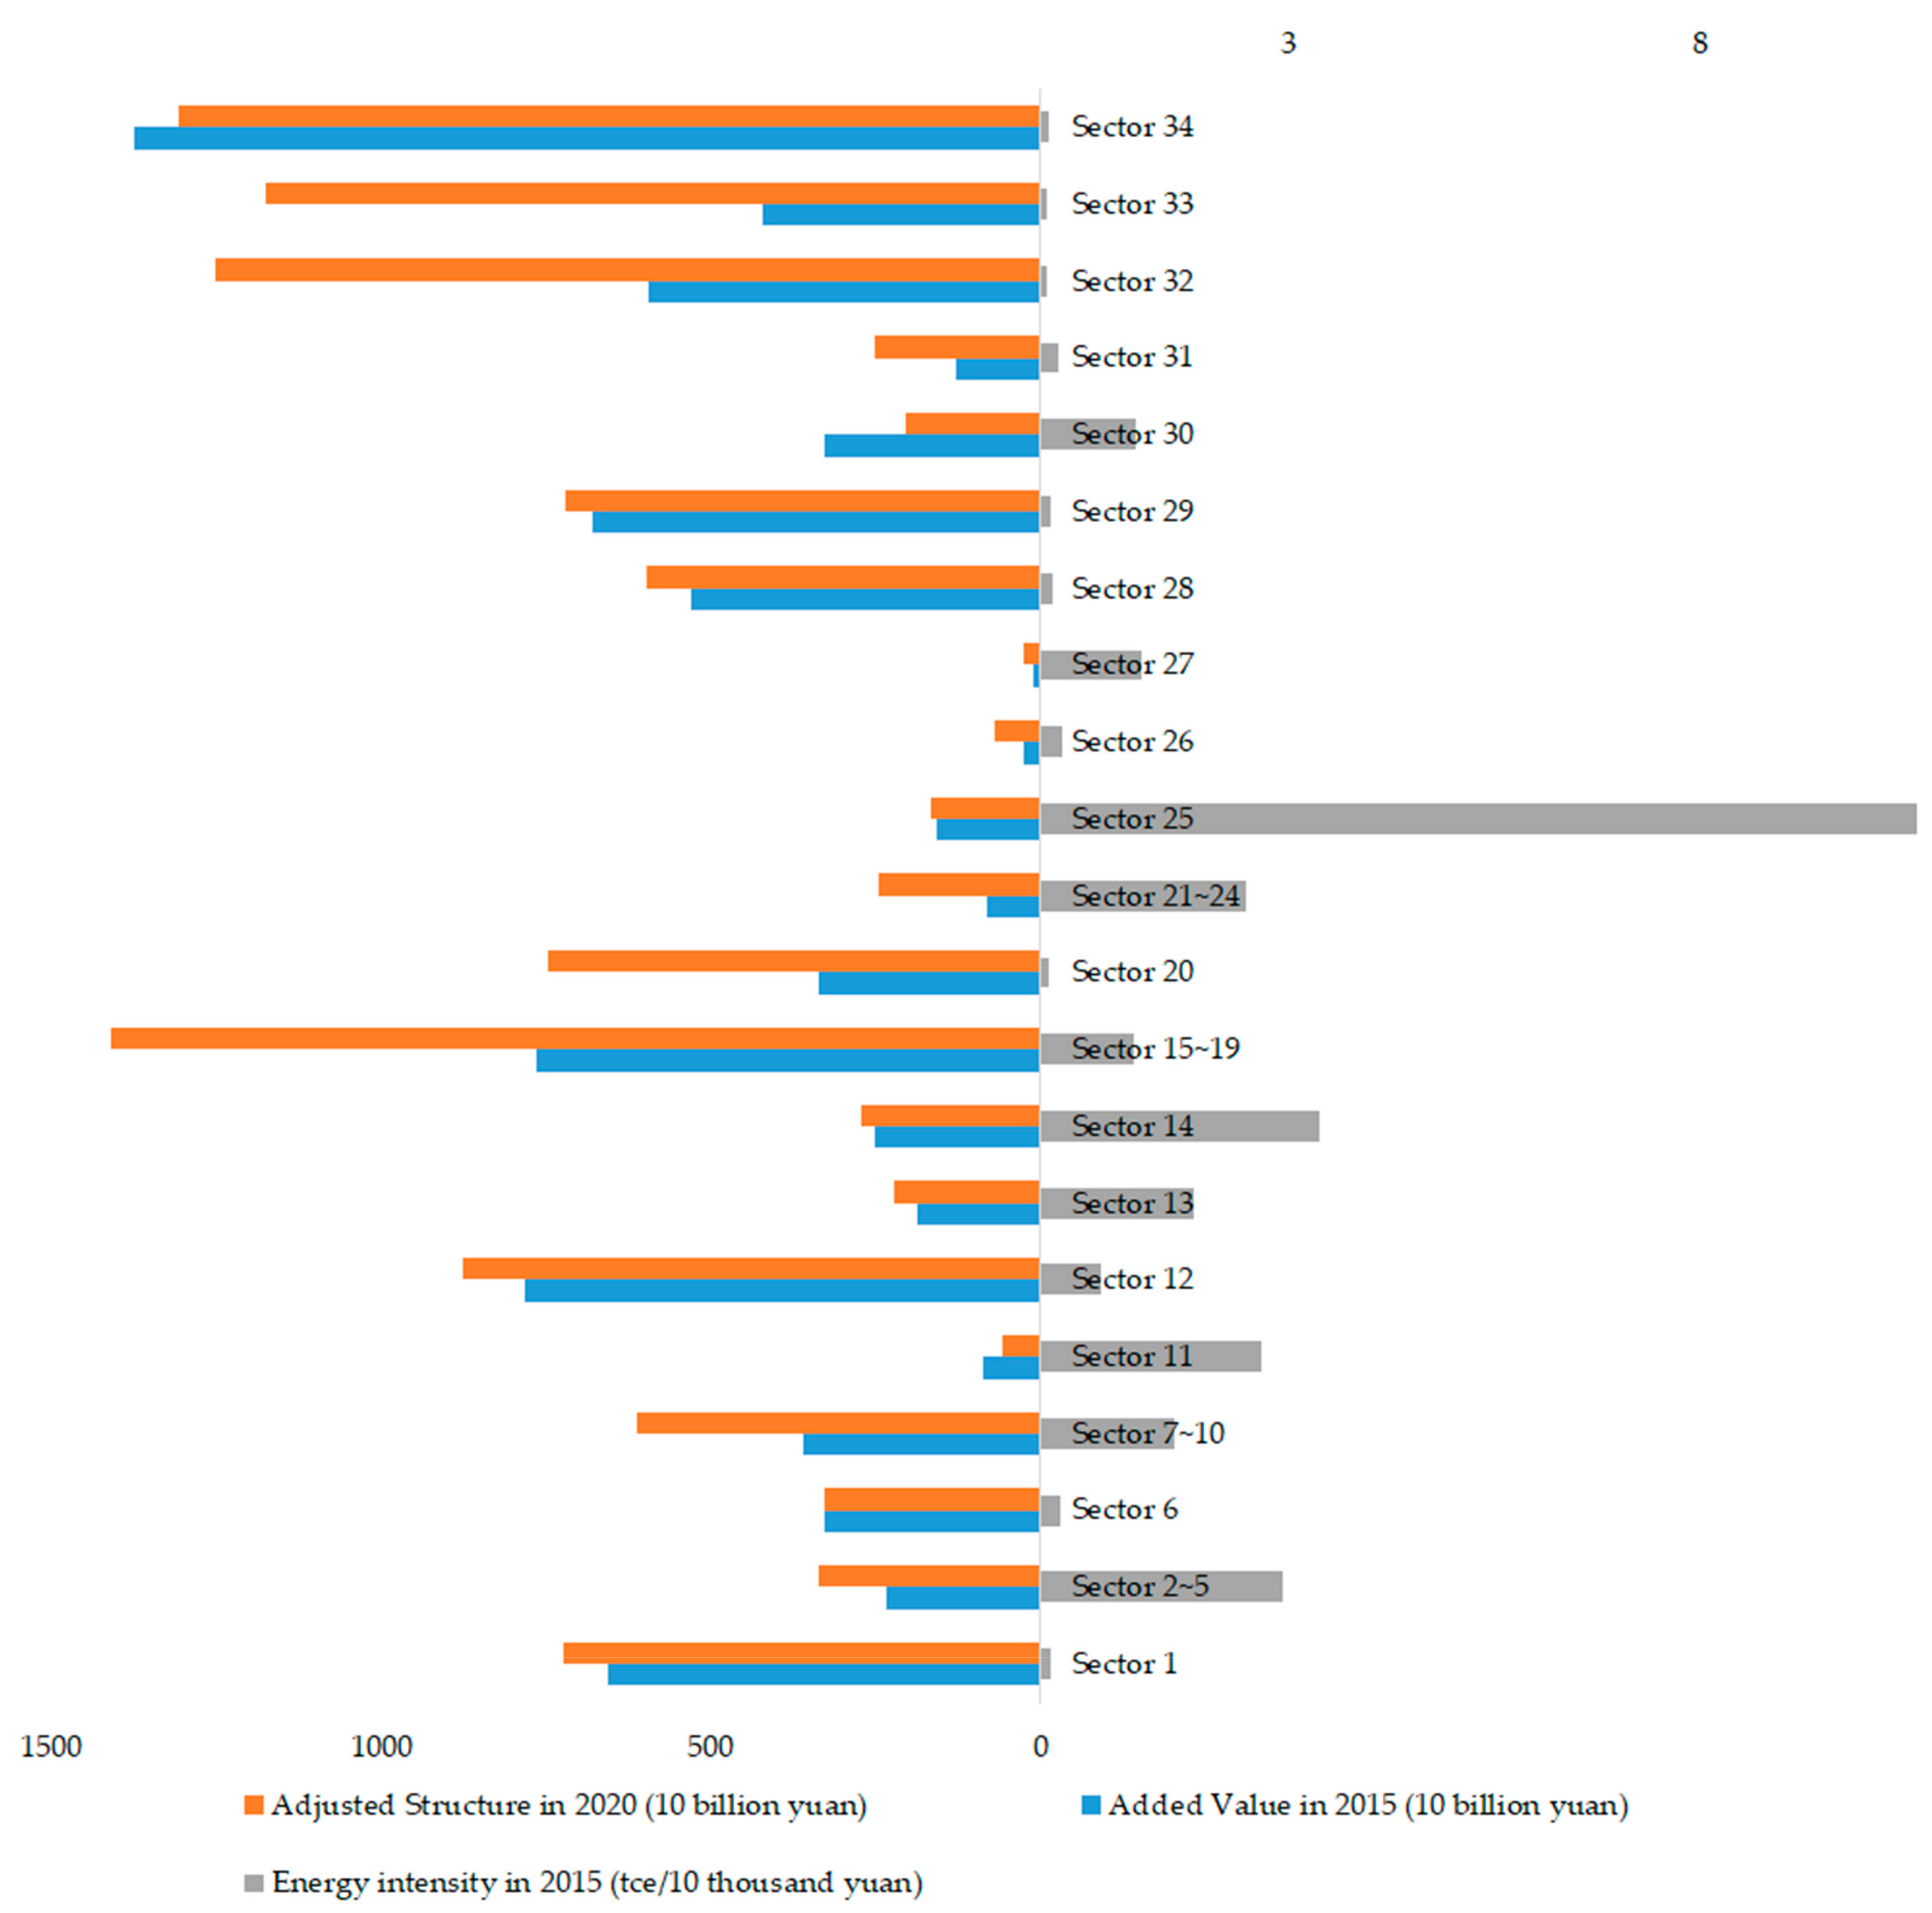
3.2. Analysis of Optimizing Results in Sectoral Level

Figure 2 shows the sectoral added value of BAU in 2015 and the adjusted industrial structure in 2020. The sectoral energy intensity in 2015 is also shown in Figure 2. It can be seen that the added value of Sectors 17–20, 32 and 33 increased significantly in 2020.
Sectors 17–20 developed rapidly as these four sectors are classified as equipment manufacturing industries, which are the priority of The 13th Five-Year Plan. It can be seen that all four sectors had a low energy intensity. In 2020, after adjusting the industry structure, Sector 20 (electronic, computers and telecommunication equipment) was the fastest growing sector in the manufacturing industry. The growth amount of its added value accounted for 13% in total increased added value and only caused 1.20% (59.25 Mtce) of total energy consumption. Sectors 17 (general and special equipment manufacturing), 18 (transportation equipment manufacturing), and 19 (electric equipment and machinery manufacturing) also accounted for 2.19%, 3.52%, and 2.78%, respectively, of the total added value, but only accounted for 0.72%, 1.24% and 0.93% of total energy consumption, respectively. Thus, Sectors 17–20 have high potential impact on energy conservation.
Sectors 17–20 are sub-sectors of the machinery industry [27]. Machinery production can play a crucial role in economic development and energy consumption in the process of industrialization and urbanization. The results of Sectors 17–20 were consistent with the results presented by Lin and Liu [27], whose study showed that there was a substitution relationship between energy and capital as well as labor in China’s machinery industry. This is a clear indication that allocating more capital or labor to China’s machinery industry instead of energy will be vital in the energy consumption mitigation effort.
The increase of added value in Sector 32 (finance and insurance) accounted for 20% of the total increase added value. Sector 33 (real estate trade) had the largest increase of added value with 7528.11 billion yuan, which accounted for 28% of the total increase added value. Both of these sectors have a low energy intensity and are classified as tertiary industries. These results were consistent with the study of Lin and Zhang [28]. However, there is room for energy efficiency improvement in the Chinese service sector. Improving the proportion of modern service industries with low energy consumption such as information transmissions, computer services, information services, and the software industry can increase the overall energy efficiency of the service industry.
On the other hand, sectors which are high energy intensive are slow to develop. The energy intensity of Sector 25 (electricity, heat production, and supply industry) was the largest of all the sectors. The annual GDP growth rate of Sector 25 was only 1.13%, and was consistent with Zhang et al. [29]. From 2015 to 2016, the growth rate of added value in China’s electricity sector has decreased, while the GDP of the whole country has not. Considering that reliance on coal in China’s energy consumption will not be eliminated in the short-term, such changes are helpful for energy saving. Meanwhile, the average energy intensity of the tertiary industry is less than that of the secondary industry in China, and changes in the electricity sector also show that tertiary industries may play a guiding and supporting role in the structure of industries. Sectors 11 (manufacture of paper and stationery; printing) and 14 (non-metallic mineral products industry) remained low, which indicated that these two sectors have a few potentials in energy conservation. Such results were consistent with Huang et al. [30], and Zhang and Chen [31], whose studies showed that the main driving force in the energy consumption of these two sectors were their scale of production. Such findings indicated that policy-makers should decrease high energy consumption productions in these two sectors and eliminate excess capacity as soon as possible.

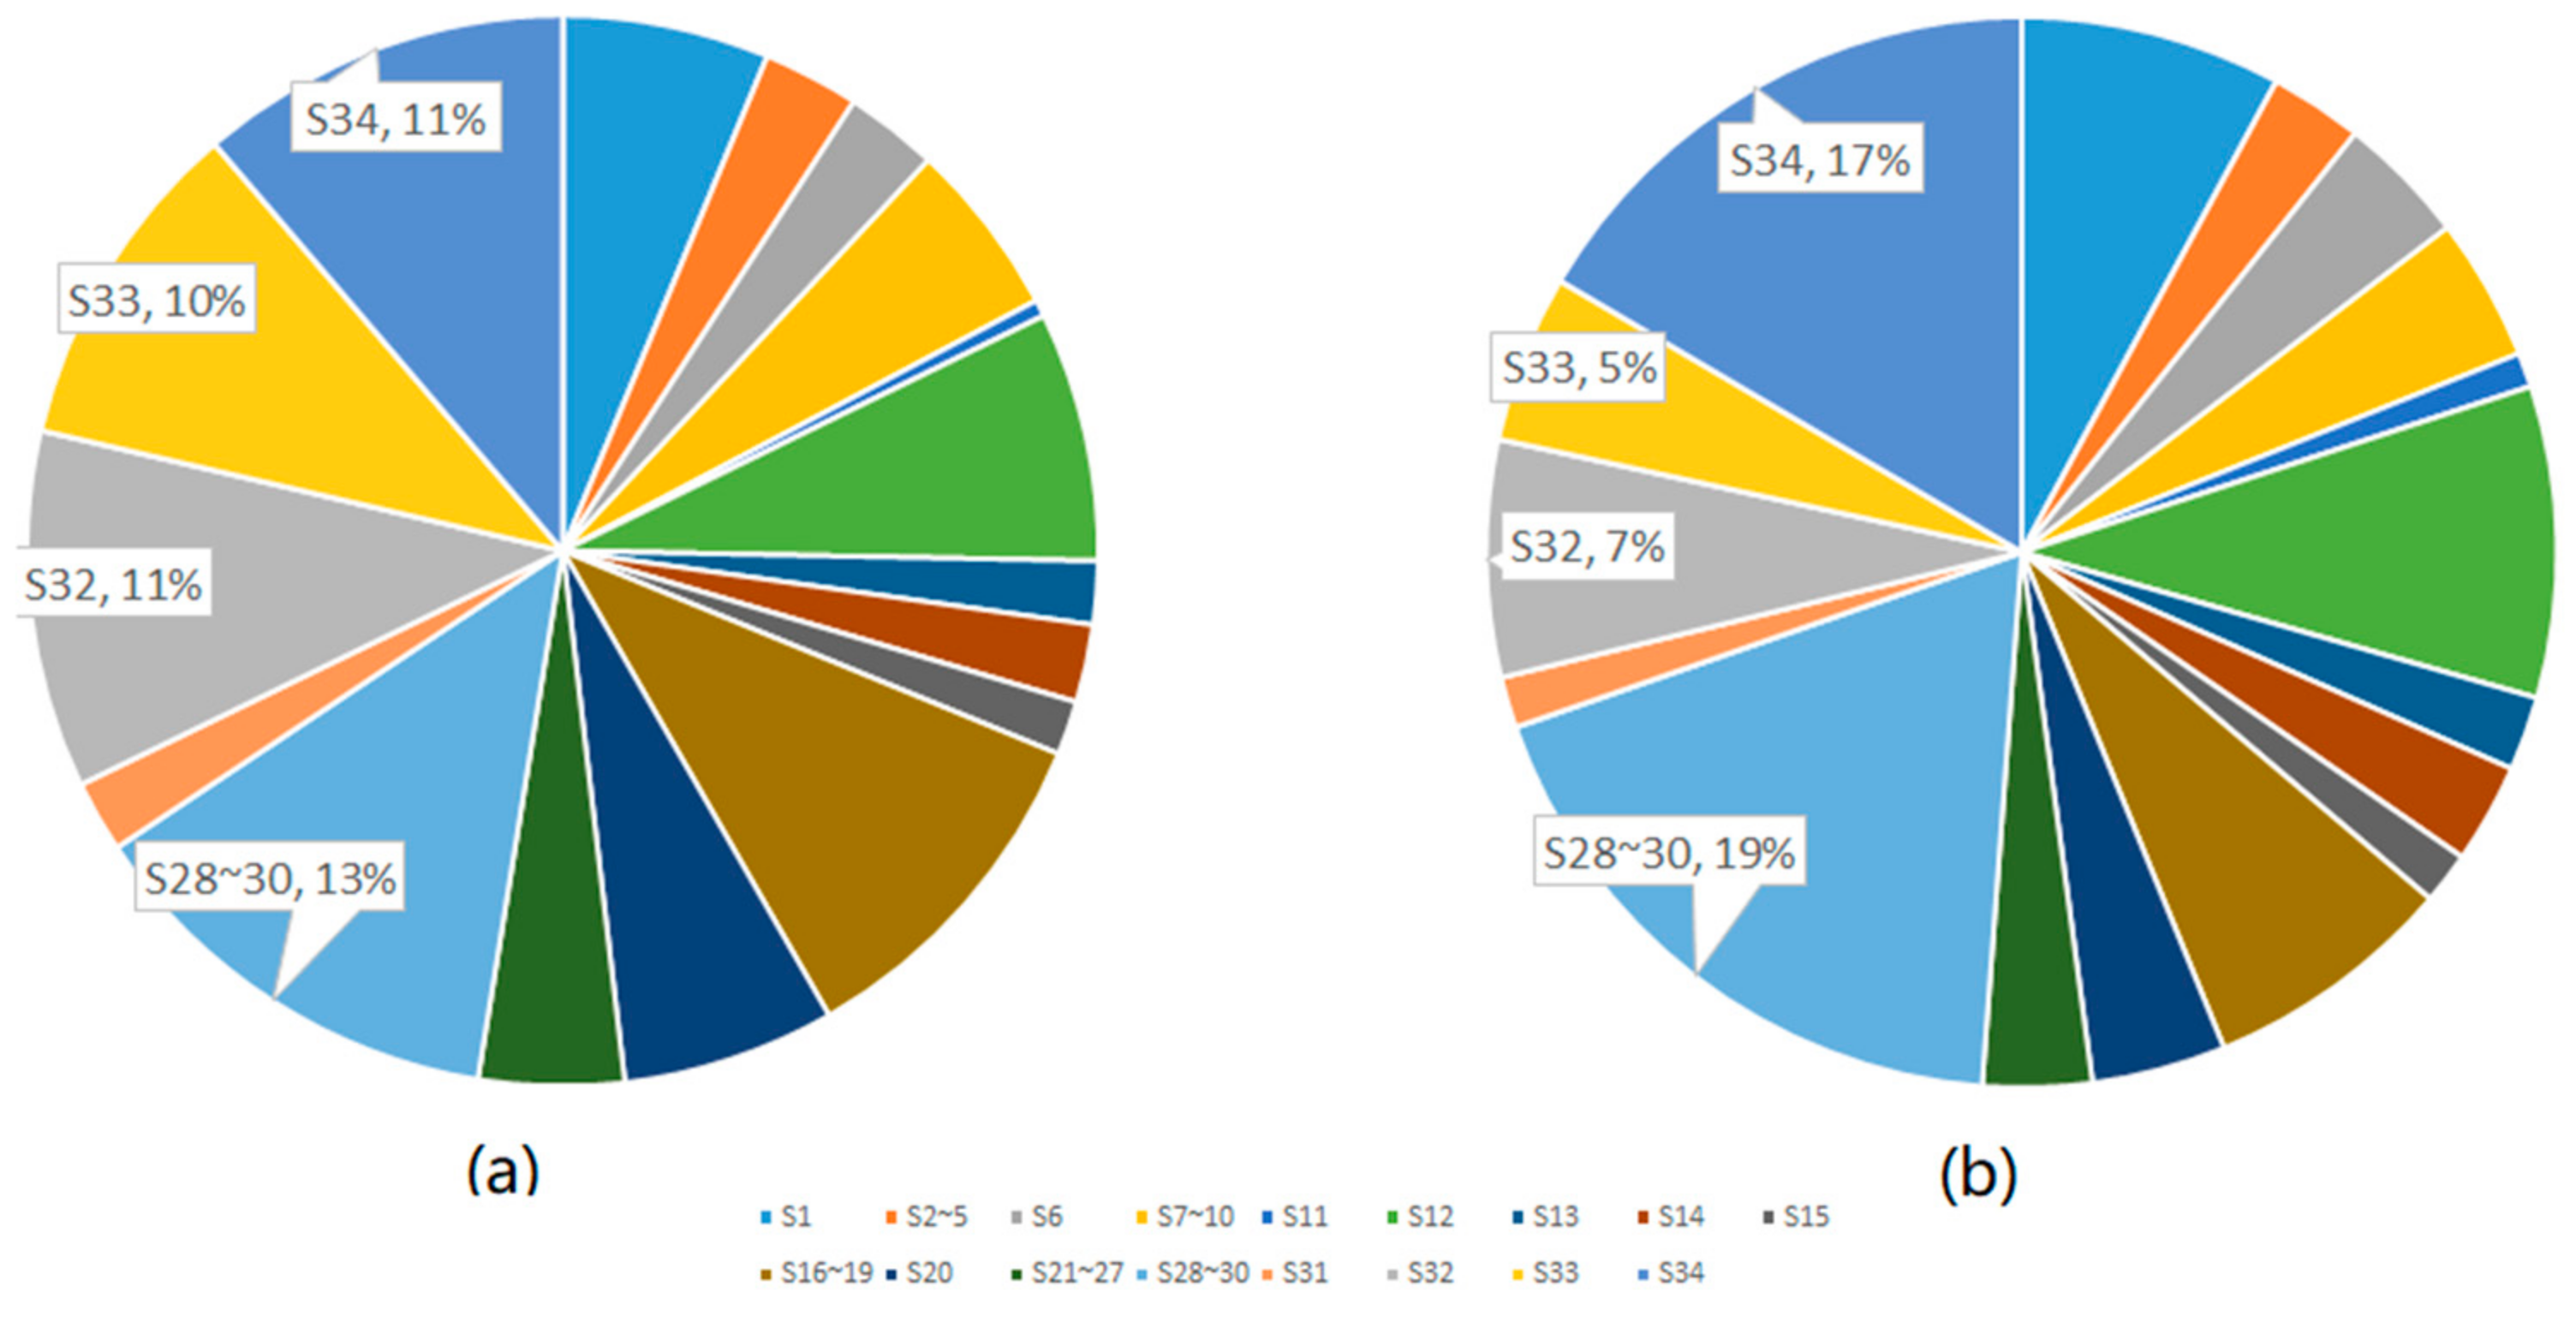
3.3. Analysis of Adjusted Structure of Tertiary Industry

Figure 3 shows that the proportion of tertiary industry changed the most. It increased from 48.82% in 2015 to 66.88% in 2020. More specifically, although the energy intensity of the tertiary industry remained low, the optimization results showed that the internal structure of the tertiary industry also needed to be changed. According to the sectoral classification standards, Sectors 27–34 are termed as tertiary industries. When comparing Figure 3a with Figure 3b, it can be seen that the proportion of added value of Sector 32 rose from 7% to 11% and that of Sector 33 increased from 5% to 10%. On the other hand, the proportion of added value of Sectors 28–30 dropped from 19% to 13%, while that of Sector 34 decreased from 17% to 11%.
After optimization, an increase in the proportion of Sector 32 will be of great benefit to Chinese urban residents [32], which will also have a significant positive effect on the assessment of rural citizens towards government performance [33]. On the other hand, the proportion of Department 33 increased, which was consistent with its current trend shown in [34]. This means that the government can continue to develop the real estate industry to achieve a win-win economic goals and energy saving targets. More relevant discussions regarding Sectors 32 and 33 have already been addressed in Section 3.2.
At the same time, the optimization results showed that the added value of Sectors 28–30 and 34 did not change much, while their proportion of added value was reduced among the all industrial sectors. The results of such optimization may be due to the fact that the output of these sectors is very large (21% and 19%, respectively in 2015), causing them to consume much energy. Such facts indicate that though some sectors have low energy intensity, the government should not let it grow freely due to its potential impacts on energy consumption [35].

4. Discussion

A fuzzy multi-objective optimization model was developed based on the input–output model to assess the potential impacts of industrial structure on energy consumption in China. According to the results, several conclusions can be drawn:
First, industrial structure adjustment has great potential in energy conservation. When the average annual growth rate of GDP is 7% from 2015–2020, industrial structure adjustment can save energy by 19% (1129.17 Mtce). Such GDP growth rate is consistent with the growth rate of GDP required during the period of the “new normal economy” in China. This fact indicates that while attention should be paid to the research and development of energy saving technologies or other factors affecting energy consumption, the Chinese government should also focus on upgrading the industrial structure towards a low energy-consumption structure for its great potential in energy conservation and the low sacrifice of growth rate in GDP.
Second, developing an equipment manufacturing industry can save energy and may grant the stable and fast development as the economy. To be specific, increasing the proportion of Sectors 17 (general and special equipment manufacturing), 18 (transportation equipment manufacturing), and 19 (electric equipment and machinery manufacturing) is an effective way to save energy. Currently, developing these sectors are the priority of the Chinese government [36], which means that energy consumption may be further reduced in the future and China’s current policy may also shift the industrial structure toward low energy consumption.
Third, the development of several high energy intensive sectors should be strictly controlled such as Sectors 25 (electricity, heat production and supply industry), 11 (manufacture of paper and stationery, printing), and 14 (non-metallic mineral products industry). The rising of the production scale of such sectors has caused a great growth in their energy consumption.
Finally, the structure of tertiary industry also needs to change. While the priority of development sectors has been Sectors 32 and 33, the development of Sectors 28–30 has to slow down. Although the energy consumption of the tertiary industry is very low, the Chinese government cannot let it grow due to the large output in some sectors. The GDP of the tertiary industry has become the largest proportion in China, thus the adjustment of its internal structure needs the attention of policymakers for the sake of energy consumption.
Some limitations in this paper may affect the credibility of the result:
First, the parameter of energy intensity in 2020 was set based on policy goals; whether this goal can be achieved may have an impact on the results in this paper.
Second, there was a big difference between the provinces in China regarding energy consumption. This article conducted a simulation without focusing on these differences, so the optimization may to some degree, be too macroscopic.
Finally, as the Chinese government currently has not provided an input–output table for 2015, this article conducted an estimation of it based on the input–output table for 2012. Therefore, the difference between the estimated result and the actual data may have also affected the final results of this article. The potential impact of energy saving in China’s industrial structure by region is a topic of future studies.

Supplementary Materials

The following are available online at www.mdpi.com/2071-1050/9/12/2284/s1, Table S1: Energy consumption in 2015. Table S2: direct requirement matrix of noncompetitive oriented-import China’s input–output table in 2015.

Author Contributions

All authors contributed extensively to the work presented in this paper. Yushen Tian conceived the method and analyzed the results; Siqin Xiong collected the data; Yushen Tian wrote the paper and Xiaoming Ma revised the paper.

Conflicts of Interest

The authors declare no conflict of interest.

References

  1. Fernández González, P.; Landajo, M.; Presno, M.J. Multilevel LMDI decomposition of changes in aggregate energy consumption. A cross country analysis in the EU-27. Energy Policy 2014, 68, 576–584. [Google Scholar] [CrossRef]
  2. Norman, J.B. Measuring improvements in industrial energy efficiency: A decomposition analysis applied to the UK. Energy 2017, 137, 1144–1151. [Google Scholar] [CrossRef]
  3. Llop, M. Changes in energy output in a regional economy: A structural decomposition analysis. Energy 2017, 128, 145–151. [Google Scholar] [CrossRef]
  4. Wang, Y.; Ge, X.-L.; Liu, J.-L.; Ding, Z. Study and analysis of energy consumption and energy-related carbon emission of industrial in Tianjin, China. Energy Strategy Rev. 2016, 10, 18–28. [Google Scholar] [CrossRef]
  5. Xiao, B.; Niu, D.; Wu, H. Exploring the impact of determining factors behind CO2 emissions in China: A CGE appraisal. Sci. Total Environ. 2017, 581, 559–572. [Google Scholar] [CrossRef] [PubMed]
  6. Mi, Z.; Pan, S.Y.; Yu, H.; Wei, Y.M. Potential impacts of industrial structure on energy consumption and CO2 emission: A case study of Beijing. J. Clean. Prod. 2015, 103, 455–462. [Google Scholar] [CrossRef]
  7. Janger, J.; Schubert, T.; Andries, P.; Rammer, C.; Hoskens, M. The EU 2020 innovation indicator: A step forward in measuring innovation outputs and outcomes? Res. Policy 2017, 46, 30–42. [Google Scholar] [CrossRef]
  8. Sadhukhan, J.; Smith, R. Synthesis of industrial systems based on value analysis. Comput. Chem. Eng. 2007, 31, 535–551. [Google Scholar] [CrossRef]
  9. Yun, T.; Cho, G.; Kim, J. Analyzing Economic Effects with Energy Mix Changes: A Hybrid CGE Model Approach. Sustainability 2016, 8, 1048. [Google Scholar] [CrossRef]
  10. Mao, G.; Dai, X.; Wang, Y.; Guo, J.; Cheng, X.; Fang, D.; Song, X.; He, Y.; Zhao, P. Reducing carbon emissions in China: Industrial structural upgrade based on system dynamics. Energy Strategy Rev. 2013, 2, 199–204. [Google Scholar] [CrossRef]
  11. Zhou, X.; Zhang, J.; Li, J. Industrial structural transformation and carbon dioxide emissions in China. Energy Policy 2013, 57, 43–51. [Google Scholar] [CrossRef]
  12. Wu, Z.; Xu, J. Predicting and optimization of energy consumption using system dynamics-fuzzy multiple objective programming in world heritage areas. Energy 2013, 49, 19–31. [Google Scholar] [CrossRef]
  13. Chenery, H.B.; Watanabe, T. International Comparisons of the Structure of Production. Econometrica 1958, 26, 487–521. [Google Scholar] [CrossRef]
  14. Leontief, W. The Structure of American Economy, 1919–1939; Oxford University Press: Oxford, UK, 1941. [Google Scholar]
  15. Li, Z.; Sun, L.; Geng, Y.; Dong, H.; Ren, J.; Liu, Z.; Tian, X.; Yabar, H.; Higano, Y. Examining industrial structure changes and corresponding carbon emission reduction effect by combining input-output analysis and social network analysis: A comparison study of China and Japan. J. Clean. Prod. 2017. [Google Scholar] [CrossRef]
  16. Zanchetta Borghi, R.A. The Brazilian productive structure and policy responses in the face of the international economic crisis: An assessment based on input-output analysis. Struct. Chang. Econ. Dyn. 2017, 43, 62–75. [Google Scholar] [CrossRef]
  17. Zhou, M.; Chen, Q.; Cai, Y.L. Optimizing the industrial structure of a watershed in association with economic-environmental consideration: An inexact fuzzy multi-objective programming model. J. Clean. Prod. 2013, 42, 116–131. [Google Scholar] [CrossRef]
  18. Rong, A.; Lahdelma, R. Fuzzy chance constrained linear programming model for optimizing the scrap charge in steel production. Eur. J. Oper. Res. 2008, 186, 953–964. [Google Scholar] [CrossRef]
  19. State Council. The Twelfth Five-Year Plan for National Economic and Social Development of the People’s Republic of China; State Council: Beijing, China, 2016. [Google Scholar]
  20. Zadeh, L.A. Fuzzy sets. Inf. Control 1965, 8, 338–353. [Google Scholar] [CrossRef]
  21. National Bureau of Statistics of China (NBSC). China Energy Statistical Yearbook 2016; China Statistics Press: Beijing, China, 2016. [Google Scholar]
  22. National Bureau of Statistics of China (NBSC). China 2012 Input–Output Table; China Statistics Press: Beijing, China, 2015. [Google Scholar]
  23. Hiramatsu, T.; Inoue, H.; Kato, Y. Estimation of interregional input-output table using hybrid algorithm of the RAS method and real-coded genetic algorithm. Transp. Res. Part E Logist. Transp. Rev. 2016, 95, 385–402. [Google Scholar] [CrossRef]
  24. Weber, C.L.; Peters, G.P.; Guan, D.; Hubacek, K. The contribution of Chinese exports to climate change. Energy Policy 2008, 36, 3572–3577. [Google Scholar] [CrossRef]
  25. National Bureau of Statistics of the People’s Republic of China. Classification of National Economic Sectors. GB/T 4754–2017; 2017. Available online: http://www.stats.gov.cn/tjsj/tjbz/hyflbz/201710/t20171012_1541679.html (accessed on 14 October 2017).
  26. Xiong, P.; Dang, Y.; Yao, T.; Wang, Z. Optimal modeling and forecasting of the energy consumption and production in China. Energy 2014, 77, 623–634. [Google Scholar] [CrossRef]
  27. Lin, B.; Liu, W. Estimation of energy substitution effect in China’s machinery industry—Based on the corrected formula for elasticity of substitution. Energy 2017, 129, 246–254. [Google Scholar] [CrossRef]
  28. Lin, B.; Zhang, G. Energy efficiency of Chinese service sector and its regional differences. J. Clean. Prod. 2017, 168, 614–625. [Google Scholar] [CrossRef]
  29. Zhang, C.; Zhou, K.; Yang, S.; Shao, Z. On electricity consumption and economic growth in China. Renew. Sustain. Energy Rev. 2017, 76, 353–368. [Google Scholar] [CrossRef]
  30. Huang, B.; Zhao, J.; Geng, Y.; Tian, Y.; Jiang, P. Energy-related GHG emissions of the textile industry in China. Resour. Conserv. Recycl. 2017, 119, 69–77. [Google Scholar] [CrossRef]
  31. Zhang, B.; Chen, G.Q. Physical sustainability assessment for the China society: Exergy-based systems account for resources use and environmental emissions. Renew. Sustain. Energy Rev. 2010, 14, 1527–1545. [Google Scholar] [CrossRef]
  32. Li, M.-N.; Han, X.-P. Financing Problems in China’s Rural Areas. J. Northeast Agric. Univ. 2014, 21, 80–89. [Google Scholar] [CrossRef]
  33. Huang, X.; Gao, Q. Does social insurance enrollment improve citizen assessment of local government performance? Evidence from China. Soc. Sci. Res. 2017. [Google Scholar] [CrossRef]
  34. Chen, Y.; He, M.; Rudkin, S. Understanding Chinese provincial real estate investment: A Global VAR perspective. Econ. Model. 2017, 67, 248–260. [Google Scholar] [CrossRef]
  35. Zhang, B.; Qu, X.; Meng, J.; Sun, X. Identifying primary energy requirements in structural path analysis: A case study of China 2012. Appl. Energy 2017, 191, 425–435. [Google Scholar] [CrossRef]
  36. Li, L. China’s manufacturing locus in 2025: With a comparison of “Made-in-China 2025” and “Industry 4.0”. Technol. Forecast. Soc. Chang. 2017. [Google Scholar] [CrossRef]
Figure 1. The total amount of GDP and energy consumption of baseline as usual (BAU) and adjusted industrial structure. The blue bar shows the BAU data. The orange bar shows the data after optimization in 2020.
Sustainability 09 02284 g001
Figure 2. Comparisons of adjusted industrial structure and initial structure in 2020 on a sectoral level. The blue bar shows the BAU data, the orange bar shows the data of the adjusted industrial structure in 2020, and the gray bar shows the energy intensity in 2015.
Sustainability 09 02284 g002
Figure 3. (a) The added value proportion of each sector in the BAU; (b) The added value proportion of each sector in adjusted industrial structure.
Sustainability 09 02284 g003
Table 1. Classification and codes of national economic sectors.
No.SectorNo.Sector
1Agriculture, forestry, animal husbandry and fishery18Transportation equipment manufacturing
2Coal mining and dressing19Electric equipment and machinery manufacturing
3Extraction of petroleum and natural gas20Electronic, computers and telecommunication equipment
4Mining of minerals21Instrument and meter and cultural and official goods manufacturing
5Mining of nonmetal minerals22Other manufacturing
6Exploitation of ancillary services, and other mining products23Scrap waste
7Manufacture of food and tobacco products24Metal products, machinery and equipment repair services
8Textile industry25Electricity, heat production and supply industry
9Manufacture of apparel, leather and related products26Gas production and supply
10Processing of wood and manufacture of furniture27Water production and supply
11Manufacture of paper and stationery; printing28Construction
12Processing and cooking of oil; processing of nuclear fuel29Wholesale and retail trades
13Chemical industry30Transportation, warehousing and postal industry
14Non-metallic mineral products industry31Hotels and catering services
15Metal smelting and rolling processing industry32Finance and insurance
16Manufacture of metal products33Real estate trade
17General and special equipment manufacturing34Other services
Table 2. The settings of exogenous parameters in the model.
ParameterSetting
α0.065
μ0.03
ω1−0.5
ω25
π0.55
m5

