Chinese Consumer Quality Perception and Preference of Traditional Sustainable Rice Produced by the Integrated Rice–Fish System

1
School of Economics and Management, Nanjing Tech University, Nanjing 211800, China
2
Food and Resource Economics Department, University of Florida, Gainesville, FL 32611-0240, USA
*
Author to whom correspondence should be addressed.
Sustainability 2017, 9(12), 2282; https://doi.org/10.3390/su9122282
Submission received: 22 October 2017
/
Revised: 24 November 2017
/
Accepted: 6 December 2017
/
Published: 9 December 2017
(This article belongs to the Special Issue Sustainable Food Innovation)
Abstract
:Historically, humans have created many sustainable practices, and among the most famous and successful sustainable practice is the rice–fish system in China. While previous studies have investigated eco-labeling food from various angles, consumer perception and preference of food produced from traditional sustainable practices (traditional sustainable food) remain unexplored. Taking the historical rice–fish system as an example, we examined consumers’ perception and willingness to pay (WTP) for rice produced by a rice–fish system, by using data from 1422 consumers from China. Our paper shows that most Chinese consumers do understand the meaning of the rice–fish system and perceive the traditional sustainable system as environmentally friendly and producing high-quality food. The premium that consumers are willing to pay for rice from a rice–fish system is about 41%. Consumers who perceive the linkage between sustainable production and food quality and safety have a significantly higher WTP for traditional sustainable rice (p-value = 0.000). Interestingly, the perception of environment risk does not directly cause more traditional sustainable food consumption, but those who self-proclaimed as environmentalists are willing to pay a premium for traditional sustainable rice. Females, people with high family income, and people with children are more willing to pay for traditional sustainable rice. Understanding consumer perception and preference of traditional sustainable food provides critical information for Chinese policymakers to develop a cheap and efficient way to keep traditional sustainable practices and promote sustainable food consumption.
1. Introduction
Due to climate change and serious environmental problems, the public has been paying more attention to sustainable issues in recent years. Sustainability includes several dimensions [1] categorized into environmental, social and ethical, and economic aspects. Sustainable food is food produced by taking into consideration its environmental impact, economic viability, and social justice principles [2]. Sustainable food can carry sustainability claims, which is defined as “distinctive marks, marketing labels, and brands developed by public and private sector institutions and placed on products and services attesting that their products and supply chains incorporate the pillars of sustainability (economic, social, and environmental) into their agricultural product, processing, manufacturing, and export process and services” [3].
The global sustainability initiative consists of two key components: a sustainable food consumption system and a sustainable production system [4], because how food is produced and consumed has a significant implication on the conservation of natural ecosystems and environments [5]. The agricultural practices are becoming important for consumers in the world [6,7]. For instance, the once globally promoted Green Revolution focused on improving food production output by the use of modern agricultural technology and chemicals [8]. With increased understanding of the effects of the heavy use of fossil-based chemicals, the Green Revolution was criticized for its negative impact on biodiversity, human health, income distribution, and sustainability [9]. Meanwhile, the agricultural environment regulation is becoming more stringent. U.S. Federal regulations, such as the Food Quality Protection Act (FQPA) and the Clean Water Act (CWA), are responsible for controlling pesticides abuse [10]. In China, farmers are required to use low-toxicity pesticides to prevent pests and diseases. With the rapidly growing environmental concerns, it is urgent to develop effective ways to motivate sustainable food consumption and production.
Motivating growers and food industries to pursue sustainability requires the identification of consumers’ perception and preferences of sustainable food and the critical factors affecting consumer willingness to pay (WTP). Most of the current literature on preferences of sustainable foods focus on food labels, such as organic labels [11,12], eco-labels [9,13,14], fair trade labels [11,13], animal welfare labels [15], and local food [16]. These researches show that consumers generally are willing to pay more for food with certain types of sustainable labels and that heterogeneous preferences exist among consumers.
While previous studies have investigated preferences of sustainable food from various angles, consumer perception and preference of traditional sustainable food remain unexplored. Humans have created many sustainable practices throughout history that are mostly sustained by small-scale farms. Although these small-scale farms are not certified, the practices on these farms are sustainable in nature even under modern sustainable production standards. Among the most famous and successful sustainable practice is the integrated rice–fish system in China. The Chinese culture emphasizes the harmonious paragenesis between humans and nature, such as plant ecology and plant diversity. In particular, the integrated rice–fish system is an ancient practice employed by numerous farmers in China dated as far back as the mid-Han Dynasty around 100 AD. Because most farms that preserve the rice–fish system are small-scale, they are less likely to attain certified sustainable labels due to the cost of certification as well as the distrust in organic labels among Chinese consumers [17,18,19]. Therefore, understanding consumer quality perception and preference of traditional sustainable food such as those produced from the rice–fish system will provide critical information for Chinese policymakers to identify barriers and develop rules and policies to promote traditional sustainable food consumption. This in turn helps sustain the economic sustainability of the traditional food production systems such as the rice–fish system, thus boosting the production systems where people and nature co-exist harmoniously.
2. The Integrated Rice–Fish System
The integrated rich–fish system is an ancient sustainable practice employed by numerous farmers in China and some other countries in Asia, which can be dated as far back as the mid-Han Dynasty around 100 AD. In the southeastern provinces and the mountainous areas of the southwestern provinces of China, rice–fish culture is prevalent in areas where a few rivers or lakes exist but fresh fish are not available [20]. The better economic returns prompt the spread of the rice–fish culture from the mountainous districts to the plain areas of China. In the 1950s, this practice developed rapidly in Guangdong province. However, in the early 1960s, the area of the rice–fish production system shrank quickly because of the increasing use of chemical insecticides [20]. In 1993, the area of rice–fish culture was at 983,000 hm2, producing 230,000 tons of fish and 450,000 tons of rice [21]. Then the area of rice–fish culture reached 1,501,600 hm2 in 2000 and produced 1,558,200 tons of rice.
In a rice–fish system, fish are grown concurrently or alternately with a rice field or rice field–pond complex. Fish may enter fields naturally from surrounding waterways when flooding occurs (rice field fisheries), or be stocked (fish culture) on purpose, or a bit of both. Rice–fish systems allow farmers to produce fish and rice from the same field, and this doesn’t reduce rice yields. The integrated rice–fish farming can use fish to improve soil fertility, and many reports also confirm that integrated rice–fish farming is ecologically sound [22,23]. In such fields where fish culture coexists, the paddy grows better, with higher branches, longer panicles, higher effective tillering rate, and more grains per tiller. Fish manure serves as the fertilizer, and the movement of fish helps loosen the soil, promoting fertilizer decomposition and root development, which increases the rice quality and yield [24].
Integrated rice–fish farming can also reduce the use of agricultural chemicals, because fish eat weeds and pests, promoting weed control and reducing insect damage. This leads to reducing the use of pesticides [24]. Farmers use integrated rice–fish farming to be an important integrated pest management method in rice crops [25,26]. Fish can help control aquatic weeds and algae that carry diseases, host pests, and compete with rice for nutrients. Moreover, fish eat flies, snails, and insects, which helps control malaria mosquitoes and water-borne diseases [27]. Having fish in rice fields also helps dissuade farmers from using pesticides, because pesticides have the potential to poison fish. An ecological index (EI) of 0.8155 suggests that the rice–fish system is a highly efficient and comprehensive eco-agriculture model [24].
Rice production increases when farmers take integrated rice–fish farming. It is interesting to find that rice grows better with an integrated rice–fish system and the yield increases about 4–15%. On average, per hectare yields of the rice–fish system are 6.7 to 7.5 tons of rice and 0.75 to 2.25 tons of fish. Hence, the output value of the integrated rice–fish system ranges from USD 8550 to USD 17,100 per hectare, considerably high according to international standards. The rice–fish system was introduced in eight states in the Federal Republic of Nigeria, which almost doubled rice and tilapia production at some of the demonstration sites [26].
3. Literature
A sustainable food consumption and production system is consumer-driven. As the public becomes more concerned about environmental issues, more demand policies are being discussed in order to establish sustainable consumption patterns [28]. More consumers today are concerned about the environment and are willing to pay for “sustainability”. As consumers pay more attention to sustainable products, producers are more motivated to adopt sustainable production methods [29]. Sustainable food consumption campaigns and corporate advertising are influencing consumers’ recognition and purchases of sustainable food [29]. Exploring the effect of food quality perception on consumer WTP for sustainable food is a critical aspect in identifying the efficient ways to promote sustainable food.
Organic food is the most common sustainable food in the market. Most countries have their own organic food certification and trademark systems [30]. In Europe, the value of organic products was about 21.5 billion euros in 2011, which expanded by 9% from last year. Research shows that safer, healthier, and more environmentally friendly branding are the main drivers of consumers’ buying of organic food [31,32,33,34]. Consumers’ information about the production method can also affect the WTP for organic food [31]. Researches show that environmentally friendly products were preferred by most consumers, and they were willing to pay a premium for eco-products [35,36]. For instance, the WTP premium of free-range beef and chicken are €11.64/kg and €10.25/kg, respectively, in Italy [37]. European consumers on average were willing to pay 20% more for a “raised outside” label and 5% more for pork produced from outdoor systems [38].
Despite the large body of literature on eco-labeling food, few explore consumer perception and preference of traditional sustainable food such as food produced from the rice–fish system. Understanding consumers’ preferences for traditional sustainable food can provide the food industry and policymakers important information. A sustainable food consumption and production system is particularly important to China because it has a limited natural resource to feed the world’s largest population [39]. Elicit consumer preference for traditional sustainable food can help China better develop a sustainable consumption and production system that takes the advantages of both the traditional sustainable practices and the modern food production system, which will improve its food security, food safety, environment, and ecosystems.
This paper contributes to the literature in several ways. First, our study is the first to evaluate consumers’ WTP for agricultural products produced from the rice–fish system, which is a sustainable farming method with a long history in China and some other countries in Asia. Not only can the rice–fish system increase rice production and improve food quality, but also can it reduce the use of pesticides and fertilizers. Second, we determine how the perception of sustainable food affects consumer’ WTP. Quantifying the relationship between perception and WTP provides valuable information for policy and marketing strategy development [40]. This study also examines how self-proclaiming as environmentalists affects sustainable food consumption, whereas previous studies only focus on the impact of environmental risk perception [41].
4. Methods and Data
4.1. Theoretical Model
According to Lancaster’s consumer demand theory, a consumer will select a product that maximizes the consumer’s utility based on the product characteristics [42]. Thus, we can define a utility function as U(z), where z is a vector of the product attributes and consumer characteristics [4]. Without losing generality, we define consumer utility function over the rice–fish system rice as
where is the price of the rice j, indicates whether the rice is produced from a rice–fish system, and is a vector of the demographic, perception variables, and variables indicating whether a consumer is an environmentalist or not. When facing two alternatives, j and k, consumers will select the product that results in the maximized utility such that
Consumer WTP for rice–fish system rice can be defined as the amount of premium for rice from the rice–fish system that makes the consumers indifferent between rice–fish system rice () and conventional rice (), that is,
This results in , where is the marginal effect of X on consumer WTP for rice–fish system rice.
4.2. WTP Elicitation Method
Consumer WTP studies can help determine the market potential of a product because they estimate consumer preferences for a range of attributes. In this study, Contingent Valuation (CV) is used to elicit consumer preferences of rice from the rice–fish system. CV is a popular stated-preference method that is widely used to obtain consumer preferences of market and non-market goods [43,44]. Although CV methods less truthfully elicit consumer preference than do revealed preference methods, revealed preference methods make it more challenging to observe multiple observations of an individual’s choice of different products. Sometimes real purchase data just does not exist at all. Meanwhile, we do not measure WTP for the quality characteristic in general, but for the marginal WTP for the quality characteristic improvement, therefore alleviating the concerns of the hypothetical bias of CV methods [45].
CV methods include using open-ended questions or closed-ended questions to elicit consumer WTP [46]. Open-ended questions ask consumers to directly state the prices that they are willing to pay for a product or service; while closed-ended questions ask whether consumers are willing to pay for a product or a service at several proposed prices [47]. Open-ended CV is easily understood and provides more flexibility for consumers to state their WTP. However, sometimes consumers have difficulty to name their own prices, so they need reference prices to help them formulate the value [46,48]. Besides this, open-ended CV always results in zero bids, which may cause some problems in econometric model estimation [49,50]. Therefore, we use payment card CV questions to elicit consumer WTP to reduce the aforementioned issues with the open-ended CV questions [51].
Taking historical rice–fish system as an example, this paper examines Chinese consumers’ perception and preference of rice from the rice–fish system. In this study, the price for conventional rice is set as 3 yuan/500 g based on average rice price in 50 cities surveyed by China’s National Bureau of Statistics in September 2017. According to the meta-analysis of Xia and Zeng, the WTP premiums for sustainable food are quite diverse, ranging from 2% to 500%, but more than 95% of studies find that the premium is below 100% [52]. We ask the respondents to pick the maximum acceptable price for rice from the rice–fish system from a price list, including 3.0–3.5 yuan, 3.5–4.0 yuan, 4.0–4.5 yuan, 5.0–6.0 yuan, 6.0 yuan, and 6.0 yuan and above. In this study, consumers were asked to answer the following question:
Suppose that the price for conventional rice is 3 yuan/500 g. How much are you willing to pay for rice from the rice–fish system?
A survey designed to understand Chinese consumers’ perception and WTP for rice from the rice–fish system was conducted. The survey was conducted online by a consumer survey company, SO JUMP, who helped distribute our survey online to its national representative consumer panels in China in September 2017. To qualify for the study, respondents had to be 18 years or older and the primary shopper of the household. To improve the data quality, we identified the respondents who may not carefully read the survey questions by using the “trap question” method (We included both statements “I am an environmentalist” and “I am not an environmentalist” in the survey. If the answer is same, we think they are less careful in answering survey questions) [53,54]. Removing respondents who fail the “trap questions” and those with any missing responses resulted in 1422 observations for the final analysis. Table 1 reports the definitions of variables.
4.3. Econometric Model
Interval Regression is used to estimate the model, because the WTP values obtained by the Payment Card methods are not continuous, consisting of intervals and censoring observations. We could analyze these data using ordinary least squares (OLS) regression using the midpoints of the intervals. However, OLS regression could not reflect the uncertainty around the actual values for each interval. This type of analysis cannot adequately deal with the left- and right-censoring issues in the tails. Interval Regression is a generalized Tobit model used to model outcomes that have interval censoring [55]. Interval Regression is the primary technique to tackle such a data structure [56] when the category into which each observation falls is known, but the exact value of the observation is unknown. For comparison purposes, we also report OLS regression results in this study.
5. Results
Table 1 reports the sample demographic statistics. About 53.09% were female, which was consistent with the fact that females buy food products more frequently than males in China. More than 50% respondents’ monthly household income was below 12,000 RMB, consistent with the monthly household income in China. About 87% of the respondents had a college or postgraduate degree, and 61% were aged 34 years or younger, which was consistent with the fact that highly educated and young people are more likely to use the internet. In addition, more than 75% of our samples had children at home, and about 50% respondents claimed that they were familiar with the rice–fish system.
5.1. Perception of Rice–Fish System Rice
Determining consumer perception of rice–fish system rice is essential to identify the drive underlying the WTP for rice from the rice–fish system. In the survey, respondents were asked whether they perceived rice from the rice–fish system as safer, of better quality, and more environmentally friendly through a five-point Likert scale (We let respondents to statements “I believe that rice from the rice-fish system is safer/better quality/more environmental friendly”. The answers range from “strongly disagree” to “strongly agree” with a five-point Likert scale).
Results in Figure 1 (p-value = 0.000 respectively) show that most respondents (83%) thought “it is more environmentally friendly to produce rice by the rice–fish system”. The percentage of respondents who thought rice from the rice–fish system was safer was more than 72%. About 68% respondents perceived rice from the rice–fish system as of better quality. These results implied that most consumers perceived rice from the rice–fish system as of higher quality and more sustainable.
5.2. Answers to CV Questions and WTP for Rice from the Rice–Fish System
Figure 2 presents the frequency of the respondents’ choices in CV question. Note that consumers seldom selected the price of “6 yuan or above” for rice from the rice–fish system. It indicates that consumers, in general, are very conservative and not willing to pay a premium of more than 100% for rice–fish system rice in China. The results (p-value = 0.043) also show that the consumers with high income (income > 12,000) were more likely to pay a higher premium for rice from the rice–fish system than those with low income (income ≤ 12,000). Not surprisingly, the respondents who agree or strongly agree with the statement “I am an environmentalist” were more likely to pay a higher premium for rice from the rice–fish system (p-value = 0.000).
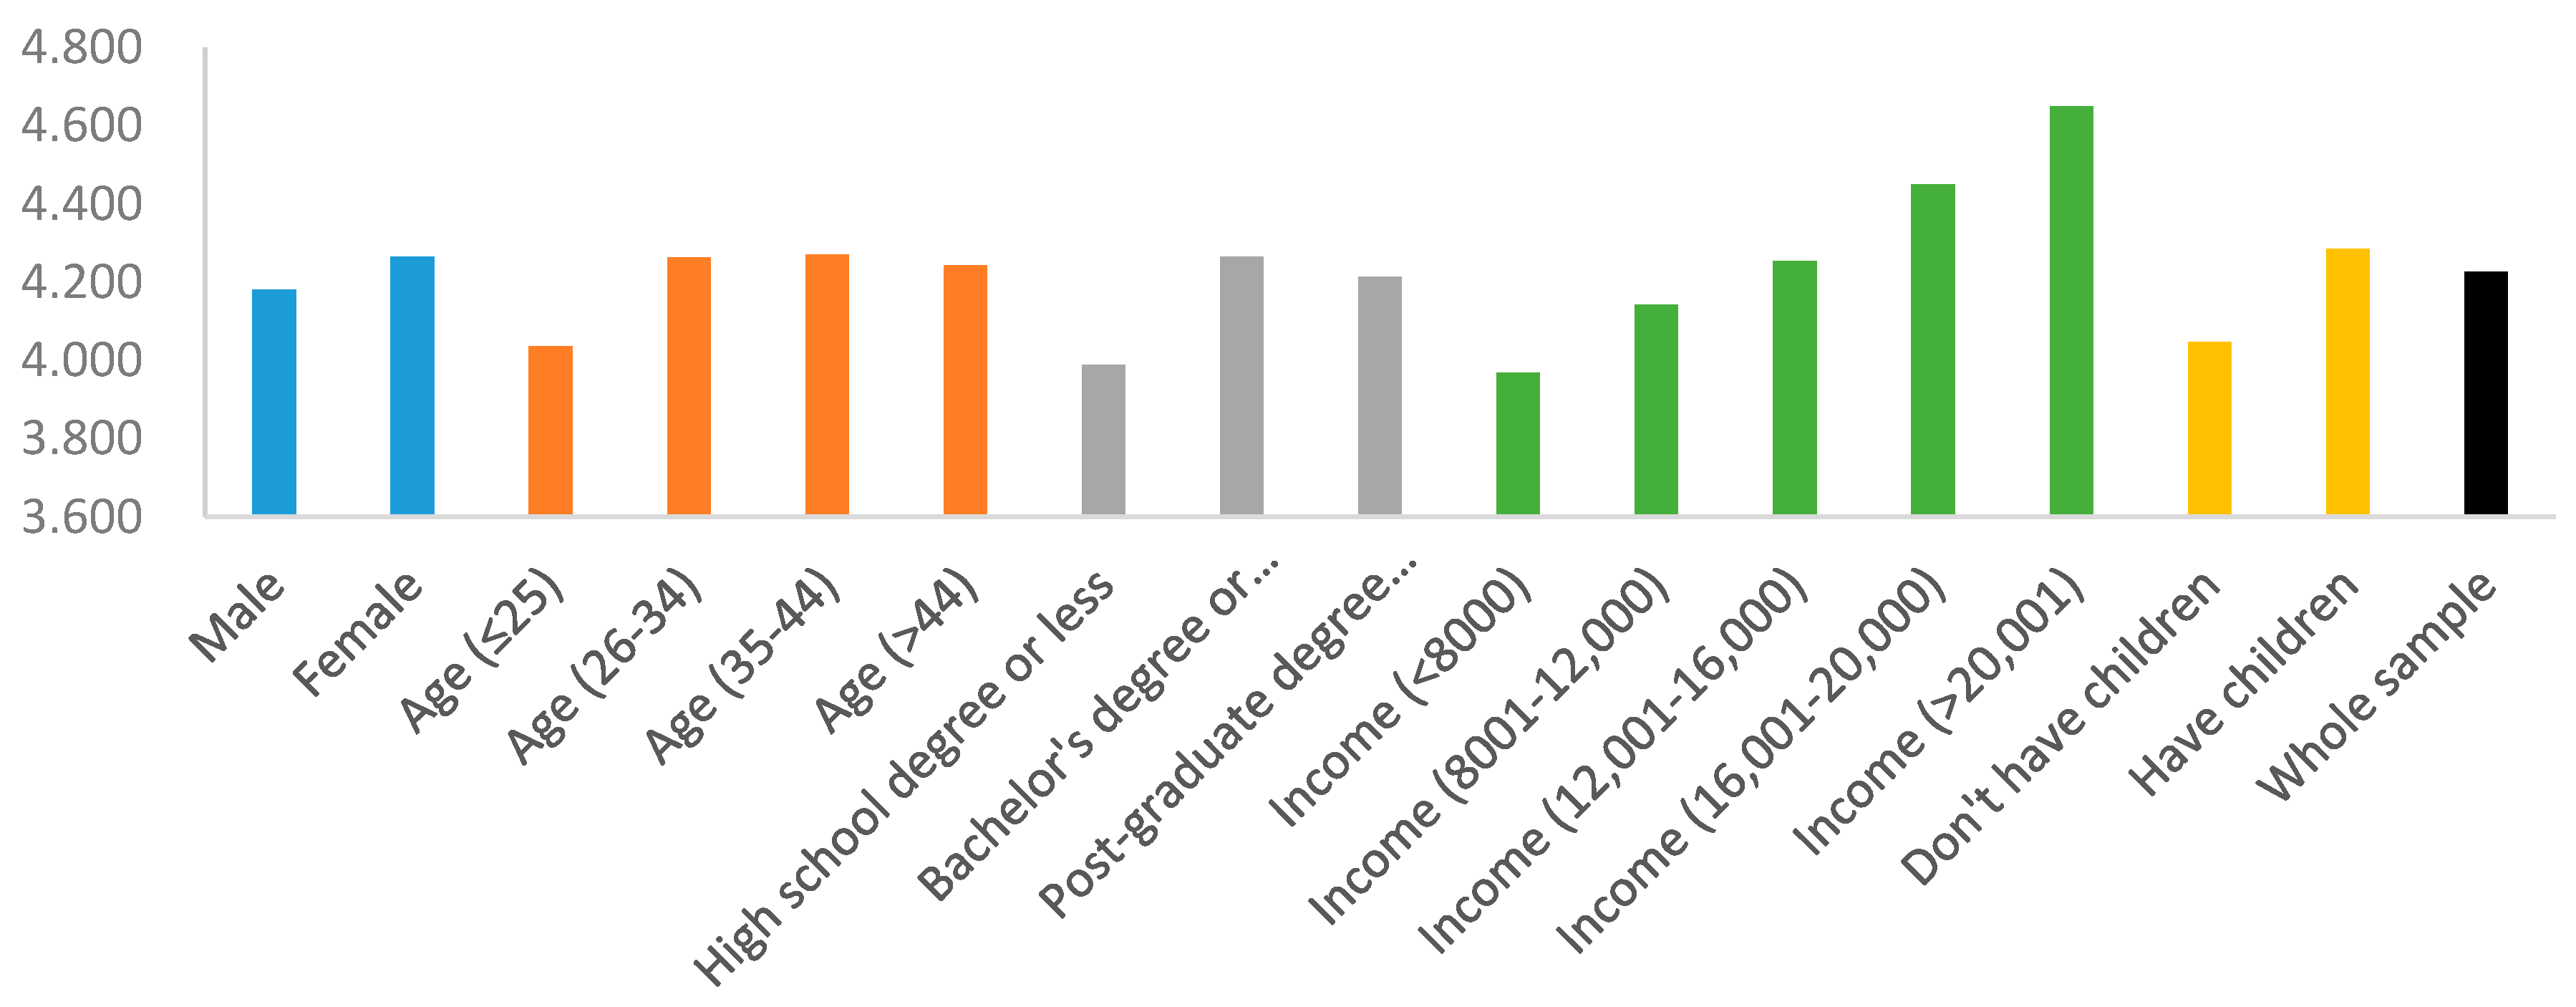
Figure 3 reports the statistics of respondents’ mean WTP for rice from the rice–fish system by socio-demographic characteristic. Because the CV questions presented a set of price intervals for respondents to select from, the means of WTP are assumed as the middle point of the interval (for example, if a respondent choose the interval 3.0–3.5, so the midpoint is 3.25. As for the open interval, it is equal to the lower boundary 6.0 and the half distance of the neighboring interval 0.5). Respondents on average are willing to pay a 41% premium for rice from the rice–fish system over conventional rice. In addition, females, those aged 35–44, those with high family income, and those with a bachelor’s or associate degree were willing to pay more for rice from the rice–fish system.
5.3. Factors Affecting Consumer WTP
Table 2 reports the estimation results from the Interval Regression and those from the OLS regression, respectively. In general, the results from both models were consistent (p-value = 0.000). The dependent variables in the Interval Regression were the right- and left-censored WTP for rice from the rice–fish system rice, and the dependent variables in the OLS regression are the means of WTP. The independent variables were demographics (such as age, gender, income, education, and whether or not the respondents had children), knowledge of the rice–fish system, and the perception variables presented in Figure 1. We also included whether respondents self-proclaimed as an environmentalist and their environmental risk perception. Other than income, all other variables were included in the models as categorical variables. Male, high school or less, do not have children, non-environmentalist, low environmental risk perception, and strongly disagree with that rice from the rice-fish system is safer, better quality, and more environmental friendly were used as the benchmark categories for gender, education level, having children, environmentalist, environmental risk perception, and perception of the rice from the rice–fish system rice, respectively.
Results from the Interval Regression show that among the three perception variables, the coefficients of Safer and Better Quality were significantly positive at the 10% and 5% significance level, respectively, implying that respondents who thought rice from the rice–fish system was safer and of better quality were willing to pay more. Respondents who know more about the rice–fish system were also willing to pay a higher premium for rice from the rice–fish system. This result suggests that promotion emphasizing food safety and quality rather than the more environmentally friendly nature of the rice–fish system may be more beneficial. Improving consumers’ knowledge about the rice–fish system is also likely to be effective for market promotion.
Interestingly, environmental risk perception did not have a significant impact on respondents’ WTP for rice from the rice–fish system. However, the respondents who claimed themselves as environmentalists were willing to pay a premium for rice from the rice–fish system. This result suggests that high environmental risk perception does not automatically lead to more sustainable food consumption but fostering environmentalism is likely to be useful for market promotion.
The coefficients of most of the demographic variables were significant, except for age. Having children at home had a significant effect on consumer WTP, which suggests a potential over-generational concern about sustainable development [4]. Respondents with a higher household income were willing to pay more for rice from the rice-fish system, consistent with some previous research that household income significantly affects organic or green food consumption [57,58]. Compared to males, females might be willing to pay more for rice–fish system rice (at 10% and 5% significance level in the Interval and OLS regression, respectively). Compared to respondents with high school degree or less, those with bachelor’s or associate degrees might be willing to pay more for rice from the rice–fish system (at 10% significance level). However, respondents with post-graduate degrees were not significantly different from those with a high school degree or less. Further analysis shows that income had a significantly positive relationship with education. Removing income from the models showed that post-graduate degrees also had a significantly positive impact on consumer WTP at the 5% significant level, which indicated that the high collinearity between income and post-graduate degree might lead to the insignificance of this variable in the results presented in Table 3.
6. Conclusions and Discussion
Promoting the traditional sustainable food consumption and production system is particularly important in China as well as other developing countries because it is cheap and easily accepted. Comparing to organic food, Chinese consumers are familiar with traditional sustainable food, and traditional sustainable food also does not need rigorous certifications, which can save lots of cost. Motivating growers and food industries to apply traditional sustainable production system demands the identification of consumers’ perceptions and preferences of traditional sustainable food and the important factors affecting consumer WTP.
Taking the historical rice–fish system as an example, this paper examines Chinese consumers’ perception and preference of rice from the rice–fish system. Our results show that Chinese consumers’ knowledge of the rice–fish system is abundant and a majority of them think rice from the rice–fish system is safer, of better quality, and more environmentally friendly than conventional rice. This means that Chinese consumers can readily accept rice from the rice–fish system. Respondents on average are willing to pay a 41% premium for rice from the rice–fish system over conventional rice, which is consistent with the 40% premiums for sustainable milk that is identified by Gao et al. [4]. It is also consistent with Loo et al.’s study [59], which showed that 90% of Belgian consumers like free range claims of chicken.
The results from the Interval Regression further show that only those who thought rice from the rice–fish system was safer and of better quality were willing to pay more, and high environmental risk perception does not directly cause the behavior of sustainable consumption. Besides this, those who claimed to be an environmentalist were willing to pay a premium for rice from the rice–fish system. These results indicate that encouraging the consumption of sustainable food should link sustainable food with food safety and quality that can lead to a higher level of sustainable food consumption. It also implies that even though consumers can perceive high environmental risk, it does not directly translate to consumers’ sustainable consumption. More environmentalists should be fostered in order to promote more environmentally friendly behavior. Respondents with a higher household income were willing to pay more for rice from the rice–fish system, consistent with some previous research that household income significantly affects organic or green food consumption [57,58].
Humans have a long history of producing and consuming traditional sustainable food. Promoting traditional sustainable food consumption and production may be one of the cheap ways to realize sustainable development. This paper provides essential information for government and policymakers to promote the demand for traditional sustainable food. The limits of the research are that we estimated consumer preferences in a hypothetical situation rather than in a real purchase situation. Future research could answer several important questions. Because third-party institutions currently do not certify most traditional sustainable food, it is hard for consumers to verify whether a food product is truly produced under the traditional sustainable production system. Should a certification system be built to protect and promote traditional sustainable production and consumption, and how effective are the certifications from different types of certification agents? The questions such as the cost of producing traditional sustainable food also need to be an answered so that developing countries can find effective ways to take full advantage of traditional sustainable farming technologies.
Acknowledgments
This research is supported by the China Scholarship Council, The Ministry of Education of Humanities and Social Science Fund (Project No. 13YJC790138), Jiangsu University Philosophy and Social Science Fund (Project No. 2017SJB0191), and The National Social Science Fund Major Projects (Project No. 12 & ZD204).
Author Contributions
Erpeng Wang designed the Contingent Valuation (CV) experiment; Erpeng Wang analyzed the data; Erpeng Wang and Zhifeng Gao wrote the paper.
Conflicts of Interest
The authors declare no conflict of interest.
References
- Hanss, D.; Böhm, G. Sustainability seen from the perspective of consumers. Int. J. Consum. Stud. 2012, 36, 678–687. [Google Scholar] [CrossRef]
- Yanarella, E.J.; Levine, R.S.; Lancaster, R.W. Research and Solutions: “Green” vs. Sustainability: From Semantics to Enlightenment. Sustain. J. Rec. 2009, 2, 296–302. [Google Scholar] [CrossRef]
- United Nations Conference on Trade and Development (UNCTAD). Sustainability Claims Portal. Available online: http://www.unctad.info/en/SustainabilityClaims-Portal/ (accessed on 12 October 2017).
- Gao, Z.; Li, C.; Bai, J.; Fu, J. Chinese consumer quality perception and preference of sustainable milk. China Econ. Rev. 2016. [Google Scholar] [CrossRef]
- Food and Agriculture Organization (FAO). Sustainable Food Consumption and Production; Food and Agriculture Organization of the United Nations: Rome, Italy, 2015. [Google Scholar]
- Briggeman, B.C.; Lusk, J.L. Preferences for fairness and equity in the food system. Eur. Rev. Agric. Econ. 2011, 38, 1–29. [Google Scholar] [CrossRef]
- Vermeir, I.; Verbeke, W. Sustainable food consumption: Exploring the consumer “attitude—Behavioral intention” gap. J. Agric. Environ. Ethic 2006, 19, 169–194. [Google Scholar] [CrossRef]
- Davies, W.P. An Historical Perspective from the Green Revolution to the Gene Revolution. Nutr. Rev. 2003, 61, 124–134. [Google Scholar] [CrossRef]
- Byerlee, D.; Siddiq, A. Has the green revolution been sustained? The quantitative impact of the seed-fertilizer revolution in Pakistan revisited. World Dev. 1994, 22, 1345–1361. [Google Scholar] [CrossRef]
- Loureiro, M.L.; Mccluskey, J.J.; Mittelhammer, R.C. Will Consumers Pay a Premium for Eco-labeled Apples? J. Consum. Aff. 2002, 36, 203–219. [Google Scholar] [CrossRef]
- Sirieix, L.; Delanchy, M.; Remaud, H.; Zepeda, L.; Gurviez, P. Consumers’ perceptions of individual and combined sustainable food labels: A UK pilot investigation. Int. J. Consum. Stud. 2013, 37, 143–151. [Google Scholar] [CrossRef]
- Xie, J.; Gao, Z.; Swisher, M.; Zhao, X. Consumers’ Preferences for Fresh Broccolis: Interactive Effects between Country of Origin and Organic Labels. Agric. Econ. 2015, 47, 181–191. [Google Scholar] [CrossRef]
- Grunert, K.G.; Hieke, S.; Wills, J. Sustainability labels on food products: Consumer motivation, understanding and use. Food Policy 2014, 44, 177–189. [Google Scholar] [CrossRef]
- Vlaeminck, P.; Jiang, T.; Vranken, L. Food labeling and eco-friendly consumption: Experimental evidence from a Belgian supermarket. Ecol. Econ. 2014, 108, 180–190. [Google Scholar] [CrossRef]
- Lagerkvist, C.J.; Hess, S. A meta-analysis of consumer willingness to pay for farm animal welfare. Eur. Rev. Agric. Econ. 2011, 38, 55–78. [Google Scholar] [CrossRef]
- Darby, K.; Batte, M.T.; Ernst, S.; Roe, B. Decomposing local: A conjoint analysis of locally produced foods. Am. J. Agric. Econ. 2008, 90, 476–486. [Google Scholar] [CrossRef]
- Yin, S.; Wu, L.; Du, L.; Chen, M. Consumers’ purchase intention of organic food in China. J. Sci. Food Agric. 2010, 90, 1361–1367. [Google Scholar] [CrossRef] [PubMed]
- Jia, C.; Jukes, D. The national food safety control system of China—A systematic review. Food Control 2013, 32, 236–245. [Google Scholar] [CrossRef]
- Sirieix, L.; Kledal, P.R.; Sulitang, T. Organic food consumers’ trade-offs between local or imported, conventional or organic products: A qualitative study in Shanghai. Int. J. Consum. Stud. 2011, 35, 670–678. [Google Scholar] [CrossRef]
- Li, K. Rice-fish culture in China: A review. Aquaculture 1988, 71, 173–186. [Google Scholar]
- Xia, R.; Wang, S. Historical analysis of Chinese traditional rice fish symbiosis system. Chin. Agric. Sci. Bull. 2009, 25, 245–249. [Google Scholar]
- Huy Giap, D.; Yi, Y.; Kwei Lin, C. Effects of different fertilization and feeding regimes on the production of integrated farming of rice and prawn Macrobrachium rosenbergii (De Man). Aquac. Res. 2015, 36, 292–299. [Google Scholar] [CrossRef]
- Dugan, P.; Dey, M.M.; Sugunan, V.V. Fisheries and water productivity in tropical river basins: Enhancing food security and livelihoods by managing water for fish. Agric. Water Manag. 2006, 80, 262–275. [Google Scholar] [CrossRef]
- Food and Agriculture Organization (FAO). Scaling-Up Integrated Rice-Fish Systems. Available online: www.fao.org/3/a-i4289e.pdf (accessed on 1 September 2017).
- Berg, H. Pesticide use in rice and rice—Fish farms in the Mekong Delta, Vietnam. Crop Prot. 2001, 20, 897–905. [Google Scholar] [CrossRef]
- Halwart, M.; Gupta, M.V. Culture of Fish in Rice Fields. Available online: www.fao.org/3/a-a0823e.pdf (accessed on 12 October 2017).
- Matteson, P.C. Insect Pest Management in Tropical Asian Irrigated Rice. Annu. Rev. Entomol. 2000, 45, 549–574. [Google Scholar] [CrossRef] [PubMed]
- Bleda, M.; Valente, M. Graded eco-labels: A demand-oriented approach to reduce pollution. Technol. Forecast. Soc. Chang. 2009, 76, 512–524. [Google Scholar] [CrossRef]
- Gutierrez, A.; Thornton, T.F. Can consumers understand sustainability through seafood eco-labels? A U.S. and UK case study. Sustainability 2014, 6, 8195–8217. [Google Scholar] [CrossRef]
- Janssen, M.; Hamm, U. Product labelling in the market for organic food: Consumer preferences and willingness-to-pay for different organic certification logos. Food Qual. Preference 2012, 25, 9–22. [Google Scholar] [CrossRef]
- Gifford, K.; Bernard, J.C. The effect of information on consumers’ willingness to pay for natural and organic chicken. Int. J. Consum. Stud. 2011, 35, 282–289. [Google Scholar] [CrossRef]
- Zanoli, R.; Scarpa, R.; Napolitano, F.; Piasentier, E.; Bruschi, S.N.V. Organic label as an identifier of environmentally related quality: A consumer choice experiment on beef in Italy. Renew. Agric. Food Syst. 2013, 28, 70–79. [Google Scholar] [CrossRef]
- Joris, A.; Wim, V.; Koen, M.; Guidovan, H. Personal determinants of organic food consumption: A review. Br. Food J. 2009, 111, 1140–1167. [Google Scholar]
- Van, L.E.; Caputo, V.; Nayga, R.M., Jr.; Meullenet, J.F.; Crandall, P.G.; Ricke, S.C. Effect of organic poultry purchase frequency on consumer attitudes toward organic poultry meat. J. Food Sci. 2010, 75, 384–397. [Google Scholar] [CrossRef] [PubMed]
- Johnston, R.J.; Wessells, C.R.; Donath, H.; Asche, F. Measuring Consumer Preferences for Ecolabeled Seafood: An International Comparison. J. Agric. Resour. Econ. 2001, 26, 20–39. [Google Scholar]
- Nimon, W.; Beghin, J. Are Eco-Labels Valuable? Evidence from the Apparel Industry. Am. J. Agric. Econ. 1999, 81, 801–811. [Google Scholar] [CrossRef]
- Scarpa, R.; Zanoli, R.; Bruschi, V.; Naspetti, S. Inferred and Stated Attribute Non-attendance in Food Choice Experiments. Am. J. Agric. Econ. 2013, 95, 165–180. [Google Scholar] [CrossRef]
- Dransfield, E.; Ngapo, T.M.; Nielsen, N.A.; Bredahl, L.; Sjoden, P.O.; Magnusson, M.; Campo, M.M.; Nute, G.R. Consumer choice and suggested price for pork as influenced by its appearance, taste and information concerning country of origin and organic pig production. Meat Sci. 2005, 69, 61–70. [Google Scholar] [CrossRef] [PubMed]
- Godfray, H.C.J.; Toulmin, C. Food security: The challenge of feeding 9 billion people. Science 2010, 327, 812–818. [Google Scholar] [CrossRef] [PubMed]
- Scarpa, R.; Giudice, R.D. Market Segmentation via Mixed Logit: Extra-Virgin Olive Oil in Urban Italy. J. Agric. Food Ind. Organ. 2004, 2, 1080. [Google Scholar] [CrossRef]
- Liu, Q.; Yan, Z.; Zhou, J. Consumer Choices and Motives for Eco-Labeled Products in China: An Empirical Analysis Based on the Choice Experiment. Sustainability 2017, 9, 331. [Google Scholar] [CrossRef]
- Lancaster, K.J. A New Approach to Consumer Theory. J. Political Econ. 1966, 74, 132–157. [Google Scholar] [CrossRef]
- Hu, W.; Timothy, W.; Sandra, B.; Linda, C.; Wen, Y. Assessing Consumer Willingness to Pay for Value-Added Blueberry Products Using a Payment Card Survey. J. Agric. Appl. Econ. 2011, 43, 243–258. [Google Scholar] [CrossRef]
- Hanemann, W.M. Welfare Evaluations in Contingent Valuation Experiments with Discrete Responses. Am. J. Agric. Econ. 1987, 69, 182–184. [Google Scholar] [CrossRef]
- Grunert, K.G. Food quality and safety: Consumer perception and demand. Eur. Rev. Agric. Econ. 2008, 32, 369–391. [Google Scholar] [CrossRef]
- Muller, L.; Ruffieux, B. Do price-tags influence consumers’ willingness to pay? On the external validity of using auctions for measuring value. Exp. Econ. 2010, 14, 181–202. [Google Scholar] [CrossRef]
- Loomis, J.B. Comparative reliability of the dichotomous choice and open-ended contingent valuation techniques. J. Environ. Econ. Manag. 1990, 18, 78–85. [Google Scholar] [CrossRef]
- Shi, L.; Gao, Z.; Chen, X. The Cross-price Effect on Willingness-to-Pay Estimates in Open-ended Contingent Valuation. Food Policy 2014, 46, 13–21. [Google Scholar] [CrossRef]
- AlvarezFarizo, B. Estimating the Benefits of Agri-environmental Policy: Econometric Issues in Open-ended Contingent Valuation Studies. J. Environ. Plan. Manag. 1999, 42, 23–43. [Google Scholar] [CrossRef]
- Bateman, I.J.; Langford, I.H.; Turner, R.K.; Willis, K.G.; Garrod, G.D. Elicitation and truncation effects in contingent valuation studies. Ecol. Econ. 1995, 12, 161–179. [Google Scholar] [CrossRef]
- Ready, R.C.; Buzby, J.C.; Hu, D. Differences between Continuous and Discrete Contingent Value Estimates. Land Econ. 1996, 72, 397–411. [Google Scholar] [CrossRef]
- Xia, W.; Zeng, Y. Consumer’s Willingness to Pay for Organic Food in the Perspective of Meta-analysis. In Proceedings of the International Conference on Applied Economics (ICOAE), Kastoria, Greece, 15–17 May 2008; pp. 933–943. [Google Scholar]
- Gao, Z.; House, L.A.; Xie, J. Online Survey Data Quality and Its Implication for Willingness-to-Pay: A Cross-Country Comparison. Can. J. Agric. Econ./Revue Canadienne D’agroeconomie 2016, 64, 199–221. [Google Scholar] [CrossRef]
- Gao, Z.; House, L.A.; Bi, X. Impact of Satisficing Behavior in Online Surveys on Consumer Preference And Welfare Estimates. Food Policy 2016, 64, 26–36. [Google Scholar] [CrossRef]
- Amemiya, T. Regression Analysis when the Dependent Variable Is Truncated Normal. Econometrica 1973, 41, 997–1016. [Google Scholar] [CrossRef]
- Yang, S.H.; Ping, Q.; Hu, W.; Liu, Y. Product information and Chinese consumers’ willingness-to-pay for fair trade coffee. China Agric. Econ. Rev. 2014, 6, 278–294. [Google Scholar] [CrossRef]
- Yu, X.; Gao, Z.; Zeng, Y. Willingness to pay for the “Green Food” in China. Food Policy 2014, 45, 80–87. [Google Scholar] [CrossRef]
- Wu, L.; Yin, S.; Xu, Y.; Zhu, D. Effectiveness of China’s Organic Food Certification Policy: Consumer Preferences for Infant Milk Formula with Different Organic Certification Labels. Can. J. Agric. Econ./Revue Canadienne D’agroeconomie 2014, 62, 545–568. [Google Scholar] [CrossRef]
- Van Loo, E.J.; Caputo, V.; Nayga, R.M., Jr.; Verbeke, W. Consumers’ valuation of sustainability labels on meat. Food Policy 2014, 49, 137–150. [Google Scholar] [CrossRef]
Figure 1.
Perception of rice from the rice–fish system.
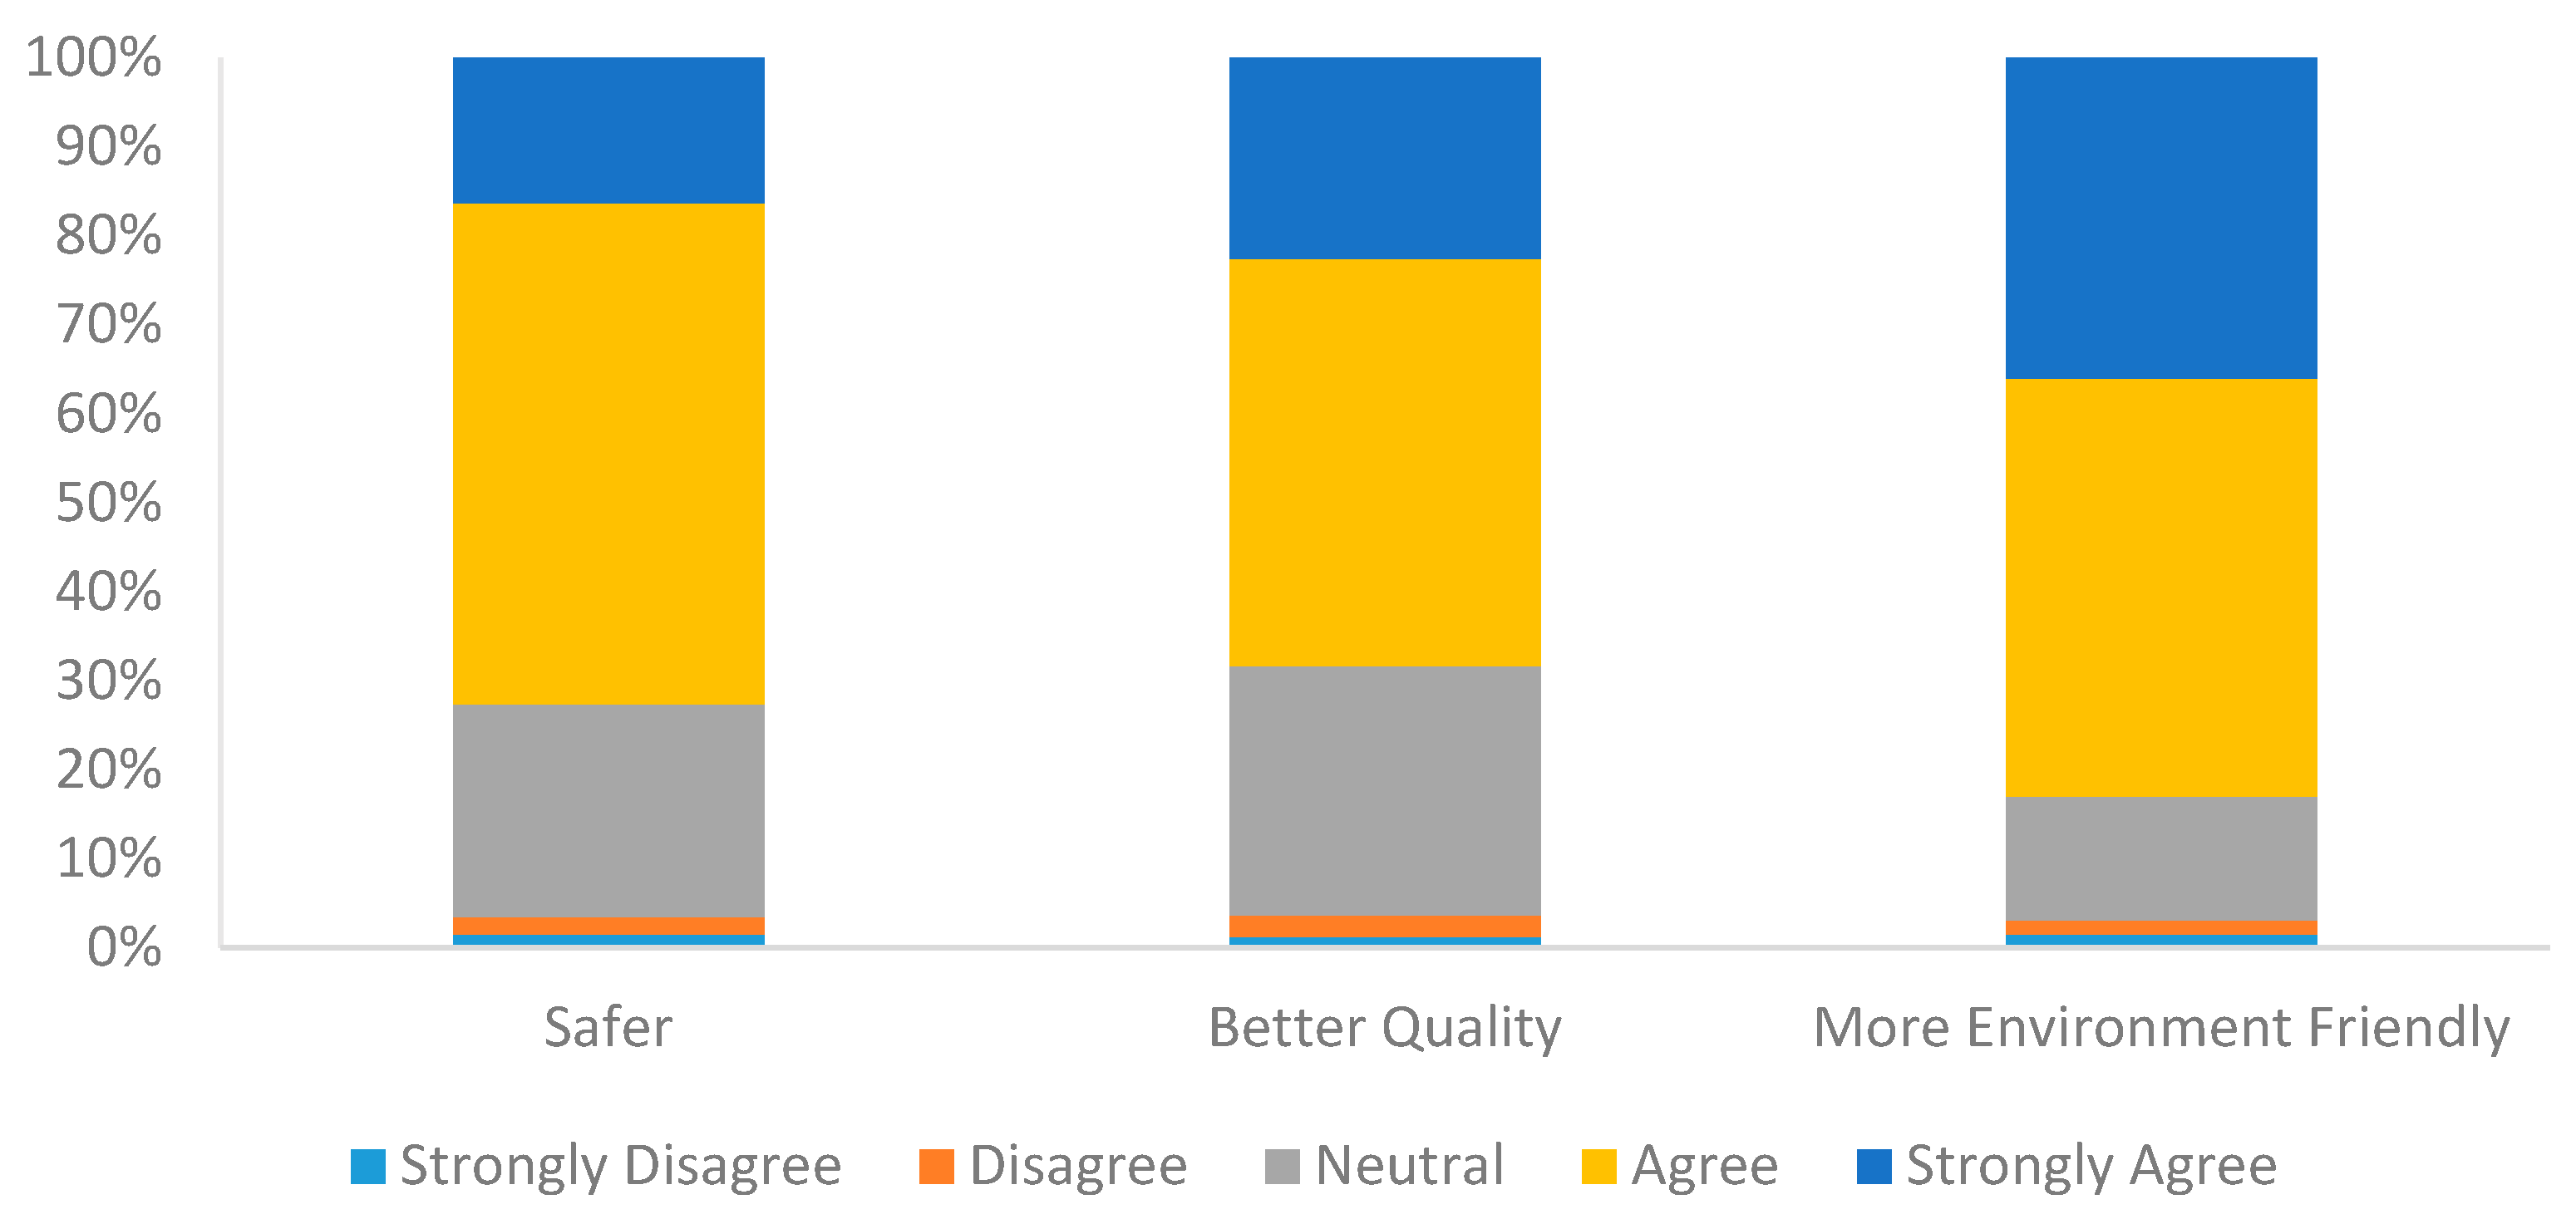
Figure 2.
The percentage of willingness to pay (WTP) for rice from the rice–fish system.
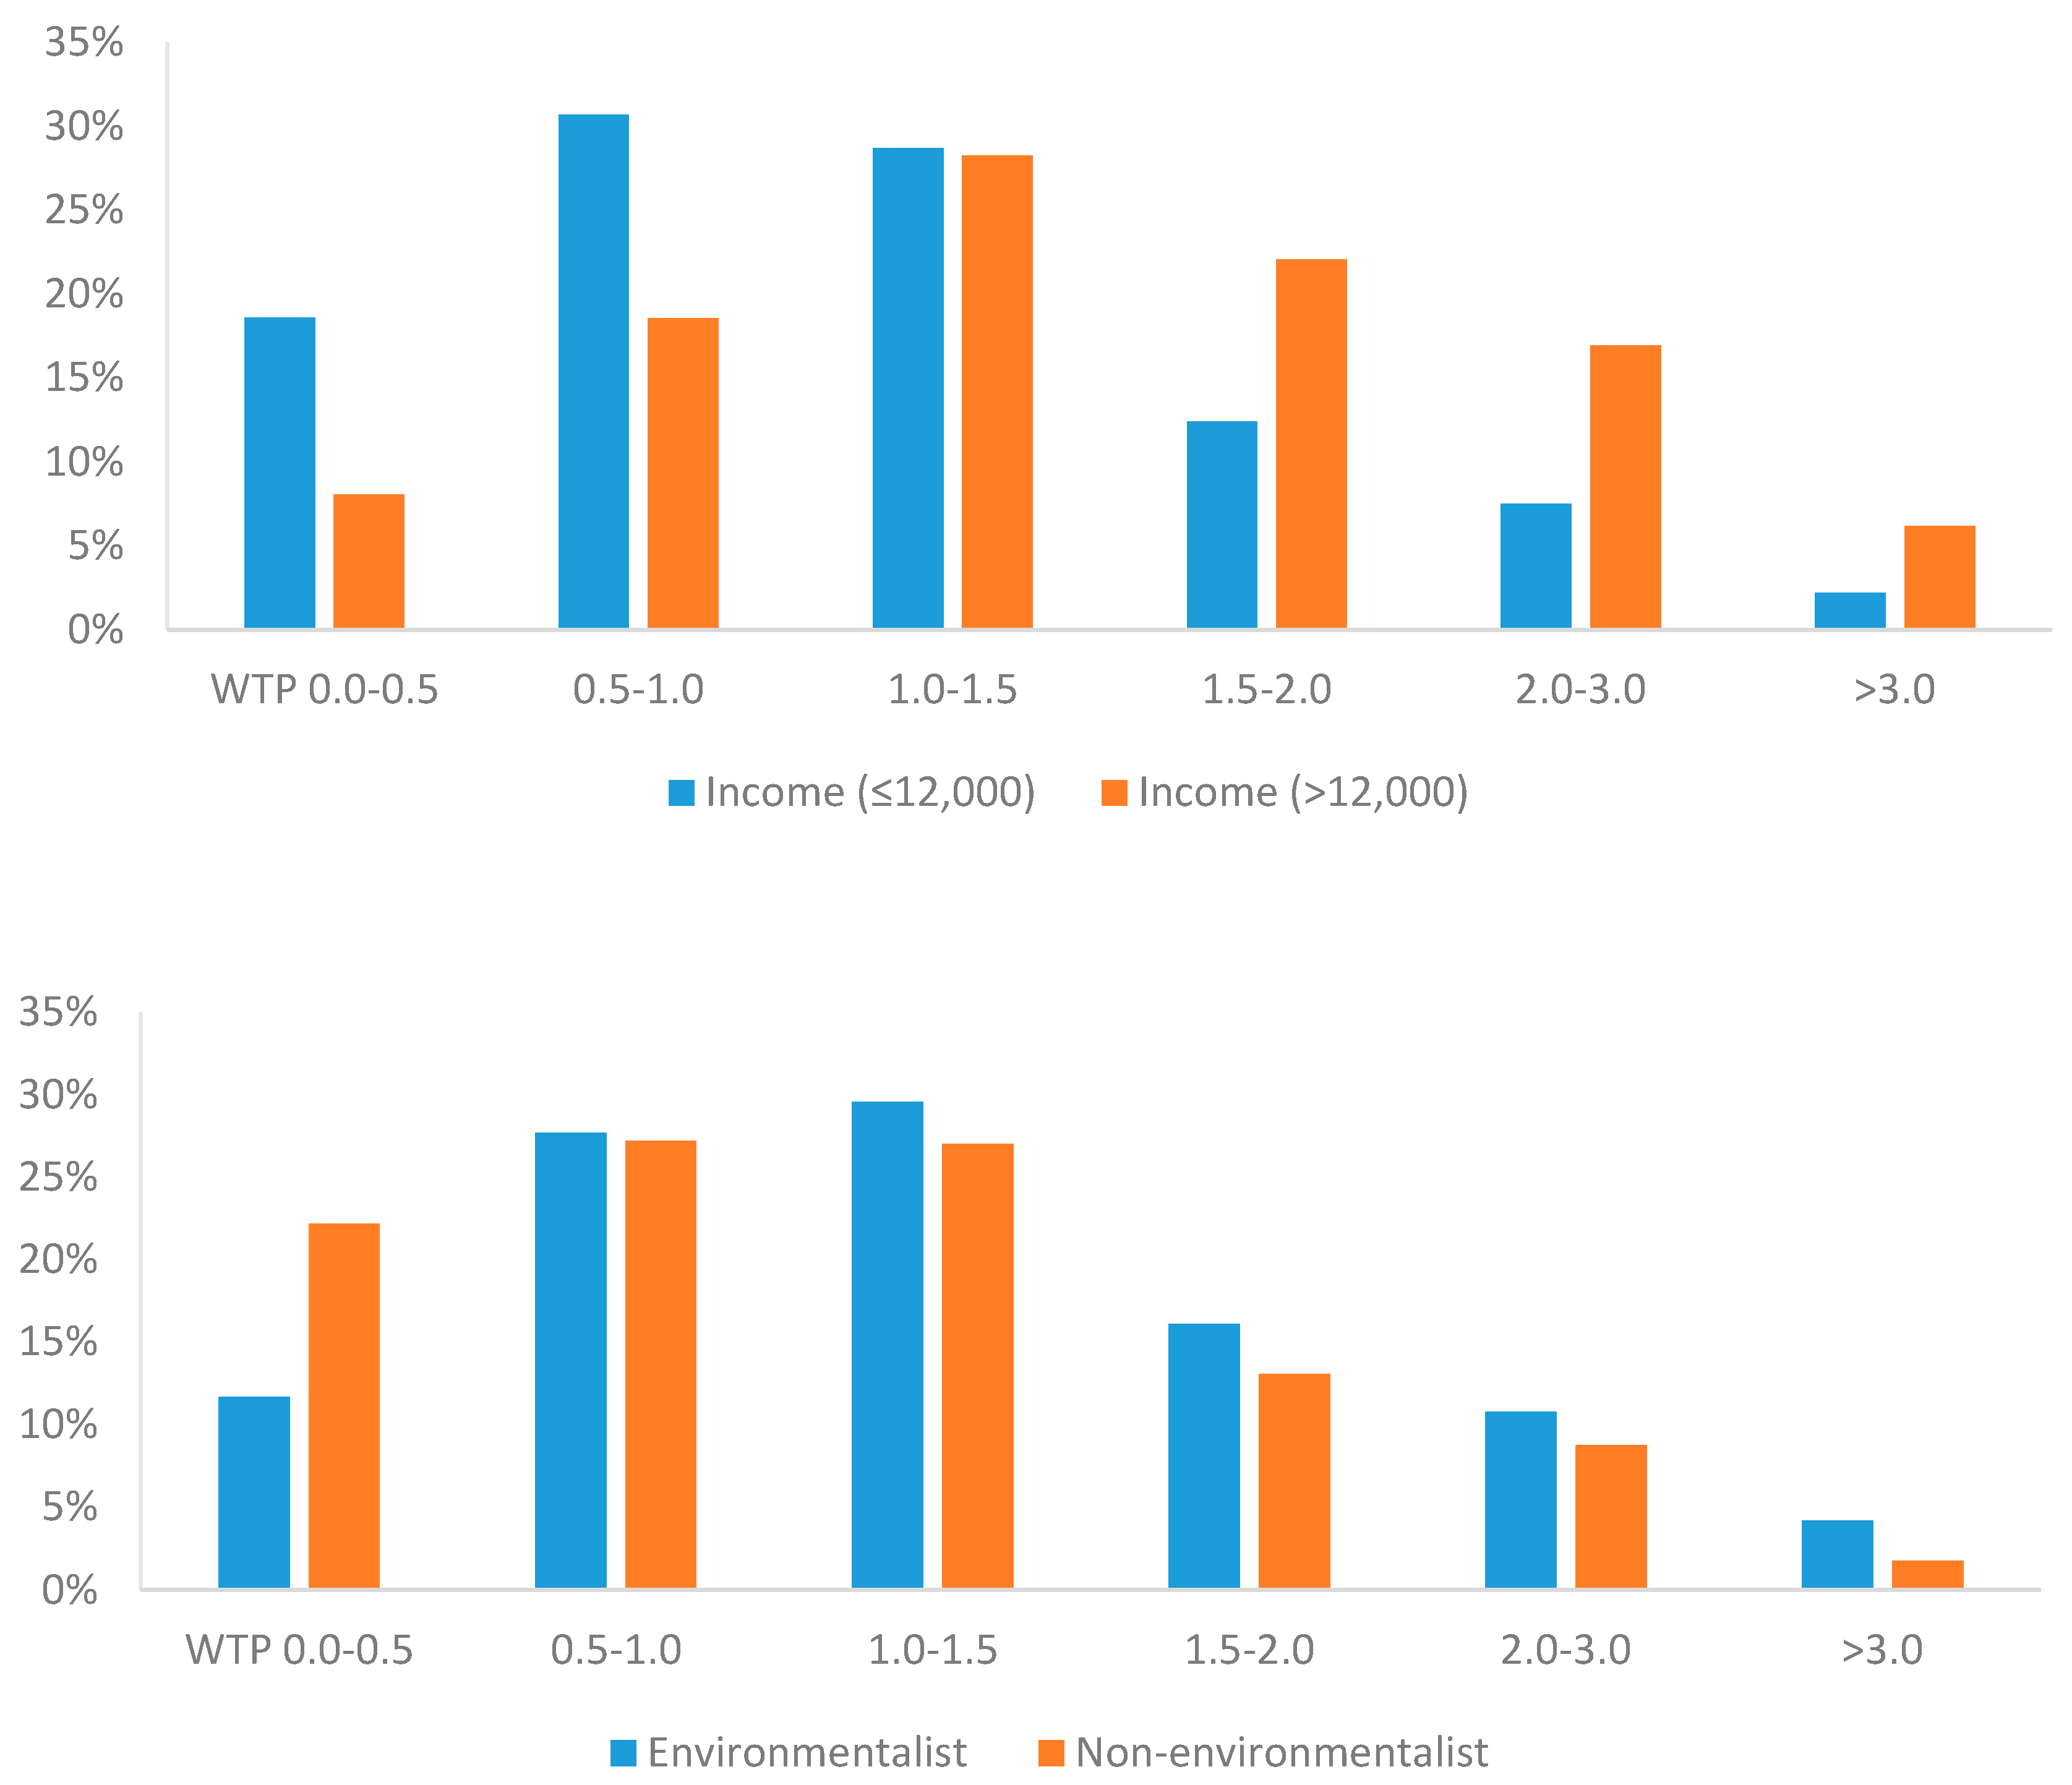
Figure 3.
WTP by socio-demographic characteristics.

Table 1.
The definitions of variables.
| Variables | Definitions |
|---|---|
| WTP | Suppose that the price for conventional rice is 3 yuan/500 g. How much are you willing to pay for rice from the rice-fish system? |
| Environmental Risk Perception | I think the environmental problems is (1 = Very minor, 5 = Very serious). |
| Environmentalist | I am an environmentalist (1 = Strongly disagree, 5 = Strongly agree). |
| Safer | I believe that rice from the rice-fish system is safer environmental friendly (1 = Strongly disagree, 5 = Strongly agree). |
| Better Quality | I believe that rice from the rice-fish system is better quality (1 = Strongly disagree, 5 = Strongly agree). |
| More Environmental Friendly | I believe that rice from the rice-fish system is more environmental friendly (1 = Strongly disagree, 5 = Strongly agree). |
WTP, willingness to pay.
Table 2.
Description of the sample: Socio-demographic characteristics.
| Variables | Categories | Sample Size | Percent Sample (%) |
|---|---|---|---|
| Gender | Male | 667 | 46.91 |
| Female | 755 | 53.09 | |
| Age | Age (≤25) | 230 | 16.17 |
| Age (26–34) | 642 | 45.15 | |
| Age (35–44) | 387 | 27.22 | |
| Age (>44) | 163 | 11.46 | |
| Education | High school degree or less | 183 | 12.87 |
| Bachelor’s degree or Associate degree | 1135 | 79.82 | |
| Post-graduate degree (MS or doctoral) | 104 | 7.31 | |
| Family Income(RMB/month) | Income (<8000) | 345 | 24.26 |
| Income (8001–12,000) | 408 | 28.69 | |
| Income (12,001–16,000) | 297 | 20.89 | |
| Income (16,001–20,000) | 210 | 14.77 | |
| Income (>20,001) | 162 | 11.39 | |
| Has children | No | 349 | 24.54 |
| Yes | 1073 | 75.46 | |
| Sample Size | 1422 | 100% |
Table 3.
Regression results of Interval and ordinary least squares (OLS) regression.
| Parameter | Interval Regression | OLS Regression | ||||
|---|---|---|---|---|---|---|
| Estimate | 95% Confidence Limits | Estimate | 95% Confidence Limits | |||
| Safer | 0.089 * | −0.014 | 0.192 | 0.090 | −0.019 | 0.199 |
| (0.053) | (0.055) | |||||
| Better Quality | 0.109 ** | 0.013 | 0.205 | 0.110 ** | 0.008 | 0.211 |
| (0.049) | (0.052) | |||||
| More Environment Friendly | 0.007 | −0.107 | 0.121 | 0.009 | −0.111 | 0.130 |
| (0.058) | (0.061) | |||||
| Knowledge | 0.050 ** | 0.007 | 0.094 | 0.052 ** | 0.006 | 0.098 |
| (0.022) | (0.023) | |||||
| Environmentalist | 0.064 ** | 0.015 | 0.113 | 0.067 ** | 0.015 | 0.118 |
| (0.025) | (0.026) | |||||
| Environmental risk perception | −0.023 | −0.075 | 0.029 | −0.023 | −0.078 | 0.032 |
| (0.027) | (0.028) | |||||
| Female | 0.071 * | −0.001 | 0.143 | 0.077 ** | 0.001 | 0.152 |
| (0.037) | (0.039) | |||||
| Age | 0.003 | −0.001 | 0.007 | 0.003 | −0.001 | 0.007 |
| (0.002) | (0.002) | |||||
| Income | 0.135 *** | 0.106 | 0.164 | 0.141 *** | 0.110 | 0.171 |
| (0.015) | (0.016) | |||||
| Bachelor’s degree or Associate degree | 0.096 * | −0.017 | 0.209 | 0.094 | −0.025 | 0.213 |
| (0.058) | (0.061) | |||||
| Post-graduate degree (MS or doctoral) | 0.005 | −0.168 | 0.178 | 0.001 | −0.181 | 0.183 |
| (0.088) | (0.093) | |||||
| Has children | 0.115 *** | 0.030 | 0.200 | 0.118 *** | 0.029 | 0.208 |
| (0.043) | (0.046) | |||||
| Intercept | 3.024 *** | 2.697 | 3.350 | 2.993 *** | 2.649 | 3.337 |
| (0.167) | (0.176) | |||||
Notes: *, **, *** denote significance at 10%, 5%, and 1% levels, respectively. Values in parenthesis are standard errors.
© 2017 by the authors. Licensee MDPI, Basel, Switzerland. This article is an open access article distributed under the terms and conditions of the Creative Commons Attribution (CC BY) license (http://creativecommons.org/licenses/by/4.0/).
Share and Cite
MDPI and ACS Style
Wang, E.; Gao, Z. Chinese Consumer Quality Perception and Preference of Traditional Sustainable Rice Produced by the Integrated Rice–Fish System. Sustainability 2017, 9, 2282. https://doi.org/10.3390/su9122282
AMA Style
Wang E, Gao Z. Chinese Consumer Quality Perception and Preference of Traditional Sustainable Rice Produced by the Integrated Rice–Fish System. Sustainability. 2017; 9(12):2282. https://doi.org/10.3390/su9122282
Chicago/Turabian StyleWang, Erpeng, and Zhifeng Gao. 2017. "Chinese Consumer Quality Perception and Preference of Traditional Sustainable Rice Produced by the Integrated Rice–Fish System" Sustainability 9, no. 12: 2282. https://doi.org/10.3390/su9122282
Note that from the first issue of 2016, this journal uses article numbers instead of page numbers. See further details here.