Assessing the Value of Housing Schemes through Sustainable Return on Investment: A Path towards Sustainability-Led Evaluations?


1
City West Housing Trust, Salford M30 0BP, UK
2
School of the Built Environment, University of Salford, Salford M5 4WT, UK
*
Author to whom correspondence should be addressed.
Sustainability 2017, 9(12), 2264; https://doi.org/10.3390/su9122264
Submission received: 15 October 2017
/
Revised: 21 November 2017
/
Accepted: 29 November 2017
/
Published: 19 December 2017
(This article belongs to the Special Issue Sustainable Smart Cities and Smart Villages Research)
Abstract
:The 2016 United Nations (UN) New Urban Agenda clearly reaffirms the concept that sustainable cities require intertwined environmental and social sustainability. The United Nations Sustainable Development Goal (SDG) 11—“Make cities inclusive, safe, resilient, and sustainable”—sets (as a primary target) the provision of sufficient affordable housing. Despite the central role that housing plays in ensuring sustainability and the importance of both environmental and social pillars in ensuring sustainable development, current evaluative methods that support decision making on social housing interventions fail to capture all of the socio-environmental value contained in the UN SDG 11. This paper addresses the issue by demonstrating how Sustainable Return on Investment can successfully describe and analyse a range of externalities related to the sustainable value generated by social housing regeneration schemes. To achieve this goal, a single case study strategy has been chosen. Two extant projects—a high-rise housing scheme and an environmental-led program developed by City West Housing Trust (a nonprofit housing association based in the Manchester area)—have been assessed in order to monetise their social and environmental value through different methods. The findings show that, historically, the environmental and social value of regeneration schemes have been largely disregarded because of a gap in the evaluation methods, and that there is room for significant improvement for future evaluation exercises.
1. Introduction
The concept of sustainable development has been recently re-contextualised by the United Nations (UN) Conference on Housing and Sustainable Urban Development (Habitat III)—held from 17–20 October 2016 in Quito—thanks to the adoption of the New Urban Agenda. The concept of sustainably developing urban areas is clearly related to central social issues, including poverty, health, and housing. Previously, the General Assembly of the United Nations had asserted in the resolution “Transforming our world: the 2030 Agenda for Sustainable Development”, which was adopted on 25 September 2015, that among the 17 Sustainable Development Goals (SDGs), Goal 11—“Make cities inclusive, safe, resilient and sustainable”—sets as its primary target the provision of sufficient affordable housing. Despite the central role played by housing in ensuring sustainability, and the importance of both environmental and social factors in ensuring sustainable development, current evaluative methods that support decision making on social housing interventions fail to capture all of the socio-environmental value generated by these schemes. This shows a misalignment with the internationally recognised sustainability goal UN SDG 11. While consensus exists on the concept of sustainability and its theoretical background, at the operational level, decision makers still struggle with inadequate implementation methods and tools that are incapable of turning policy commitments into real benefits for stakeholders. This paper aims at filling this gap by demonstrating how far a more comprehensive assessment methodology, Sustainable Return On Investment (henceforth: SuROI), allows for a more consistent alignment between the establishment of regeneration schemes and the current concept of urban sustainable development.
The paper firstly discusses the limitations of the most commonly applied assessment methods, and then introduces SuROI in order to pave the way for the calculation of the overall benefits of two case studies. Both case studies are approached with two alternative methods that show how SuROI allows the unveiling of benefits that are related to the wider concept of sustainability. The contribution that the application of the SuROI methodology to the housing sector can bring to the achievement of the SDG mainly relies on quantifying the hidden benefits of housing interventions on stakeholders. As stated by the UN, “common urban challenges include (…) lack of funds to provide basic services, a shortage of adequate housing, and declining infrastructure”. A thorough understanding of the mutual interconnections provided by good housing and its related impacts may influence the willingness to fill some of the current gaps in resources for housing provision. SuROI is therefore suitable not only as a decision-making support tool, but also as a means for facilitating better governance.
Although the evaluation of regeneration schemes has been referred to as a “vital task”, there does not appear to be an agreed consensus on how this should be done. It has been argued that although there is a need to monitor and evaluate regeneration initiatives, there has been “scant regard” paid to this area [1,2], and any evaluations carried out have not had any real effect on wider progress within the field of urban regeneration. Over the years, various authors and scholars have published a variety of methods, models, frameworks, and metrics for evaluating the impacts and results of regeneration. While these reflect different visions of successful urban regeneration, they are not necessarily related to the concept of sustainability. For example, the importance of physical or aesthetic redevelopment has been highlighted [3], whilst economic redevelopment is emphasised [4] and social impact is also referred to [5]. It has been asserted that sustainability appraisal frameworks used in the built environment must address economic, environmental, and social impacts in order to ensure continued sustainable development after regeneration [6]. However, there are gaps in sustainability frameworks in practice [7], and it has been argued that many frameworks sacrifice social and economic factors at the expense of the environment [8]. Some assessment methods have been described as either too diverse from other methods [9], inadequate [10], lacking in important elements [11] or even concerning [12].
Within the housing sector, the Homes and Communities Agency has demanded “robust assessments” of assets [13]. It has also been argued that schemes’ value to society need to be clear in today’s challenging economic environment [14]. Although the need to take both quantitative and more qualitative or intangible impacts into account has been clarified [15,16,17,18], measuring their impacts has remained under theorised [19].
2. Materials and Methods
2.1. Evaluation Methods for the Housing Sector in the UK: Setting the Context
In the United Kingdom (UK), the assessment of urban regeneration strategies has been typically performed through a variety of assessment methods, which have been commonly used to assess the impacts of investment in housing in different programs or initiatives. The following methods, which are mainly related to governmental schemes, will be reviewed: (1) Evaluation Group on Regional and Urban Programmes (EGRUP) Guidance, (2) City Challenge, (3) Single Regeneration Budget, (4) New Deal for Communities, (5) Urban Development Corporations, and (6) Enterprise Zones. These methods will be complemented by the following models: (7) the Hemphill framework and (8) the Sustainable Urban Renewal Project Assessment Model. The purpose of this discussion is to understand how far each method is able to provide enough understanding of the sustainability goals within the housing-led regeneration scheme, in order to guide the selection of two possible methods to compare.
2.1.1. Evaluation Group on Regional and Urban Programmes (EGRUP) Guidance
The Evaluation Group on Regional and Urban Programmes (EGRUP) guidance uses a framework for the ex-post evaluation of expenditure and regeneration schemes and improves the comparability of information on the value for money of regeneration programmes [20]. This framework reinforced Government emphasis at the time on value for money and the public purse [21]. It measures cost effectiveness via a basic cost-benefit account for each regeneration measure concerned. EGRUP uses four proformas within its guidance, which involve general management information about a scheme, quantifiable outputs and their costs, other relevant outputs and their costs, and a measurement of additionality. It focuses on economic efficiency and outlines the inputs, outputs, and outcomes of an urban regeneration scheme. The guidance refers to the importance of using indicators relating to government expenditure, but concedes in Section 3 of the guidance that although all costs can be quantified, some “important” or intangible benefits cannot. Some benefits, such as social benefits for example, are simply listed, rather than being assigned a monetary and quantifiable value. This translates to such impacts not being recorded. In addition, attention is drawn to the users of the guidance that there are issues with “outputs that are essentially unquantifiable” [20]. Environmental benefits were measured quantitatively, but by using a Likert scale. The guidance itself states that there is “clearly a need for a more rigorous approach, which would involve assigning monetary values to the environmental improvements” [20].
2.1.2. City Challenge (CC)
The City Challenge (CC) [22] was commissioned by the Department for the Environment, Transport and the Regions (DETR), and aimed to regenerate 31 areas through regeneration partnerships. It ran in deprived urban areas between 1991 and 1998, and aimed to improve specific rundown inner city areas and the quality of life of local residents in particular [23]. In terms of the evaluation of this scheme, one negative was that there was no one method or framework in place to cover the multitude of partnerships, which makes consistency of evaluation very difficult. The “Final Evaluation of CC” [24] found that there was an enormous diversity of local evaluations, which translated to an insufficient level of consistency to make meaningful comparisons across all areas. A more standardised methodological approach was considered to have been of wider value [23]. Additionally, the evaluations undertaken or commissioned by the partnerships themselves varied significantly in quality, content, and approach. Some chose to assess the effectiveness, efficiency, and impact of a programme, while others concentrated on updating baseline indicators [23]. A key aspect of the schemes supported through the CC programme was their integrated nature. For example, traditional housing improvements were complemented by other regeneration projects concerned with job creation, training, and crime and community safety. However, no method was set up to capture any of this information in a numerical and quantifiable format. The DETR [23] touched on the notion of sustainable development, including a statement that if a regeneration programme was to be regarded as successful, the outcomes it generated must be sustainable in some form. However, it did not mention any method of measuring such aspects of sustainability. Along the same lines, concern was also expressed within the CC Final Evaluation on the lack of monitoring requirements for the quality of outputs or outcomes. Both CC reports focussed on outputs (rather than outcomes or impact) and expenditure in relation to annual targets [25]. Impact indicators formed an integral part of the evaluation approach, but the DoE chose the indicators, rather than stakeholders involved in the scheme in question [26]. Further to this, it has also been cited that although some indicators appear to be covering outcomes, but are actually again measurements of outputs [27]. The focus of the Government at the time was rather a case of what had been done, rather than the impact it had on local communities, meaning that CC was in fact output oriented [26]. This emphasis is shown in the listings of such items as the amount of jobs created, the amount of business and commercial floorspace built or the amount of dwellings improved [23]. The indicators used within the evaluation were only available for specifically quantified aspects. Within the qualitative and more intangible areas, such as the quality of life category, the report stated that there is no standard indicator. In addition, within the unit cost per output statistics [24], values pertaining to health and community and social were simply listed without any figures as “not applicable”, and impacts were simply not measured within the summary cost benefit account [24]. It is additionally admitted within the official final evaluation that “more emphasis should be given to assessing outcomes” [24].
2.1.3. The Single Regeneration Budget (SRB)
The Single Regeneration Budget (SRB) [28] used a cost–benefit, inputs versus outputs approach within the study. Outcomes were measured in terms of indicators in such areas as jobs created or safeguarded, enhanced pupil attainment, the personal development of young people, and community safety initiatives [29]. There were three levels of outcomes involved within the evaluation that cut across the distinction between social, economic, and environmental goals. These were termed delivery (the level of outputs), impact (the level of outcomes), and sustainability, defined as the longer term social, economic and environmental impact over the life of a given partnership. Indicators were used to gauge economic benefits, housing benefits, social benefits, environmental benefits, and community benefits [30], whilst an extensive baseline was also used [31]. Social surveys and structured interviews were used to gauge the opinions of key stakeholders within the SRB partnerships, in combination with an in-depth case study approach [31]. The methodology looked to cite overall net additional achievements; however, it was not able to numerically quantify the holistic sustainable impact of the programme in terms of all three aspects of the triple bottom line. In addition, it is stated that there are problems of comparability in the way the SRB is evaluated [28]. Perceptions about physical and environmental quality and amenity were assessed through resident and visitor surveys according to the methodology of Glennerster and Turner [32] where scores were derived from direct observation [28]. In addition, in terms of the measurement of social aspects such as quality of life, quantified outputs in this area simply enumerate the numbers of new health, sports, and cultural facilities, and the numbers of local people given access to them. It is also stated that it is not thought generally possible to quantify all social effects [28].
2.1.4. New Deal for Communities (NDC)
Each New Deal for Communities (NDC) programme was expected to achieve positive change in relation to six outcomes. Three of the outcomes were intended to improve 39 places: crime, the local community, and housing and the physical environment. Three were intended to improve outcomes for people: education, health, and worklessness [33]. A number of data collation and analysis tasks were central to the national evaluation, the most important of which was the biennial household survey. In 2002, a baseline was established across all 39 NDC areas using a survey questionnaire. This addressed socio-demographic status and attitudinal considerations across all outcome areas. It was based on a random-sample survey design, and used 3, 4, or 5-point Likert scales to quantify the responses [34]. Any change in NDC areas was benchmarked against other deprived, comparator areas. No previous evaluation of any English Area Based Initiative (ABI) at that time had been able to explore questions of net change across all relevant regeneration areas and their residents, for all outcomes, from a common baseline [33]. The NDC programme used shadow-pricing methods to determine value for money, which was the first time that this had ever been done [34].
2.1.5. Urban Development Corporations (UDCs)
According to Imrie and Thomas [35], Urban Development Corporation (UDC) evaluations are performance-related measurements with a limited range of criteria, such as “jobs created and safe-guarded, hectares reclaimed, and quantities of constructed roadway”. The emphasis in UDC evaluations is on value for money, with many commentators asserting that a greater range of non-quantifiable variables should have been accounted for within the scope of the evaluation [36]. Oatley [37] states that performance indicators [were] mainly input, and output measures and “did not provide a complete basis for assessment of how effectively the corporations have achieved their regeneration objective”. A list of such indicators can be seen on page 10 of Oatley [37] showing that social and environmental outcomes are not taken into account via a quantified methodology.
2.1.6. Enterprise Zones (EZs)
The final evaluation of the original enterprise zones (EZs) was carried out in 1995 [38] and assessed the extent to which EZs had generated both additional economic activity and physical regeneration [39]. The evaluation methodology covered an analysis of data, which included annual monitoring data provided by the Department of the Environment, in combination with further data collected by consultants to quantify the additional economic activity generated. Main factors analysed included employment characteristics, the number of firms established, industrial compositions of the firms within the zones, environmental improvements, and the impact on the local property markets [38]. The amount of jobs and costs per job created were highlighted, but the evaluation made a limited assessment of any inward investment into the zones [39]. Interviewers and postal surveys were sent out to local companies to gauge company perceptions of EZ benefits. Lastly, studies were carried out to assess the effects of EZ policy on local property markets, the creation of new economic activity, and the physical environment. There is simply no mention at all within archived governmental documentation of the social and environmental impacts of enterprise zones being quantified.
2.1.7. Hemphill Framework
Hemphill et al. [40] measured sustainability by allocating a points score to indicators within five areas, including: economy and work, resource use, buildings and land use, transport and mobility, and community benefits. Residents and other users within a regeneration area were consulted through questionnaires and structured interviews, and results contributed directly to a points scoring system. Points are allocated to each involved indicator and to each indicator set. Indicators are used to measure the performance of the regeneration scheme against sustainability criteria. However, the authors added that “although it is possible to set indicator parameters for certain regeneration outputs (number of jobs created; amount of private sector investment levered), it is difficult to extend the same rationale to more specific and intangible sustainability criteria (quality of life, community enterprise, and the social economy)” [40].
2.1.8. The Sustainable Urban Renewal Project Assessment Model (SURPAM) Model
The Sustainable Urban Renewal Project Assessment Model (SURPAM) model uses weighted indicators and data from survey and questionnaires. Subsequent factor analysis and analytic hierarchy processes are carried out. All of the indicators fall under the triple bottom line. The model requires input from stakeholders, and can be used to properly plan a prospective urban regeneration scheme. Citizens are able to express opinions on the design of a particular proposal before it becomes a reality, with scores being expressed through the multiplication of the weight of a design criterion by the score indicating the performance of a scheme with respect to an individual criterion. However, the authors cited that the model struggles to measure subjective topics such ‘sense of community’, as it “was impossible to develop relevant quantitative indicators”. As a best fit, the authors solve this issue by using both cardinal and ordinal scales as well as Likert scales [16].
2.2. Assessing the Value of Regeneration Schemes through the SuROI
Sustainable Return on Investment incorporates such frameworks as Social Return on Investment (SROI) or ecosystem services analysis (ESA) [41], and places a numerical value on the social and environmental components of the triple bottom line. These aspects are normally difficult to compare against more easily measured economic impacts [42]. Other authors describe the difficulty of measuring the social ‘pillar’ due to its abstract nature, and warn that it could be overshadowed by the economic and environmental domains [43,44,45]. Xing et al. [46] state that one of the main challenges can be a difficulty in the measurement of what they term “apples and pears”, which is to compare the measurement of costs and values that are expressed in different units. The SuROI method solves this issue. Recent guidance from the Royal Institution of Chartered Surveyors [47] recognises the need to include a wider range of factors that can influence the value of built environment projects, and asserts that sustainability considerations are now considered important when undertaking valuations [41]. In the UK, the Public Services (Social Value Act) 2012 additionally requires that economic, environmental, and social benefits are taken into consideration as part of any procurement processes, showing that the focus on sustainability is perhaps starting to change and become more important at a national level.
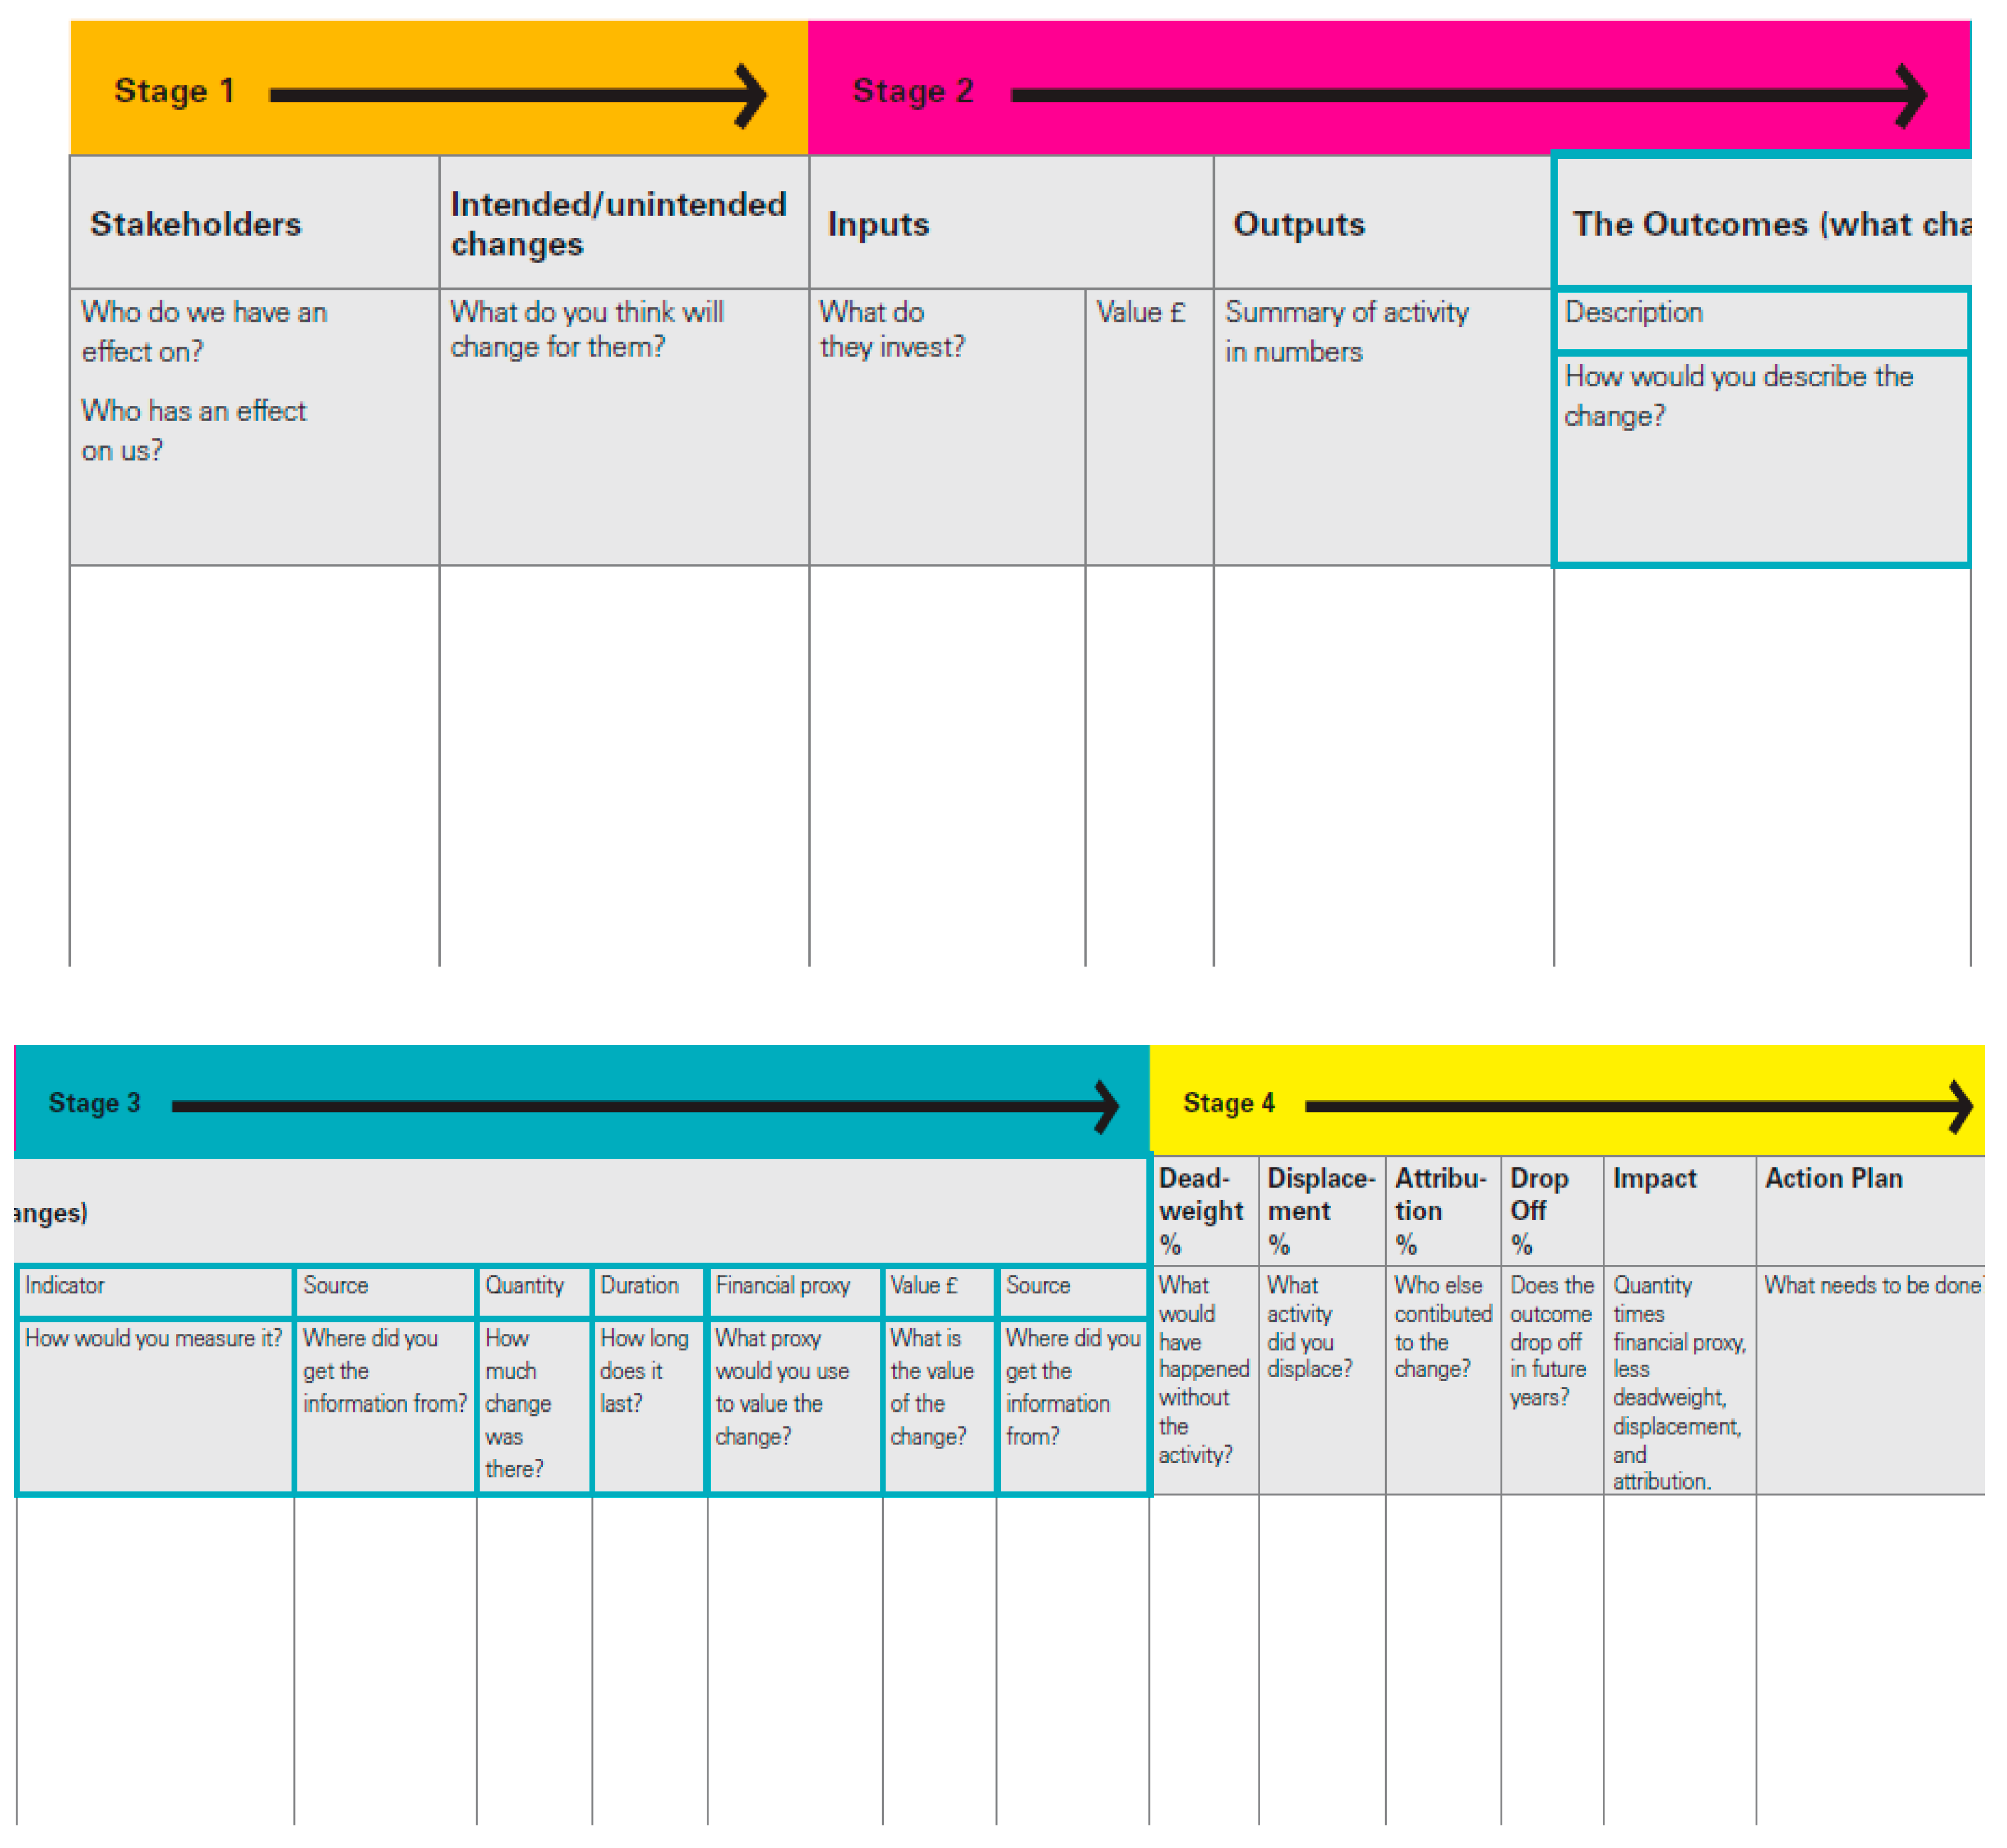
There are five stages involved in a SuROI calculation. Four stages can be seen within the parameter of the impact map (see Figure 1 below), in spreadsheet format, while the final stage involves the calculation of the return on investment ratio. Stage one of the process involves the establishment of a project’s scope. This includes making the aims and objectives of a project explicit, including “features of the scheme that it is appropriate to measure” [48], and intended/unintended changes arising from a project [49]. The identification of relevant and affected stakeholders who influence a project and/or who are affected by it is additionally carried out. Nicholls et al. [49] and Bichard [41] cite the importance of involving stakeholders at this stage. Once stage one is complete, stage two of the impact map involves the identification of impacts, the valuing of inputs, and the clarification and description of outputs involved. Nicholls et al. [49] explain that understanding the cost of the scheme (inputs) leads to directly to both the number (outputs) and nature (outcomes) of the resulting impacts on stakeholders.
Stage three involves gathering evidence of what changes. This stage involves fieldwork and desk-based research to better understand the type and magnitude of the outcomes and their relevant monetary values [50]. At this stage, interviews, focus groups, questionnaires, or workshops can be held with stakeholders who are materially affected. Outcomes are then determined and their effects quantified using verifiable monetary values attached to each outcome. The monetary values (proxies) can be gleaned from primary data; academic, public or social enterprise literatures [48] or existing social value assessments or datasets such as the Housing Associations Charitable Trust (HACT) database of well-being valuation [51] or the Global Value Exchange [52]. The “total incidence of impact multiplied by the proxy determines the value created by each outcome for a specific user group in a single year” [48]. The duration of an impact is also highlighted within this stage.
Stage four involves adjustments to the gross social value sum by considering counterfactuals such as deadweight, displacement, and attribution. The figure is then adjusted for inflation if the impact takes place over a period longer than one year [49]. This enhances the validity of the calculations and impact [41] and “allows adjustments to be made to the initial valuation, ensuring it provides a reasonable representation of new impact” [48]. Stage five involves the calculation of the SuROI by dividing the net present value by the value of inputs. The ratio does not express financial value, but is instead a comprehensive way of expressing the “currency” of social value [53].
Sensitivity testing at the end of the process guards against any possibility of over claiming [49]. The sensitivity analysis is used to ensure the validity of findings. Royal Institution of Chartered Surveyors (RICS) guidance recommends that financial appraisals have a full sensitivity analysis carried out prior to reporting and that any counterfactuals are examined to ensure validity.
3. Results
3.1. A Comparison across Different Methods in the Light of the Sustainability Principles
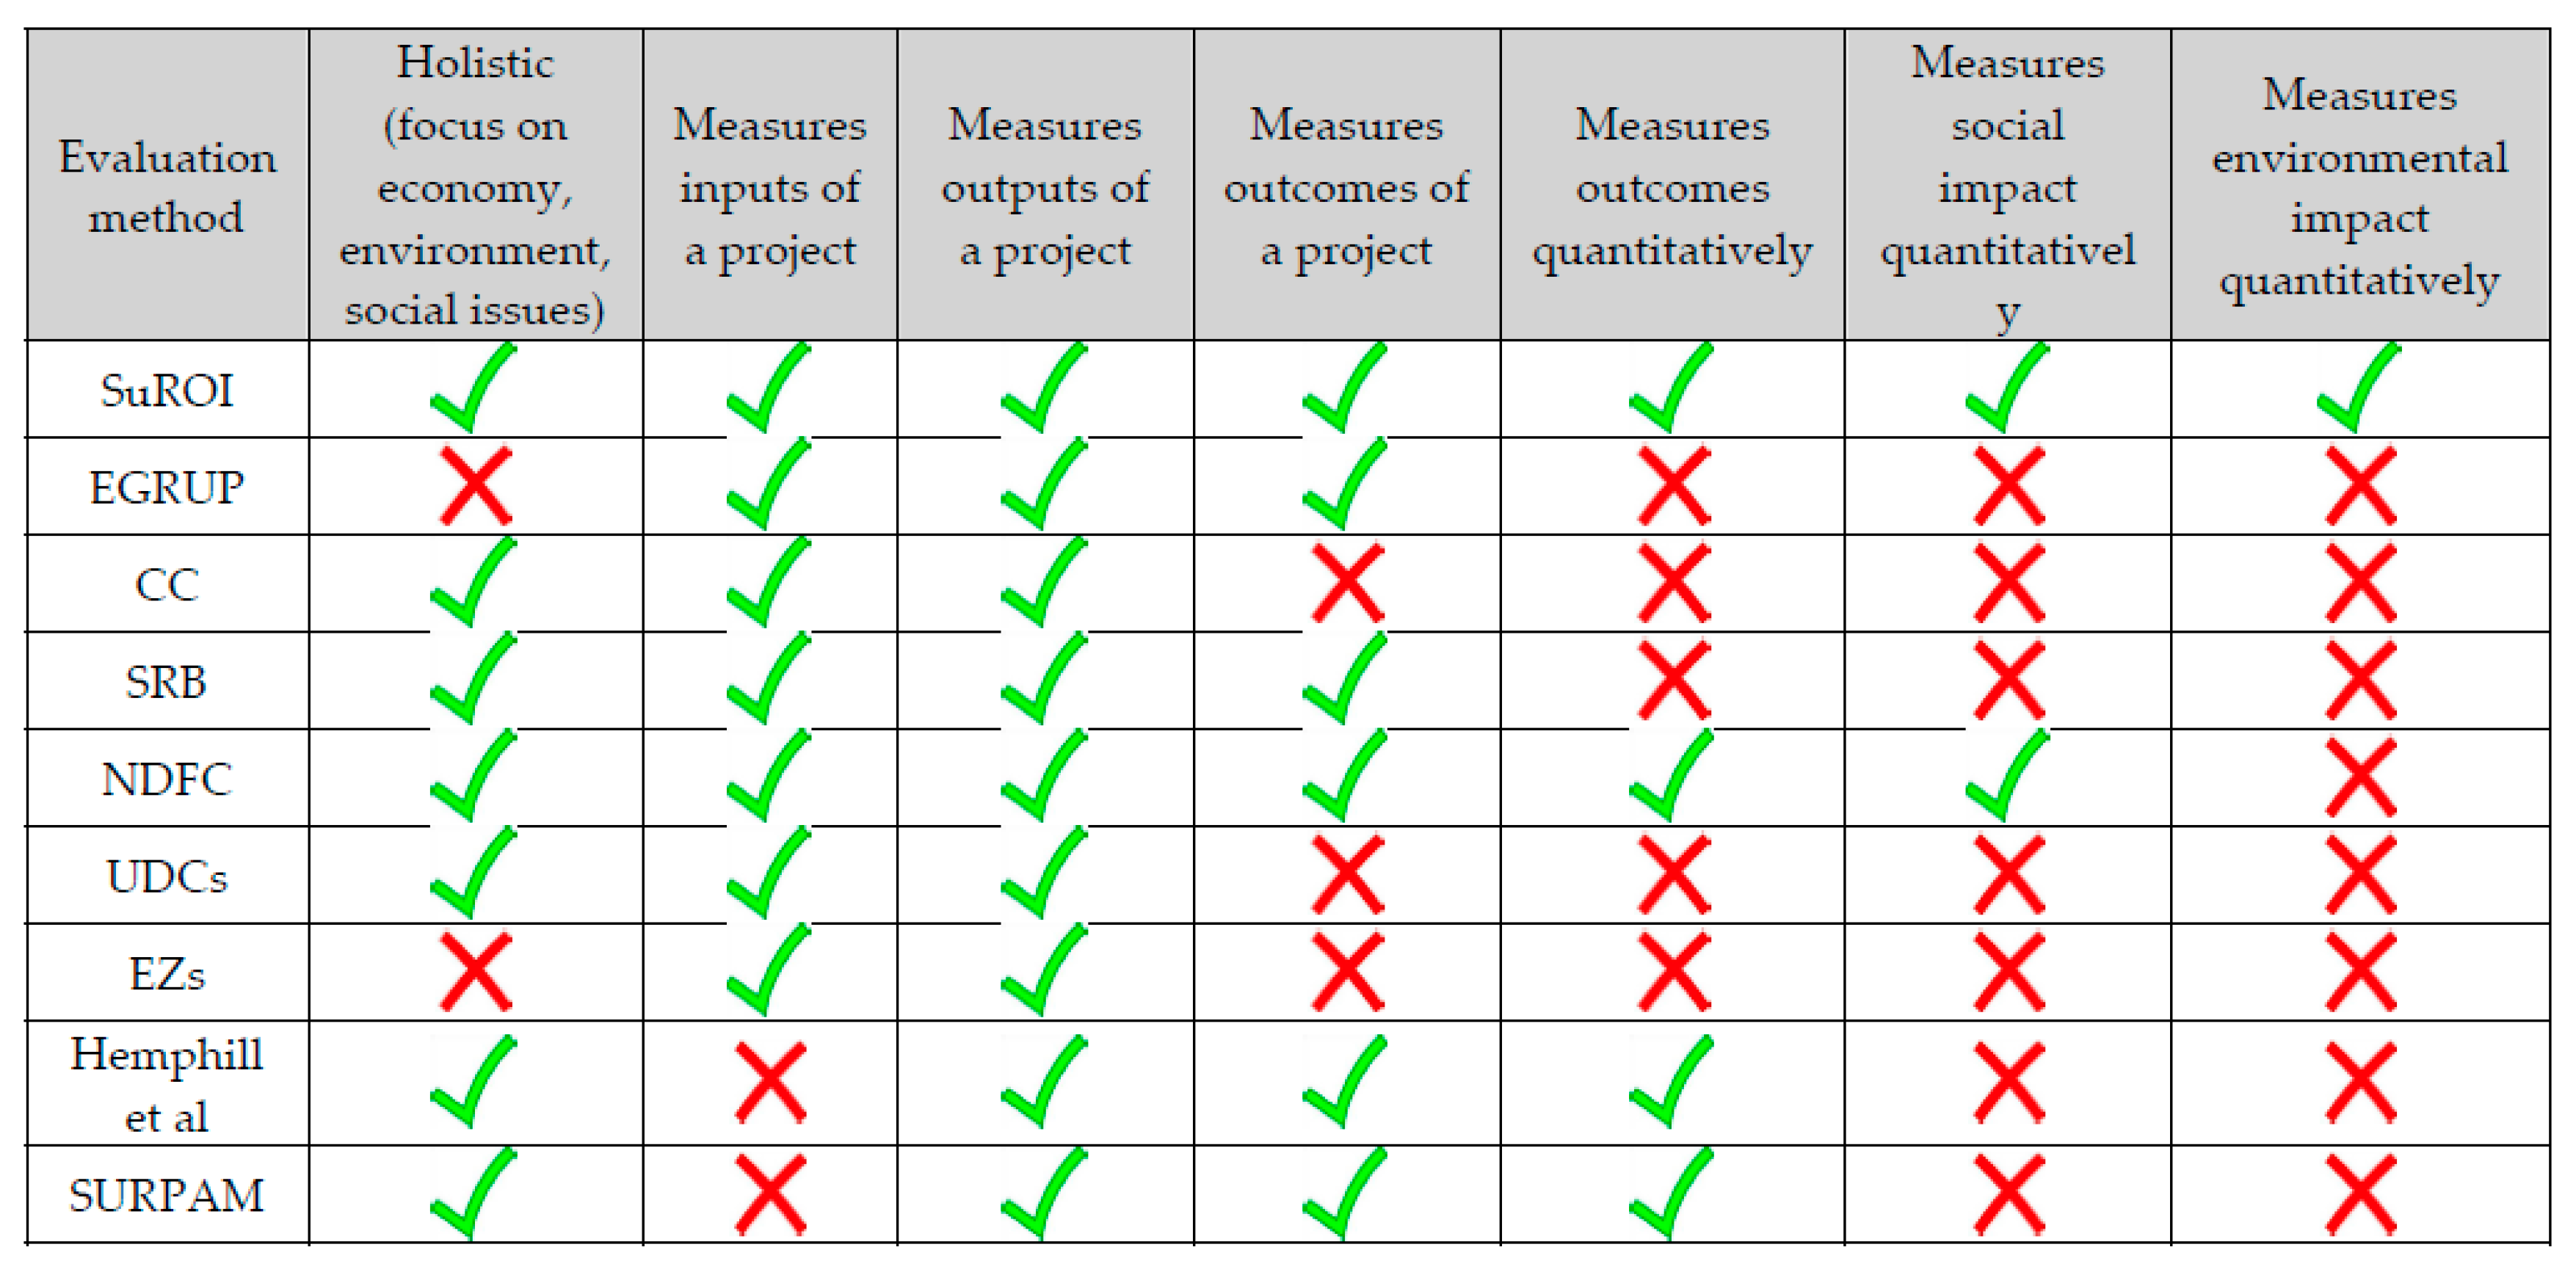
The review of assessment methods and tools discussed in the previous section allows the assertion that, despite there being previous tools within the field of urban regeneration which have evaluated urban regeneration schemes, there appear to be none that fully take into consideration the hidden social and environmental benefits of a scheme. SuROI aims to allow the environmental and social value of a project, programme, or policy in the built environment to be made explicit through evidence, and be added to capital costs to give an overall sustainable value [41]. SROI compares the prospective social benefits of a particular scheme against its costs, and ESA takes the costs and benefits of the environment into consideration. ESA covers both the natural and built environment, including architectural aspects, within its definition [54]. SuROI is heavily influenced by SROI (Social Return on Investment), and incorporates the Social Value UK impact map as its framework [41]. Although SROI takes only social value into account, amendments to SROI [41] outline that environmental value can also be taken into account, and such quantifiable impact can be input into the impact map framework format, thus providing a more sustainable impact calculation than SROI otherwise would. The impact map requires inputting details and figures into its spreadsheet format to ultimately arrive at the final quantitative impact ratio of a project. Such details include the establishment of stakeholders (those who influence the project), inputs (costs of the project), outputs (number of units of delivery), and outcomes (predicted/stakeholder change) [48]. The approach attributes financial value to inputs and outcomes [53]. Financial proxies are used to estimate the value of non-traded and non-market goods. Figure 2 draws from the discussion of the assessment methods commonly used to assess regeneration schemes in the UK so far, in order to check their capability of addressing the different aspects of sustainability. The analysis clearly shows how the SuROI is the only method that explicitly allows encompassing both the social and environmental outcomes of a given scheme, which are equally considered in terms of quantifiable impacts. With respect to SDG11, it therefore allows contributing to meet in full the aspiration to “make cities inclusive, safe, resilient, and sustainable”. This objective is embedded into a holistic vision of sustainability encompassing economic, environmental, and social issues (the first criterion in Figure 2), and complemented with a systematic appreciation of all the values considered in the process (following criteria in Figure 2).
3.2. Quantifying the Sustainability Gap: A Comparison of SuROI and SRB
Figure 2 shows a comparison between each of the reviewed assessment methods. While they share some of the criteria, only SuROI contains all of the factors mentioned by the authors. Particular attention should be paid to the comparison between SuROI and the Single Regeneration Budget (SRB). The choice of the Single Regeneration Budget (SRB) as comparator is motivated by a variety of reasons. SRB projects were subject to a considerable amount of monitoring and evaluation [55]. SRB has been responsible for a huge amount of expenditure across the UK (£26 billion in the 1990s) [56], it is holistic in approach [57], and the review of the SRB conducted from the Department of Land Economy at Cambridge University [31] had been referred to as the most extensive piece of evaluation work on the impact of urban regeneration interventions [31] with a substantial evaluation framework [28]. Indeed, the SRB application spans over quite a long period, running from 1994 until 2004 as part of a package of measures to make Government activity more responsible to local needs and priorities in England. There was also an encouragement of mainstream service deliverers to focus more resources on deprived areas. Additionally, it was more flexible than previous Government-led initiatives, in that it could vary according to size and geography. A hands-off management approach was also a common feature, with local partnerships being responsible for the management of their own regeneration schemes [31]. There is a great deal of information available regarding the evaluation of the many SRB schemes carried out, including many reports, case studies, and annexes.
In order to more comprehensively compare SuROI and SRB, both methods have been applied to two extant housing-led regeneration schemes, which were selected from the portfolio of a housing association based in northwest England. The City West Housing Trust (CWHT) is a not-for-profit housing association based in West Salford that owns and manages over 14,600 homes in northwest England. It launched in October 2008 following a stock transfer from Salford City Council. Almost £250 million has already been invested in homes and neighbourhoods, and further major projects are underway. However, these projects work against a backdrop of difficult economic times. The two sub-case studies to be covered within this paper have been chosen due to the range of housing types on offer, the amount of community engagement carried out with stakeholders by the CWHT, and the potential for future research. Both cases have been investigated by analysing internal reports and documents, and by interviewing selected key informants from the CWHT.
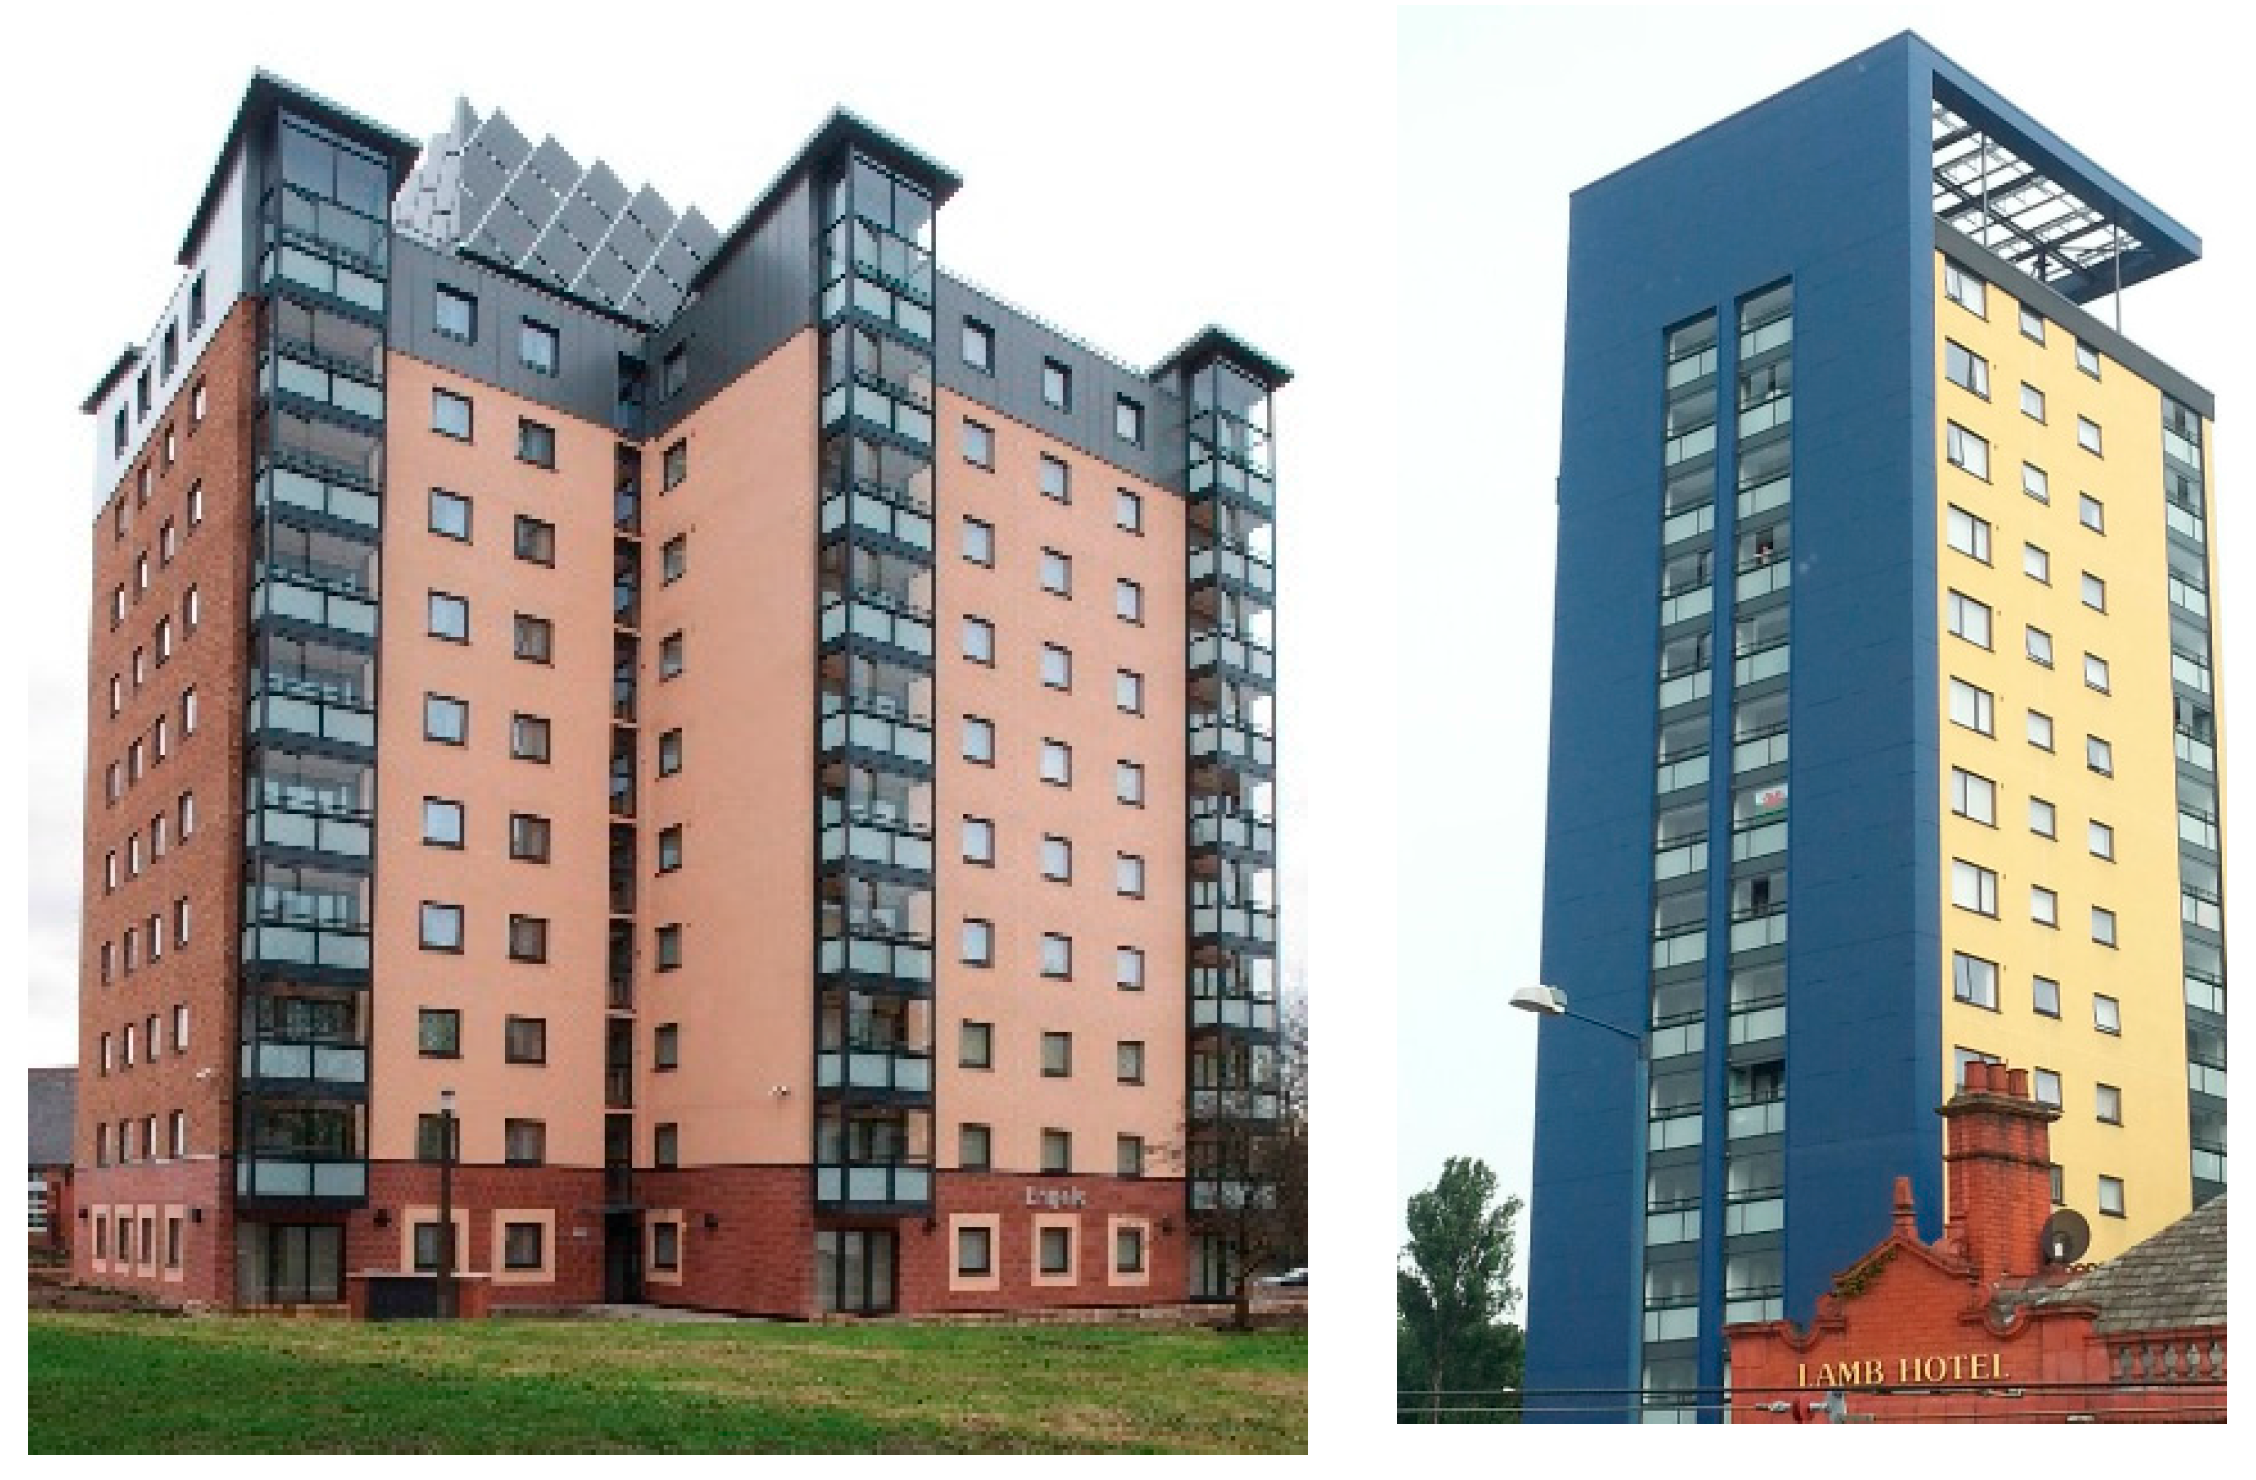
The first case study is a high-rise scheme. The CWHT has invested £43.2M to improve 666 high-rise flats across nine blocks in Eccles, Salford. Improvements include thermal cladding, enclosed conservatory balconies, self-cleaning windows, and new lifts, whilst internal improvements include remodelling to provide an open plan living spaces as well as new kitchens, bathrooms, security doors, and heating and ventilation systems. Figure 3 and Figure 4 show before and after photos of the high-rise blocks.
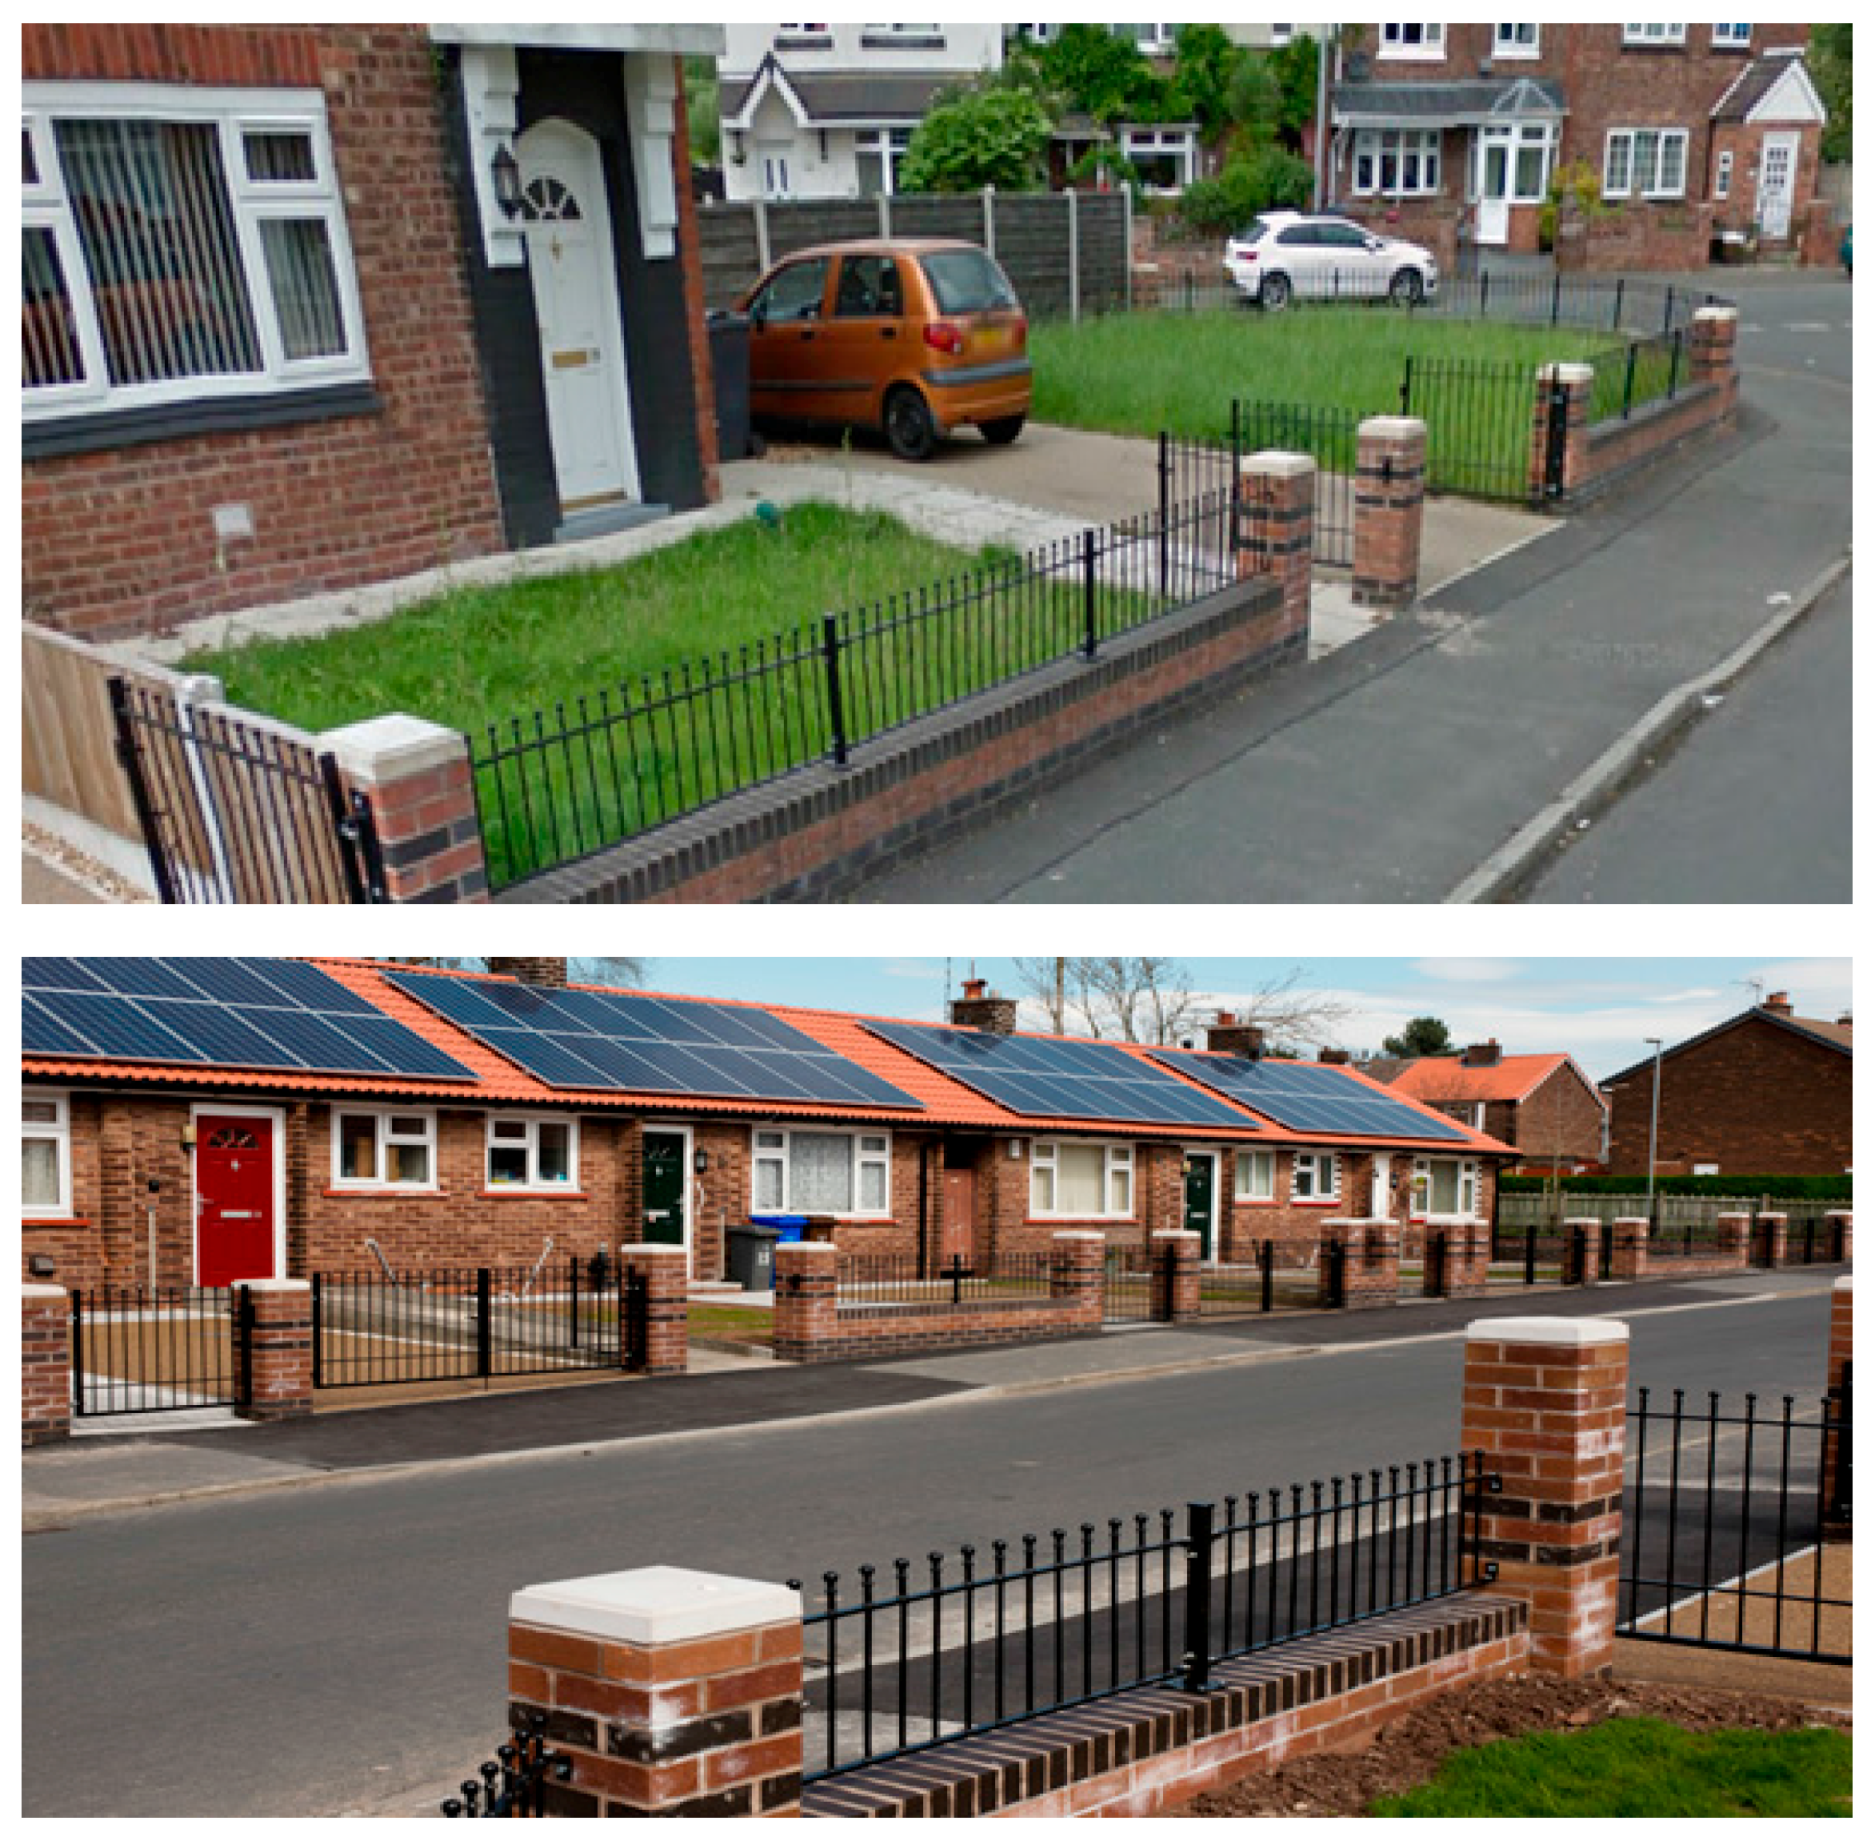
The second case study is an environmental scheme. During 2014/15, the CWHT delivered high-specification environmental improvements to 476 customer homes. These improved the physical appearance of neighbourhoods, enhanced property security, and provided off-street parking. Figure 5 and Figure 6 show photos of before and after the works.
As anticipated, both schemes have been assessed twice, by adopting the SRB and the SuROI methods, thus allowing a comparison of the numerical values. The SRB overall impact of the projects has been assessed through the following steps: (1) Obtain information on the activities and gross outputs associated with the SRB projects and the expenditure incurred disaggregated by key funding source; (2) Assess the additionality of SRB projects using five categories: negligible, low, medium, high, and very high additionality; (3) Assemble other information for the relevant projects relating to intended beneficiaries, displacement, substitution, and leakage effects. Meanwhile, the SuROI was calculated by applying the scheme in Figure 1.
The tables in Appendix A show: (1) the calculation of the benefits from the environmental scheme and from the high-rise scheme investments following the SRB approach; (2) the spreadsheet for the environmental scheme investment following the SuROI (split into stages due to the size of the calculation spreadsheet); and (3) the spreadsheet for the high-rise scheme investment following the SuROI (split into stages due to the size of the calculation spreadsheet). The results of the comparison show that while the SuROI valuation for the projects came to £25,776,603.30 + £43,362,504 = £69,139,107; while the SRB valuation came to £4,255,000 + £10,150,912 = £14,405,912. This suggests that the SRB approach undervalued the benefits of the same regeneration schemes by almost £55M compared with the SuROI method.
4. Discussion
The evaluation of both the environmental and high-rise schemes cited, using the SuROI approach as compared with the SRB approach, highlights how different conclusions on respective impacts of schemes can be gleaned simply by using two different evaluation approaches. It would have been ideal to carry out a direct comparison of the two evaluation approaches on each of the two schemes as part of an analysis. However, this simply cannot be done, because the traditional SRB method of evaluation simply does not pick up on the social and environmental impacts that the SuROI approach does. In addition, each method of evaluation does not follow the same structure or methodology. Consequently, in order to show a comparison between the two approaches, it was felt that the most comprehensive way of going about this would be to list the benefits of both approaches (SuROI against SRB), thus showing the gaps in the SRB and quantifying the differences by considering those items that appear only in the SuROI impacts, and not in the SRB approach.
Whereas items such as “intended beneficiaries” or “activities” are listed within the SRB evaluation, they are left out and not compared with the SuROI approach. The central argument and defence of this stance centres on the notion that if you cannot quantify something, you cannot measure it. This is the same stance we have taken elsewhere within the paper. Since our focussed evaluation approach of SuROI is a method that by its very essence quantifies, thus subsequently enabling comparisons between items that were previously difficult to compare, it was felt that in order to ensure consistency in approach, we should use the same stance to gauge the difference in impact between the two evaluation approaches. Consequently, any aspect of the SRB approach that could not be quantified was left out, and this resulted in the direct and quantifiable comparisons between the two evaluation approaches on each scheme, as seen in the tables in Appendix A.
In terms of the quantifiable outputs, the difference in value recorded for the environmental scheme was £6.06 for every £1 invested, and that the ratio was £0.23 for every £1 invested. These figures are significant, and are increasingly significant the more money is invested in a scheme. In terms of the types of data analysed: scheme expenditure and the details of quantities of works carried out were recorded, staff salaries and officer time were factored in terms of scheme inputs; customer surveys were used for primary data that assessed impact, the detail of which could be used within both the SRB and SuROI approaches; lastly, monetary values were used based on a suitable financial proxy [49] from a variety of respected statistical sources, including the Global Value Exchange (GVE), the HACT database, and a wide variety of City West Housing Trust company statistics. Such statistics included investment scheme costs, fuel bill amounts saved by tenants, and the amount of rent received as income by City West Housing Trust. Some observations can be gleaned from the comparison between the SRB evaluation and the SuROI approach. Within the SRB, there appears to be a lot less information on hand from which make strategic decisions or conclusions on the level of impact of a given scheme. In comparison, because the SuROI method in effect “makes the invisible visible”, previously intangible areas become tangible, meaning that more information is readily available to decision makers, which in theory will increase the accuracy of decision making in the field of housing-led urban regeneration. Additionally, not all of the impacts of a scheme are going to be quantitative. The SRB-led methodology quantifies qualitative values in terms of the change in numbers of respondents or the percentage change of the response. This provides accurate information from directly involved stakeholders, but this perhaps does not bring enough supporting data into play. By utilising the SuROI method, further indicator sets and proxies brought about by tapping into sometimes thousands of responses again provide much more information, which in theory increases the accuracy of the impact and the accuracy of any subsequent strategic decision making.
5. Conclusions
In conclusion, the SuROI approach allows conclusively measuring the clear-cut, holistic, and sustainable impact of a scheme. There is no clear-cut, quantifiable, and easy-to-understand ratio depiction of the impact or change promoted by a scheme within the SROI approach, whereas within SuROI, this is a fundamental part of the conclusion to the process. The SuROI approach can use many different tools within its framework to gauge the various impacts, from social benefits to well-being to environmental benefits. This makes SuROI a highly flexible and integrated approach. This level of flexibility and integration does not appear within the traditional evaluation. To ensure consistency in approach, SuROI’s following of the Social Value SROI guidance principles brings a level of discipline to an evaluation that does not appear to be present with the traditional evaluation approach involved with the SRB method. Lastly, with the SRB methodology, it would not be possible to predict the effects of a housing-led urban regeneration scheme that is planned for the future. With the SuROI approach, because of the amount of data the method taps into, an accurate assessment could be gauged to again help strategic decision making.
The case study allowed identifying the gap that exists in terms of current evaluation methodology in the light of the sustainable development goals and how far an alternative innovative method, the SuROI, can support overcoming it. While environmental and social spillovers are largely disregarded because of a gap in the evaluation tools, implementing a more holistic and comprehensive methodology such as SuROI to the housing sector [58] can be extremely beneficial in regard to being able to capture those hidden benefits and emphasising the targets achieved on the sustainable development goals.
Acknowledgments
The empirical data discussed in this paper have been gathered as part of the PhD dissertation of the first author and have been presented to the conference: AMPS, Living and Sustainability, London South Bank University, 9–10 February 2017.
Author Contributions
Erik Bichard conceived the SUROI methodology, hypothised its importance to the social housing sector; he revised the paper and the conclusions; Claudia Trillo provided the conceptual framework to link the SuROI to the Habitat III framework and to assess the different evaluative tools; she wrote the abstract and part of the introduction; Kevin Dean contextualized the concepts in the case studies, collected and analysed the data; he wrote the Section 2, Section 3, Section 4 and Section 5 of the paper and part of the introduction. Both the paper rationale and the revisions following the reviewers’ comments were discussed jointly by the three authors.
Conflicts of Interest
The authors declare no conflict of interest.
Appendix A

Table A1.
Comparison between SRB and SuROI in the City West Housing Trust (CWHT) high-rise scheme.
| SRB | Values | SuROI | Values |
|---|---|---|---|
| Expenditure | £43,362,504 | Inputs | £43,362,504 |
| Activities and outputs | 666 high-rise flats refurbished and 36 h per week worked per staff member as a minimum | Outputs | 666 high rise flats refurbished and 36 h per week worked per staff member as a minimum |
| Key outcome indicators and related baseline | Physical/aesthetic improvement: Customer rating on appearance of blocks after works: 85% (increase of 74 responses) | Outcomes, Indicators, proxies and source | Physical/aesthetic improvement: Customer rating on appearance of blocks after works: 85% (increase of 74 responses) |
| Living space improvement: Customer rating on quality of living space: 86% (increase of 49 responses) | |||
| Improve security: Customer rating on quality of security: 81% (increase of 52 responses) | |||
| Improve community pride: Customer rating regarding feelings of pride amongst customers: 85% (increase of 36 responses) | |||
| Ensure that customers have decent homes with affordable warmth: 93% now consider flat to be affordable (increase of 75 responses) | |||
| Average annual fuel saving bill due to affordable warmth improvements (£460 per property) | |||
| Customer rating of heating as being affordable or flat requiring little or no heat 93% (112 responses out of 121) | |||
| “Average annual spend on repairs and maintenance of a home (per household)” (£187,146) | |||
| “Not worried about crime for individuals” (£638,271.40) | |||
| “Good neighbourhood” (£129,278) | |||
| “Quality of life for health services (the state) (per person)” (£980,000) | |||
| “Feeling part of the community” (£487,200) | |||
| Active in tenants group (conservative estimate of 10%) (£56,812) | |||
| Well-being value for improved neighbourhood (£199,610) | |||
| Well-being value for improved health (£479,712) | |||
| Living space improvement: Customer rating on quality of living space: 86% (increase of 49 responses) | Cost to CWHT per ASB case (£629) | ||
| Improve security: Customer rating on quality of security: 81% (increase of 52 responses) | Housing, fuel, and power expenditure per household (£6,764.80) | ||
| Improve community pride: Customer rating regarding feelings of pride amongst customers: 85% (increase of 36 responses) | Financial comfort (£62,419) | ||
| Ensure that customers have decent homes with affordable warmth: 93% now consider flat to be affordable (increase of 75 responses) | Regeneration improvement to local area (per person) (£4,329,000) | ||
| Average annual fuel saving bill due to affordable warmth improvements (£460 per property) | Rent figure per year (£2,546,784) | ||
| Customer rating of heating as being affordable or flat requiring little or no heat 93% (112 responses out of 121) | Cyclical costs (£47,286) | ||
| Value in currency—quantifies with common unit | £52,426,585.34 | ||
| Deadweight | 0 | ||
| Displacement | 0 | ||
| Attribution | 0 | ||
| Drop off | 0 | ||
| Impact | 1:1.21 | ||
| Difference in value between SuROI and SRB | −£43,362,504 − £10,150,912.20 = £33,211,592 |
Table A2.
Comparison between SRB and SuROI in the City West Housing Trust (CWHT) environmental scheme.
Table A2.
Comparison between SRB and SuROI in the City West Housing Trust (CWHT) environmental scheme.
| SRB | Values | SuROI | Values |
|---|---|---|---|
| Expenditure | £4,255,000 | Inputs | £4,255,000 |
| Activities and outputs | 476 customer homes refurbished; 300 dropped kerbs to access driveways; 476 plans drawn up for scheme; salaries of 14 CWHT officers | Outputs | 476 customer homes refurbished; 300 dropped kerbs to access driveways; 476 plans drawn up for scheme; salaries of 14 CWHT officers |
| Key outcome indicators and related baseline | Outcomes, Indicators, proxies and source | Customers happy with neighbourhood appearance-percentage increased of 60% (CWHT customer surveys) | |
| Security rated as good or excellent - increased by 23% (CWHT customer surveys) | |||
| Vandalism and damage an issue -decreased by 10% (CWHT customer surveys) | |||
| Works made a difference to 74% of customers (CWHT customer surveys) | |||
| Amount of cars taken off the road (300) | |||
| Well being values from less graffiti and damage (£83,384) | |||
| £71 per year in cyclical costs per property (£2,130) | |||
| Relet costs of £987 per property (£469,812) | |||
| "Killed or seriously injured in road traffic accidents" (£4,590,000) | |||
| "Good neighbourhood" (£3,563,880) | |||
| "Life satisfaction" (£7,131,146.40 + £1,243,456.20) | |||
| CWHT cost of ASB case (£6,919) | |||
| Not worried about crime for individuals (£319,135.70) | |||
| "Living in a safe area" (£309,400) | |||
| Costs of crime averaged for cost of vehicles and burglary (£1,561,500) | |||
| Customers happy with neighbourhood appearance-percentage increased of 60% | Talks to neighbours regularly (£6,495,840) | ||
| Security rated as good or excellent - increased by 23% | |||
| Vandalism and damage an issue -decreased by 10% | |||
| Works made a difference to 74% of customers | |||
| 300 cars off the road | |||
| Value in currency—quantifies with common unit | £26,788,353.30 is the grand total of all values | ||
| Deadweight | 0 | ||
| Displacement | 0 | ||
| Attribution | 0 | ||
| Drop off | 0 | ||
| Impact | 1:26.25 | ||
| Difference in value between SuROI and SRB | £25,776,603 − 4,255,000 = £21,521,603 |
References
- Bowey, R. Literature Review on Urban Renewal; South Australian Department of Human Services: Adelaide, Australia, 1997.
- Roberts, P.; Sykes, H. Urban Regeneration: A Handbook; Sage: London, UK, 2000. [Google Scholar]
- Jeffrey, P.; Pounder, J. Physical and Environmental Aspects. In Urban Regeneration: A Handbook; Roberts, P., Sykes, H., Eds.; Sage: London, UK, 2000; pp. 86–108. [Google Scholar]
- McGregor, A.; McConnachie, M. Social exclusion, urban regeneration and economic re-integration. Urban Stud. 1995, 32, 1587–1600. [Google Scholar] [CrossRef]
- Colantonio, A.; Dixon, T. Urban Regeneration and Social Sustainability: Best Practice from European Cities; Wiley: Oxford, UK, 2010. [Google Scholar]
- Brandon, P.S.; Lombardi, P. Evaluating Sustainable Development in the Built Environment; Wiley-Blackwell: Oxford, UK, 2011. [Google Scholar]
- Clapham, D. Regeneration and Poverty in Wales: Evidence and Policy Review; Centre for Regional Economic and Social Research, Sheffield Hallam University: Sheffield, UK, 2014. [Google Scholar]
- Carter, K.; Fortune, C. Sustainable development policy perceptions and practice in the UK social housing sector. Constr. Manag. Econ. 2007, 25, 399–408. [Google Scholar] [CrossRef]
- Russell, G.; Johnston, T.; Pritchard, J. Final Evaluation of City Challenge; KPMG Consulting Commissioned by Department of the Environment Transport and the Regions: London, UK, 2000.
- Smith, R. Housing Stock Transfer: Investing in Renewal as a Tool for Sustainable Regeneration. Hous. Stud. 2006, 21, 269–282. [Google Scholar] [CrossRef]
- Madlener, R.; Robledo, C.; Muys, B.; Hektor, B.; Domac, J. A Sustainability Framework for Enhancing the Long-Term Success of LULUCF Projects; Springer: Berlin, Germany, 2003. [Google Scholar]
- Diamond, J.; Liddle, J.; Southern, A.; Townsend, A. Managing the City; Routledge: London, UK, 2006. [Google Scholar]
- Homes and Communities Agency (HCA). The Regulatory Framework for Social Housing in England from April 2012; HCA: London, UK, 2012.
- Tyler, P.; Warnock, C.; Provins, A.; Lanz, B. Valuing the Benefits of Urban Regeneration. Urban Stud. 2013, 50, 169–190. [Google Scholar] [CrossRef]
- Church, C.; Young, S. The United Kingdom: Mainstreaming, mutating or expiring? In Sustainable Communities in Europe; Lafferty, W.M., Ed.; Earthscan Publications Ltd.: London, UK, 2001. [Google Scholar]
- Lee, G.; Chan, E. Indicators for evaluating environmental performance of the Hong Kong urban renewal projects. Facilities 2008, 27, 515–530. [Google Scholar] [CrossRef]
- Communities and Local Government (CLG). Transforming Places; Changing Lives—A Framework for Regeneration: Summary of Consultation Responses; CLG: London, UK, 2009.
- McQuaid, R.W.; Greig, M.; Lindsay, C. Approaches to Evaluation in Community Regeneration: A Report to Communities Scotland; Employment Research Institute, Napier University: Edinburgh, UK, 2006. [Google Scholar]
- Ebrahim, A.; Rangan, V.K. The Limits of Nonprofit Impact: A Contingency Framework for Measuring Social Performance; Harvard Business School: Boston, MA, USA, 2010. [Google Scholar]
- Treasury, H.M. A Framework for the Evaluation of Regeneration Projects and Programmes; HMSO: London, UK, 1995.
- Gregory, D.; Martin, S. Issues in the evaluation of inner city programmes. Local Econ. 1988, 2, 2. [Google Scholar] [CrossRef]
- Russell, H.; Dawson, J.; Garside, P.; Parkinson, M. City Challenge: Interim National Evaluation; The Stationery Office: London, UK, 1996. [Google Scholar]
- Department of the Environment, Transport and the Regions. Planning for Sustainable Development: Towards Better Practice; HMSO: London, UK, 1998.
- Dean, K.; Trillo, C. Assessing sustainability in housing led urban regeneration: Insights from a housing association in Northern England. In AMPS, Living and Sustainability: An Environmental Critique of Design and Building Practices, Locally and Globally; London South Bank University: London, UK, 2017. [Google Scholar]
- OECD. Local Economic and Employment Development: How to Assess What Works among Programmes and Policies; OECD Publications: Paris, France, 2004. [Google Scholar]
- Ho, S.Y. Evaluating British Urban Policy: Ideology, Conflict and Compromise; Ashgate: Farnham, UK, 2003. [Google Scholar]
- Robson, B.; Bradford, M.; Parkinson, M. Assessing the Impact of Urban Policy; HMSO: London, UK, 1994.
- Department of the Environment. The SRB Evaluation Framework; Discussion Article 83; Department of Land Economy, University of Cambridge: Cambridge, UK, 1997.
- Zuberi, D.; Taylor, A. Urban Renewal in Vancouver, Canada. In The Routledge Companion to Urban Regeneration (Routledge Companions); Leary, M.E., McCarthy, J., Eds.; Routledge: London, UK; Taylor & Francis Group: New York, NY, USA, 2013. [Google Scholar]
- Brennan, A.; Rhodes, J.; Tyler, P. The Distribution of SRB Challenge Fund Expenditure in Relation to Local-area Need in England. Urban Stud. 1999, 36, 2069–2084. [Google Scholar] [CrossRef]
- Rhodes, J.; Tyler, P.; Brennan, A. Evaluation of the Single Regeneration Budget: Final Evaluation; Department of Land Economy, University of Cambridge: Cambridge, UK, 2007. [Google Scholar]
- Glennerster, H.; Turner, T. Estate Based Housing Management: An Evaluation; Her Majesty’s Stationery Office: London, UK, 1993.
- Lawless, P. Understanding the Scale and Nature of Outcome Change in Area-Regeneration Programmes: Evidence from the New Deal for Communities Programme in England. Environ. Plan. C 2011, 29, 520–532. [Google Scholar] [CrossRef]
- Lawless, P.; Pearson, S.; Wilson, I.; Batty, E.; Beatty, C.; Foden, M. The New Deal for Communities Experience: A Final Assessment; DCLG: London, UK, 2010.
- Imrie, R.; Thomas, H. British Urban Policy: An Evaluation of the Urban Development Corporations; Sage: London, UK, 1999. [Google Scholar]
- Hambleton, R.; Thomas, H. (Eds.) Urban Policy Evaluation: Challenge and Change; Paul Chapman Publishing: London, UK, 1995. [Google Scholar]
- Oatley, N. Evaluation and urban development corporations. Plan. Pract. Res. 1989, 4, 6–12. [Google Scholar] [CrossRef]
- Her Majesty’s Stationery Office (HMSO). A Further Assessment of the Enterprise Zone Policy; HMSO: London, UK, 1995.
- Potter, J.; Moore, B. UK Enterprise Zones and the attraction of inward investment. Urban Stud. 2000, 37, 1279–1311. [Google Scholar] [CrossRef]
- Hemphill, L.; Berry, J.; McGreal, S. An indicator-based approach to measuring sustainable urban regeneration performance: Conceptual foundations and methodological framework. Urban Stud. 2004, 41, 725–772. [Google Scholar] [CrossRef]
- Bichard, E. Developing an Approach to Sustainable Return on Investment in the UK, Brazil and the USA; Royal Institution of Chartered Surveyors Research Trust: London, UK, 2015. [Google Scholar]
- Conejos, S.; Langston, C.; Smith, J. AdaptSTAR Model: A Climate-Friendly Strategy to Promote Built Environment Sustainability. Habitat Int. 2013, 37, 95–103. [Google Scholar] [CrossRef]
- Lehtonen, M. The environmental-socio interface of sustainable development: Capabilities, social capital, institutions. Ecol. Econ. 2004, 49, 199–214. [Google Scholar] [CrossRef]
- Davidson, M. Social Sustainability: A potential for politics? Local Environ. 2009, 14, 607–619. [Google Scholar] [CrossRef]
- Littig, B.; Griessler, E. Social sustainability: A catchword between political pragmatism and social theory. Int. J. Sustain. Dev. 2005, 8, 65–79. [Google Scholar] [CrossRef]
- Xing, Y.; Horner, R.; El-Haram, M.; Bebbington, J. A framework model for assessing sustainability impacts of urban development. Account. Forum 2009, 33, 209–224. [Google Scholar] [CrossRef]
- Royal Institution of Chartered Surveyors (RICS). RICS Valuation—Professional Standards; Royal Institution of Chartered Surveyors: London, UK, 2014. [Google Scholar]
- Higham, A.; Barlow, C.; Bichard, E.; Richards, A. Valuing sustainable change in the built environment: Using SuROI to appraise built environment projects. J. Facil. Manag. 2017, in press. [Google Scholar]
- Nicholls, J.; Lawlor, E.; Neizert, E.; Goodspeed, T. A Guide to Social Return on Investment; SROI Network: Liverpool, UK, 2012. [Google Scholar]
- Watson, K.J.; Whitley, T. Applying Social Return on Investment (SROI) to the Built Environment. Building Research and Information. Available online: http://www.tandfonline.com/doi/full/10.1080/09613218.2016.1223486 (accessed on 5 November 2017).
- Trotter, L.; Vine, J.; Leach, M.; Fujiwara, D. Measuring the Social Impact of Community Investment: A Guide to Using the Wellbeing Valuation Approach; HACT: London, UK, 2014. [Google Scholar]
- GVE 2.0. 2017. Available online: http://www.globalvaluexchange.org/ (accessed on 5 November 2017).
- Arvidson, M.; Lyon, F.; McKay, S.; Moro, D. Valuing the social? The nature and controversies of measuring social return on investment. Volunt. Sect. Rev. 2013, 4, 3–18. [Google Scholar] [CrossRef]
- Department for Environment, Food and Rural Affairs. An Introductory Guide to Valuing Ecosystem Services; Department for Environment, Food and Rural Affairs (DEFRA): London, UK, 2007.
- Robinson, F.; Blackman, T.; Stephens, C. Monitoring and Evaluating City Challenge; Research for Policy; Local Authorities Research and Intelligence Association: Newcastle, UK, 1995; pp. 135–145.
- Rhodes, J.; Tyler, P.; Brennan, A. New Developments in Area Based Initiatives in England: The Experience of the Single Regeneration Budget. Urban Stud. 2003, 40, 1399–1426. [Google Scholar] [CrossRef]
- Communities and Local Government (CLG). The Single Regeneration Budget: Final Evaluation. In Urban Research Summary; CLG: London, UK, 2007. [Google Scholar]
- Dean, K.; Trillo, C. Housing and Urban Regeneration: Honing an Existing Assessment Method through the Design Science Methodology; University of Salford: Salford, UK, 2017. [Google Scholar]
Figure 1.
Sustainable Return On Investment (SuROI) impact map, which uses the Social Value United Kingdom (UK) Social Return on Investment (SROI) impact map as its framework.
Figure 1.
Sustainable Return On Investment (SuROI) impact map, which uses the Social Value United Kingdom (UK) Social Return on Investment (SROI) impact map as its framework.

Figure 2.
Criteria for assessment of SuROI against other, more traditional approaches.

Figure 3.
City West Housing Trust high-rise blocks before works.
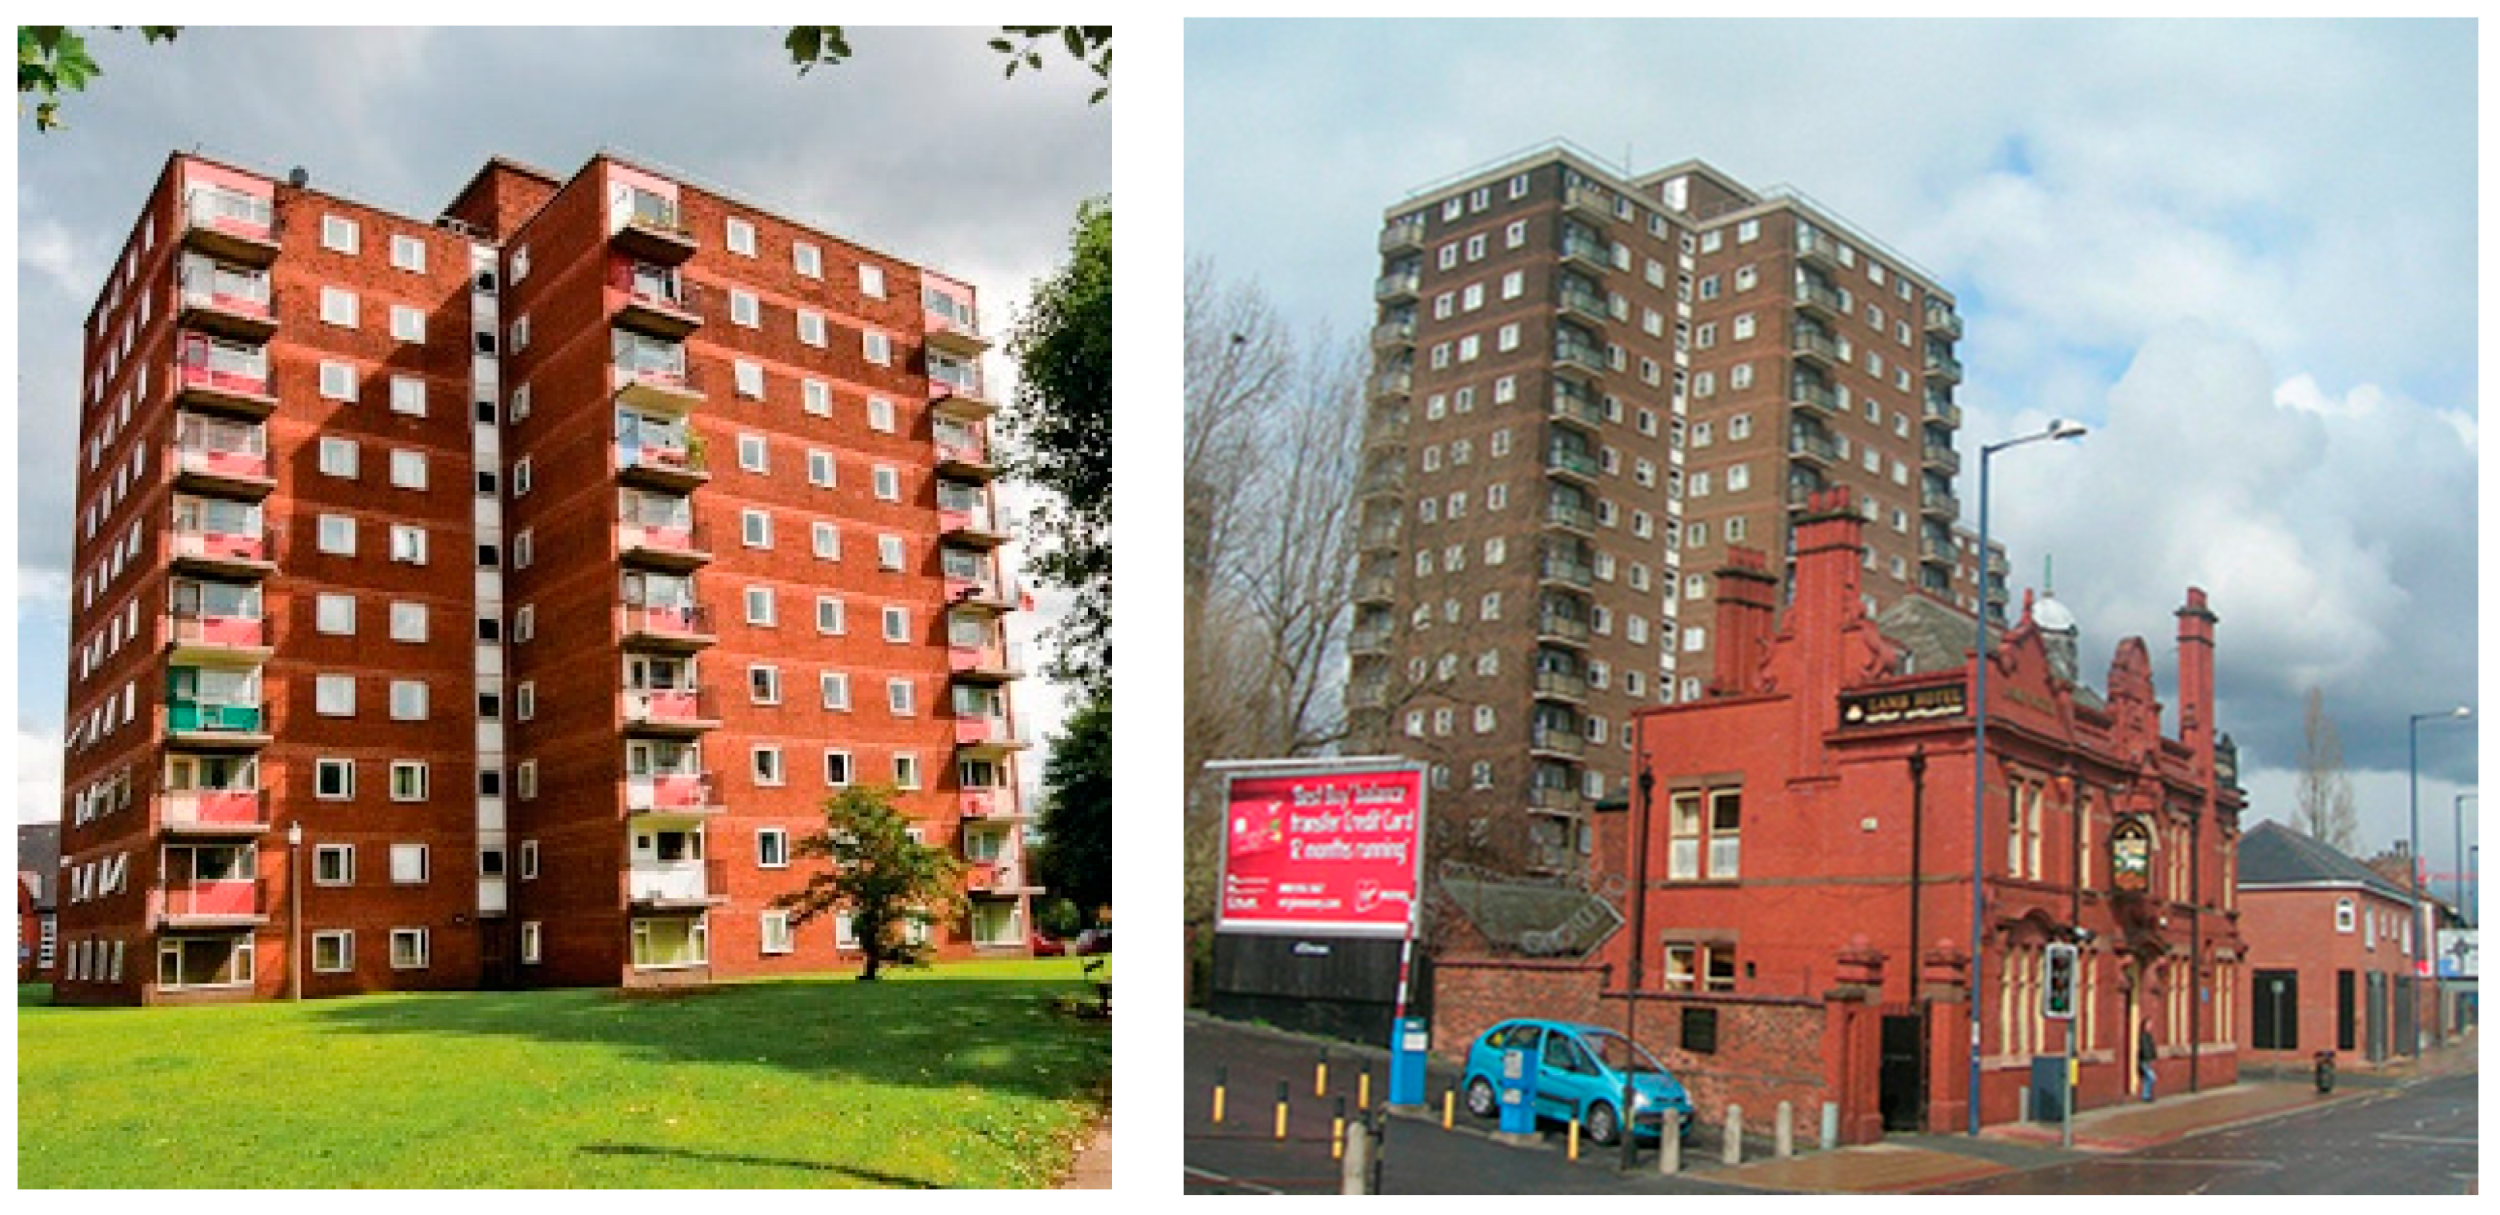
Figure 4.
City West Housing Trust high-rise blocks after works.

Figure 5.
City West Housing Trust “environmental” scheme before works.

Figure 6.
City West Housing Trust “environmental” scheme after works.

© 2017 by the authors. Licensee MDPI, Basel, Switzerland. This article is an open access article distributed under the terms and conditions of the Creative Commons Attribution (CC BY) license (http://creativecommons.org/licenses/by/4.0/).
Share and Cite
MDPI and ACS Style
Dean, K.; Trillo, C.; Bichard, E. Assessing the Value of Housing Schemes through Sustainable Return on Investment: A Path towards Sustainability-Led Evaluations? Sustainability 2017, 9, 2264. https://doi.org/10.3390/su9122264
AMA Style
Dean K, Trillo C, Bichard E. Assessing the Value of Housing Schemes through Sustainable Return on Investment: A Path towards Sustainability-Led Evaluations? Sustainability. 2017; 9(12):2264. https://doi.org/10.3390/su9122264
Chicago/Turabian StyleDean, Kevin, Claudia Trillo, and Erik Bichard. 2017. "Assessing the Value of Housing Schemes through Sustainable Return on Investment: A Path towards Sustainability-Led Evaluations?" Sustainability 9, no. 12: 2264. https://doi.org/10.3390/su9122264
Note that from the first issue of 2016, this journal uses article numbers instead of page numbers. See further details here.