1. Introduction
Since the 19th century, with the Second Industrial Revolution, the development of society has been directly linked to increasing electricity dependence, in such a way that it is difficult to imagine life without electrical energy nowadays. Its applications in industry, hospitals, electric appliances, lighting, air conditioning, etc. show that electric energy is indispensable to the functioning of virtually everything in modern society. The growth of the population and consequently, energy consumption, combined with this resource’s limited availability, show that its adequate management is necessary. In Brazil, it is estimated that consumption could grow from 525 TWh, registered in 2014, to 786 TWh in 2024, a 4.1% percent growth per year [
1].
In the 1970s, the world oil crisis stimulated energy conservation discussions [
2], which resulted in growing environmental awareness towards energy conservation and efficient use in the following years. As the term “efficiency” has a broad meaning, energy efficiency can be defined as the ability of a building to provide inner comfort conditions with minimum energy [
3].
In December 1985, a major advance in Brazilian public policies associated with energy conservation was achieved: the program PROCEL was created by Eletrobrás (Centrais Elétricas Brasileiras S.A. Rio de Janeiro, Brazil), saving 70.1 billion of kWh between 1986 and 2013 [
4]. The program encompasses several measures, adopting energy efficiency standards, spreading energy conservation awareness and combating electricity losses [
5]. Another interesting aspect of PROCEL is the subprogram PROCEL Edifica, created to rationalize energy consumption in residential, commercial and public buildings, by evaluating energy efficiency and assigning a label the edification. Energy conservation in buildings is an important goal, since commercial, residential and public buildings are responsible for about 50% of the energy consumed in Brazil [
6].
In Brazilian public buildings, which are the main study object of this paper, Lamberts, Dutra, and Pereira [
7] concluded that is possible to reduce 30% to 50% energy consumption by adopting low cost technical and management measures. In these buildings, energy efficiency evaluation is made by following the steps described on the Quality Technical Report for the Energy Efficiency Level of Commercial, Services and Public Buildings (RTQ-C), which specifies criteria for the building’s illumination, air conditioning and envelope systems.
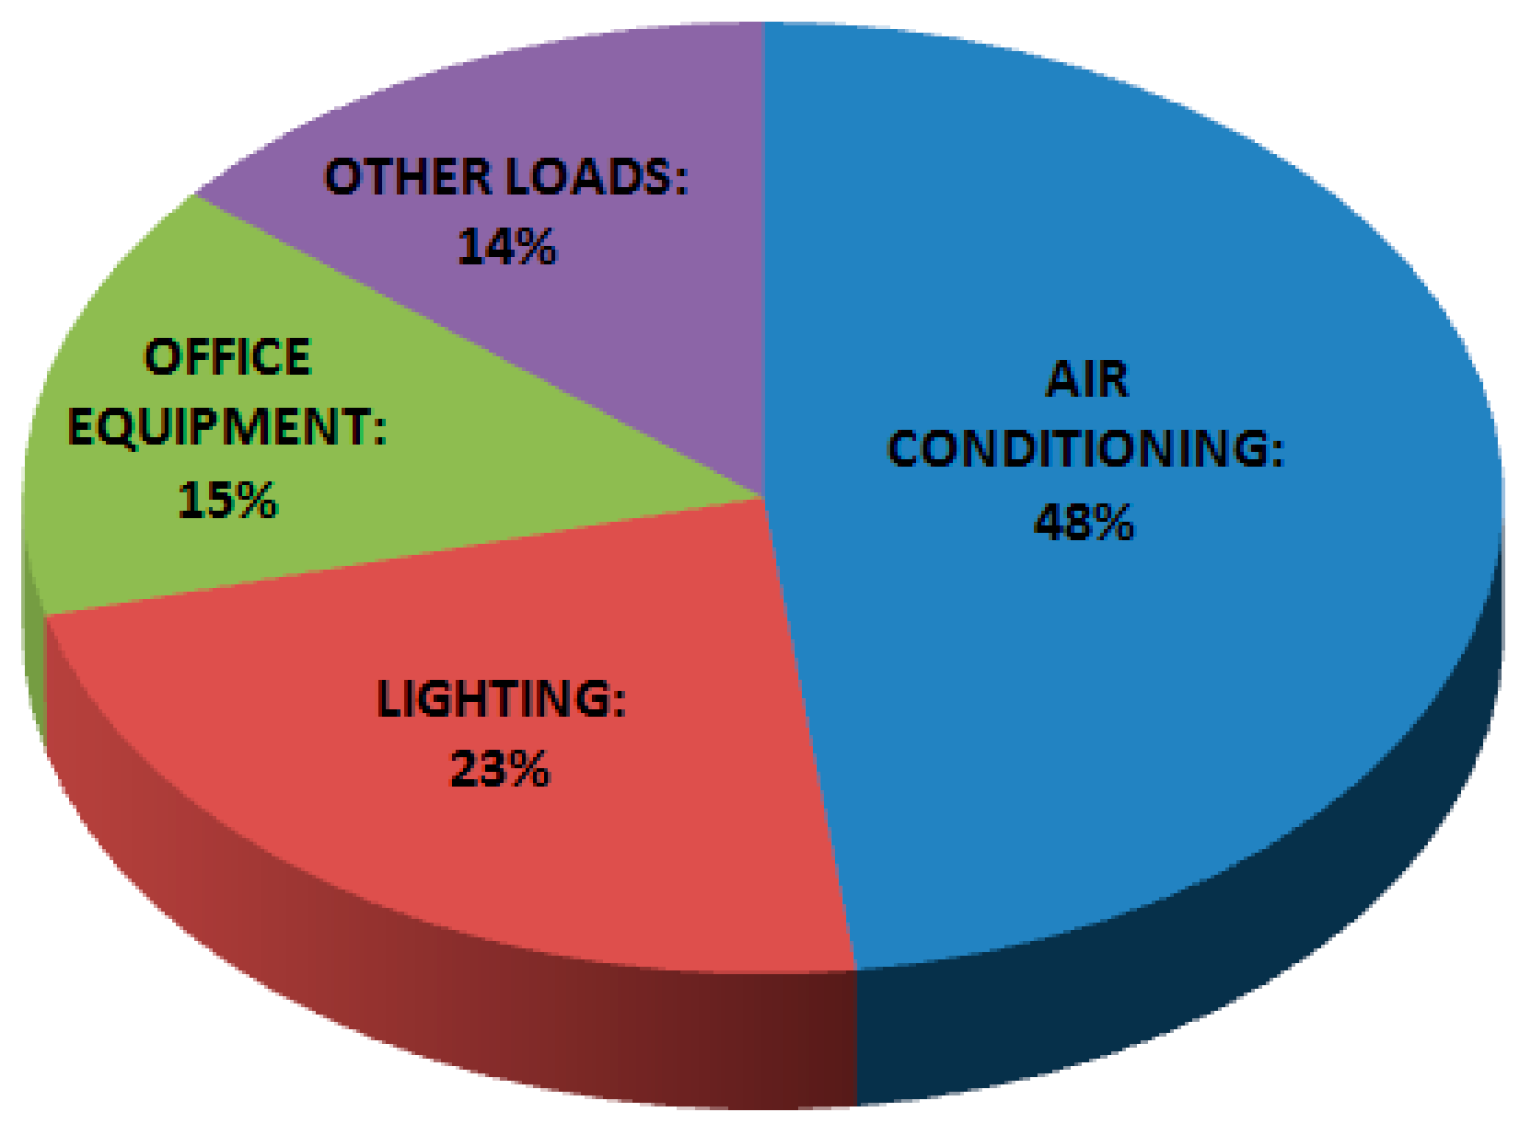
Figure 1 shows the distribution of energy consumption for Brazilian public buildings.
It is evident that the maximum contribution to the energy consumption is 48% from air conditioning, followed by 23% from lighting, which are responsible for 71% of the energy consumed. Very close to the consumption profile of a residence in the tropical region where the university campus is located. Therefore, efficient lighting and air conditioning are mandatory to obtain high energy efficiency in public buildings, which makes energy efficiency and environmental performance evaluation crucial [
9]. Efficient use of electrical energy brings various benefits, such as environmental conservation, visual and thermal comfort, and reduction of public spending with energy bills.
The optimization models only aim to reduce the energy consumption and reduce the final cost. However, this disregards the needs of the consumer. Therefore, proposals which appear excellent in theory are usually impracticable and non-commercial. Considering the different home appliance categories and level of consumer satisfaction for the new load scheduling of the appliances would be much more comprehensive than the other models analyzed. Moreover, it can be applied in any energy scenario.
There is a need for efficiency evaluation methods in Brazil and in other countries. In this way, the development of advanced computational techniques has opened new possibilities to evaluate and improve buildings’ energy efficiency. Data Envelopment Analysis (DEA), has attracted much attention in the energy sector [
10] and has been accepted as a benchmarking technique in many countries [
11]. DEA uses linear programming models to compare, calculate and evaluate the efficiency of productive entities, known as Decision Making Units (DMUs), in addition, to establish a set of targets for inefficient DMUs [
12,
13,
14]. The nature of the DMUs will differ from one application to another, which might be companies, equipment, industries, etc. Therefore, DEA could work as a support tool to handle what has to be changed to reach efficiency while keeping adherent with RTQ-C, providing a preliminary overview of the building’s energy efficiency situation.
In this study, DEA was applied to evaluate and improve energy efficiency of indoor spaces (classrooms) from the Federal University of Piauí, focusing the analysis especially on lighting and air conditioning—the main consumption plots. The university campus is composed of several buildings with more than 60 undergraduate courses and more than 15,000 active students. This campus resembles a small Brazilian city. In order to assess DEA’s performance and feasibility in efficiency improvement, Brazilian energy efficiency standards were used to compare the efficiency levels before and after the application of DEA’s suggestions. Ultimately, one can extend the proposal so that all the buildings in a small city presents scores that reflect their level of energy efficiency.
In addition to this introduction, this paper has five other sections, structured as follows.
Section 2 presents an evaluation of energy efficiency method by applying RTQ-C. Moreover, in
Section 3, an overview of the DEA technique is presented.
Section 4 and
Section 5 present the case study in which the proposed methodological tool is applied. Finally,
Section 6 presents the conclusions of this study.
2. Energy Efficiency Evaluation Using RTQ-C
As previously stated, energy efficiency evaluation in Brazilian public and commercial buildings are made by evaluating lighting, air conditioning and envelopment systems, following the criteria described in the RTQ-C. For residential applications, RTQ-R is used. RTQ-C was approved in 2009 by decree no. 163 of National Institute of Metrology, Quality and Technology [
15] and was developed by the Energy Efficiency Laboratory (LabEEE) team of the Federal University of Santa Catarina (UFSC) in collaboration with Eletrobrás, under the program PROCEL Edifica [
7].
The evaluation can be made by the prescriptive method, which uses equations and tables with established values or by computational simulation, which uses software to calculate the indoor spaces’ performance. Usually, the first method is faster and simpler, and will be covered in the next sections. In the prescriptive method, the building’s general efficiency score is composed by the sum of the illumination, air conditioning and envelope scores; illumination score composes 30% of the global score, envelope 30% and air conditioning 40%. It is important to mention that the “envelope” system (the building’s physical part formed by the external surfaces, such as walls, roofs, openings and facades) must not be mistaken for the “envelopment” in DEA, as it is not related. Each system is ranked from “A” (most efficient) to “E” (least efficient), and receives a score matching its rank in
Table 1.
After obtaining each individual score, the system’s efficiencies are combined in a single equation, which determines the building’s global score (GS). Although the building’s envelope is used in the global score calculation, its evaluation is more complex, and it is not included in this paper’s objectives. This study focuses on lighting and air conditioning efficiencies.
In
Section 2.1 and
Section 2.2, the evaluation of illumination and air conditioning systems will be detailed, according to the prescriptive method.
2.1. Lighting System Evaluation
The artificial lighting system, composed basically by lamps, luminaires and reactors, is indispensable to perform activities in public buildings; however, lighting energy costs represent 22% of the country’s energy consumption [
8] and 23% of the public buildings’ consumption (
Figure 1). The results of efficient lighting are savings in energy and numerous environmental benefits [
16] while maintaining the visual comfort levels. An efficient design is not merely a matter of adequate equipment choices, but it also considers taking advantage of the building’s natural illumination.
RTQ-C defines two methods for lighting system evaluation, both based on installed power limits. The first is known as “area method”, and it is applied for buildings with a maximum of three main activities, which is the case of the subject studied in this paper. For this method, RTQ-C establishes the maximum levels of Illumination Power Density (DPI) allowed for each classification based on the activity performed on the building.
Table 2 presents some of the limits defined in the RTQ-C.
DPI can be defined as the ratio between the Total Lighting Installed Power (TLP) and the room area A:
A university classroom with a 9.00 W/m
2 DPI, for example, is classified as “A”, following
Table 3. Another important parameter in lighting systems is the luminous efficiency
, defined as the ratio between the luminous flux φ emitted by the light source and the lighting power LP it has absorbed [
17]:
In order to obtain “A” classification, the lighting system is subject to other requisites (besides an adequate DPI) described in the RTQ-C, such as circuit division and automatic shutdown for rooms bigger than 250 m
2 [
15], which will not be considered in this study, since these requisites are not quantities and cannot be computed by DEA.
2.2. Air Conditioning System Evaluation
Much like the illumination system, air conditioning is indispensable in the majority of buildings, as it generates comfort and improves the workplace productivity. Air conditioners with adequate capacity and power and high energy efficiency greatly increase energy savings, as the air conditioning system is the biggest responsible for energy consumption. In addition to equipment, adequate projects consider also the building’s conditions, such as radiation, localization and materials used in the construction.
RTQ-C treats the air conditioning system in two manners, depending on whether the equipment is regulated by INMETRO or not. For equipment regulated by INMETRO, air condition system efficiency is obtained by verifying the device’s label [
15], which features classification results from laboratory tests and evaluation. This is a simple procedure because it depends on the Cooling Capacity (CC) and the mean power absorbed by the device, as follows:
where CEE is the device’s Energy Efficiency Coefficient, usually given in W/W or BTU/h/W. INMETRO provides tables containing minimum CEEs based on the device type and desired classification. For window units, for example, INMETRO supplies the values shown in
Table 3.
Brazilian air conditioners are behind other countries’ devices in energy efficiency, as Brazilian least efficient devices’ mean CEE is around 2.08 W/W, while most of the least efficient devices in the world have CEEs around 2.80 W/W [
19]. In addition, Brazilian’s most efficient equipment has a 4.79 W/W CEE, while many other air conditioners in China and Japan have more than 6.0 W/W [
20].
To obtain an “A” classification, besides from an INMETRO “A” labelling, there are other requisites: the window unit or the split’s condensing unit should be shadowed, entirely or partly, and the ducts’ isolation should have a 2.5 cm minimum width. If these requirements are not met, the device’s maximum classification will be limited to “B”. For devices not regulated by INMETRO, ASHRAE (American Society of Heating, Refrigeration and Air Conditioning Engineers) establishes minimum CEE values according to the refrigerating type, capacity and desired efficiency.
3. Data Envelopment Analysis Overview
Data Envelopment Analysis (DEA) was developed by Charnes et al. [
21], based upon earlier works of Farrell [
22]. By using linear programming models, DEA evaluates and optimizes the performance/efficiency of the so-called Decision-Making Units (DMUs), which perform the same activity and generate multiple outputs while consuming multiple inputs [
23]. Like other linear programming models, DEA has three elements [
24]: (i) objective-function, which is the function involving the decision variables that will be maximized or minimized; (ii) restrictions, which are the conditions that need to be met and express the interdependence relationship between the variables; and (iii) decision variables, which are the characteristics that will be studied.
DEA has many advantages, which consolidated this relatively new approach inefficiency evaluation. Firstly, as a non-parametric technique, DEA does not require knowing a function that relates input and outputs [
25]; secondly, it combines many characteristics with different units in a single efficiency measure. Finally, DEA analysis and DMU comparing are easier, as the results are presented more clearly [
12].
A DEA-based application has the following basic elements [
21]: (i) DMU, which is the subject that will be evaluated; (ii) inputs, which are the resources used by a DMU to perform an activity; (iii) outputs, which are the products generated by a DMU; (iv) efficiency frontier, which is the set composed by the most efficient DMUs; and (v) relative efficiency, which is the efficiency score of the DMUs regarding the efficiency frontier.
The linear combination of outputs multiplied by their respective weights is called virtual output, and the weighted combination of inputs is called virtual input. A DMU’s efficiency ranges between zero and one, and can be calculated as follows [
21]:
where EFF
j is DMU j’ score, u
1, u
2, ..., u
n, are the output weights, v
1, v
2, …, v
n, are the input weights, y
1j is the output 1 value for DMU j and x
1j is the input 1 value for DMU
j. An efficient DMU receives the unitary score (100%): none of its inputs or outputs can be improved without worsening other inputs or outputs; the set of the efficient DMUs form the efficiency frontier of the program. An inefficient DMU, in turn, receives a score that reflects its improvement potential: a 0.7 score, for example, means that DMU
j needs to reduce its inputs by 30% in order to reach the efficiency frontier. Equation (4) can be optimized either by reducing the virtual input while maintaining the output or increasing the virtual output while maintaining the inputs; the first approach is called input-oriented model, and the second is called output-oriented model [
26].
The main objectives of DEA can be resumed as [
24,
25,
26,
27,
28] (i) compare DMUs that perform the same activity and differ in inputs and outputs quantity; (ii) identify efficient DMUs, which will become benchmarks for inefficient DMUs; (iii) calculate the relative efficiency of all DMUs; (iv) provide strategies to improve the score of inefficient DMUs, optimizing their inputs/outputs. These strategies should not be taken as rigid objectives, but as suggestions of how the DMUs’ inputs and outputs can be optimized [
29].
The first DEA model, called CCR (Charnes, Cooper & Rhodes) or CRS (Constant Returns to Scale), was developed by Charnes et al. and was deemed more appropriate for this study. Its Dual formulations are presented as follows [
21]:
where θ
0 is DMU 0’s efficiency score, is DMU k’s contribution on the targets of DMU 0, y
j0 is output j quantity for DMU 0, x
i0 is output i quantity for DMU 0 and n is the quantity of DMUs used on the model. Decision variables are θ and λ; in the input-oriented Dual Model (5), the program attempts to minimize DMU 0’s inputs while maintaining the same output levels. If DMU 0 is considered efficient, θ
0 and λ
0 are equal to 1 and the other DMUs equal to 0, which means DMU 0’s resources cannot be reduced without altering its outputs. In turn, if DMU 0 is deemed inefficient, its inputs can be reduced from x
i0 to x
ik while maintaining the same outputs. Thus, the input-oriented Dual model provides a set of x
ik targets for each inefficient DMU’s inputs, in order to maximize its score. On the other hand, the output-oriented Dual Model (6) increases DMU 0’s outputs while maintaining the same input levels, providing a set of y
jk targets for inefficient DMUs’ outputs. Aside from the input/output Dual CCR models, there are many other DEA models by Oliveira and Pinheiro [
14] which use different returns to scale, operating characteristics and formulations.
4. Methods
To evaluate the indoor spaces’ energy efficiency using DEA, the steps described in the systematic methodology proposed by Golany and Roll [
30] were followed. A DEA-based efficiency study comprises three main phases [
30]: (i) definition and selection of DMUs to enter the analysis; (ii) determination of relevant inputs and outputs to assess the relative efficiency of the selected DMUs; (iii) application of the DEA models and analysis of outcomes. Based on this methodology, five steps were defined to apply DEA, described through this section:
In this paper, the DMUs were defined as indoor spaces (classrooms and laboratories) from the Federal University of Piauí, more specifically from the Civil Engineering Department (Building 5) of the Technology Center, campus Petrônio Portela. In this two-floor building, electrical engineering students of the University’s Energy Efficiency Laboratory had collected the data about lighting and air conditioning systems. Each one of Building 5’s ten rooms was considered a DMU.
As DEA calculates only relative efficiencies, comparing Building 5 rooms would not make sense because they have “B” or lower classification; as this paper’s purpose is to improve the rooms’ energy efficiencies to make them closer to an “A” classification, several real “A” rooms were added to the DMU set. With this addition, only “A” rooms would compose the efficiency frontier, thus the set of goals generated by the DEA model could bring the inefficient DMUs closer to an “A” classification. It is important to mention that even if the inefficient DMUs reach the frontier, they still are subject to the requisites mentioned in the RTQ-C.
Most of the “A” rooms added to the program are virtual, i.e., created rooms with “A” lighting and air conditioning systems, while the other part was collected from RTQ-C –based studies. In the creation process, different areas, lamps and air conditioners were used to avoid biasing the DEA model to an ideal “A” characteristic. The lamps selected had a luminous efficiency ranging from 100 to 120 lm/W and air conditioners with CEEs ranging from 3.33 to 3.48 W/W. Therefore, the DMU set is composed by 19 DMUs, which from this point on will be referred as ‘classrooms’. In
Table 4, the data obtained for lighting systems is presented.
According to Brazilian technical standards, the mean illuminance level E
M (ratio between the emitted luminous flux and the area) adequate to classrooms is 500 lx, therefore, almost all Building 5 rooms are inadequate (except 552-1), which means that the luminous flux must be increased to provide adequate visual comfort. The air conditioning systems data is presented on
Table 5.
Due to Building 5 being the oldest department of the University’s Technology Center, all air conditioning devices were window units. Following the next step of DEA application, the selection of variables was made. Golany and Roll assert that the initial variables’ list must be the greatest possible, and then a refinement of the more relevant ones should be made in three stages [
30]: (i) judgmental screening; (ii) non-DEA quantitative analysis; and (iii) DEA based analysis. In this study, the selected variables were TLP and ACP as inputs and TLF and TCC as outputs, following the description below:
TLP, Total Lighting Power (W)—indicates the classroom’s total lighting installed power. Also affects directly the lighting energy efficiency.
ACP, Air Conditioning Power (W)—indicates the classroom’s total mean demanded power by the air conditioning devices. Affects directly the device’s CEE, as shown by Equation (5), consequently the classification.
TLF, Total Luminous Flux (lm)—indicates the total luminous flux emitted by the classroom’s light sources. Affects directly the lighting energy efficiency.
TCC, Total Cooling Capacity (BTU/h)—indicates the classroom’s devices total cooling capacity. As with the variable ACP, affects directly the device’s CEE.
After the variables were selected, the DEA model was chosen. As stated before, Building 5 classrooms’ lighting systems were inadequate, and the output TLF needed to be increased, thus output orientation was deemed more appropriate to this case. On the other hand, all the air conditioners were adequate but inefficient, implying the use of an input-oriented model to maintain the outputs and reduce ACP. Therefore, the application of both CCR models was necessary in order to analyze DEA’s performance in each particular situation.
To solve the model, DEA computation was carried out using Microsoft Excel spreadsheet. The results obtained from the DEA application are presented and discussed on
Section 5.
5. Results and Discussion
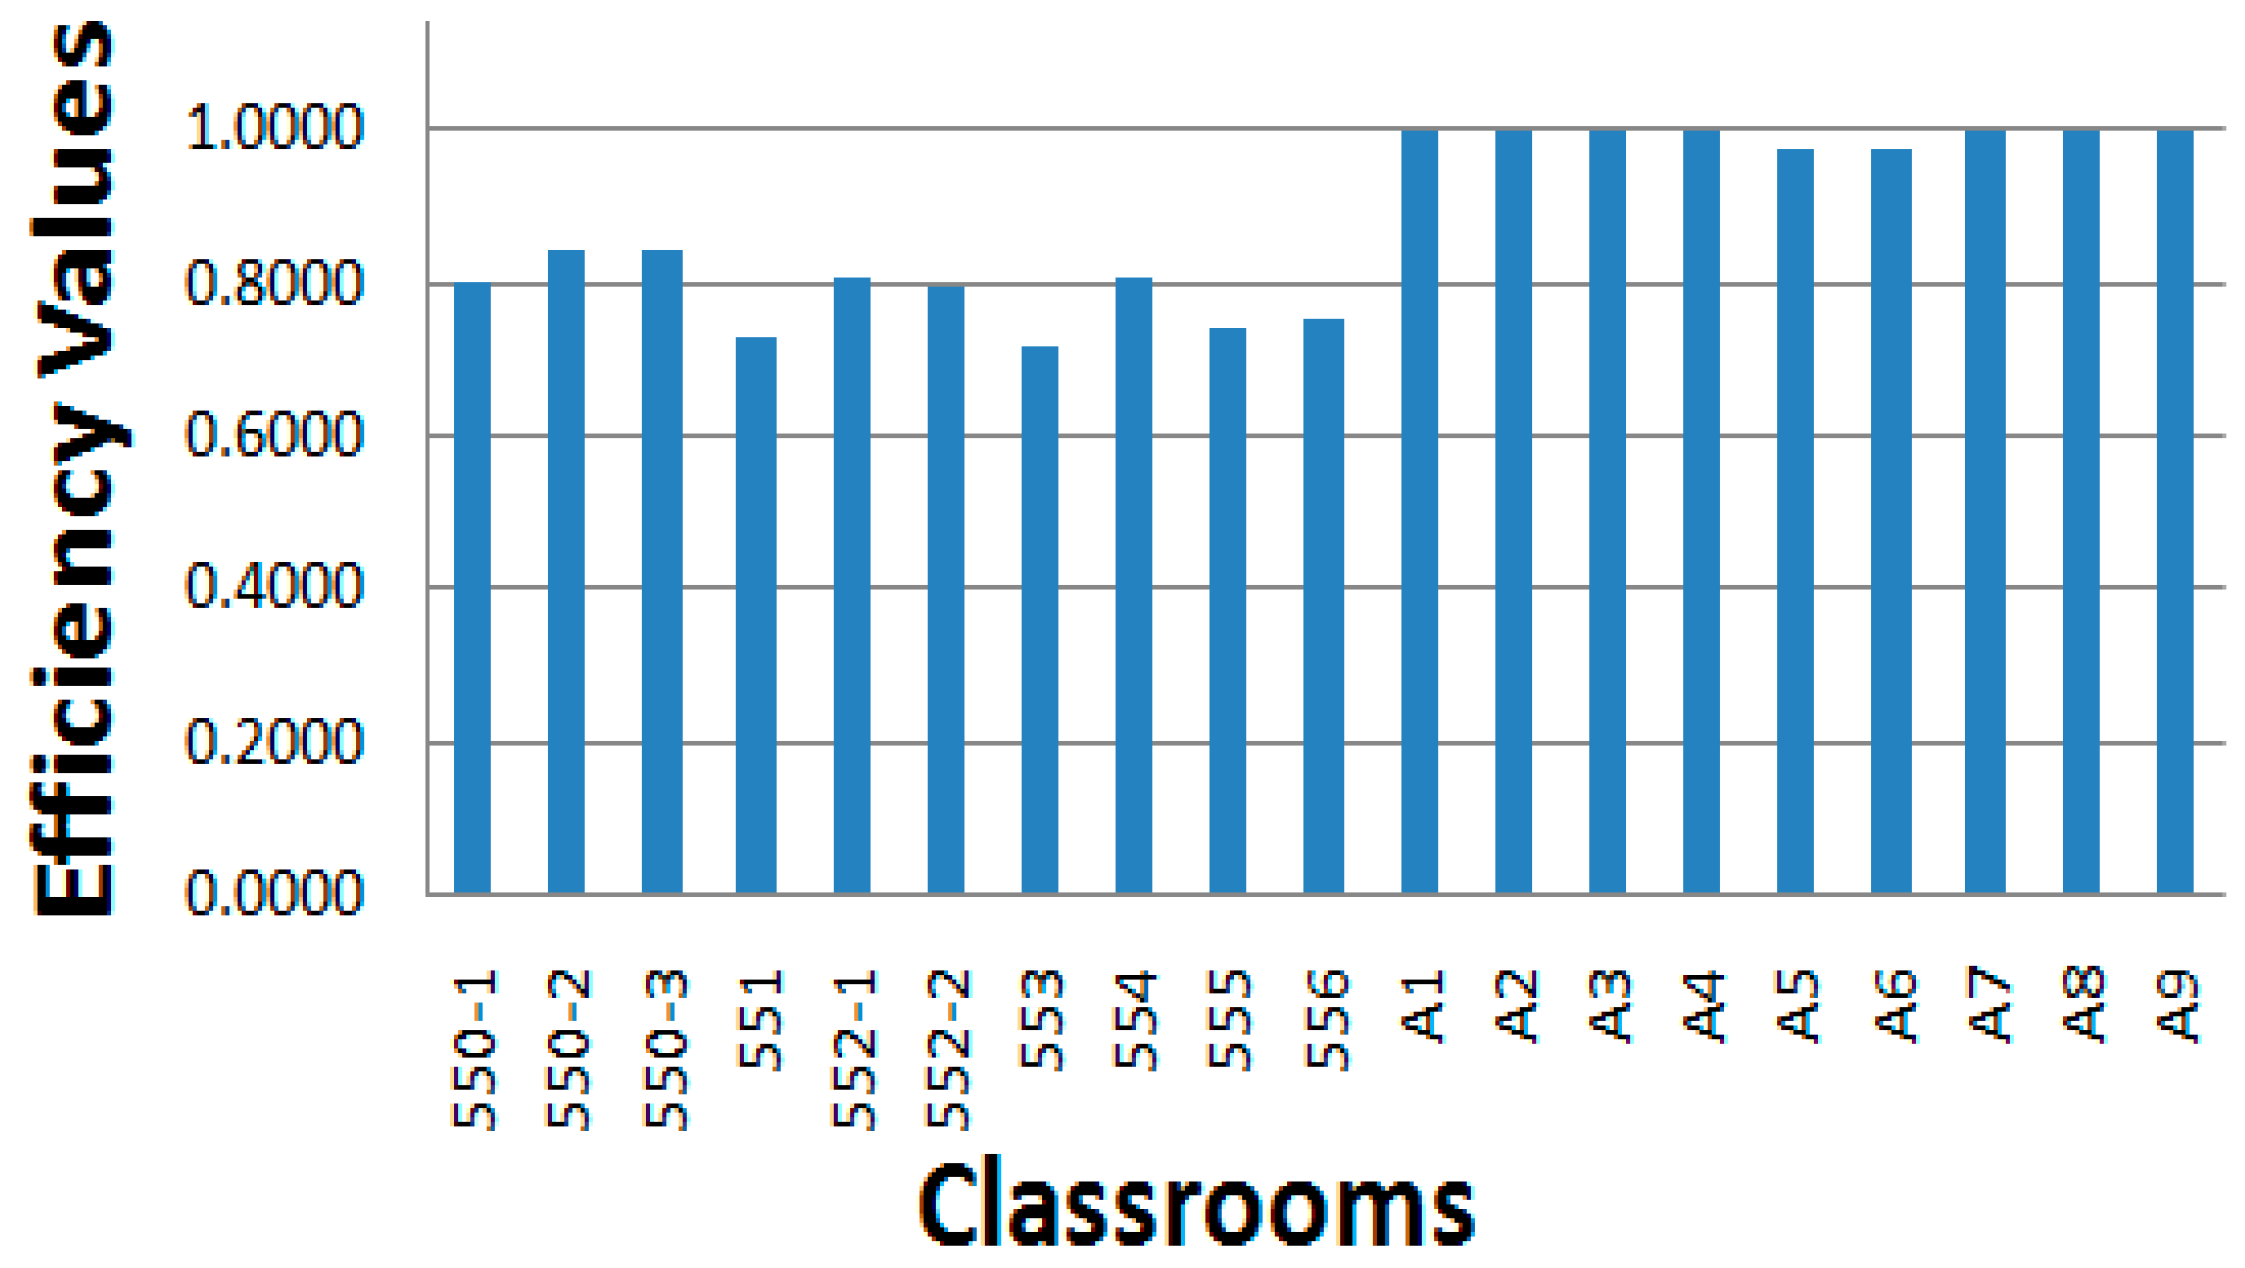
The scores obtained by the application of the CCR models (5) and (6) are presented on
Table 6 and
Figure 2.
The results demonstrated in
Table 6 and
Figure 2 revealed that all “A” classrooms were considered near or full efficient (47.36% of the sample) and Building 5 classrooms received lower scores, which was expected and suggests coherence with the RTQ-C classification. Interestingly, Building 5 classrooms obtained relatively close scores, ranging from 0.7182 to 0.8477; from
Table 4 and
Table 5, it can be noted that all rooms have the same luminous efficiency (60.60 lm/W) and relatively close CEEs, varying from 2.45 to 2.88 W/W. These similar systems’ efficiencies explain the narrow distribution of efficiency values.
Classrooms 554 (0.8087), 550-2 (0.8477) and 550-3 (0.8477) were recognized as the most efficient from Building 5. Checking
Table 5, it can be noticed that these rooms have the highest CEEs in the Building 5 DMU set, while maintaining the same luminous efficiency as the others. Also, classroom 553 obtained the worst score (0.7182) and has the same luminous efficiency, but worst CEE in the set. Therefore, it can be concluded that the DMU’s score is directly related to the luminous and air conditioners efficiency, especially the latter. Considering that air conditioning consumes the greatest part of the energy in public buildings (
Figure 1), it is reasonable to assume that its efficiency should be more relevant to the classroom’s final score. The targets generated by the DEA models are presented on
Table 7 and
Table 8, as follows.
Table 7 and
Table 8 reveal that the input model also generated output augmentations and the output model also generated input reduction: these values are known as output slacks and input slacks, respectively. Slacks generation are not abnormal, in fact, some DEA models apply slacks-based measures.
The slacks can be explained as additional reductions/augmentations that can be applied to the DMU without affecting its performance. Taking classroom 550-1 as an example, reducing its TLP to 333.33 and its ACP to 3026.66 would maximize its score, according to
Table 7. However, with these same inputs, it is possible to increase its TLF to 38,000 without affecting negatively another input or output. The same conclusion can be applied to the Output model: increasing TLF to 48,663.66 and TRC 46,102.20 would take the DMU to the efficiency frontier, but with these same outputs it is possible to reduce the TLP input to 426.87 without any prejudice. It is important to mention that slacks values are not directly related with the score generated to the DMU. According to
Table 7, no slacks were generated for TCC, which is coherent, as the classrooms’ already have the adequate refrigerating capacity.
Both models can generate input and output slacks for the same DMU. Classroom 550-1, for example, obtained a 0.7808 (or 78.08%) score, meaning it will have to reduce its inputs by 21.91% to reach maximum relative efficiency. From
Table 7, ACP reduction is −21.91%, but TLP reduction is −32.66%, indicating an additional reduction due to the generated input slacks, which won’t affect the DMU’s performance. Therefore, due to slacks, some of the targets goals won’t reflect directly on the score given to each DMU. Classroom 553, for example, had the highest inefficiency, implying it should need greater inputs’ reduction or greater outputs’ augmentation than other DMUs. According to
Table 7, classrooms 3’s APC reduction is −28.17% (greatest APC reduction) and it also should have the greatest TLP reduction, which is not observed, as classroom 551’s TLP reduction is even greater due to slacks generated to this variable (−9.9% versus room 3’s −48.88%).
After applying the measures suggested by DEA, the performance of the input/output models is summarized on
Table 9.
Table 9 points out important operating characteristics of input and output oriented models. Regarding lighting, the input-oriented model was more effective for improving the classification: from
Table 9, it can be noted that every classroom except 552-1 was improved to “A” level. Input-oriented models can impose a greater reduction in the inputs, as this is the model’s objective. On the other hand, the model did not improve the classrooms’ lighting systems, and they still have an EM below the value allowed by the standards. The output model, in contrast, corrected the EM of most classrooms (except 550-2 and 550-3), but fewer classrooms were improved to “A”: some were improved to “B” and room-1 went just from “E” to “D”. Since the output orientation’s main objective is to increase outputs and hold the input level, it is justifiable the inferior performance of the model. In addition, classroom 552-1 had a 990 TLP, more than twice of the power it should have to reach level “A”; this excessively high power may explain why both models could not improve its lighting to “A” level. Regarding air conditioning, both models improved efficiency to “A” level in all classrooms, but as these rooms already have the adequate cooling capacity, applying the output-oriented model’s targets will lead to an overrated TCC.
As expected, applying an Input model to modify the lighting variables provides an adequate solution, because it will not increase the luminous flux accordingly. On the other hand, the Output model also generated infeasible solutions for air conditioning, because the classrooms already have the adequate capacity and the goals will increase the TCC even further. Also, the targets provided by the Output model will not increase energy savings considerably, as air conditioning consumes the most energy and no ACP reduction was generated. Thus, it can be concluded that the Input Model goals should be applied only to air conditioning variables (ACP and TCC) and Output Model goals should be applied only to lighting variables (TLP and TLF), in the current situation of Building 5 classrooms.
Using the information from
Table 7, APC reduction suggests the exchange of the current inefficient devices for more efficient ones, maintaining the TRC and increasing their CEEs to at least 3.33 to achieve a performance similarly to the “A” classrooms’ benchmarks. Moreover, these classrooms need a lighting redesign, as the standards and
Table 9 suggests; by exchanging the current lamps for efficient ones with a least 100 lm/W, the TLP can be reduced a bit while increasing the TLF at the same time. In addition, classrooms 550-2 and 550-3 should have a complete lighting system redesign, in order to increase their illuminances to at least 500 lx. This can be achieved by increasing their TLP and TLF values to the same ones suggested for classroom 500-1 because they have the same areas. The discussion above can be adequately adapted for residential applications by simply using the RTQ-R indices rather than the RTQ-C indices. Thus, the methodology can cover cases of public, commercial and residential buildings, making up the whole of a small city profile. Ultimately, it can even extend to larger applications. The findings presented here can be an important step forward for the concept of the smart city.
6. Conclusions
This paper presented a new approach to evaluating public buildings’ energy efficiency, applying DEA models to generate optimum targets for the classrooms’ lighting and air conditioning systems’ undesirable inputs/outputs. The use of DEA evaluation gave a quick overview of the analyzed DMUs, allowing the identification of which need more attention, and which are closer to the ideal classification. It can be concluded that this proposed DEA method has great potential in energy efficiency evaluation and can be used as a decision-making aided support tool to help administrators to improve energy efficiency while attending the RTW-C requirements.
Calculated scores showed inefficiency in all Building 5 classrooms, which confirms the low efficiency classification obtained by applying RTQ-C standards. The presented results confirmed that most of the set of targets and goals generated by the DEA model were effective, as all of the inefficient Building 5 classrooms had air conditioning efficiency improved to “A” level and most of them had the lighting efficiency improved to “A” or at least “C” level. The analysis of the solutions generated by the DEA models show that both input and output-oriented models are applicable, each one to a particular situation whether the lighting/air conditioning system is adequate or not.
Considering the best performance of the DEA model—the input-oriented model, as shown in
Table 7—it is possible to achieve a reduction of installed power in the lighting system of the rooms studied from 8415 kW to 4735.59 kW, which means a decrease of 43.5%. Regarding the air conditioning system, the reduction achieved is from 51,937 kW to 40,133.5 kW, or 22.7%. It is worth mentioning that there is a guarantee that all minimum limits dictated by the current lighting and air conditioning standards for this type of building are being respected. Even with this effort, the installed capacity reduction for the entire installation is 25.6%.
As an extension of this study, due to the characteristics of the campus where this proposal was executed, it is possible to further this discussion and apply its successful results in projects that involve concepts of small smart cities, for example, contributing to optimize the sustainability indexes wanted in the context of these projects.

 ,
, 


