1. Introduction
Responsible Research and Innovation (RRI) has attracted notable interest of the scientific community in Europe. The inclusion of this concept in the European scientific policies since 2010 has been an indisputable driving force. In 2014, the European Commission (EC) defined Responsible Research and Innovation (RRI) as a practice in which “societal actors work together during the whole research and innovation process in order to better align both the process and its outcomes with the values, needs, and expectations of European society” [
1]. RRI brings together a body of theoretical concerns that arose since the 18th century [
2] and crystallized during the 19th century [
3] around the expected and unexpected impacts of research and innovation, technology assessment, and regulation of science. Increased technological capacity has evolved in parallel with the interest in the consequences and the impact of such research activity. However, using the acronym RRI to channel these concerns is much more recent [
4]. The quick and mainstreamed irruption of the concept RRI in the European scientific agenda caused a reaction from the scientific community, which reflects on how it might be articulated and put in practice, how to measure efforts in this context, and how to integrate the efforts made in other areas of knowledge. The purpose of this article is to present an exploratory study on how the multicriteria analysis technique Analytical Hierarchical Process (AHP) [
5] could be used to weight and select by relevant actors the indicators proposed so far [
6] to measure the processes, results, and outcomes of the RRI policies and initiatives in specific contexts. AHP is a well-known technique based on assessing criteria by means of pairwise comparisons. This technique enables taking into account several variables in accordance with the multidimensional structure of the object of analysis, making judgments based on paired comparisons and obtaining one-dimensional AHP weights that represent the relative importance of the indicators. A detailed description of this technique is presented in
Section 2.3 of this article.
1.1. Responsible Research and Innovation in Europe
Proponents of the concept RRI have been mainly organizations funding public research programmes. In this regard, the European Commission (EC) has played a key role due to its influence among the agents of research in Europe.
The current organization of RRI proposed in Horizon 2020 program is the culmination of a process which began in 2001 [
1]. The action plan “Science and Society” of the Sixth Framework Program for Research and Innovation of the European Commission (2002–2006) defined a common strategy that would allow a better connection between science and the public. The inclusion of that consideration moved to the next action plan, “Science in Society”, in the Seventh Framework Program for Research and Innovation (2007–2013), also of the European Commission. “Science in Society” had as objectives to accelerate participation and promote two-way dialogue between the scientific community and civil society. The interest to improve relations between science and society culminated with the adoption of the concept RRI in Part V, “Science with and for Society”, of the Horizon 2020 funding program of the European Commission. This represented a milestone in the consolidation of RRI stands in the jargon of the policies of research and innovation in Europe.
During the last years, the connections between science and society, and efforts to organize innovation ecosystems in which the concerns of the general public were considered also attracted the interest of different groups of academics [
7]. They often used the term Responsible Innovation (RI), with a special focus on the management and decision-making processes around expected and unexpected impacts of technology and innovation.
The commitment to actively engage stakeholders to improve the processes of decision-making and mutual learning in the field of research and innovation is identified as one of the main features in different definitions of the term RRI [
8], and it is aligned with the discourse ethics formulated by the German philosophers Karl-Otto Apel [
9] and Jüger Habermas [
10]. The participation of stakeholders in these decision-making processes in science through rational dialogue would be necessary to legitimize the demands, interests, and expectations of society. In this regard, the European Commission [
1] (p. 2) proposed a definition that adds references about the alignment of values among stakeholders and the research and innovation ecosystem that this process involves: “Responsible Research and Innovation means that societal actors work together during the whole research and innovation process in order to better align both the process and its outcomes with the values, needs, and expectations of European Society”.
Von Schomberg’s definition of RRI [
2] (p. 19) combines the reference to dialogue among stakeholders groups with the shared responsibility of the different actors: “Responsible Research and Innovation is a transparent, interactive process by which societal actors and innovations become mutually responsive to each other with a view to the (ethical) acceptability, sustainability, and societal desirability of the innovation process and its marketable products (in order to allow a proper embedding of scientific and technological advances in our society)”.
The reference to the sustainability imperative proposed by the Brundtland Commission [
11] is also mentioned in the definition of Stilgoe et al. [
3] (p. 1570): “Responsible innovation means taking care of the future through collective stewardship of science and innovation in the present”, in line with the concept of responsibility formulated by Hans Jonas [
12].
In a similar way, van den Hoven and Jacob [
13] (p. 3) remarked the importance of active participation of stakeholders in considering future impacts of research and contrasting them with the ethical values as a key feature of RRI: “Responsible Research and Innovation (RRI) refers to the comprehensive approach of proceeding in research and innovation in ways that allow all stakeholders that are involved in the processes of research and innovation at an early stage (A) to obtain relevant knowledge on the consequences of the outcomes of their actions and on the range of options open to them and (B) to effectively evaluate both outcomes and options in terms of societal needs and moral values and (C) to use these considerations (under A and B) as functional requirements for design and development of new research, products, and services”.
To the active involvement of stakeholders in all phases of the research and innovation process, a set of dimensions has been added with the purpose of establishing a framework to construct responsible ecosystems of innovation. These dimensions, identified by researchers such as Stilgoe et al. [
3,
4] using the term Responsible Innovation rather than RRI, are relevant to the development of the theoretical framework around RRI and RI in the future and include: anticipation, reflexivity, inclusion, and responsiveness.
As far as both concepts, RRI and RI, are developed, different combinations of levels or responsibility can be identified. On the one side, the concept of RRI combines thematic areas of the intrinsic personal responsibility of scientists and collective responsibilities of research and innovation organizations. On the other hand, the framework for RI emphasizes the features that a responsible ecosystem should have to assure correct technology assessment and decision-making processes.
For the purpose of our study, focused on the indicators proposed to measure RRI initiatives, the approach of the European Commission has been used, which is structured around thematic elements or areas of key importance in the articulation of RRI. The importance of analysing those key areas lies on the fact that they define the components of all the proposals of indicators available so far to measure RRI initiatives and policies. In this sense, the European Commission has a central role in the promotion of Responsible Research and Innovation and is responsible for articulating a framework for its promotion in European scientific policies. This newly created framework was structured by the EC around six key areas [
1,
14]:
Public engagement, which refers to the “engagement of all the societal actors—researches, industry, policy-makers, and civil society and their joint participation in the research and innovation process” [
1,
14].
Gender equality, which means that “all actors—women and men—are on board” in the public engagement activities [
1,
14].
Science education, which implies the enhancement “the current education process to better equip future researchers and other societal actors with the necessary knowledge and tools to fully participate and take responsibility in the research and innovation processes” [
1,
14].
Open Access, which means “giving free online access to the results of publicly-funded research (publication and data)” [
1,
14].
Ethics, which highlights that “in order to adequately respond to societal challenges, research and innovation must respect fundamental rights and the highest ethical standards” [
1,
14].
Governance, an umbrella key area that remarks that policy-makers “have a responsibility to prevent harmful or unethical developments in research and innovation” [
1,
14].
The proposal by the European Commission of these six key dimensions has led to the use of this categorization in the research projects and tenders funded by this supra-national administration. Following the argumentation about the current differences between RRI and RI, it can be identified that, apart from the key areas of public engagement and governance, the articulation of the other four areas of the EC is much more aligned with the so-called ethics of causality. In other words, some of the key areas are highly connected with the core role of science, developing knowledge about the world, and not as much with the ethics of dialogue. In fact, the content of those four areas refers to the expectation of responsible procedures and behaviour by scientists such as honest reporting of data, sharing important results, serving as peer reviews, and training the next generation of scientists properly [
15].
The inclusion of these six areas in RRI, and no others, have been timidly discussed. Van den Hoven and Jacob raised attention to the fact that “many societal needs around the globe have not yet received a lot of attention from researchers, companies, and governments, despite the enormous potential for innovative solutions which accommodate widely shared public values” [
13] (p. 15). Some authors [
6] have proposed to increase the number of key areas of the EC framework, providing two new ones, social justice and environmental sustainability. These new areas could integrate the unattended fields mentioned by van den Hoven and Jacob. Additionally, the authors of this work consider that the area of gender equality could also include other factors of diversity such as race, age, and disability.
Recently, Stahl et al. [
16] defined a Maturity Model of RRI to integrate the dimensions proposed by Stilgoe et al. [
3,
4] with the key areas proposed by the European Commission [
1,
14] around categories and components of the term.
The discussion about what areas, dimensions, and categories should articulate the framework of RRI is certainly incipient, and a passionate intellectual debate on this subject will probably take place in the next years. This debate will be of vital importance, as it will determine the content of the proposals for the monitoring of initiatives, projects, and policies of RRI. The next section will explore the state of the art in that process of monitoring RRI in Europe.
1.2. Indicators for Monitoring Responsible Research and Innovation
The commitment of the European Commission to promoting the RRI approach has resulted in the inclusion of specific calls for projects of research and coordination under this topic in Horizon 2020, concretely under the umbrella of Part V, “Science with and for Society Work Programmes”. In parallel, the European Commission is making efforts to promote the consideration of RRI as an inter-sectorial issue in the other parts of the Horizon 2020 programme not specifically dedicated to this issue.
The European Commission has also reinforced the commitment to the monitoring of the RRI approach by promoting definitions of indicators to measure initiatives and policies on RRI. For this purpose, it has funded two studies with the objective of evaluating and monitoring the performance of the different scientific actors in each of the six key dimensions previously mentioned.
The first initiative took place in 2015 with the appointment of a group of experts with the objective of establishing indicators for monitoring the impact of RRI. The result of this first action was a report published in June 2015 that provided a list of 82 indicators for the six areas proposed by the European Commission [
6]. Those indicators were organized in three categories: process, outcomes, and perception, in order to include indicators referring to the action taken within the Research and Innovation sector (processes and outcomes) and to the perception of those processes and indicators by other actors and society in general [
6]. The report also proposed the inclusion of two new areas: (environmental) sustainability and social justice. The group of experts decided to include these two new areas to introduce in their work the importance of addressing the question about to what extend does a research field, a research programme, or an RRI initiative contribute to sustainable growth, in the case of (environmental) sustainability and to monitor the impact of research and its effect on social justice and inclusion, in the case of social justice. In reference to these new two areas, the authors did not propose a detailed list of indicators but instead proposed ideas and suggestions about how they could be defined.
This first list of indicators is relevant to the study of monitoring RRI, as it is the first effort made to operatize a system of monitoring and reporting. Even though, it cannot be considered a definitive proposal, as in 2013 the European Commission launched a tender with a double objective: “select a set of quantitative and qualitative indicators and metrics and develop a methodology and the related tools to collect and analyse data in order to monitor evolution of RRI dimensions and benefits over time” [
17] (p. 16). The results of this tender will not be available until mid-2017, which reinforces the idea of Iatridis and Schroeder [
18], that metrics and tools for RRI are still preliminary or in the phase of development.
The potential of applying standards, initiatives, and principles already existing for the monitoring of other disciplines as Corporate Social Responsibility has also been explored [
18]. In a similar way, Wickson and Carew [
8] explored the development of indicators and quality criteria through the integration of knowledge of other disciplines such as Corporate Social Responsibility, Public Value Failure Mapping, and Multi-Criteria Decision Analysis.
Under this context, wherein the authors of this study foresee a forthcoming interest to define the areas which compose the RRI approach and the respective indicators of monitoring, this study aims to apply a methodology that will facilitate the adaptation of extended lists of indicators to the reality and requirements of specific contexts.
In this work, an explorative application of the AHP method was designed and applied to assess the importance of the indicators for six areas of RRI based on the available list of indicators. It relies on the opinion of experts in each of the six key areas of RRI proposed by the European Commission who provided different weights for the different indicators under each category (process, outcome, and perception) of the six areas. These weights are later used to propose different options to reduce a large set of indicators to a smaller one according to the experts’ opinions. These smaller sets of indicators allow decision-makers to identify where efforts should be made to measure in a specific context the more relevant information of RRI performance.
Our work is based on the three hypotheses:
Indicators to monitor and evaluate RRI initiatives and policies might not have the same relevance in different contexts.
Indicators to monitor and evaluate RRI initiatives and policies can be prioritized.
The AHP methodology might be a useful tool to propose reduced and context-based sets of indicators to specific contexts.
The availability of a methodology to select reduced and context-based sets of indicators of RRI initiatives and policies can be of great value for policy-makers, funding organizations, and any other decision-makers who have to decide what indicators might be used to evaluate RRI policies and initiatives in a specific context.
The remaining paper is as follows: in
Section 2 the methodology for the profiling of stakeholders and the prioritization of indicators is presented, and in
Section 3 the application of the proposed methodology and a detailed case study is presented with a broad description of the obtained results. Finally, in
Section 4 the authors discuss the results and the main conclusions of the work.
2. Materials and Methods
The proposed methodology requires the participation of two types of agents for the adequate implementation of the working sessions, (i) the facilitators of the prioritization process and (ii) a panel of experts in the six key dimensions of RRI (public engagement, gender equality, science education, open access, ethics, and governance). In this work, the facilitators of the process (authors of the article) have reviewed the available list of indicators to measure RRI policies and prepared the materials to carry out the prioritization. They have chosen the proper list of experts for each RRI key dimension who also had a good level of knowledge of the research and/or innovation ecosystem in Spain. The facilitators have guided the experts all along the process of weighting the evaluation criteria. With these weights, the facilitators have finally ranked the indicators and proposed different options for reducing the initial broad set of indicators into a smaller one. A detailed explanation and the possibilities for its application are presented in
Section 3.
The selection of Spain as a case study is based on the reason that the authors of this article have received funds from the Spanish National Ministry of Economy, Industry, and Competitiveness to analyse how the indicators proposed to measure RRI at the European level can be adapted to the reality of the Spanish Research and Innovation system. Spain, as a member of the European Union, is affected by the Research and Innovation European policies, and the methodology applied in this study can be used as an example to develop further adaptations of indicators to other regional research and innovation ecosystems as well as adaptations in other European countries. The discussion of how to identify the most appropriate indicators in different ecosystems might be of high relevance to enrich the debate around RRI indicators with a bottom-up approach.
2.1. Regarding the Experts
This work included six groups of experts, one per each dimension of RRI. The creation of a unique pool of experts to measure all the list of indicators was initially considered but discarded. The different areas of RRI have their own problems, as well as different regulatory tracks and grades of implementation in Spain. For instance, there is a large corpus of both legislation and monitoring frameworks in the field of gender equality and ethics in Spain. Working with areas with different grades of implementation and monitoring frameworks led the authors to consider that it was much more important to have reduced groups of experts with a solid knowledge of the area rather than generalists that might not understand the specific technical problems of each of the six areas. Therefore, experts should fulfil two requisites: (i) having a solid academic or professional background in the respective area and, (ii) having knowledge and professional experience in the Spanish research and/or innovation ecosystem.
2.2. Regarding the List of Indicators
This study considered the list of indicators provided by the EU report “Indicators for promoting and monitoring Responsible Research” [
6]. The set included 82 indicators for the six key areas of RRI (governance, public engagement, gender equality, science education, open access/open science, and ethics) and several suggestions for defining indicators under the two new proposed areas (sustainability and social justice/inclusion). In our study, it was decided to use for prioritization the indicators directly defined in the report. Therefore, the suggestions given to define indicators for the categories of sustainability and social Justice/inclusion were not used.
As identified by the authors of the aforementioned report, the set of criteria is diverse and heterogeneous, and there is also overlap between them. Moreover, some (in particular ethics, sustainability, and social justice/inclusion) may be thought of as being more overarching and encompassing than certain others (public engagement, science education, and open access).
2.3. Regarding Weighting of Criteria
In this study, the AHP method was used for weighting the indicators. The Analytic Hierarchy Process (AHP) proposed by Saaty is a measurement theory of intangible criteria (Saaty 1980). AHP is based on the fact that the inherent complexity of a multiple criteria problem can be solved through the construction of hierarchic structures consisting of a goal, criteria, and alternatives. In each hierarchical level, paired comparisons are made with judgments using numerical values taken from the AHP absolute fundamental scale of 1–9. These comparisons lead to dominance matrices from which ratio scales are derived in the form of principal eigenvectors. These matrices are positive and reciprocal (aij = 1/aji). The synthesis of AHP combines multidimensional scales of measurement into a single one-dimensional scale of priorities.
The method is one of the most extended multicriteria techniques, and it adapts very well to the hierarchy of criteria proposed by the Expert Group on Policy Indicators for Responsible Innovation of the EU. It also has the additional advantage of being easy to explain to the experts that have to assess the different criteria in a simple and systematic way. More details on the AHP can be found in Saaty [
5], Saaty and Peniwati [
19], and García-Melón et al. [
20].
3. Results
This section presents the results of the work. In order to facilitate the understanding, a description of the steps undertaken to measure the indicators of each of the six areas is presented and complemented with a detailed description of the tools used and the results obtained of the area that included more complexity in the work, that is, gender.
3.1. Step 1: List of Indicators
For the selection of indicators to be weighted, the only available proposal of indicators of RRI at the moment the study was designed was used as a reference. This list was included in the report “Indicators for promoting and monitoring Responsible Research” of the Expert Group on Policy Indicators for Responsible Innovation (2015).
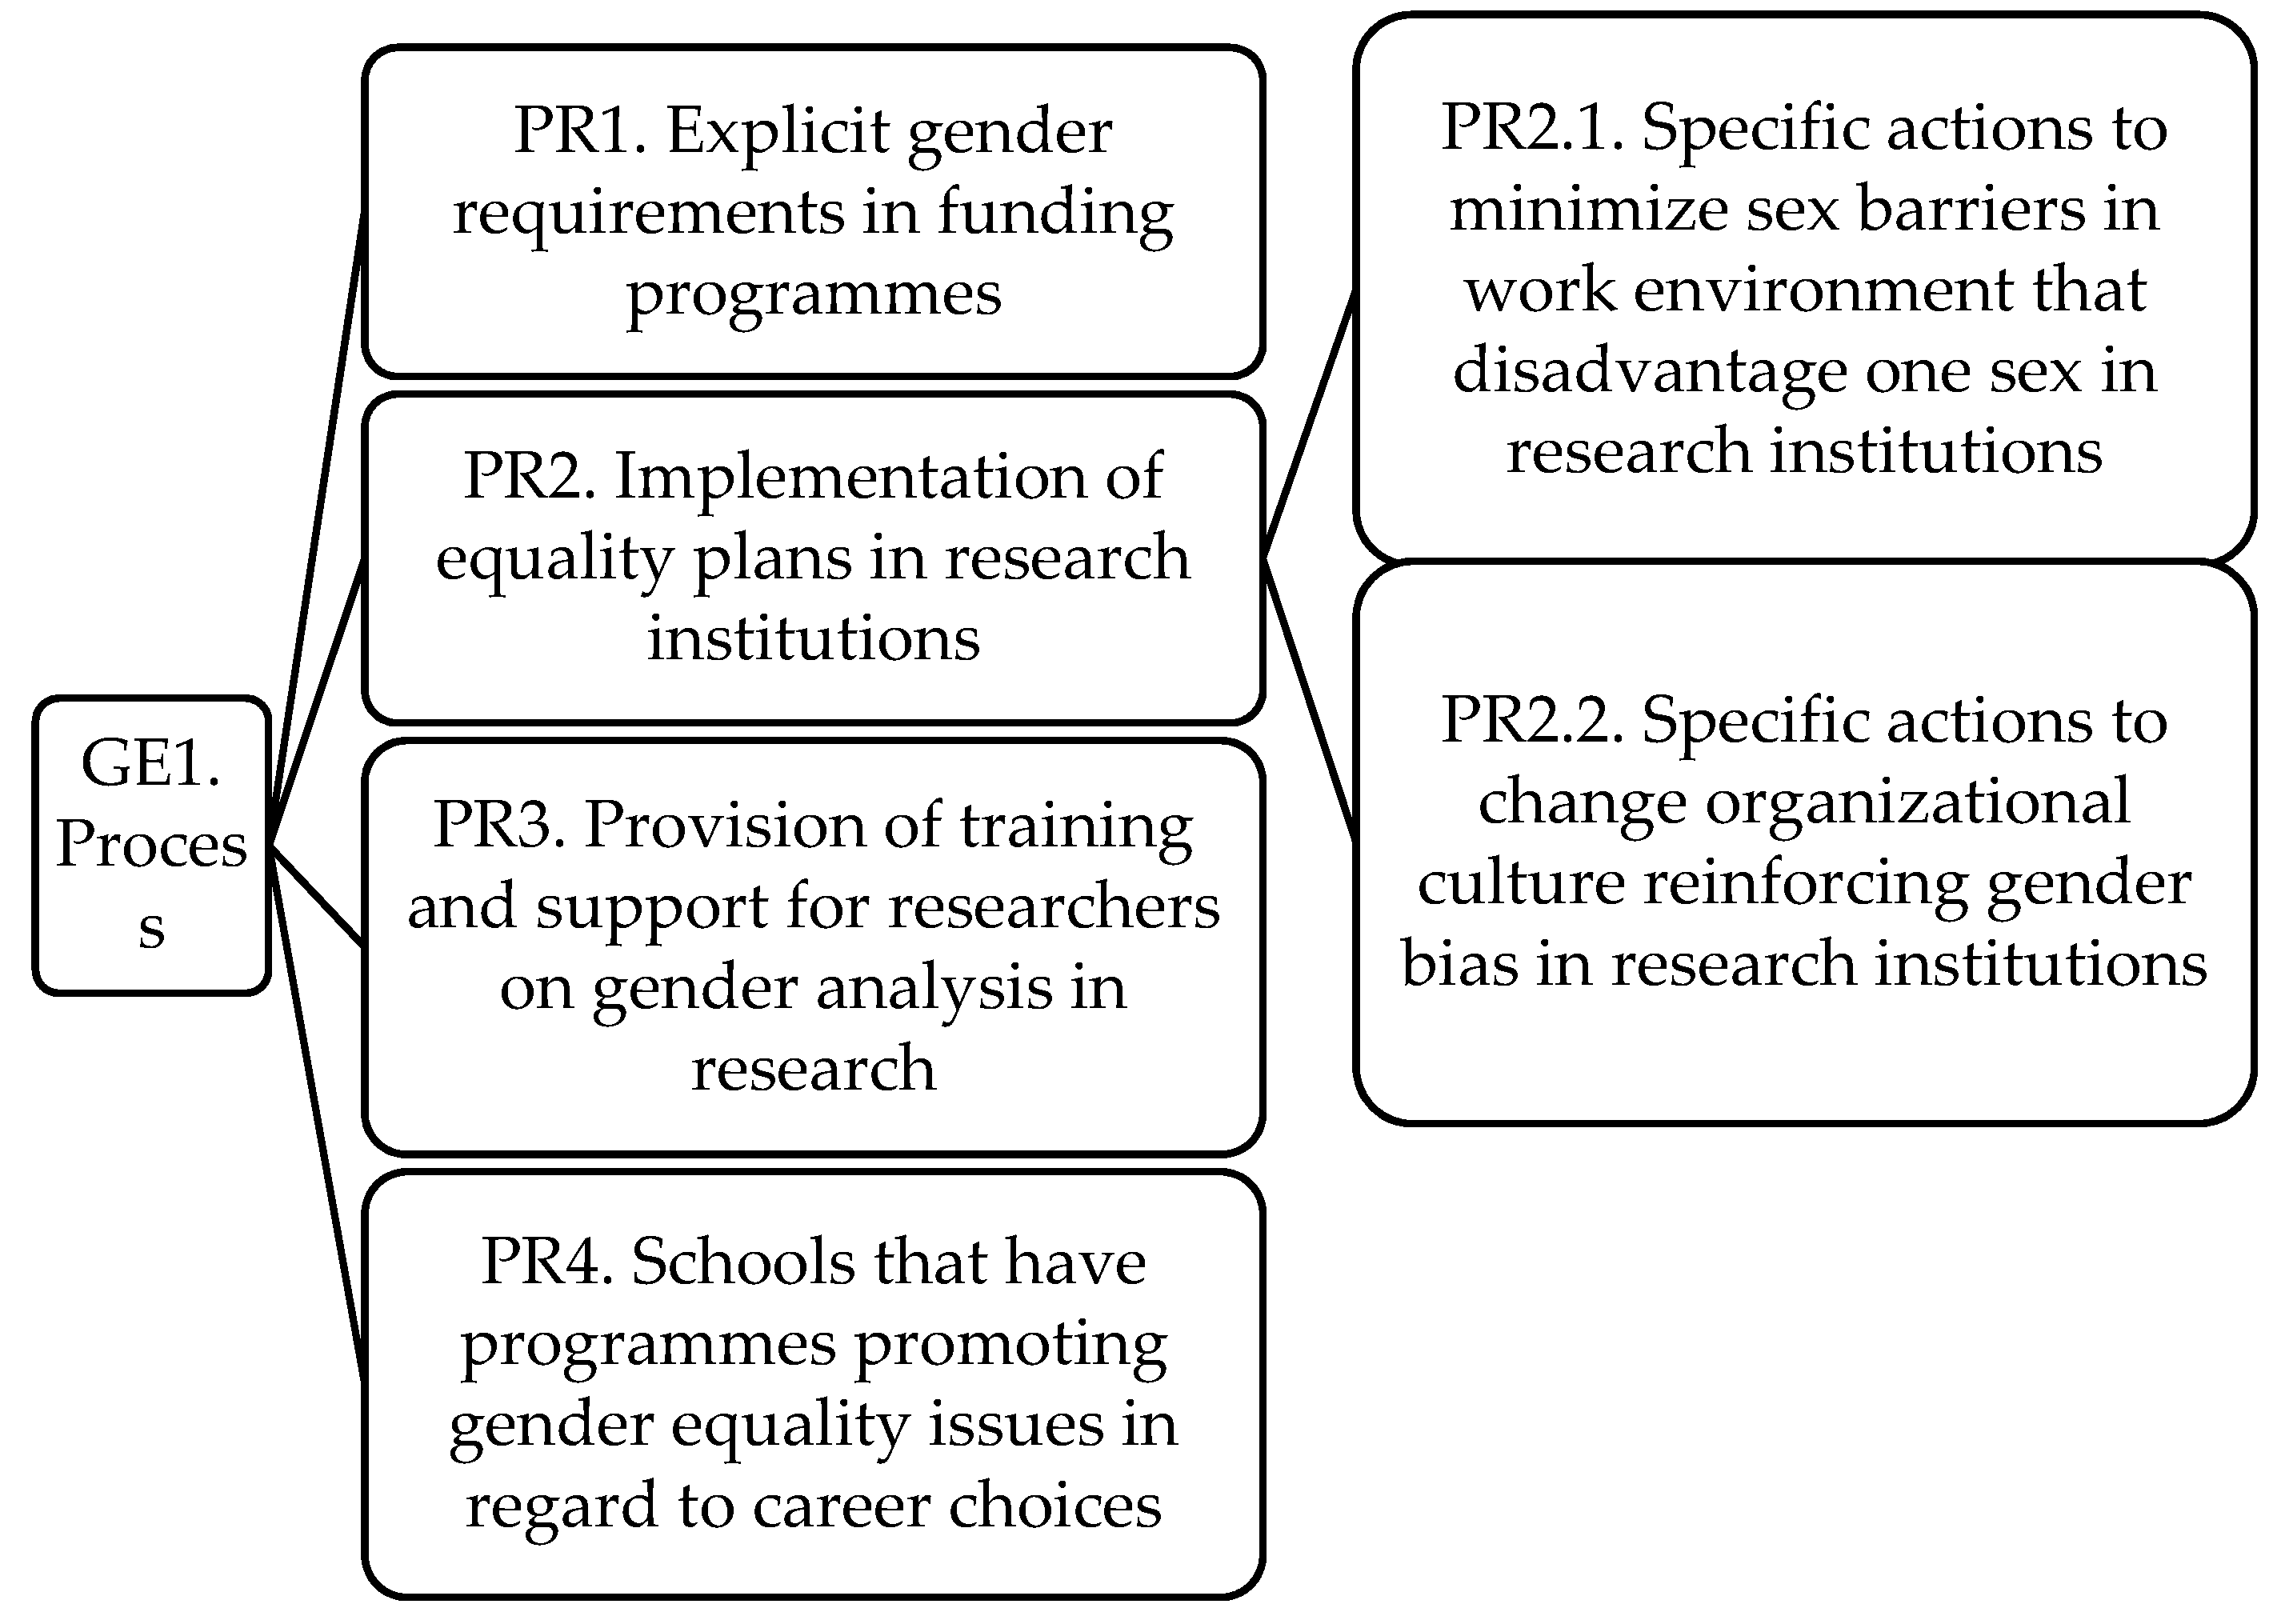
The 82 indicators proposed were organized in three categories for nearly all of the RRI areas: process, outcomes, and perception. To facilitate the elaboration of the materials used for weighting, the indicators were codified according to the area (and three sub-areas in the case of public engagement) and category they belong to (see
Table 1 for the summary of the list of indicators,
Appendix A for the full list of indicators and their codes, and
Table 2 for the codification of the indicators of gender). During these preparatory activities, the authors considered that two of the indicators under the category process (codes: GE_PR2.1 and GE_PR2.2) of the dimension of gender should be classified as hierarchically dependent of another indicator (code: GE_PR2).
3.2. Step 2: Identify Key Expets
As stated above, six groups of experts were identified, one per RRI area. For our work, two experts per area were selected. In the selection of the experts, it was taken into account their level of expertise in each of the areas, their knowledge of the current research and/or innovation ecosystems in Spain, and their willingness and availability to participate in this study. Moreover, some other personal average data such as gender was also considered.
A description of participant experts is given in
Table 3. For some of them it has not been possible to give more details about their names or companies, due to confidential reasons. In brackets, the gender of the expert is shown: male or female.
3.3. Step 3: Weigh the Indicators
For the weighting of the indicators, the AHP method was used. AHP requires a hierarchical model of criteria (see
Figure 1 for the category “Process” of the area “Gender”) to pairwise compare all the criteria (indicators) and to obtain a final weight for them [
19]. A questionnaire was designed for each area for this purpose. The questionnaires were conducted through a personal interview with each of the 12 experts. Interviews were carried out either with face-to-face meetings or by videoconference, depending on the interviewee’s preferences and availability. First, a set of instructions was presented to explain which comparisons were to be made according to the hierarchical structure proposed and the nine-point Saaty’s scale. Last, the surveys were processed using software Superdecisions © v. 2.4.0. (Creative Decision, Pittsburgh, PA, USA). Weights or relative importance for each indicator and for each expert were derived. A sample of the questionnaire for the dimension “Gender” and the category “Process” is shown in
Table 4.
All interviews were carried out personally; on the one hand because experts had to understand the research aims, the AHP method, and the AHP questionnaires, and on the other hand because all comments and other valuable information experts could give were to be gathered for the research. Interviews lasted around 45 min; the first stage was devoted to the research aims, the method, and the questionnaire. The second stage was devoted to answering the questions (comparisons) and the AHP facilitators did not interfere in this stage.
Every expert obtained a different set of weights, according to his/her preferences. In order to obtain the global weighting, the aggregation of the results of the individual priorities by means of geometric mean was used as suggested by Saaty and Peniwati (2008).
3.4. Step 4: Reduced Set of Indicators
The prioritization of the indicators presented in the previous section allows ordering a long set of indicators by the importance given by a group of experts under each category and for each area analysed. A list with these characteristics can be a starting point to identify what indicators should be prioritized in a context where, for different reasons, it might not be possible to collect data for all the indicators. With this tool, policy- and decision-makers can identify what sort of information should be collected to monitor RRI initiatives and policies, taking into account the most relevant indicators according to a set of experts or other stakeholders in the area.
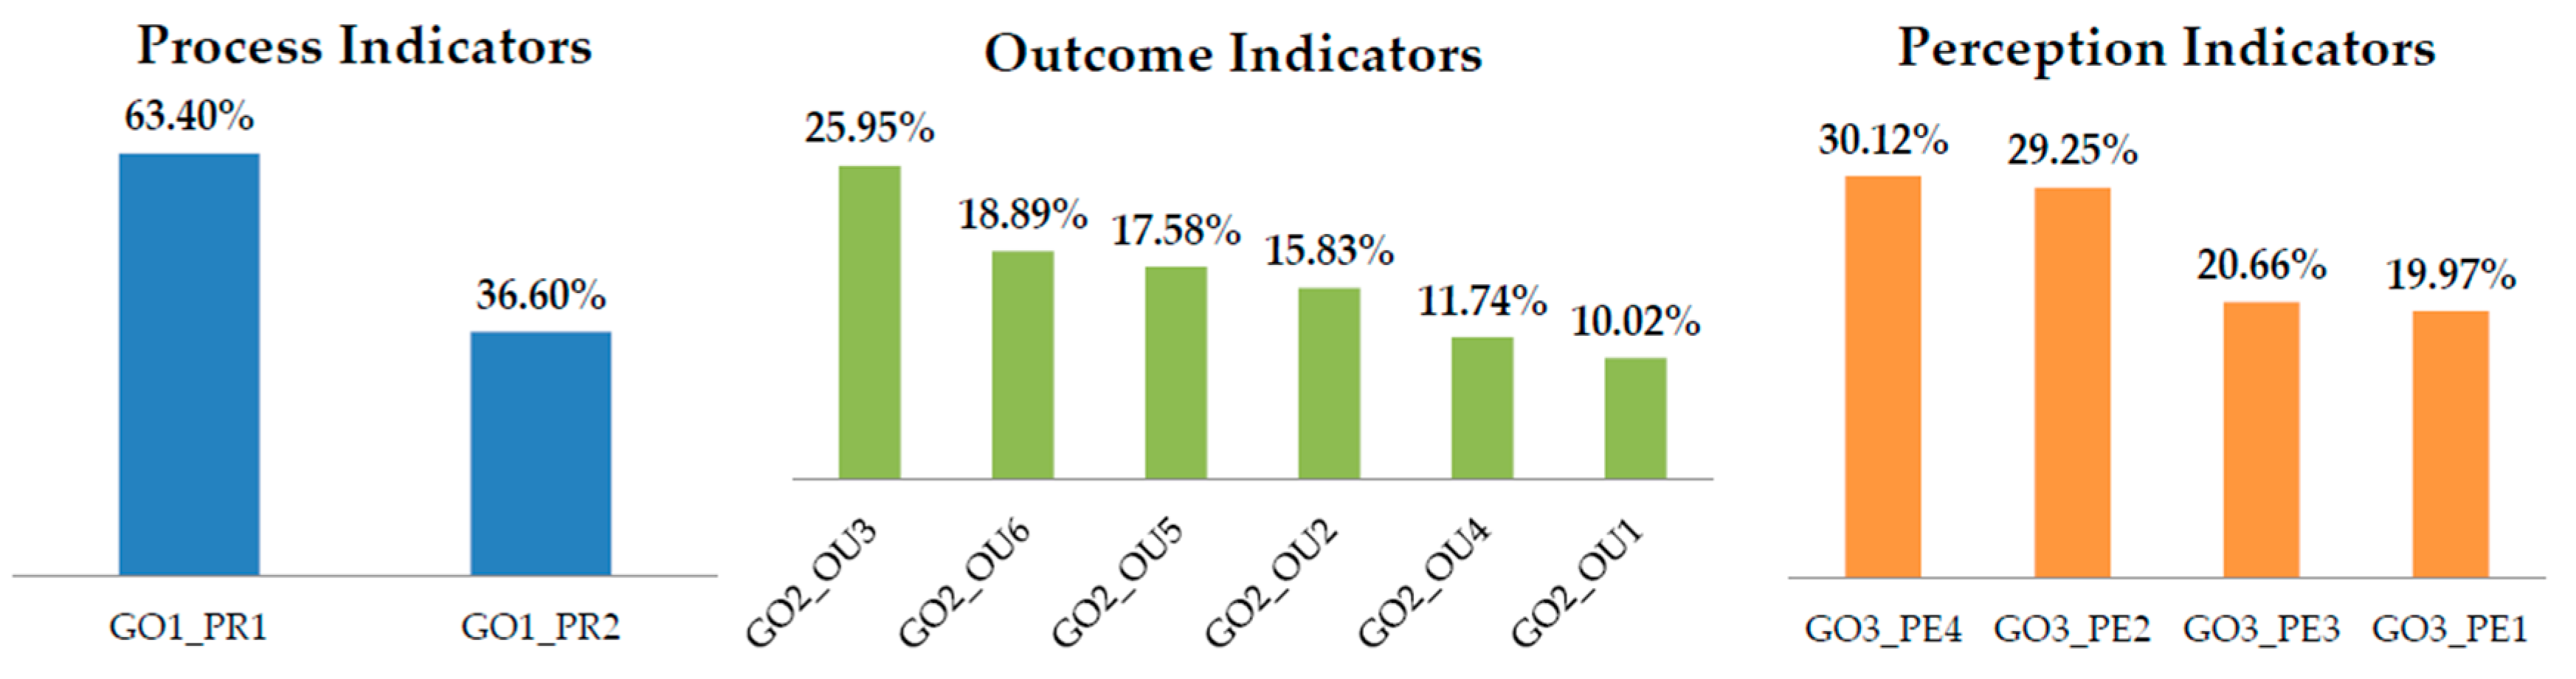
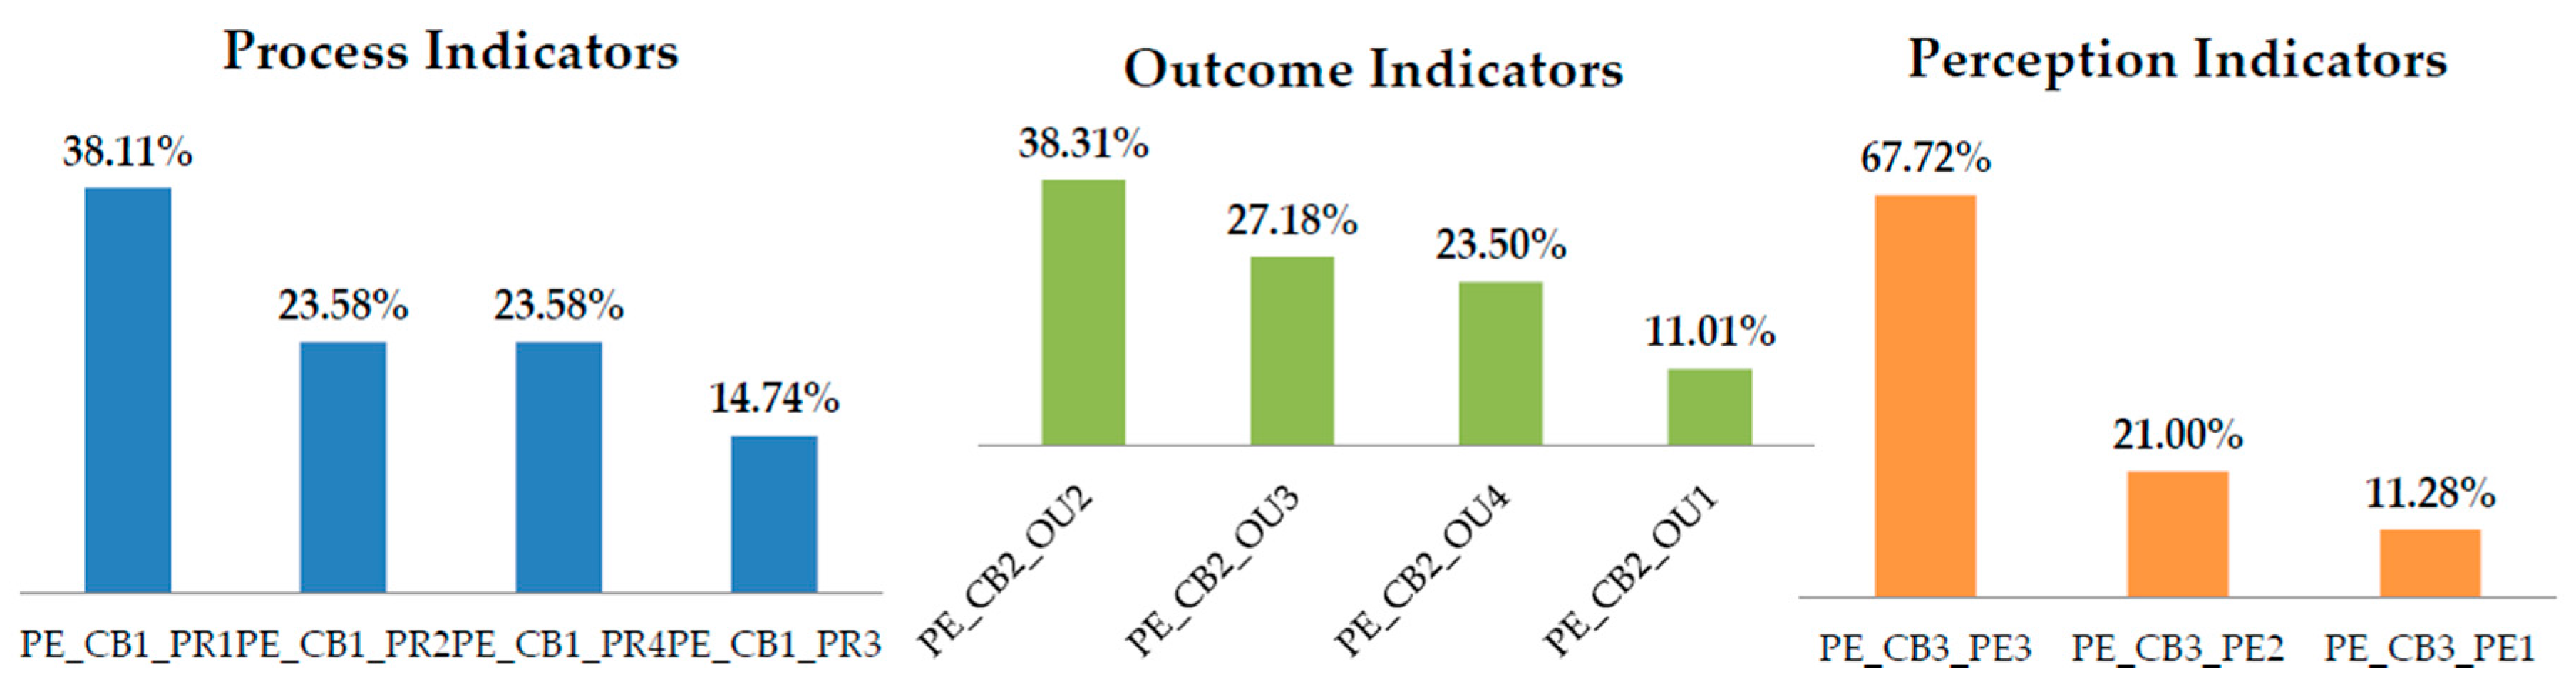
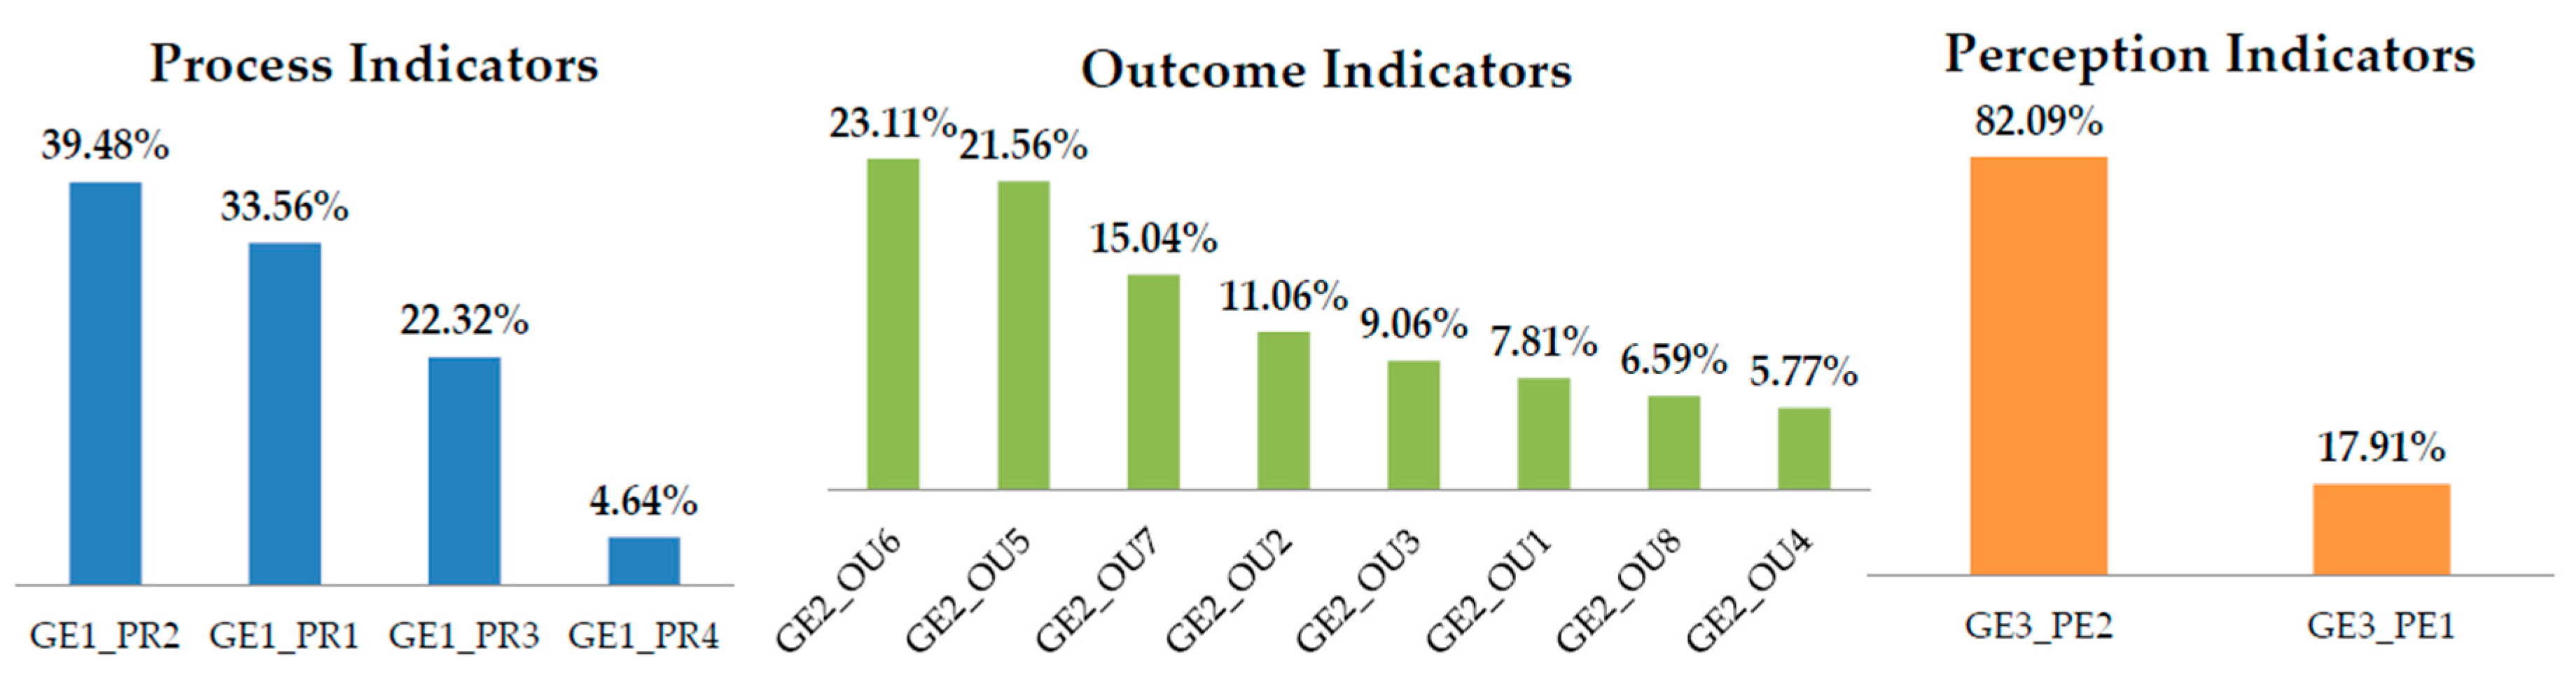
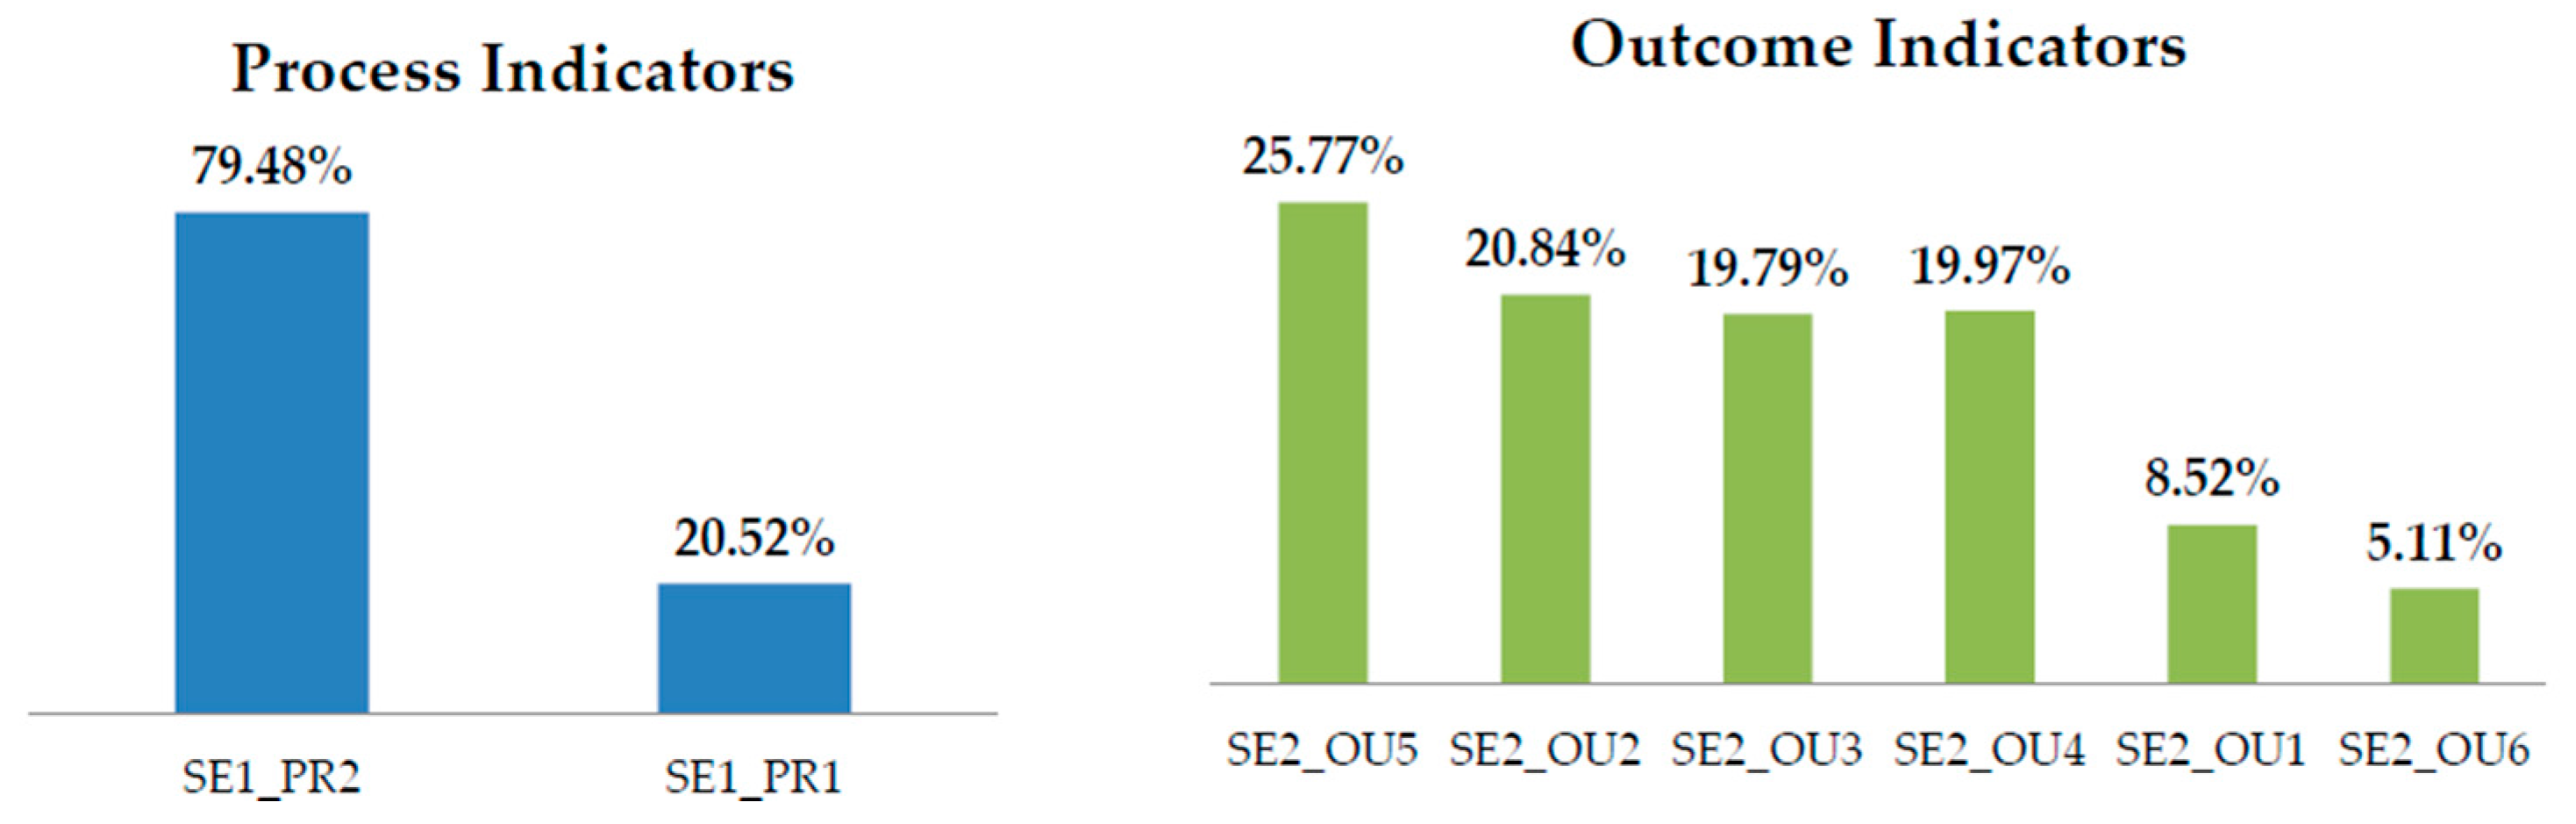
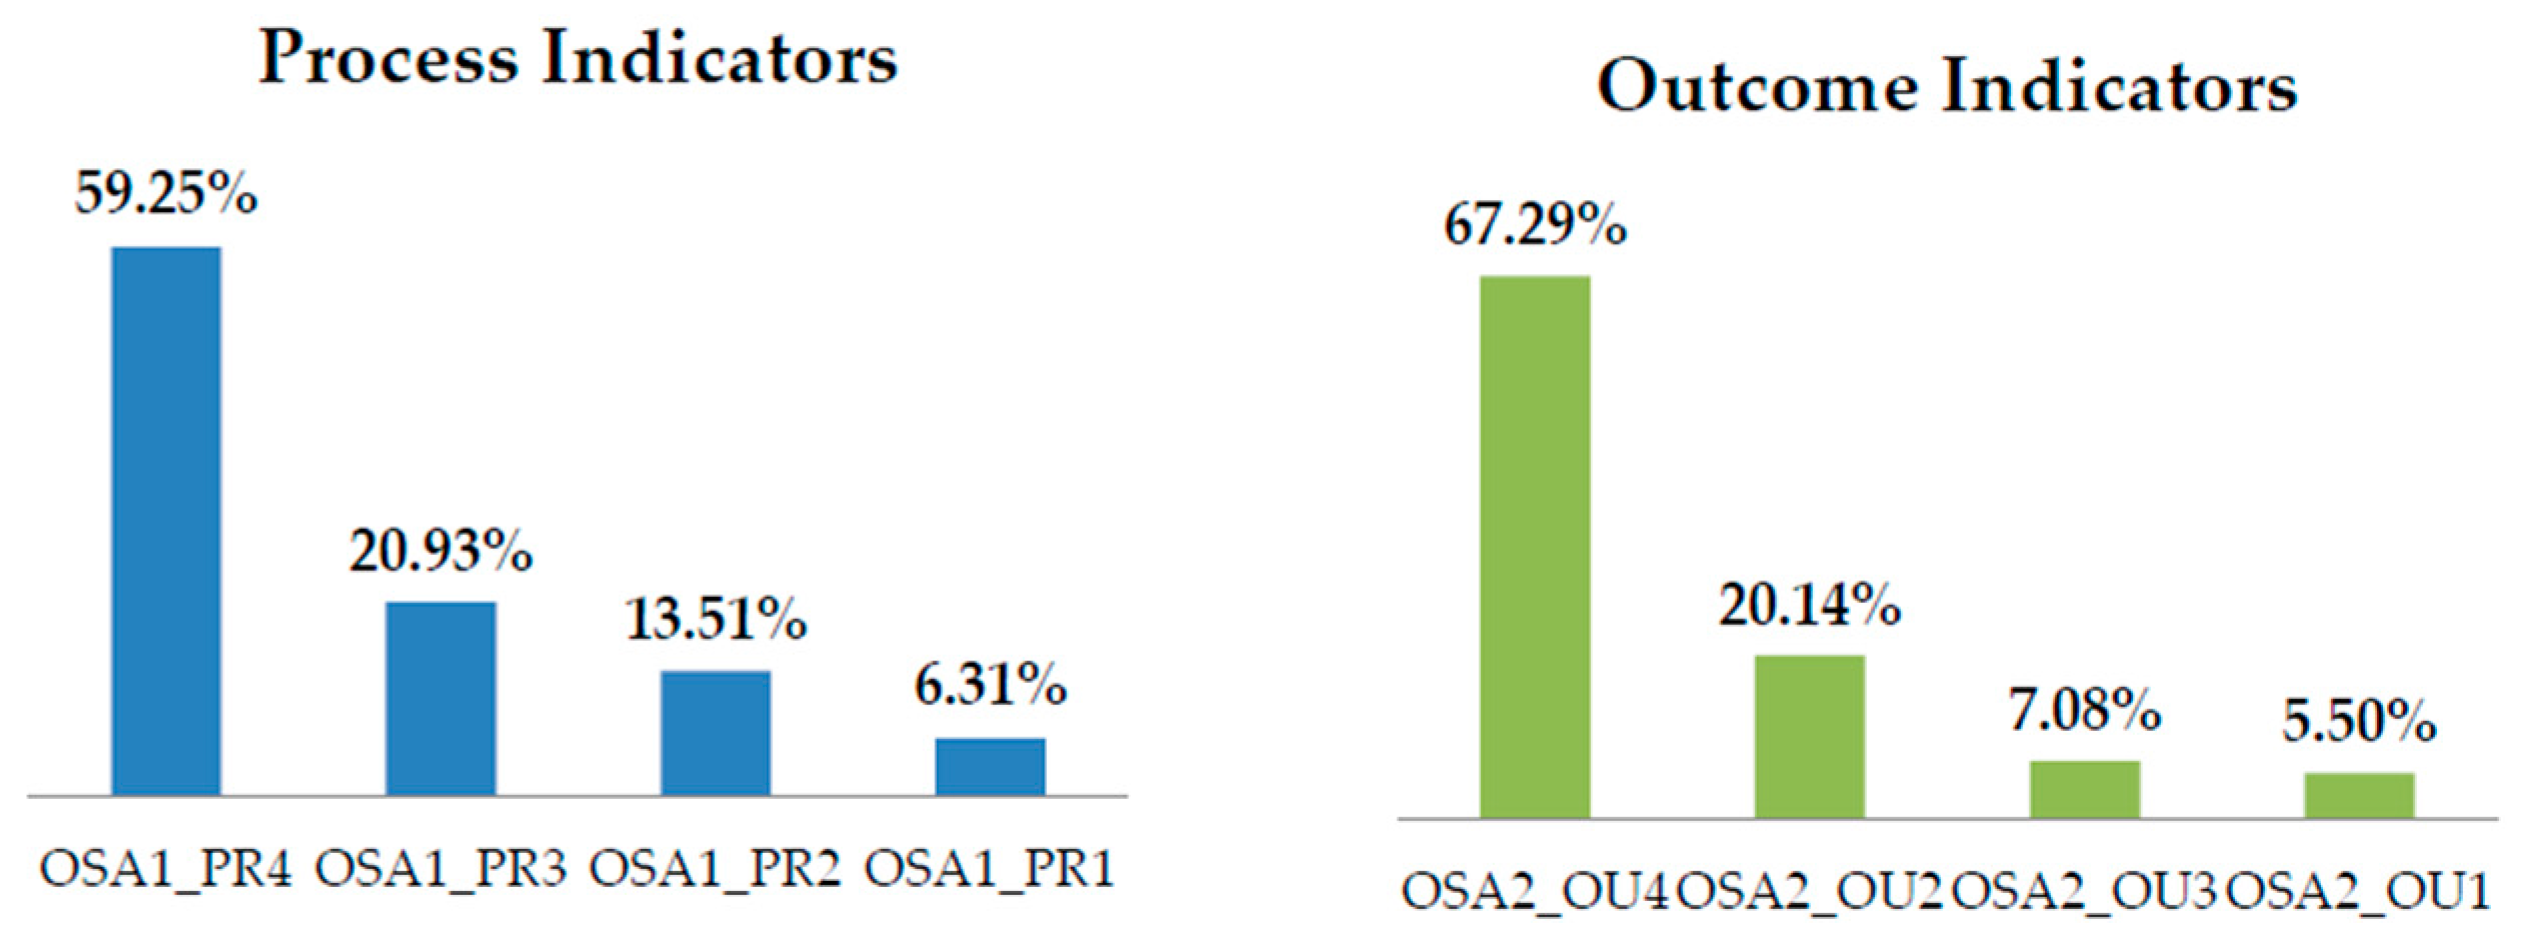
Policy- and decision-makers could use different approaches to identify the minimum indicators to be considered when monitoring and evaluating an initiative or policy. One option would be applying the criteria “Best in class”; selecting the more relevant indicator under each area and category. Following with the case of gender, the reduced list of indicators imply considering five indicators from the original list of 16 indicators (see
Table 6); one in the categories of outcome and perception and three in the category of process, as the one with higher normalized geometric mean has two hierarchical dependent indicators.
A second option would be selecting a cut-off percentage and selecting just those indicators starting from the first positions for which normalized geometric means (NGM) sum up the cut-off percentage. This could be applied using the Pareto rule and, supposing that selecting 20% of the indicators could allow monitoring 80% of the phenomena, that will imply selecting the first indicators for which the normalized geometric means add up to 20%. In this study, the authors opted to use 50% instead of 20% according to the Pareto rule, as if this rule was applied, the result would be completely the same as the “Best in class” option. As our aim was to show different possibilities to accommodate the concrete needs of policy- and decision-makers, using 50% showed difference in the final sets obtained.
The application of the “50% NGM” resulted in the selection of the indicators listed in
Table 7 for the area “Gender”.
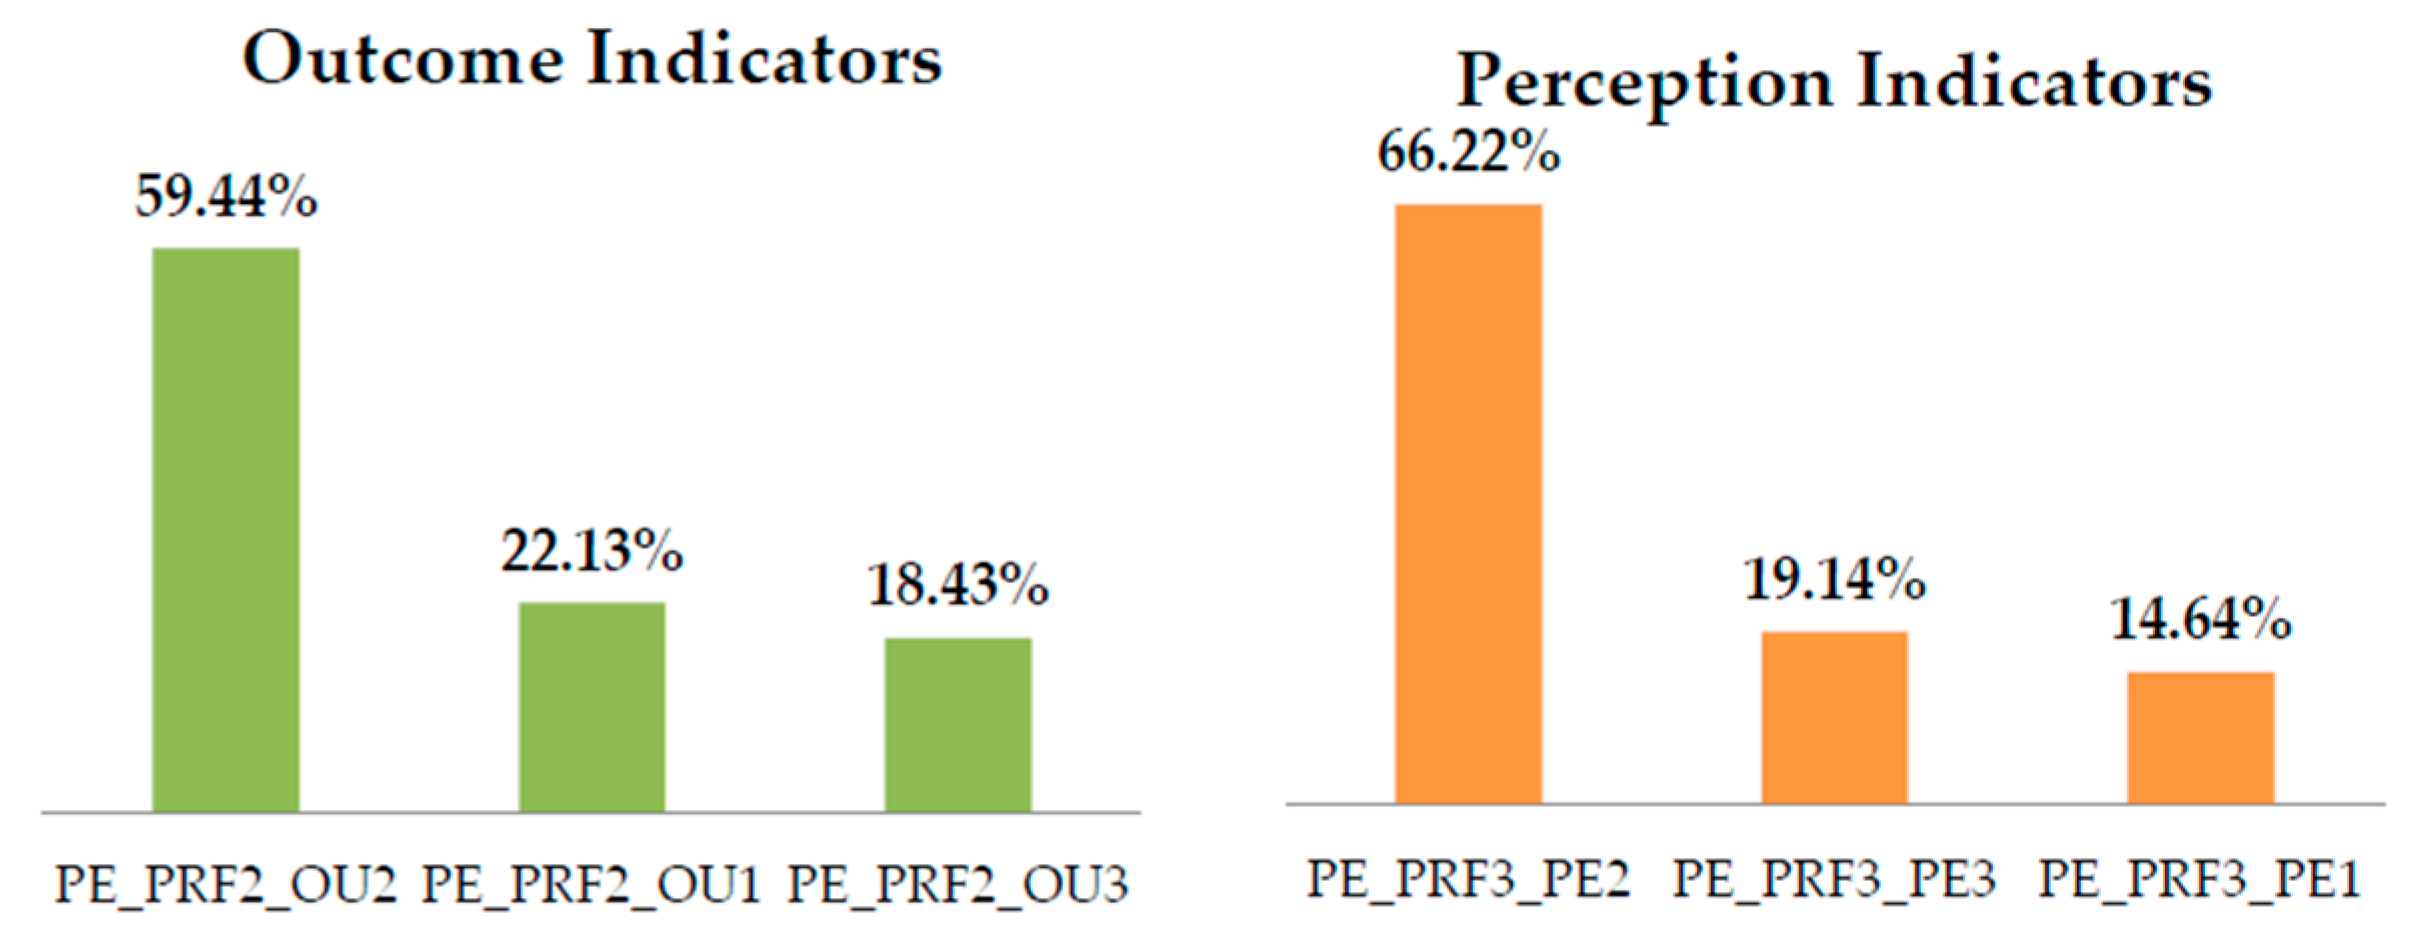
A third option would be considering a percentage of the total indicators to be selected. For instance, at least half of the most relevant indicators would be selected in order to reduce the amount of data to be gathered, but still collect 50% of the more relevant indicators. By applying the rule “50% of indicators”, the results of the reduced set for the dimension “Gender” implies the reduction of the initial 16 indicators into nine, four of them from the category process, another for the category outcome, and one for the category perception, as presented in
Table 8.
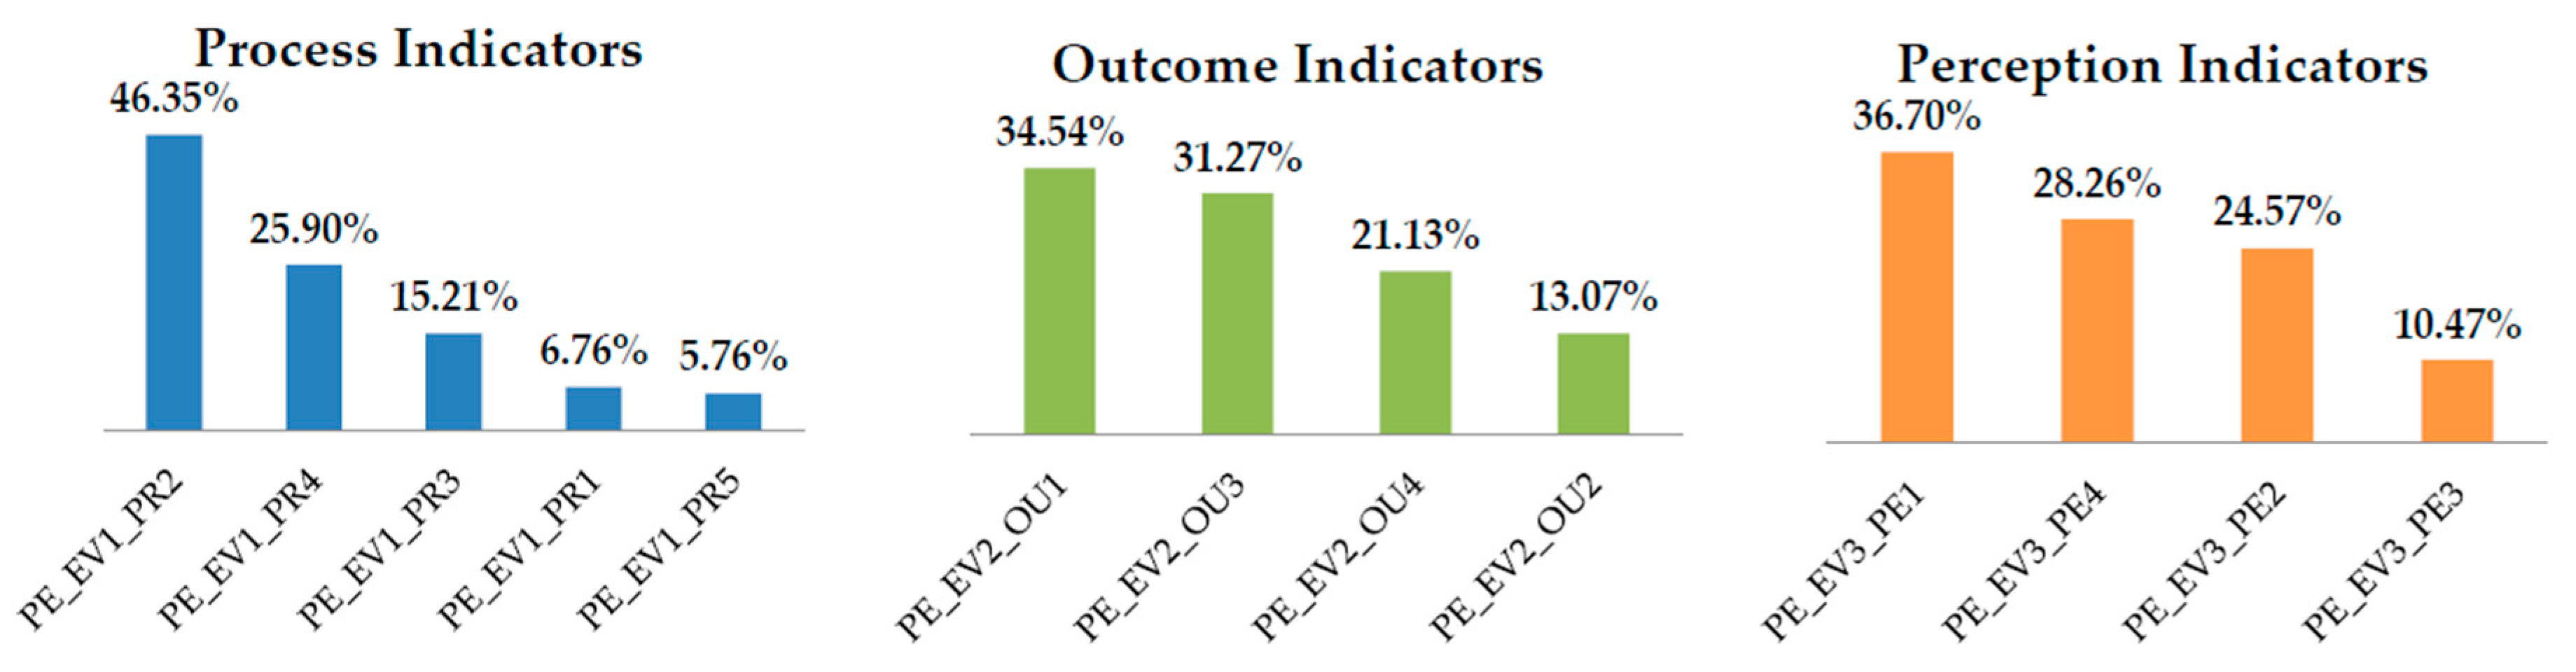
Finally, a fourth option would be to select the most relevant indicators not to be discarded in case of a need to reduce a long set of indicators, by selecting those indicators with normalized geometric means higher than the difference between the highest and the lowest normalized geometric mean in the category. The application of this criteria implies the selection of six indicators from the initial list of 16 indicators in the dimension “Gender” (see
Table 9). In
Table 9, both the selected and not selected indicators are included. The aim of this is to facilitate the understanding of the reader, as the difference between the highest and the lowest normalized geometric means is calculated from the NGM of both selected (the highest NGM) and not selected (the lowest NGM) indicators.
The reduced set of indicators for all of the areas, which can be consulted in
Appendix B, differ in number depending on the criteria of the selection process used. So, for criteria “Best in class” the resulting indicators number 24, for criteria “50% NGM” there are 38, for criteria “50% indicators” there are 45, and finally for criteria “NGM highest than the difference between the highest and lowest NGM” there are 37.
4. Discussion
The way in which science and innovation will be aligned with societal concerns and values will be an increasing topic of discussion in the coming years. The proposals to operatize a framework around key areas, as put forth by the European Commission regarding RRI, or around dimensions, as proposed in the framework for RI, still need reflection and broader debate and discussion to be implemented in European and national science and innovation ecosystems. Understanding how to approach science in society and establish a continuum dialogue between scientists and the general public is of key importance both for the implicit responsibility that accompanies the enormous power of science and innovation in transforming the living conditions of society and for a justice imperative.
This exploratory study demonstrated our initial hypothesis, since the proposed methodology is suitable to weight indicators by a group of experts. As a result, we obtained different proposals of reduced sets of weighted indicators. The availability of prioritized sets of indicators can be a useful candidate for a policy-making tool to aid decisions on data gathering for monitoring cross-cutting RRI initiatives in a specific context.
Building a fair society where people can live the life they have reasons to value [
21] requires that the scientific praxis and science and innovation incorporate the principles of civic ethics [
22] in its functioning. Our research shows an approach to incorporating the principles of civil ethics in the process of defining how to select specific indicators to assess RRI performance in a specific context to orientate public scientific policies.
Therefore, our aim with this study was not to offer a definitive prioritized list of indicators of RRI for the Spanish research and innovation ecosystem, but to explore the potential of the methodology to advance towards that broader objective by involving relevant actors in the process of selection of indicators.
With this study, we explored how prioritization could be achieved in case that extensive list of indicators could not be used to measure policies due to lack of sources to gather information or due to the will to adapt extensive sets to specific contexts.
In order to produce reduced sets of indicators, four approaches were proposed to numerically reduce the number of indicators for each key area of RRI. The application of each of the four methods used presents different advantages and limitations.
The method “Best in class” allows selecting a short number of indicators and identifying those that are more relevant. However, this advantage is also its main limitation, as it results in a drastic reduction of the number of indicators. Furthermore, there is a relevant dependency of the resulting set of indicators to the inclusion of categories. In the application of all of the criteria, if categories had not been included and all the indicators in each key area had been compared among them, the resulting set of indicators would have been different; this fact makes a very clear impact in the method “Best in class”. Therefore, for the use of this method in future studies, a previous profound analysis of the importance of categorizing indicators or not should be conducted.
The approach based on a cut-off percentage that allows selecting the indicators in the first positions summing up the cut-off percentage, in this study the “50% NGM” method, facilitates the identification of a reduced set of indicators, while at the same time respecting the priorities given in the prioritization process by the experts.
The approach based on reducing the indicators to a concrete number of indicators, in our case to half of them, facilitates establishment of the final number of indicators by selecting the percentage of reduction expected. The main limitation of the “50% of indicators” method is that the amount of indicators resulting under each area or category responds only to a numerical value and does not consider the amount of importance given by the experts. The relevance of this method is difficult to justify, as the requirement of reducing indicators in a specific context might be linked to limitation in the resources to collect and analyse data for large lists of indicators. It seems too aleatory if no reason for limiting the amount of indicators is provided. To address this limitation, it would be interesting to combine this criteria with the inclusion of the costs of measuring indicators. The maximum budget available for evaluating and monitoring RRI policies could be a criterion used in order to select the cut-off percentage in this approach.
The fourth and last method proposed has a main advantage as it does not limit the number of indicators a priori, but the result depends on the differences between the highest and lowest normalized geometrical means and the position of each indicator in relation to that difference.
The application of these four methods showed that reductions can be made in different ways, and there are some limitations in the methodology used in this study that will have to be overcome to propose a concrete set of indicators by using this or other methods.
Firstly, it should be noted that working with a different expert team could lead to some changes in the ranking, and that the number of experts participating in the study should be increased in future studies. Additionally, the inclusion of other techniques to promote consensus could be used, such as a second round of weighting by using the Delphi method, as has already been conducted in previous studies [
20].
Additionally, a definitive list of context-based set of indicators would require the integration of the forthcoming sets of indicators that are under development. In the coming months, the results from the tender launched in 2013 by the European Commission to identify quantitative and qualitative indicators and metrics to monitor the evolution of RRI dimensions will be available. Therefore, any attempt to provide context-based sets will have to integrate the proposal made in that study.
It would also be necessary to critically review the potential indicators under each dimension considering the current regulation in the specific country or region where the indicators might be applied. In this regard, the Spanish Organic Law 3/2007 of 22 March 2007 for equality among women and men already imposes some reporting requirements to different agents in the research and innovation ecosystem. Not considering those requirements would be a strategical failure to promote gender in science in the Spanish national context.
In a similar way, understanding the current efforts of research and innovation actors reporting their performance on Corporate Social Responsibility and Responsible University policies would be key to assuring the commitment in this process of companies and universities already monitoring and reporting areas of RRI. In this line, it would be also beneficial for future studies to include in the panel of experts professionals responsible for research and innovation in companies. This will be key to help to introduce into the debate companies developing research and innovation and assuring the success of the proposed indicators both to public and private developers of science and innovation.
Additionally, a profound reflection on how to measure RRI initiatives and policies among experts from the different dimensions would be necessary to be able to include new indicators to measure relevant goals of each of the key areas responding to the specific state of the art in the country. The authors propose to arrange experts focus groups and the use of participatory methods to define in a specific context the complete list of indicators that should be weighted as a first set in the process to provide context-based indicators for any science and innovation system.
In conclusion, the design of a study to select the more suitable and urgent indicators to measure RRI performance in a territory should include previous work conducted to identify new indicators that complement the proposals made so far. During the development of this study, the authors considered the suitability of the indicators proposed under a European perspective for use in national contexts without any type of adjustment. From our point of view, future study should respond to so far non-explored questions.
Firstly, it would be relevant to explore whether the list of indicators used in this exploratory study includes all the possible and relevant indicators to measure the six dimensions proposed by the European Commission in the Spanish research and innovation ecosystem. It is also necessary to reflect on the inclusion of those widely accepted in our territory and included in the Global Reporting Initiative, the Equality Plans, or the Responsible University Plans. Additionally, future studies should explore whether the set of indicators proposed has the same importance for different research and innovation contexts such as geographic areas (countries and regions) or areas of knowledge (Humanities and Social Sciences, Biology and Biomedicine, Natural Resources and Agricultural Sciences, etc.). Finally, it should be explored whether the all the research and innovation agents should inform the whole set of indicators, or if would it is necessary to establish specific sets of indicators for reporting the performance of different types of agents such as funding agencies, universities, departments and institutes, or private organizations that conduct research and innovation.


