Sustainability in Chinese Higher Educational Institutions’ Social Science Research: A Performance Interface toward Efficiency

Abstract
:1. Introduction
2. The Social Science Research Context in HEIs
3. The Proposed Model
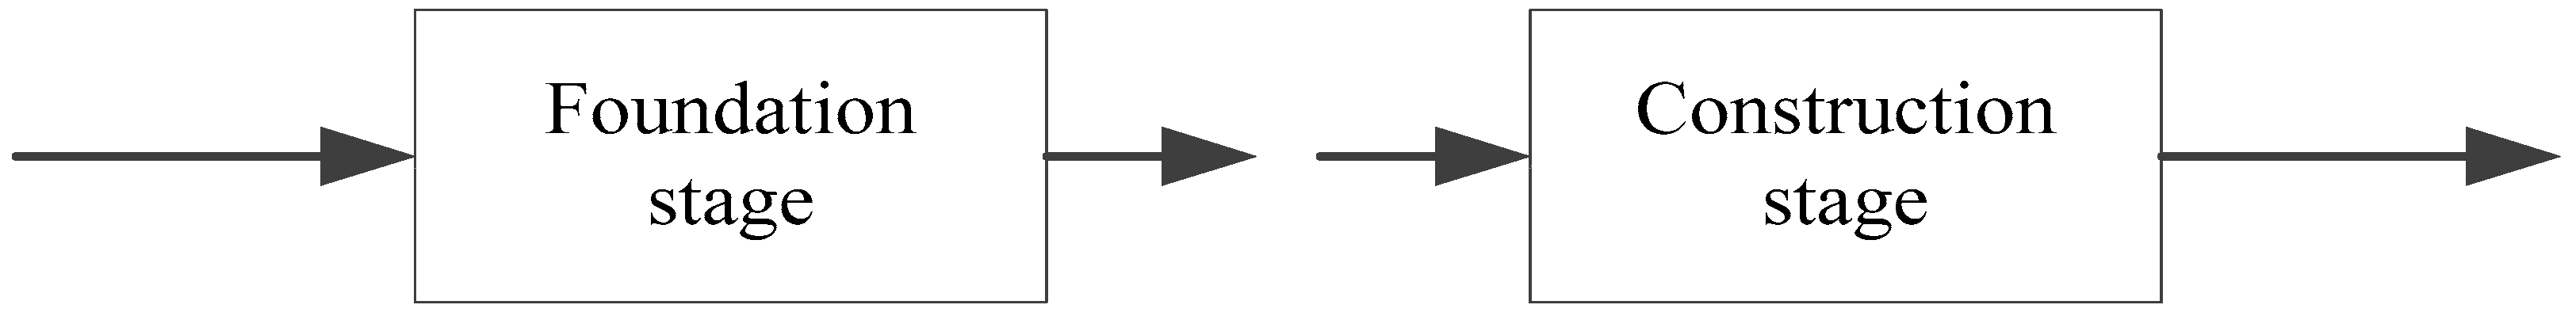
3.1. Theoretical Framework
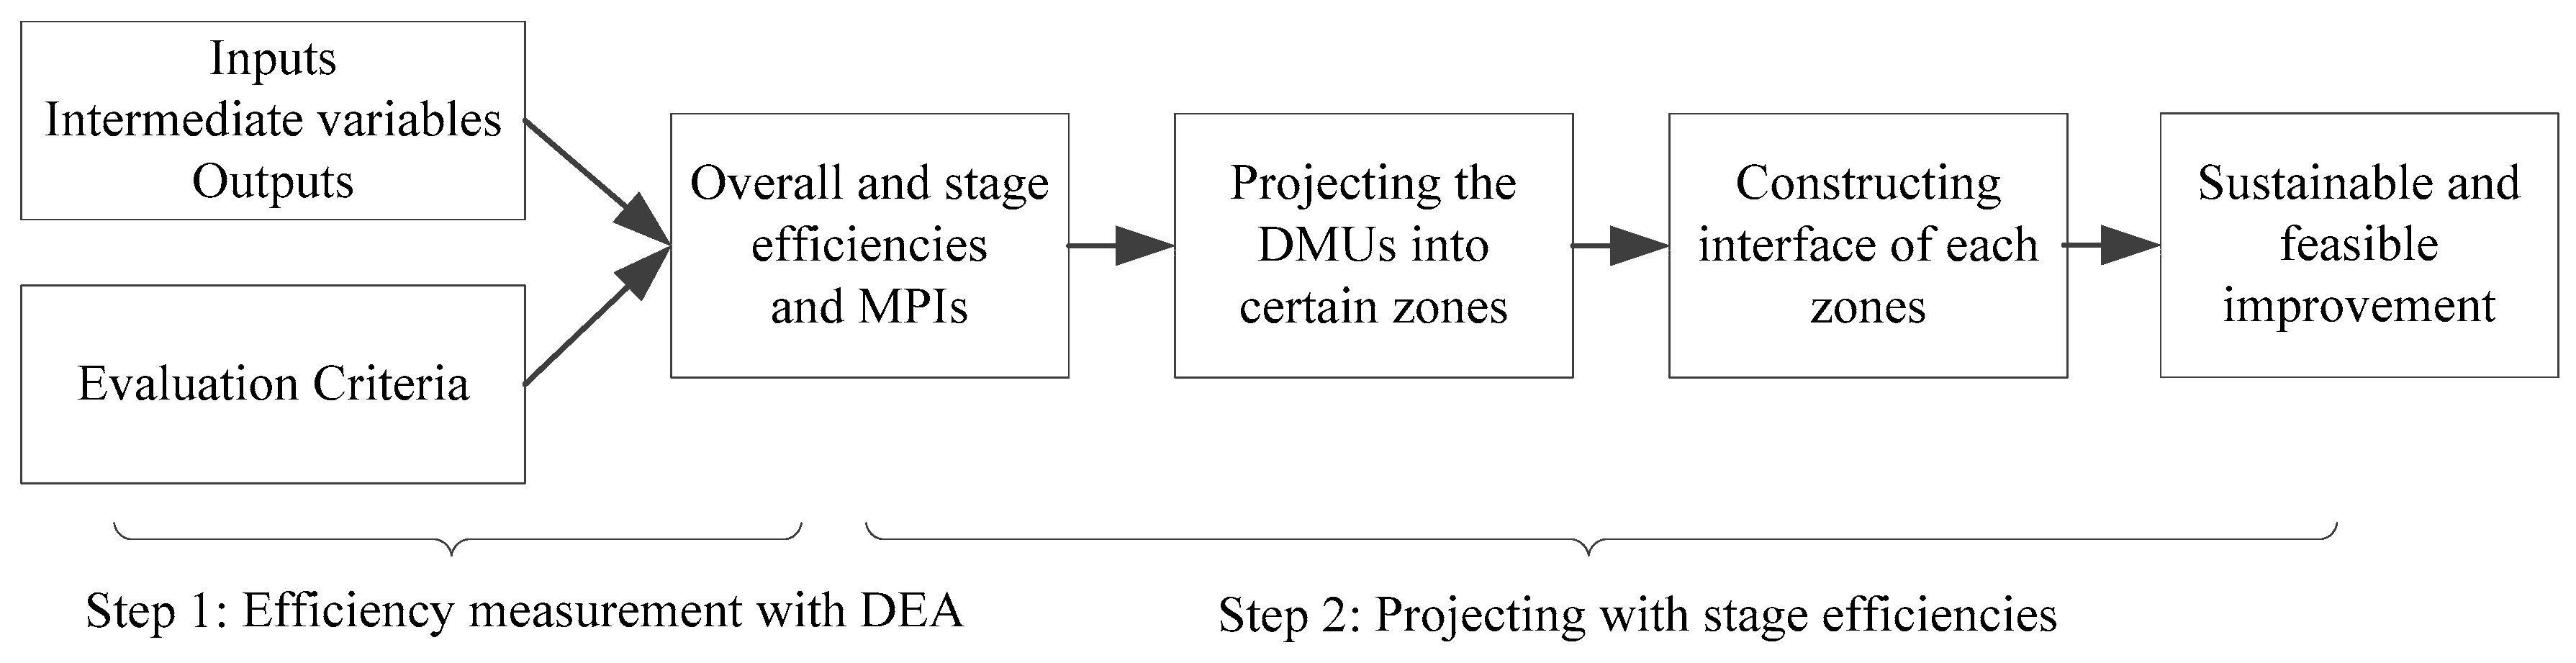
3.2. Model
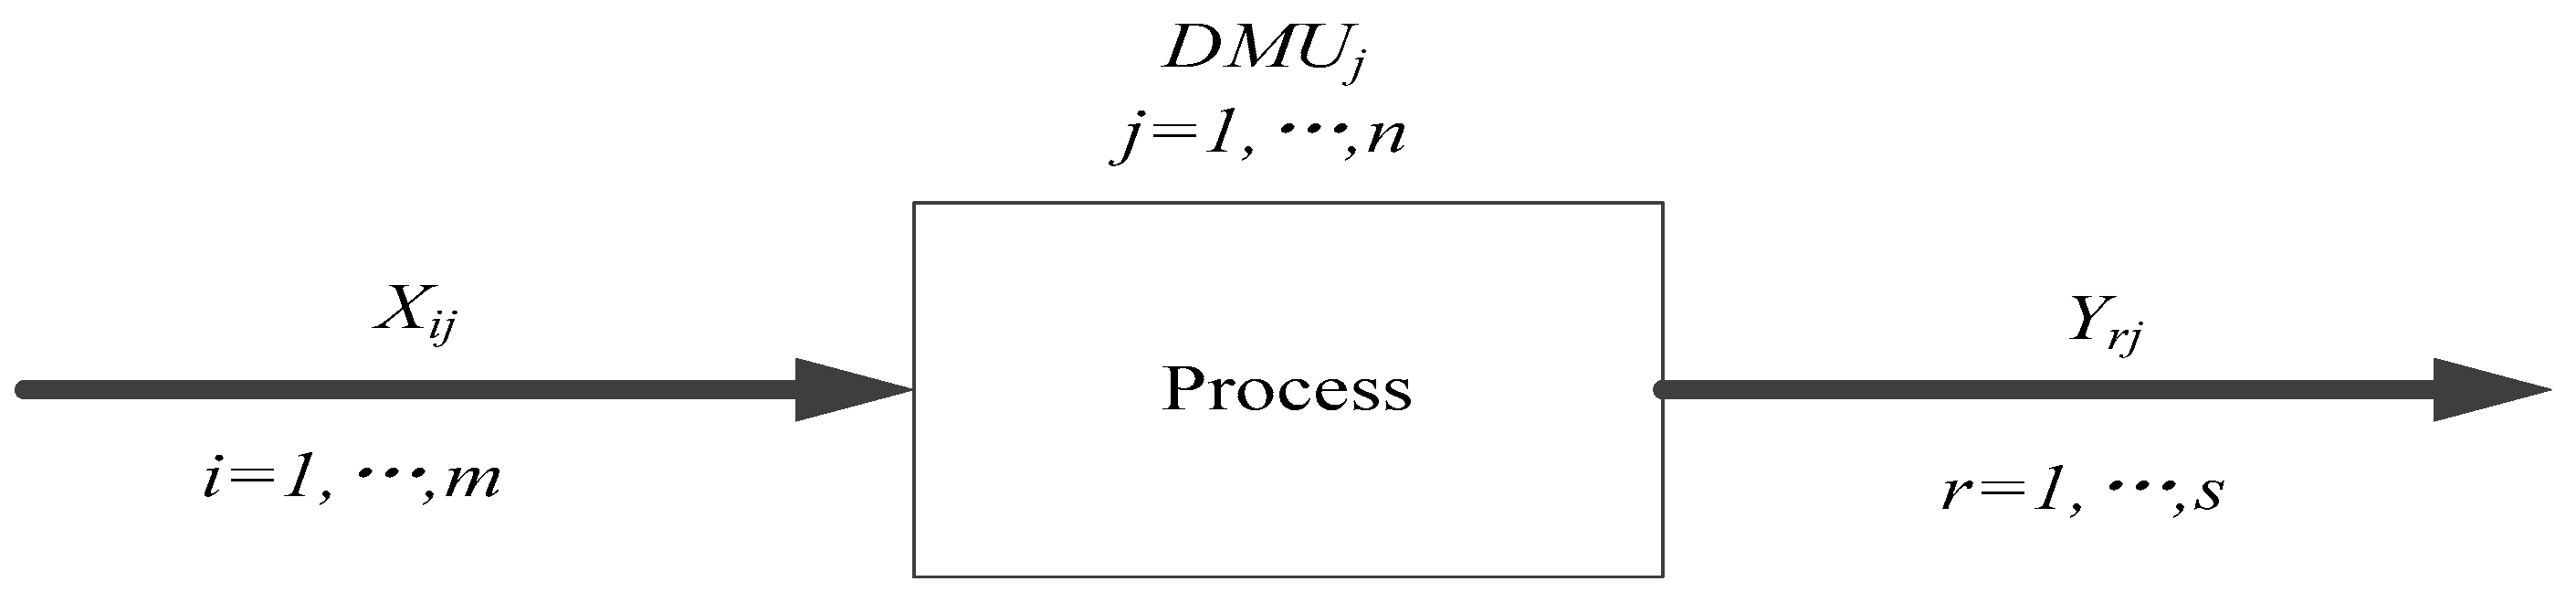
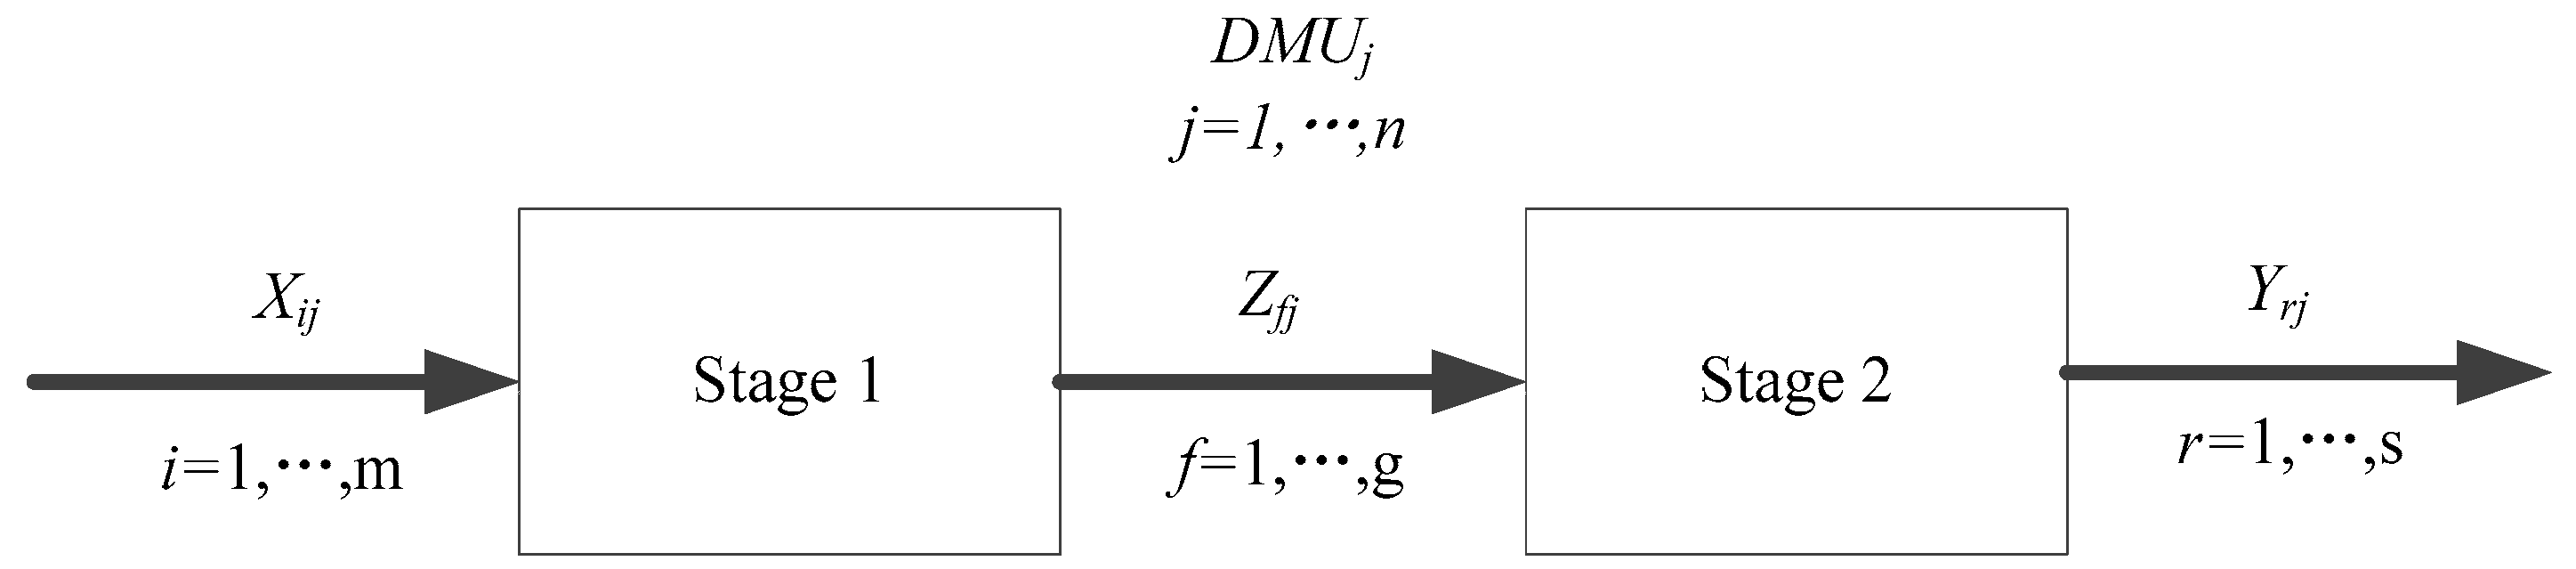
3.2.1. The Multi-Period Two-Stage DEA Model
- System constraints:
- Stage 1 constraints:
- Stage 2 constraints:
3.2.2. Malmquist Productivity Index
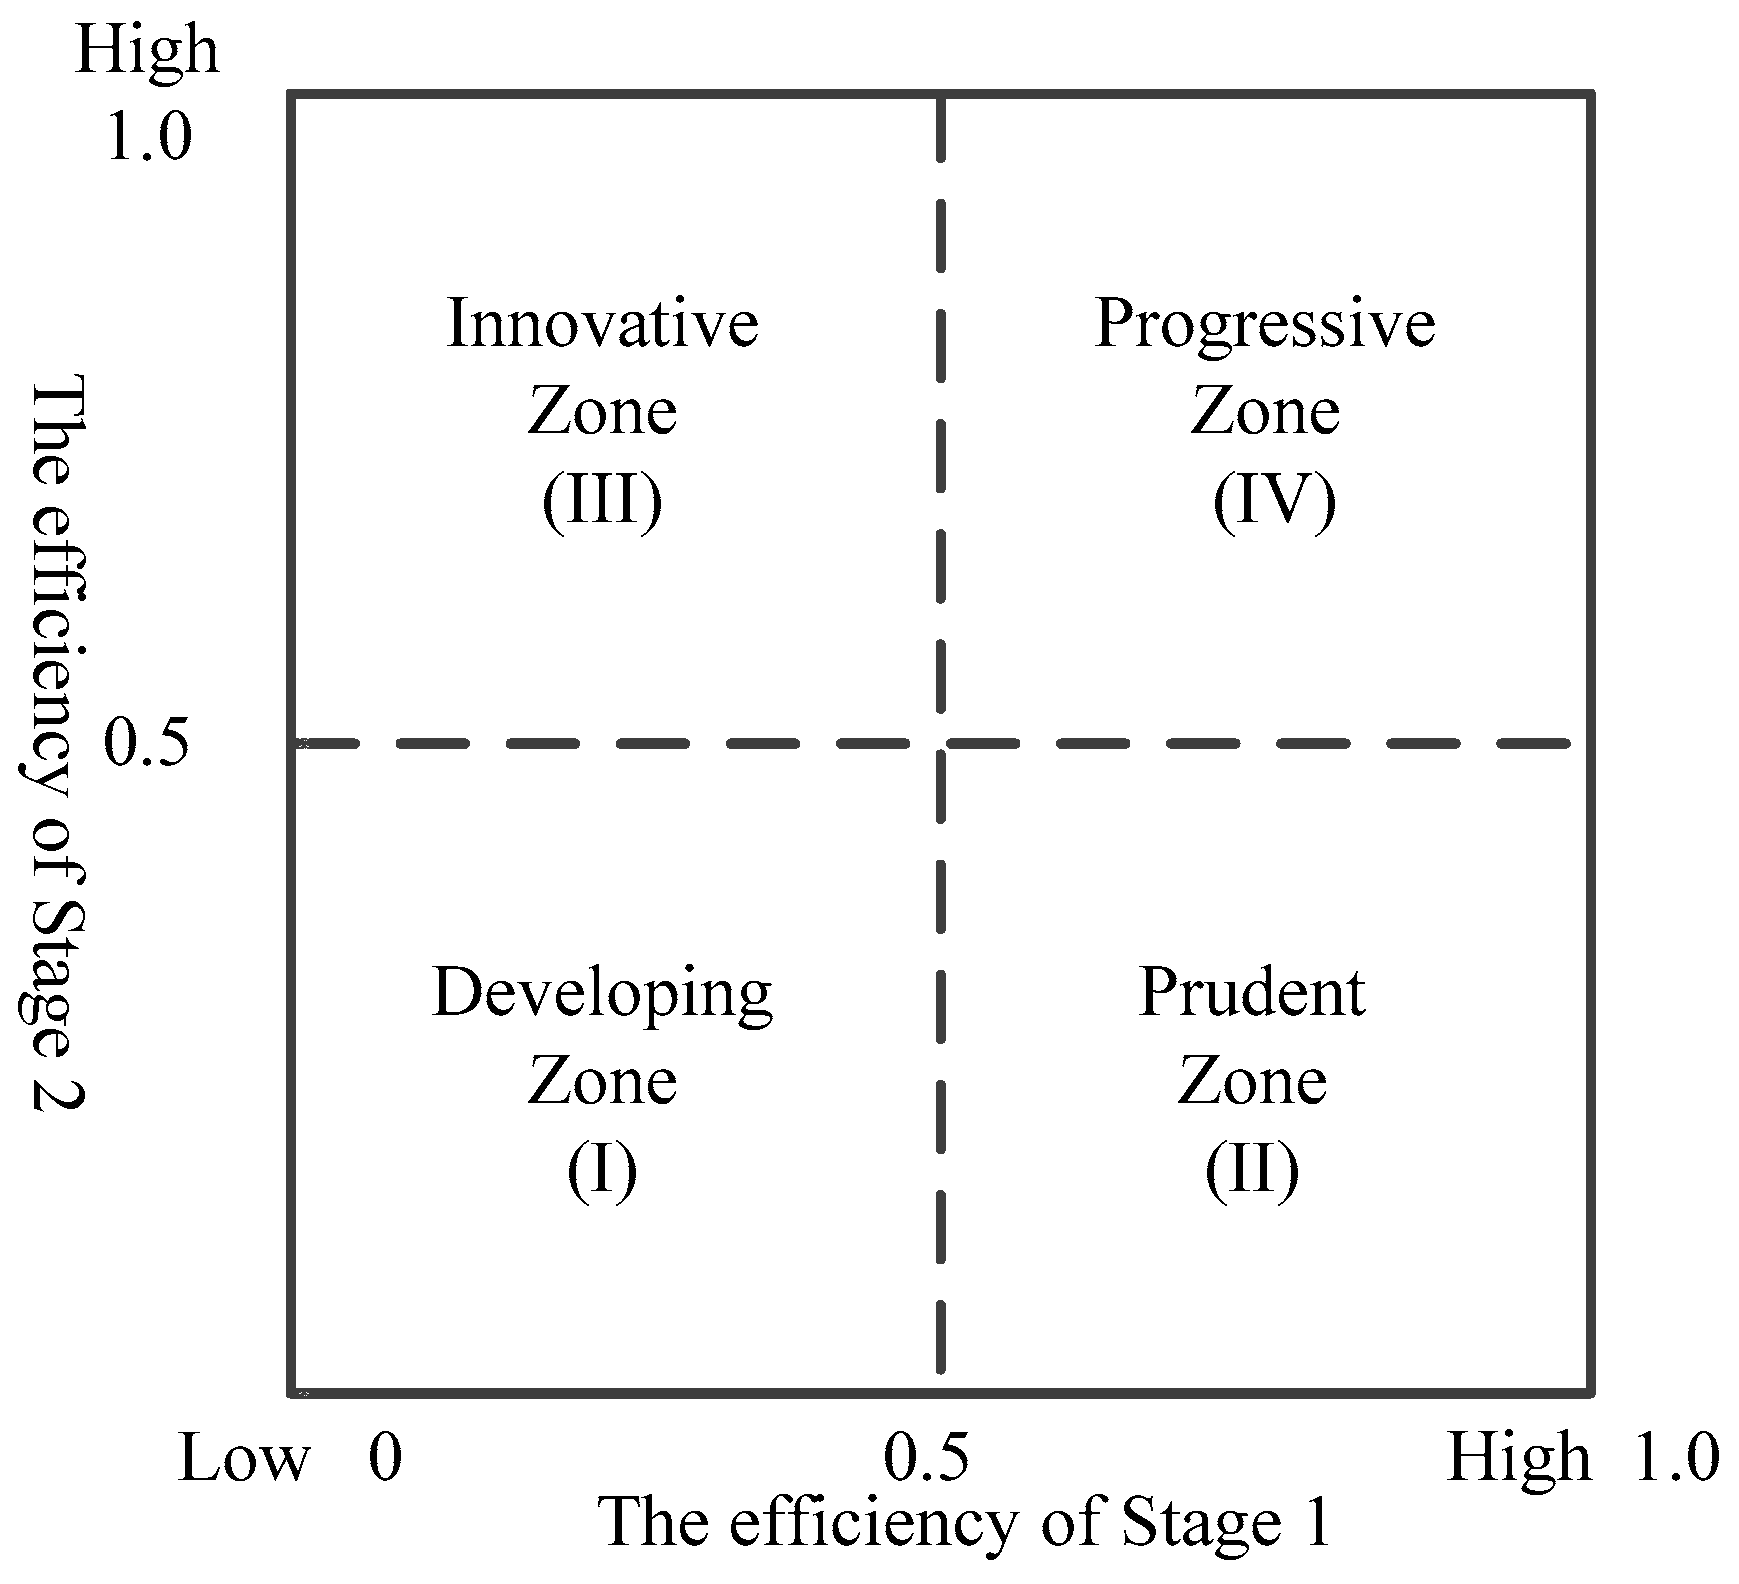
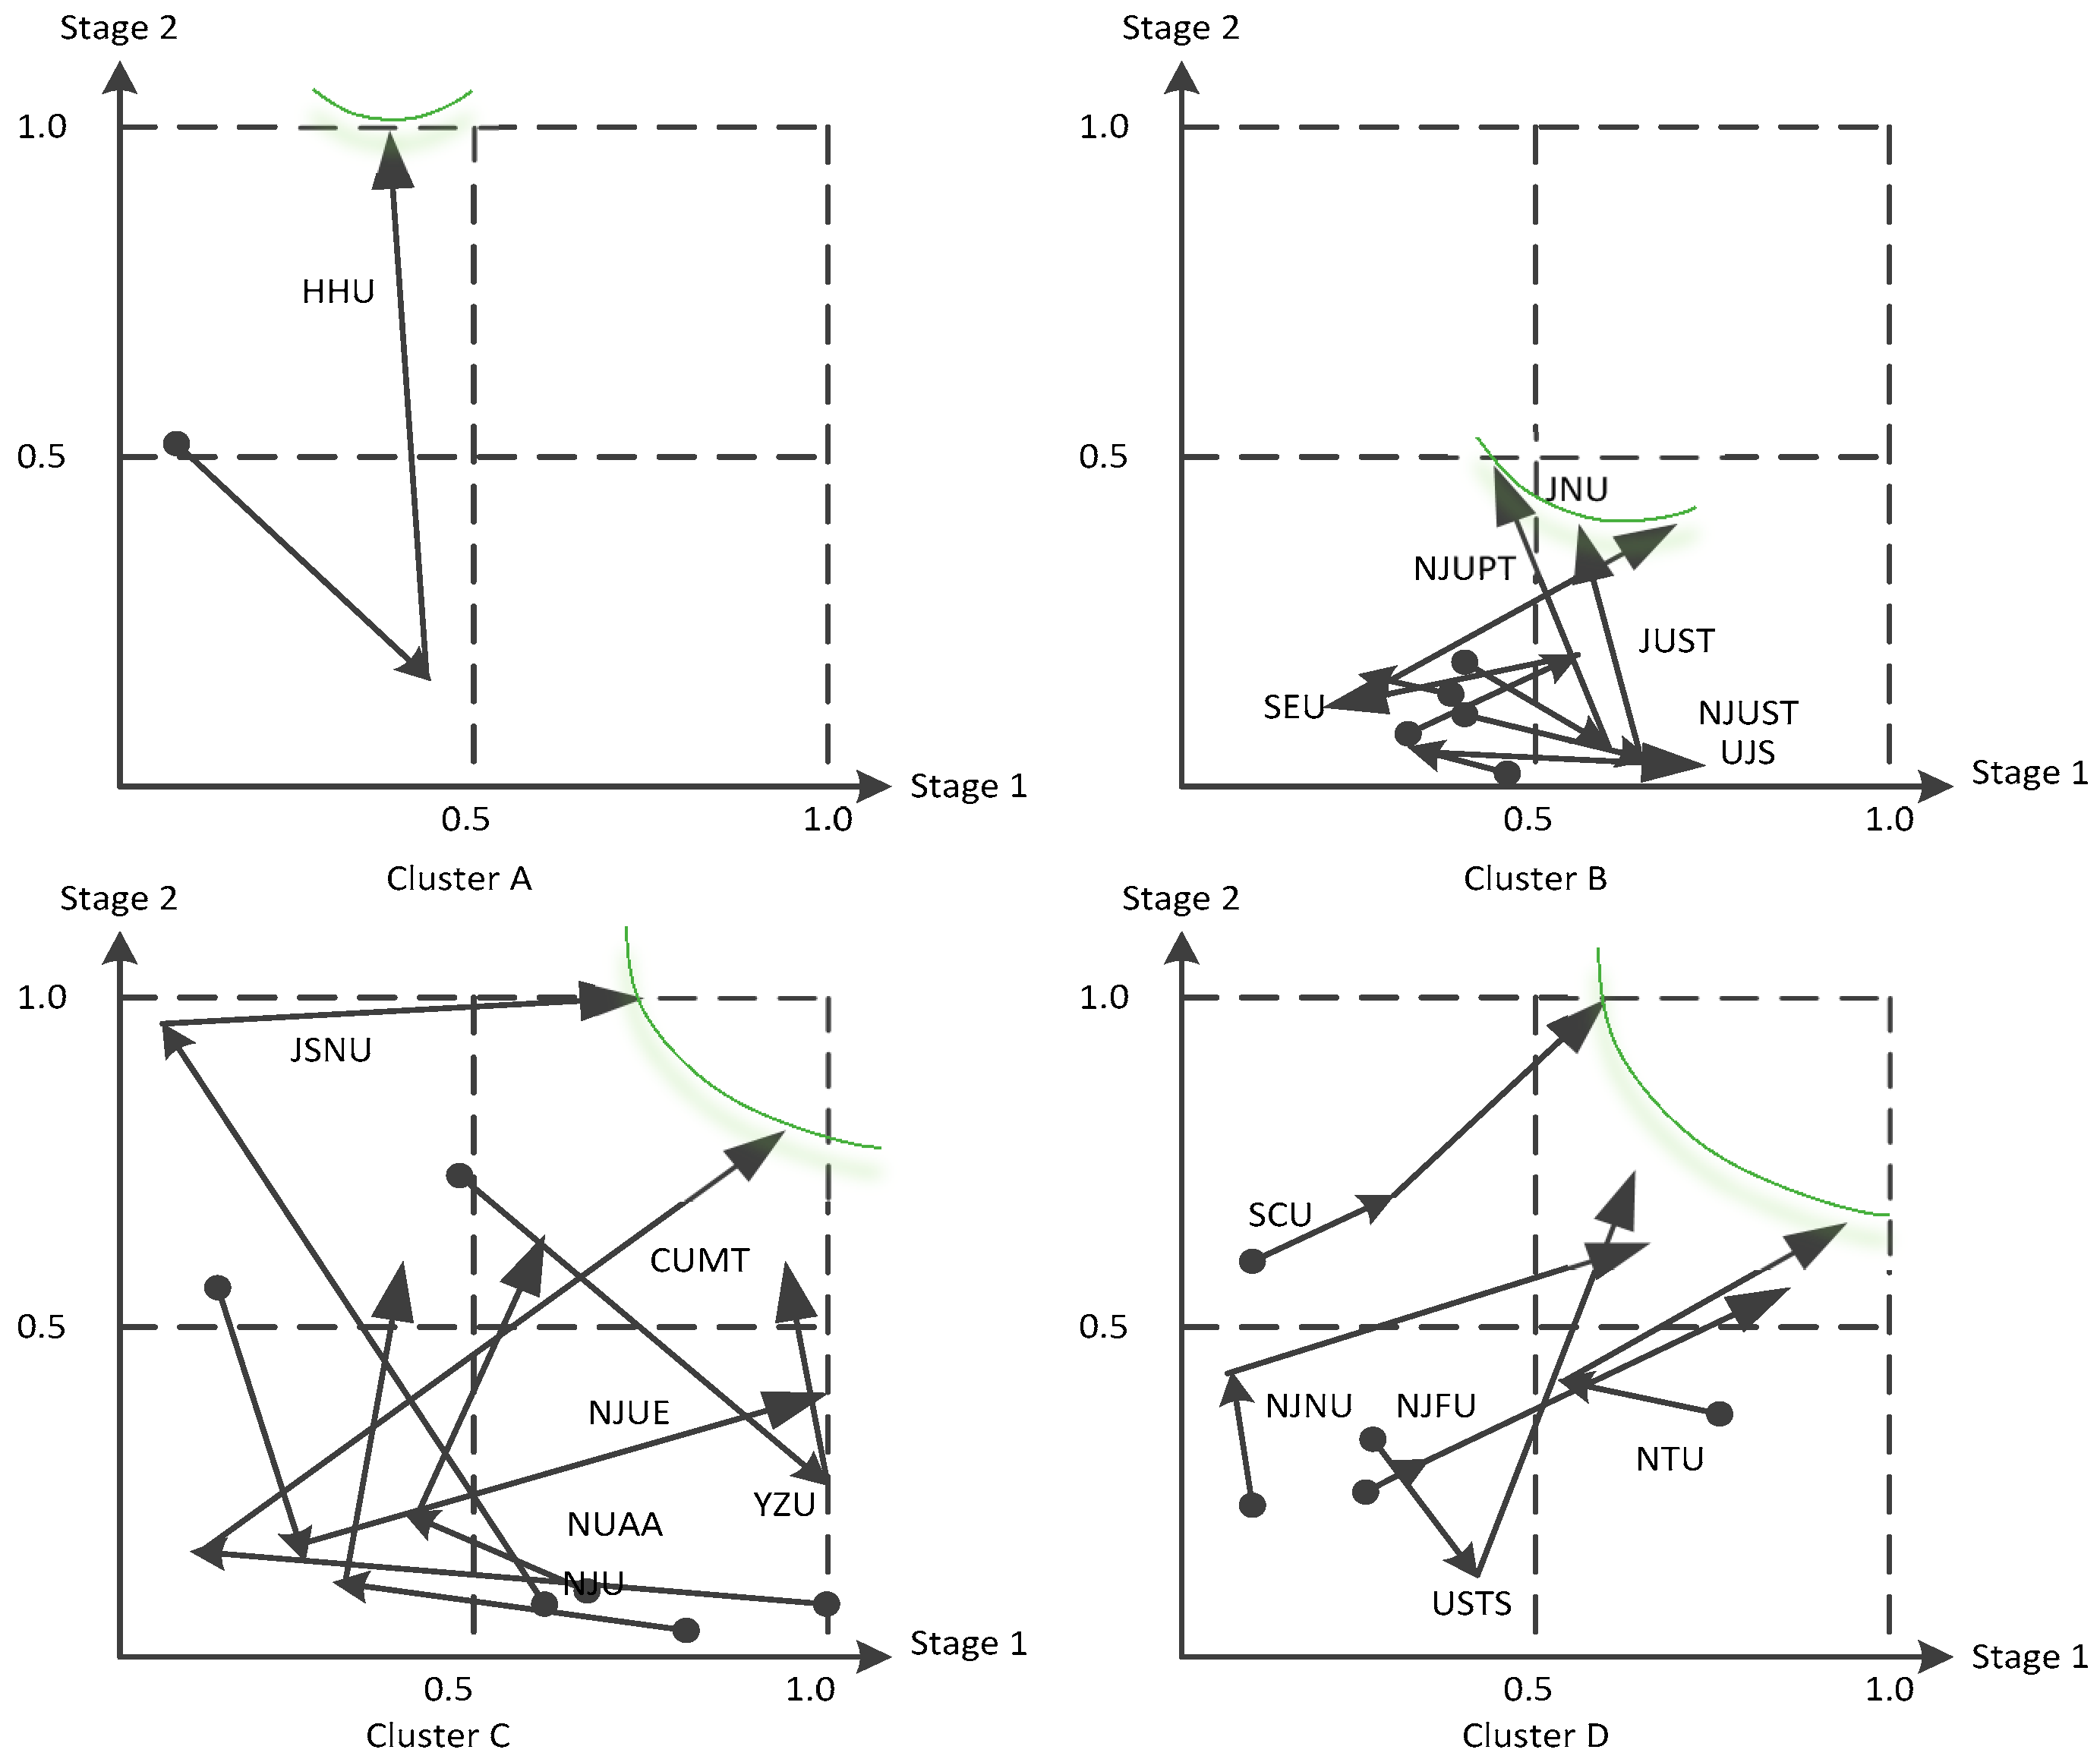
3.2.3. Clustering the DMUs into Four Quadrants and Constructing Interfaces
4. Application Analysis and Results
4.1. Sample
4.2. Variables and Data
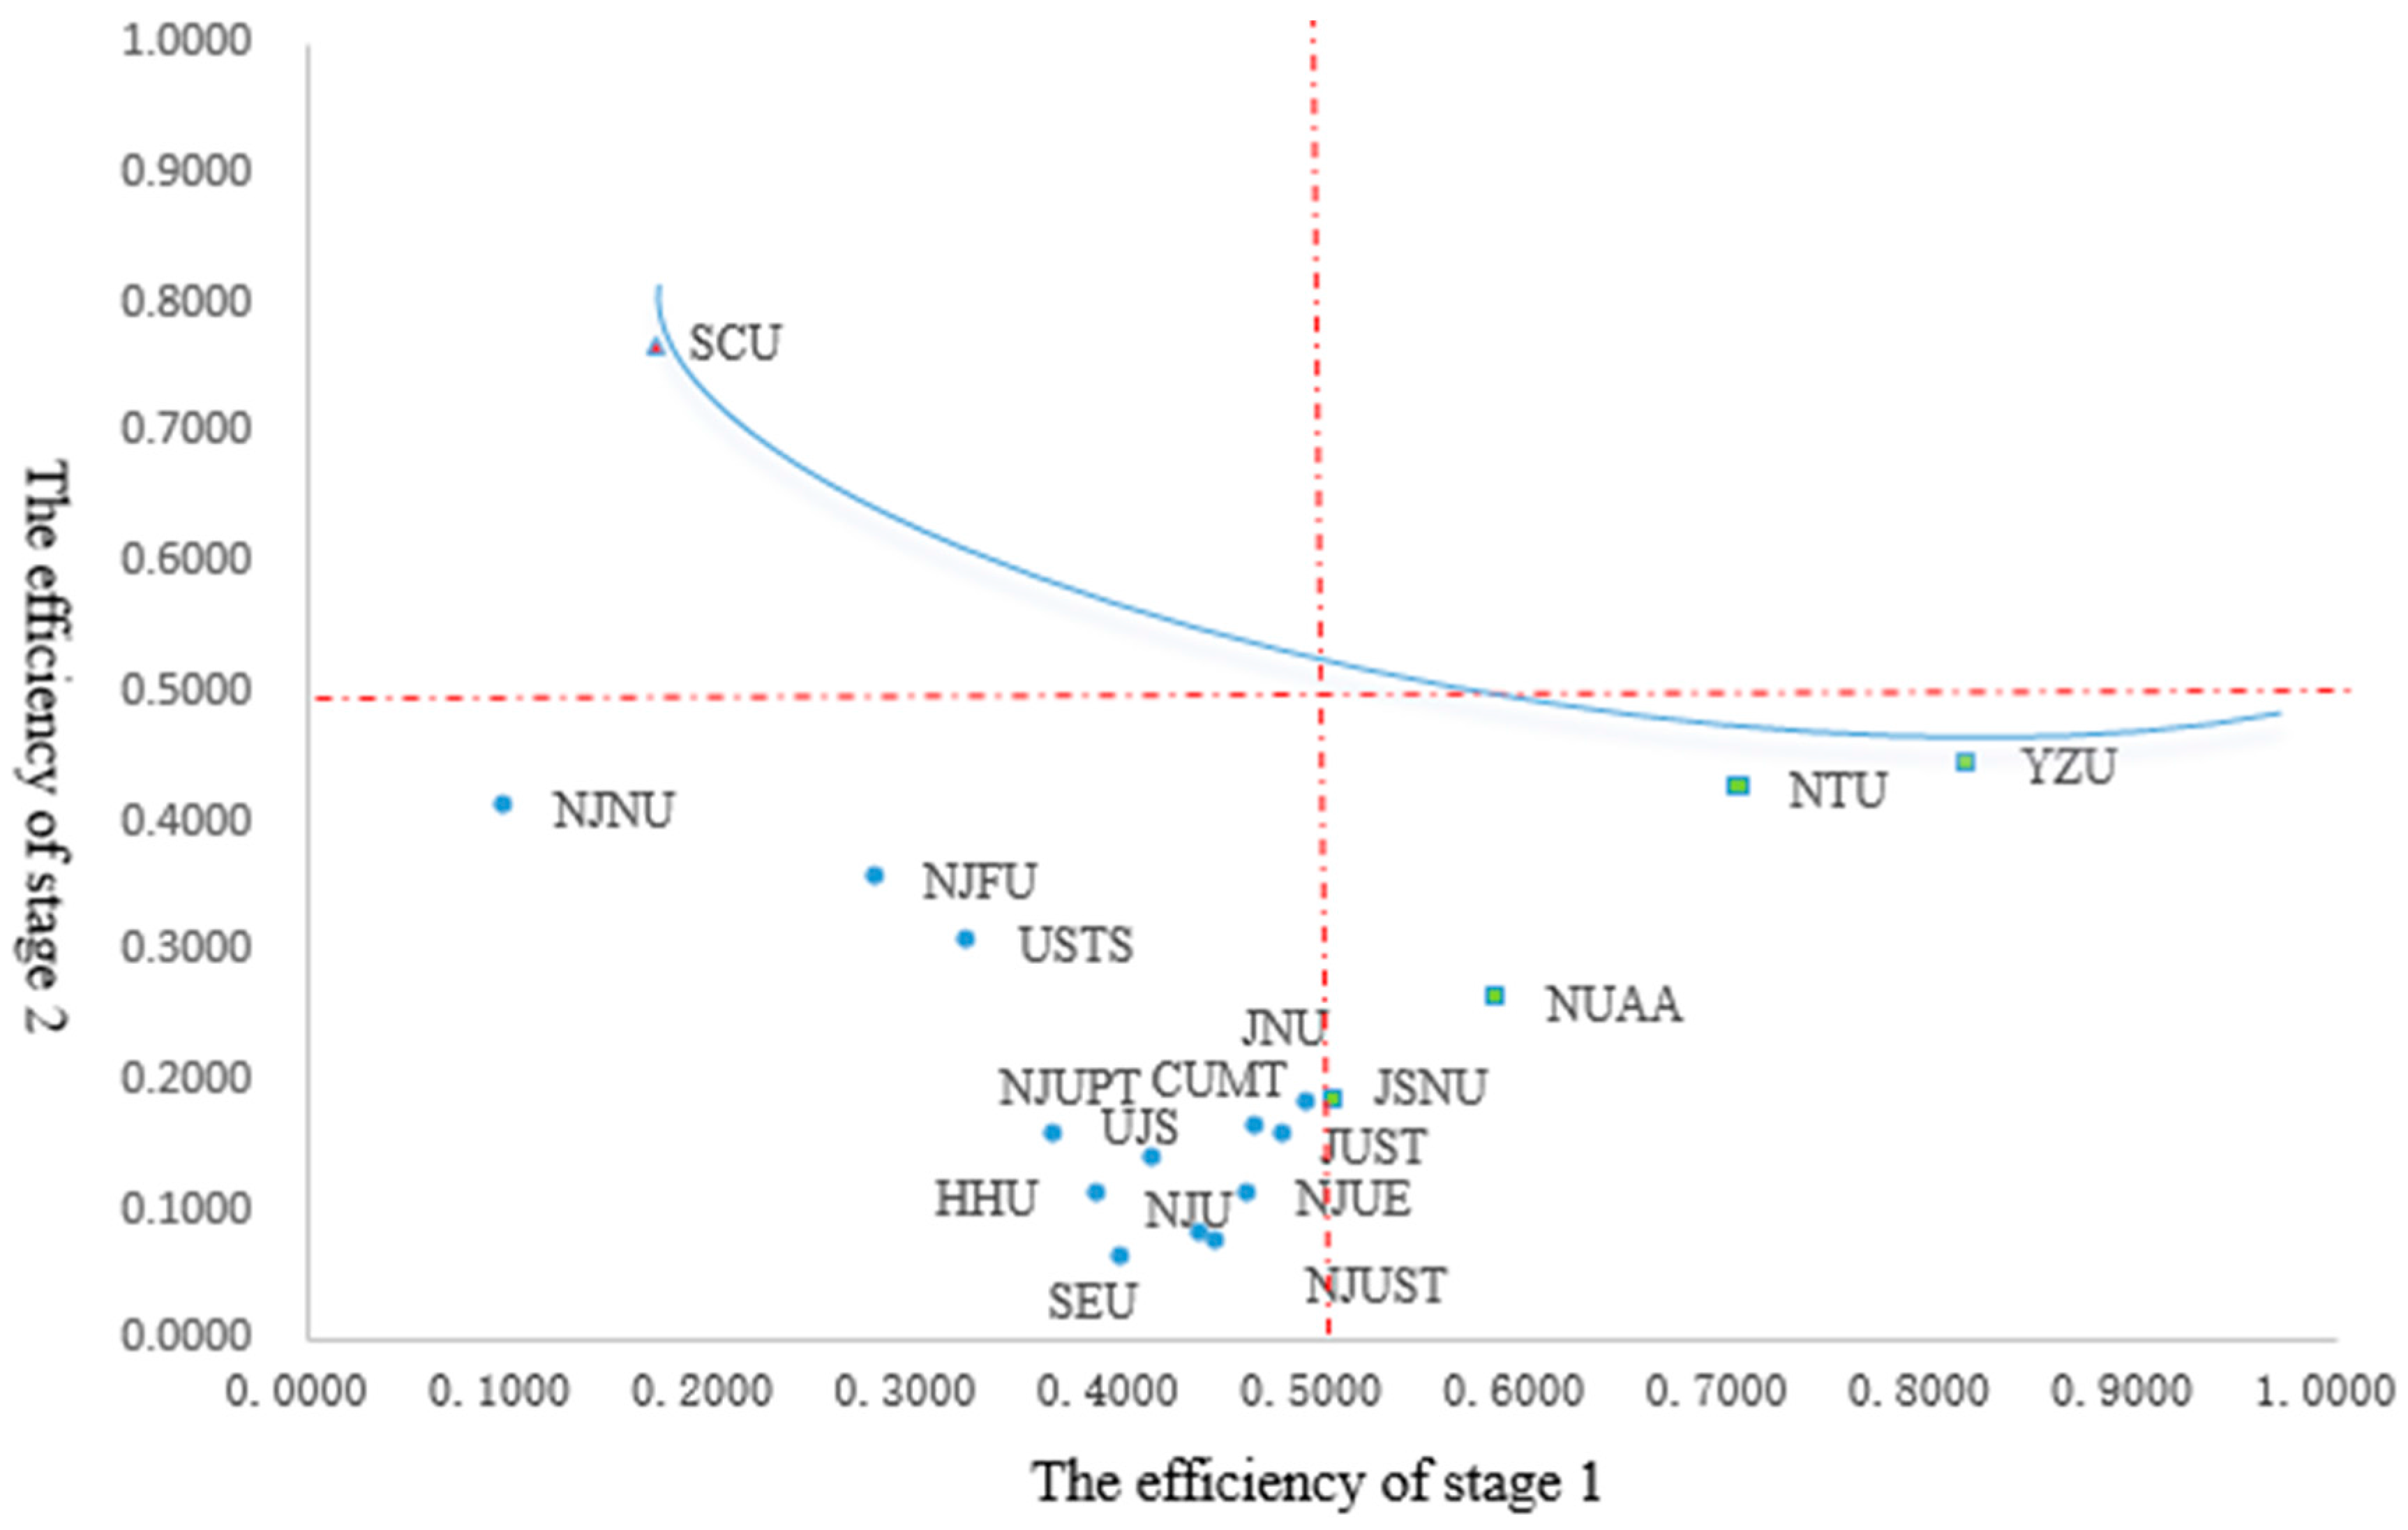
4.3. Overall Efficiency and Performance Interface
4.4. Yearly Efficiencies and Performance Interfaces
5. Concluding Remarks
Acknowledgments
Author Contributions
Conflicts of Interest
References
- Evangelinos, K.I.; Jones, N.; Panoriou, E.M. Challenges and opportunities for sustainability in regional universities: A case study in Mytilene, Greece. J. Clean. Prod. 2009, 17, 1154–1161. [Google Scholar] [CrossRef]
- Lindsay, A.W. Institutional performance in higher education: The efficiency dimension. Rev. Educ. Res. 1982, 52, 175–199. [Google Scholar] [CrossRef]
- Charnes, A.; Cooper, W.W.; Rhodes, E. Measuring the efficiency of decision making units. Eur. J. Oper. Res. 1978, 2, 429–444. [Google Scholar] [CrossRef]
- Cook, W.D.; Seiford, L.M. Data envelopment analysis (DEA)–Thirty years on. Eur. J. Oper. Res. 2009, 192, 1–17. [Google Scholar] [CrossRef]
- Avkiran, N.K. Investigating technical and scale efficiencies of Australian universities through data envelopment analysis. Socio-Econ. Plan. Sci. 2001, 35, 57–80. [Google Scholar] [CrossRef]
- Athanassopoulos, A.D.; Shale, E. Assessing the comparative efficiency of higher education institutions in the UK by the means of data envelopment analysis. Educ. Econ. 1997, 5, 117–134. [Google Scholar] [CrossRef]
- Johnes, J. Data envelopment analysis and its application to the measurement of efficiency in higher education. Econ. Educ. Rev. 2006, 25, 273–288. [Google Scholar] [CrossRef]
- Abbott, M.; Doucouliagos, C. The efficiency of Australian universities: A data envelopment analysis. Econ. Educ. Rev. 2003, 22, 89–97. [Google Scholar] [CrossRef]
- Thanassoulis, E.; Kortelainen, M.; Johnes, G.; Johnes, J. Costs and efficiency of higher education institutions in England: A DEA analysis. J. Oper. Res. Soc. 2011, 62, 1282–1297. [Google Scholar] [CrossRef] [Green Version]
- Singh, S.; Ranjan, P. Efficiency analysis of non-homogeneous parallel sub-unit systems for the performance measurement of higher education. Ann. Oper. Res. 2017, 1–26. [Google Scholar] [CrossRef]
- Wolszczak-Derlacz, J.; Parteka, A. Efficiency of European public higher education institutions: A two-stage multicountry approach. Scientometrics 2011, 89, 887–917. [Google Scholar] [CrossRef] [PubMed]
- Andersson, C.; Antelius, J.; Månsson, J.; Sund, K. Technical efficiency and productivity for higher education institutions in Sweden. Scand. J. Educ. Res. 2017, 61, 1–19. [Google Scholar] [CrossRef]
- Thanassoulis, E.; Dey, P.K.; Petridis, K.; Goniadis, I.; Georgiou, A.C. Evaluating higher education teaching performance using combined analytic hierarchy process and data envelopment analysis. J. Oper. Res. Soc. 2017, 68, 431–445. [Google Scholar] [CrossRef]
- Munoz, D.A. Assessing the research efficiency of higher education institutions in Chile: A data envelopment analysis approach. Int. J. Educ. Manag. 2016, 30, 809–825. [Google Scholar] [CrossRef]
- Lee, B.L.; Worthington, A.C. A network DEA quantity and quality-orientated production model: An application to Australian university research services. Omega 2016, 60, 26–33. [Google Scholar] [CrossRef]
- Sagarra, M.; Molinero, C.M.; Agasisti, T. Exploring the Efficiency of Mexican Universities: Integrating Data Envelopment Analysis and Multidimensional Scaling. Omega 2014, 55, 1324–1325. [Google Scholar] [CrossRef]
- Kao, C.; Hwang, S.-N. Multi-period efficiency and Malmquist productivity index in two-stage production systems. Eur. J. Oper. Res. 2014, 232, 512–521. [Google Scholar] [CrossRef]
- Caves, D.W.; Christensen, L.R.; Diewert, W.E. The Economic Theory of Index Numbers and the Measurement of Input, Output, and Productivity. Econometrica 1982, 50, 1393–1414. [Google Scholar] [CrossRef]
- Beasley, J.E. Determining teaching and research efficiencies. J. Oper. Res. Soc. 1995, 46, 441–452. [Google Scholar] [CrossRef]
- Lee, B.L. Efficiency of research performance of Australian Universities: A reappraisal using a bootstrap truncated regression approach. Econ. Anal. Policy 2011, 41, 195–203. [Google Scholar] [CrossRef]
- Johnes, J.; Li, Y. Measuring the research performance of Chinese higher education institutions using data envelopment analysis. China Econ. Rev. 2008, 19, 679–696. [Google Scholar] [CrossRef]
- Liang, L.; Li, Z.-Q.; Cook, W.D.; Zhu, J. Data envelopment analysis efficiency in two-stage networks with feedback. IIE Trans. 2011, 43, 309–322. [Google Scholar] [CrossRef]
- Kao, C.; Hung, H.-T. Efficiency analysis of university departments: An empirical study. Omega 2008, 36, 653–664. [Google Scholar] [CrossRef]
- Charnes, A.; Cooper, W.W. Preface to topics in data envelopment analysis. Ann. Oper. Res. 1984, 2, 59–94. [Google Scholar] [CrossRef]
- Chen, Y.; Cook, W.D.; Li, N.; Zhu, J. Additive efficiency decomposition in two-stage DEA. Eur. J. Oper. Res. 2009, 196, 1170–1176. [Google Scholar] [CrossRef]
- Seiford, L.M.; Zhu, J. Profitability and marketability of the top 55 US commercial banks. Manag. Sci. 1999, 45, 1270–1288. [Google Scholar] [CrossRef]
- Kao, C.; Hwang, S.-N. Efficiency decomposition in two-stage data envelopment analysis: An application to non-life insurance companies in Taiwan. Eur. J. Oper. Res. 2008, 185, 418–429. [Google Scholar] [CrossRef]
- Liang, L.; Cook, W.D.; Zhu, J. DEA models for two-stage processes: Game approach and efficiency decomposition. Nav. Res. Logist. 2008, 55, 643–653. [Google Scholar] [CrossRef]
- Pastor, J.T.; Lovell, C.K. Circularity of the Malmquist productivity index. Econ. Theory 2007, 33, 591–599. [Google Scholar] [CrossRef]
- Pastor, J.T.; Lovell, C.K. A global Malmquist productivity index. Econ. Lett. 2005, 88, 266–271. [Google Scholar] [CrossRef]
- Kao, C. Malmquist productivity index based on common-weights DEA: The case of Taiwan forests after reorganization. Omega 2010, 38, 484–491. [Google Scholar] [CrossRef]
- Kao, C.; Hung, H.-T. Data envelopment analysis with common weights: The compromise solution approach. J. Oper. Res. Soc. 2005, 56, 1196–1203. [Google Scholar] [CrossRef]
- Sueyoshi, T.; Aoki, S. A use of a nonparametric statistic for DEA frontier shift: The Kruskal and Wallis rank test. Omega 2001, 29, 1–18. [Google Scholar] [CrossRef]
- Johnes, J. Measuring teaching efficiency in higher education: An application of data envelopment analysis to economics graduates from UK Universities 1993. Eur. J. Oper. Res. 2006, 174, 443–456. [Google Scholar] [CrossRef]
- Saaty, T.L.; Vargas, L.G. Models, Methods, Concepts & Applications of the Analytic Hierarchy Process; Springer: New York, NY, USA, 2012. [Google Scholar]
- Wang, X.; Hu, H. Sustainable Evaluation of Social Science Research in Higher Education Institutions Based on Data Envelopment Analysis. Sustainability 2017, 9, 644. [Google Scholar] [CrossRef]
- Cooper, W.; Seiford, L.; Tone, K.; Zhu, J. Some models and measures for evaluating performances with DEA: past accomplishments and future prospects. J. Prod. Anal. 2007, 28, 151–163. [Google Scholar] [CrossRef]
- Avkiran, N.K. Opening the black box of efficiency analysis: An illustration with UAE banks. Omega 2009, 37, 930–941. [Google Scholar] [CrossRef]
- Zhu, J. Quantitative Models for Performance Evaluation and Benchmarking: Data Envelopment Analysis with Spreadsheets; Springer: Berlin, Germany, 2014; Volume 213. [Google Scholar]


| Year | Total | National and Ministerial Projects | Provincial and Local Government Projects | Others |
|---|---|---|---|---|
| 2011 | 3,041,486.3 | 942,132.2 | 442,252.75 | 1,657,101.34 |
| % | 100.00% | 30.98% | 14.54% | 54.48% |
| 2012 | 3,563,611.5 | 1,073,472 | 548,751.56 | 1,941,387.93 |
| % | 100.00% | 30.13% | 15.40% | 54.48% |
| 2013 | 4,116,724.3 | 1,325,320.4 | 637,562.35 | 2,153,841.59 |
| % | 100.00% | 32.20% | 15.49% | 52.31% |
| 2014 | 4,325,654.78 | 1,359,643.5 | 769,491.25 | 2,196,519.99 |
| % | 100.00% | 31.43% | 17.79% | 50.78% |
| 2015 | 4,334,898.2 | 1,397,557.4 | 874,739.4 | 2,062,601.4 |
| % | 100.00% | 32.24% | 20.18% | 47.58% |
| Average | 3,876,475.02 | 1,219,625.10 | 654,559.46 | 2,002,290.45 |
| % | 100.00% | 31.46% | 16.89% | 51.65% |
| Year | Types | Total | National and Ministerial Projects | Provincial and Local Government Projects | Others |
|---|---|---|---|---|---|
| 2011 | Published Works | 646 | 211 | 245 | 190 |
| % | 100.00% | 32.67% | 37.92% | 29.41% | |
| Published Papers | 10184 | 3288 | 3676 | 3220 | |
| % | 100.00% | 32.28% | 36.10% | 31.62% | |
| Research and consulting reports | 258 | 23 | 65 | 170 | |
| % | 100.00% | 8.92% | 25.19% | 65.89% | |
| 2012 | Published Works | 808 | 251 | 292 | 265 |
| % | 100.00% | 31.06% | 36.14% | 32.80% | |
| Published Papers | 12662 | 3822 | 4652 | 4188 | |
| % | 100.00% | 30.18% | 36.74% | 33.07% | |
| Research and consulting reports | 523 | 40 | 132 | 351 | |
| % | 100.00% | 7.65% | 25.24% | 67.11% | |
| 2013 | Published Works | 842 | 340 | 261 | 241 |
| % | 100.00% | 40.38% | 31.00% | 28.62% | |
| Published Papers | 14,341 | 4482 | 5201 | 4658 | |
| % | 100.00% | 31.25% | 36.27% | 32.48% | |
| Research and consulting reports | 638 | 48 | 222 | 368 | |
| % | 100.00% | 7.52% | 34.80% | 57.69% | |
| 2014 | Published Works | 948 | 382 | 337 | 229 |
| % | 100.00% | 40.30% | 35.55% | 24.16% | |
| Published Papers | 16,107 | 5212 | 6491 | 4404 | |
| % | 100.00% | 32.35% | 40.30% | 27.34% | |
| Research and consulting reports | 1014 | 82 | 321 | 611 | |
| % | 100.00% | 8.09% | 31.65% | 60.25% | |
| 2015 | Published Works | 644 | 292 | 217 | 135 |
| % | 100.00% | 45.34% | 33.70% | 20.97% | |
| Published Papers | 16,922 | 4962 | 7380 | 4580 | |
| % | 100.00% | 29.32% | 43.62% | 27.07% | |
| Research and consulting reports | 1181 | 52 | 368 | 761 | |
| % | 100.00% | 4.40% | 31.16% | 64.44% | |
| Average | Published Works | 777.6 | 295.2 | 270.4 | 212 |
| % | 100% | 37.96% | 34.77% | 27.26% | |
| Published Papers | 14,043.2 | 4353.2 | 5480 | 4210 | |
| % | 100% | 31.00% | 39.02% | 29.98% | |
| Research and consulting reports | 722.8 | 49 | 221.6 | 452 | |
| % | 100% | 6.78% | 30.66% | 62.56% |
| Variables | Definitions | Mean | Std.Dev. | Min | Max |
|---|---|---|---|---|---|
| Y1 | Published papers | 110.74 | 66.81 | 37.00 | 384.00 |
| Y2 | Adopted Research and consulting reports | 11.44 | 15.73 | 1.00 | 80.00 |
| Z1 | The funding of newly approved projects (Million Yuan) | 74.07 | 32.68 | 13.00 | 149.00 |
| Z2 | The amount of accomplished projects | 20.69 | 33.36 | 0.76 | 180.39 |
| X1 | Total researchers (graduate degrees or above) | 18.69 | 43.98 | 0.20 | 74.90 |
| X2 | Total expenditure in the current year (Million Yuan) | 17.54 | 28.61 | 0.68 | 169.00 |
| HEI | Y1 | Y2 | Z1 (Million Yuan) | Z2 | X1 | X2 (Million Yuan) |
|---|---|---|---|---|---|---|
| NJU | 239 | 74 | 224 | 153.81 | 60.50 | 118.71 |
| SCU | 848 | 49 | 313 | 66.95 | 23.70 | 66.95 |
| SEU | 394 | 69 | 382 | 184.15 | 139.90 | 154.48 |
| NUAA | 248 | 44 | 107 | 25.73 | 32.10 | 15.84 |
| NJUST | 148 | 9 | 75 | 35.87 | 40.40 | 27.85 |
| JUST | 188 | 3 | 172 | 17.36 | 75.10 | 13.74 |
| CUMT | 197 | 34 | 277 | 28.92 | 49.60 | 25.17 |
| NJUPT | 244 | 15 | 233 | 23.05 | 106.70 | 24.34 |
| HHU | 665 | 194 | 234 | 299.32 | 94.90 | 259.40 |
| JNU | 368 | 19 | 267 | 30.71 | 143.00 | 22.83 |
| NJFU | 166 | 6 | 136 | 25.54 | 7.10 | 13.16 |
| UJS | 178 | 6 | 134 | 20.42 | 43.20 | 18.56 |
| NTU | 471 | 8 | 346 | 30.94 | 3.60 | 25.99 |
| NJNU | 373 | 15 | 254 | 62.13 | 39.10 | 72.99 |
| JSNU | 432 | 32 | 246 | 36.90 | 95.10 | 26.92 |
| NJUE | 254 | 8 | 154 | 36.89 | 34.70 | 29.13 |
| USTS | 342 | 28 | 289 | 23.88 | 18.70 | 21.99 |
| YZU | 225 | 5 | 157 | 14.95 | 1.70 | 8.96 |
| Average | 332.22 | 34.33 | 222.22 | 62.08 | 56.06 | 56.61 |
| HEI | Basic Two-Stage Centralized Model | Multi-Period Model | ||||
|---|---|---|---|---|---|---|
| ES | EΙ | EΙΙ | ES | EΙ | EΙΙ | |
| NJU | 0.1901 [17] | 0.6759 | 0.2813 | 0.0360 [16] | 0.4428 | 0.0814 |
| SCU | 0.5193 [8] | 0.5193 | 1.0000 | 0.1314 [4] | 0.1710 | 0.7684 |
| SEU | 0.1353 [18] | 0.6144 | 0.2202 | 0.0251 [18] | 0.4026 | 0.0623 |
| NUAA | 0.8372 [3] | 0.8372 | 1.0000 | 0.1518 [3] | 0.5885 | 0.2579 |
| NJUST | 0.2142 [15] | 0.6075 | 0.3526 | 0.0317 [17] | 0.4501 | 0.0705 |
| JUST | 0.5449 [7] | 0.7452 | 0.7312 | 0.0750 [9] | 0.4820 | 0.1556 |
| CUMT | 0.4116 [10] | 0.5922 | 0.6950 | 0.0739 [10] | 0.4688 | 0.1576 |
| NJUPT | 0.4046 [11] | 0.5492 | 0.7367 | 0.0562 [11] | 0.3708 | 0.1515 |
| HHU | 0.2423 [14] | 0.6392 | 0.3790 | 0.0437 [14] | 0.3913 | 0.1116 |
| JNU | 0.6425 [6] | 0.7669 | 0.8377 | 0.0869 [8] | 0.4926 | 0.1765 |
| NJFU | 0.5023 [9] | 1.0000 | 0.5023 | 0.0992 [6] | 0.2813 | 0.3525 |
| UJS | 0.3820 [12] | 0.5893 | 0.6483 | 0.0562 [11] | 0.4180 | 0.1343 |
| NTU | 0.9885 [2] | 0.9957 | 0.9928 | 0.2989 [2] | 0.7084 | 0.4220 |
| NJNU | 0.2036 [16] | 0.4217 | 0.4828 | 0.0404 [15] | 0.0990 | 0.4079 |
| JSNU | 0.6677 [4] | 0.7313 | 0.9131 | 0.0915 [7] | 0.5085 | 0.1800 |
| NJUE | 0.3472 [13] | 0.6291 | 0.5520 | 0.0523 [13] | 0.4675 | 0.1119 |
| USTS | 0.6592 [5] | 0.6592 | 1.0000 | 0.0997 [5] | 0.3281 | 0.3038 |
| YZU | 1.0000 [1] | 1.0000 | 1.0000 | 0.3633 [1] | 0.8214 | 0.4424 |
| Average | 0.4940 | 0.6985 | 0.6847 | 0.1007 | 0.4385 | 0.2416 |
| HEI | Year | Period [t-h] | Period | Process Ι | Process ΙΙ | |||
|---|---|---|---|---|---|---|---|---|
| ES(p) | MPIS(p) | EΙ(p) | MPIΙ(p) | EΙΙ(p) | MPIΙΙ(p) | |||
| NJU | 2013 | [13-14] | 0.0281 | 1.0478 | 0.6993 | 0.4271 | 0.0403 | 2.4531 |
| 2014 | [14-15] | 0.0295 | 5.5493 | 0.2987 | 1.0425 | 0.0987 | 5.3231 | |
| 2015 | [13-15] | 0.1637 | 5.8144 | 0.3114 | 0.4453 | 0.5256 | 13.0580 | |
| SCU | 2013 | [13-14] | 0.0629 | 2.0460 | 0.1013 | 1.9587 | 0.6208 | 1.0446 |
| 2014 | [14-15] | 0.1287 | 4.6265 | 0.1985 | 2.9998 | 0.6485 | 1.5420 | |
| 2015 | [13-15] | 0.5954 | 9.4661 | 0.5953 | 5.8757 | 1.0000 | 1.6108 | |
| SEU | 2013 | [13-14] | 0.0195 | 1.0313 | 0.2910 | 1.7332 | 0.0670 | 3.3808 |
| 2014 | [14-15] | 0.0201 | 3.8894 | 0.5043 | 0.7294 | 0.2264 | 0.9385 | |
| 2015 | [13-15] | 0.0782 | 4.0112 | 0.3678 | 1.2642 | 0.2125 | 3.1729 | |
| NUAA | 2013 | [13-14] | 0.1215 | 1.2878 | 0.7124 | 0.6791 | 0.1706 | 1.8962 |
| 2014 | [14-15] | 0.1565 | 2.3038 | 0.4838 | 1.2285 | 0.3234 | 1.8753 | |
| 2015 | [13-15] | 0.3605 | 2.9667 | 0.5943 | 0.8343 | 0.6065 | 3.5559 | |
| NJUST | 2013 | [13-14] | 0.0185 | 1.9918 | 0.4895 | 0.6198 | 0.0378 | 3.2139 |
| 2014 | [14-15] | 0.0369 | 1.6965 | 0.3034 | 2.3949 | 0.1215 | 0.7084 | |
| 2015 | [13-15] | 0.0625 | 3.3791 | 0.7266 | 1.4842 | 0.0861 | 2.2769 | |
| JUST | 2013 | [13-14] | 0.0542 | 1.0455 | 0.3233 | 1.9079 | 0.1675 | 0.5480 |
| 2014 | [14-15] | 0.0566 | 4.0871 | 0.6169 | 0.9625 | 0.0918 | 4.2476 | |
| 2015 | [13-15] | 0.2314 | 4.2729 | 0.5938 | 1.8364 | 0.3899 | 2.3277 | |
| CUMT | 2013 | [13-14] | 0.0996 | 0.2126 | 1.0000 | 0.1723 | 0.0996 | 1.2339 |
| 2014 | [14-15] | 0.0212 | 3.8372 | 0.1723 | 5.7989 | 0.1229 | 6.6145 | |
| 2015 | [13-15] | 0.0813 | 0.8158 | 0.9991 | 0.9991 | 0.8132 | 8.1616 | |
| NJUPT | 2013 | [13-14] | 0.0527 | 0.4932 | 0.3946 | 0.8117 | 0.1335 | 0.6076 |
| 2014 | [14-15] | 0.0260 | 10.8294 | 0.3203 | 2.1840 | 0.0811 | 4.9577 | |
| 2015 | [13-15] | 0.2815 | 5.3414 | 0.6996 | 1.7728 | 0.4023 | 3.0124 | |
| HHU | 2013 | [13-14] | 0.0200 | 2.8415 | 0.0384 | 11.7904 | 0.5208 | 0.2410 |
| 2014 | [14-15] | 0.0569 | 6.7514 | 0.4529 | 0.8789 | 0.1255 | 7.6813 | |
| 2015 | [13-15] | 0.3838 | 19.1842 | 0.3981 | 10.3626 | 0.9642 | 1.8512 | |
| JNU | 2013 | [13-14] | 0.0777 | 0.7726 | 0.4243 | 1.3637 | 0.1830 | 0.5666 |
| 2014 | [14-15] | 0.0600 | 3.9929 | 0.5787 | 0.8410 | 0.1037 | 4.7476 | |
| 2015 | [13-15] | 0.2395 | 3.0848 | 0.4867 | 1.1469 | 0.4922 | 2.6899 | |
| NJFU | 2013 | [13-14] | 0.0622 | 1.6164 | 0.2563 | 1.2815 | 0.2425 | 1.2613 |
| 2014 | [14-15] | 0.1005 | 4.5134 | 0.3285 | 2.5559 | 0.3059 | 1.7668 | |
| 2015 | [13-15] | 0.4535 | 7.2953 | 0.8396 | 3.2754 | 0.5405 | 2.2284 | |
| UJS | 2013 | [13-14] | 0.0200 | 2.3941 | 0.4277 | 0.9042 | 0.0707 | 1.7532 |
| 2014 | [14-15] | 0.0479 | 5.6853 | 0.3867 | 1.6634 | 0.1239 | 3.4190 | |
| 2015 | [13-15] | 0.2724 | 13.6113 | 0.6433 | 1.5040 | 0.4236 | 5.9941 | |
| NTU | 2013 | [13-14] | 0.2630 | 0.8427 | 0.7543 | 0.6929 | 0.3486 | 1.2163 |
| 2014 | [14-15] | 0.2216 | 2.6948 | 0.5226 | 1.8542 | 0.4240 | 1.4533 | |
| 2015 | [13-15] | 0.5972 | 2.2710 | 0.9690 | 1.2847 | 0.6162 | 1.7676 | |
| NJNU | 2013 | [13-14] | 0.0274 | 1.5713 | 0.1065 | 0.8375 | 0.2570 | 1.8763 |
| 2014 | [14-15] | 0.0430 | 9.9149 | 0.0892 | 7.1296 | 0.4823 | 1.3908 | |
| 2015 | [13-15] | 0.4263 | 15.5794 | 0.6357 | 5.9707 | 0.6708 | 2.6096 | |
| JSNU | 2013 | [13-14] | 0.0397 | 1.5606 | 0.5769 | 0.1077 | 0.0688 | 14.4929 |
| 2014 | [14-15] | 0.0619 | 11.5616 | 0.0621 | 11.5212 | 0.9965 | 1.0035 | |
| 2015 | [13-15] | 0.7157 | 18.0435 | 0.7157 | 1.2406 | 1.0000 | 14.5433 | |
| NJUE | 2013 | [13-14] | 0.0750 | 0.6535 | 0.1392 | 1.8855 | 0.5389 | 0.3466 |
| 2014 | [14-15] | 0.0490 | 8.3379 | 0.2625 | 3.8046 | 0.1868 | 2.1910 | |
| 2015 | [13-15] | 0.4088 | 5.4489 | 0.9988 | 7.1736 | 0.4092 | 0.7594 | |
| USTS | 2013 | [13-14] | 0.0872 | 1.1464 | 0.2485 | 1.5627 | 0.3510 | 0.7336 |
| 2014 | [14-15] | 0.1000 | 3.9331 | 0.3884 | 1.4279 | 0.2575 | 2.7546 | |
| 2015 | [13-15] | 0.3933 | 4.5088 | 0.5546 | 2.2313 | 0.7092 | 2.0207 | |
| YZU | 2013 | [13-14] | 0.3519 | 0.8140 | 0.4947 | 2.0214 | 0.7113 | 0.4027 |
| 2014 | [14-15] | 0.2864 | 2.0347 | 1.0000 | 0.9978 | 0.2864 | 2.0383 | |
| 2015 | [13-15] | 0.5828 | 1.6563 | 0.9978 | 2.0169 | 0.5839 | 0.8209 | |
| Average | 2013 | [13-14] | 0.0823 | 1.2983 | 0.4155 | 1.7087 | 0.2572 | 2.0705 |
| 2014 | [14-15] | 0.0835 | 5.3466 | 0.3872 | 2.7786 | 0.2782 | 3.0363 | |
| 2015 | [13-15] | 0.3515 | 7.0417 | 0.6737 | 2.8177 | 0.5803 | 4.0256 | |
© 2017 by the authors. Licensee MDPI, Basel, Switzerland. This article is an open access article distributed under the terms and conditions of the Creative Commons Attribution (CC BY) license (http://creativecommons.org/licenses/by/4.0/).
Share and Cite
Wang, X.; Hu, H. Sustainability in Chinese Higher Educational Institutions’ Social Science Research: A Performance Interface toward Efficiency. Sustainability 2017, 9, 1952. https://doi.org/10.3390/su9111952
Wang X, Hu H. Sustainability in Chinese Higher Educational Institutions’ Social Science Research: A Performance Interface toward Efficiency. Sustainability. 2017; 9(11):1952. https://doi.org/10.3390/su9111952
Chicago/Turabian StyleWang, Xianmei, and Hanhui Hu. 2017. "Sustainability in Chinese Higher Educational Institutions’ Social Science Research: A Performance Interface toward Efficiency" Sustainability 9, no. 11: 1952. https://doi.org/10.3390/su9111952