4.1. The Departure Regions of Romania
Although the emigration phenomenon has become a subject of several studies, with its causes, development and effects being fairly well known at the national level, it remains a relatively unknown phenomenon in terms of migratory regionalization. Apart from some studies carried out at the locality level [
3,
10,
38,
41], other studies remain representative of the national level and do not enter into detailed study of a region [
11,
42,
43]. Moreover, our approach will be the first one that can present an image of migratory circuits between all regions of Romania and France. The conception of an image of the migratory circuits between the two countries constitutes the first step in this process of painting the picture of Romanian emigration towards France. We will present the measures that we applied in order to identify the directions of the migratory circuits between Romanian regions and some regions of France.
We calculated the rate of emigration to France, which corresponds to each department of using the data from the bus company combined with the one from the 2002 census. In order to calculate this index, we have collected the data corresponding to the cities of the same department. In those departments where we analyzed many cities, we collected data from all these cities in order to obtain the data corresponding to the department in question. In those departments where only one city was taken into account, we extrapolated these data for the entire department. The motivation for our choice for this extrapolation is presented in the following lines.
Our approach for extrapolating data from cities to department level is based on the specificity of our data. Our figures show the departures made in buses from the largest cities of Romania. We begin with the assumption that the departure cities do not only include the population of the city itself but also that of small towns and villages that are in the immediate vicinity. We confirm this assumption by the fact that between large cities, small towns and villages that are in close proximity, there is a strong connection and interdependence (Since, for economic reasons, international transport companies only operate in large cities and not in villages or small towns, in order to maintain strong connectivity between other towns of the department and cities/main cities, our assumption is that the departures made from the major departmental cities represent all departures made at the departmental level) [
42,
44].
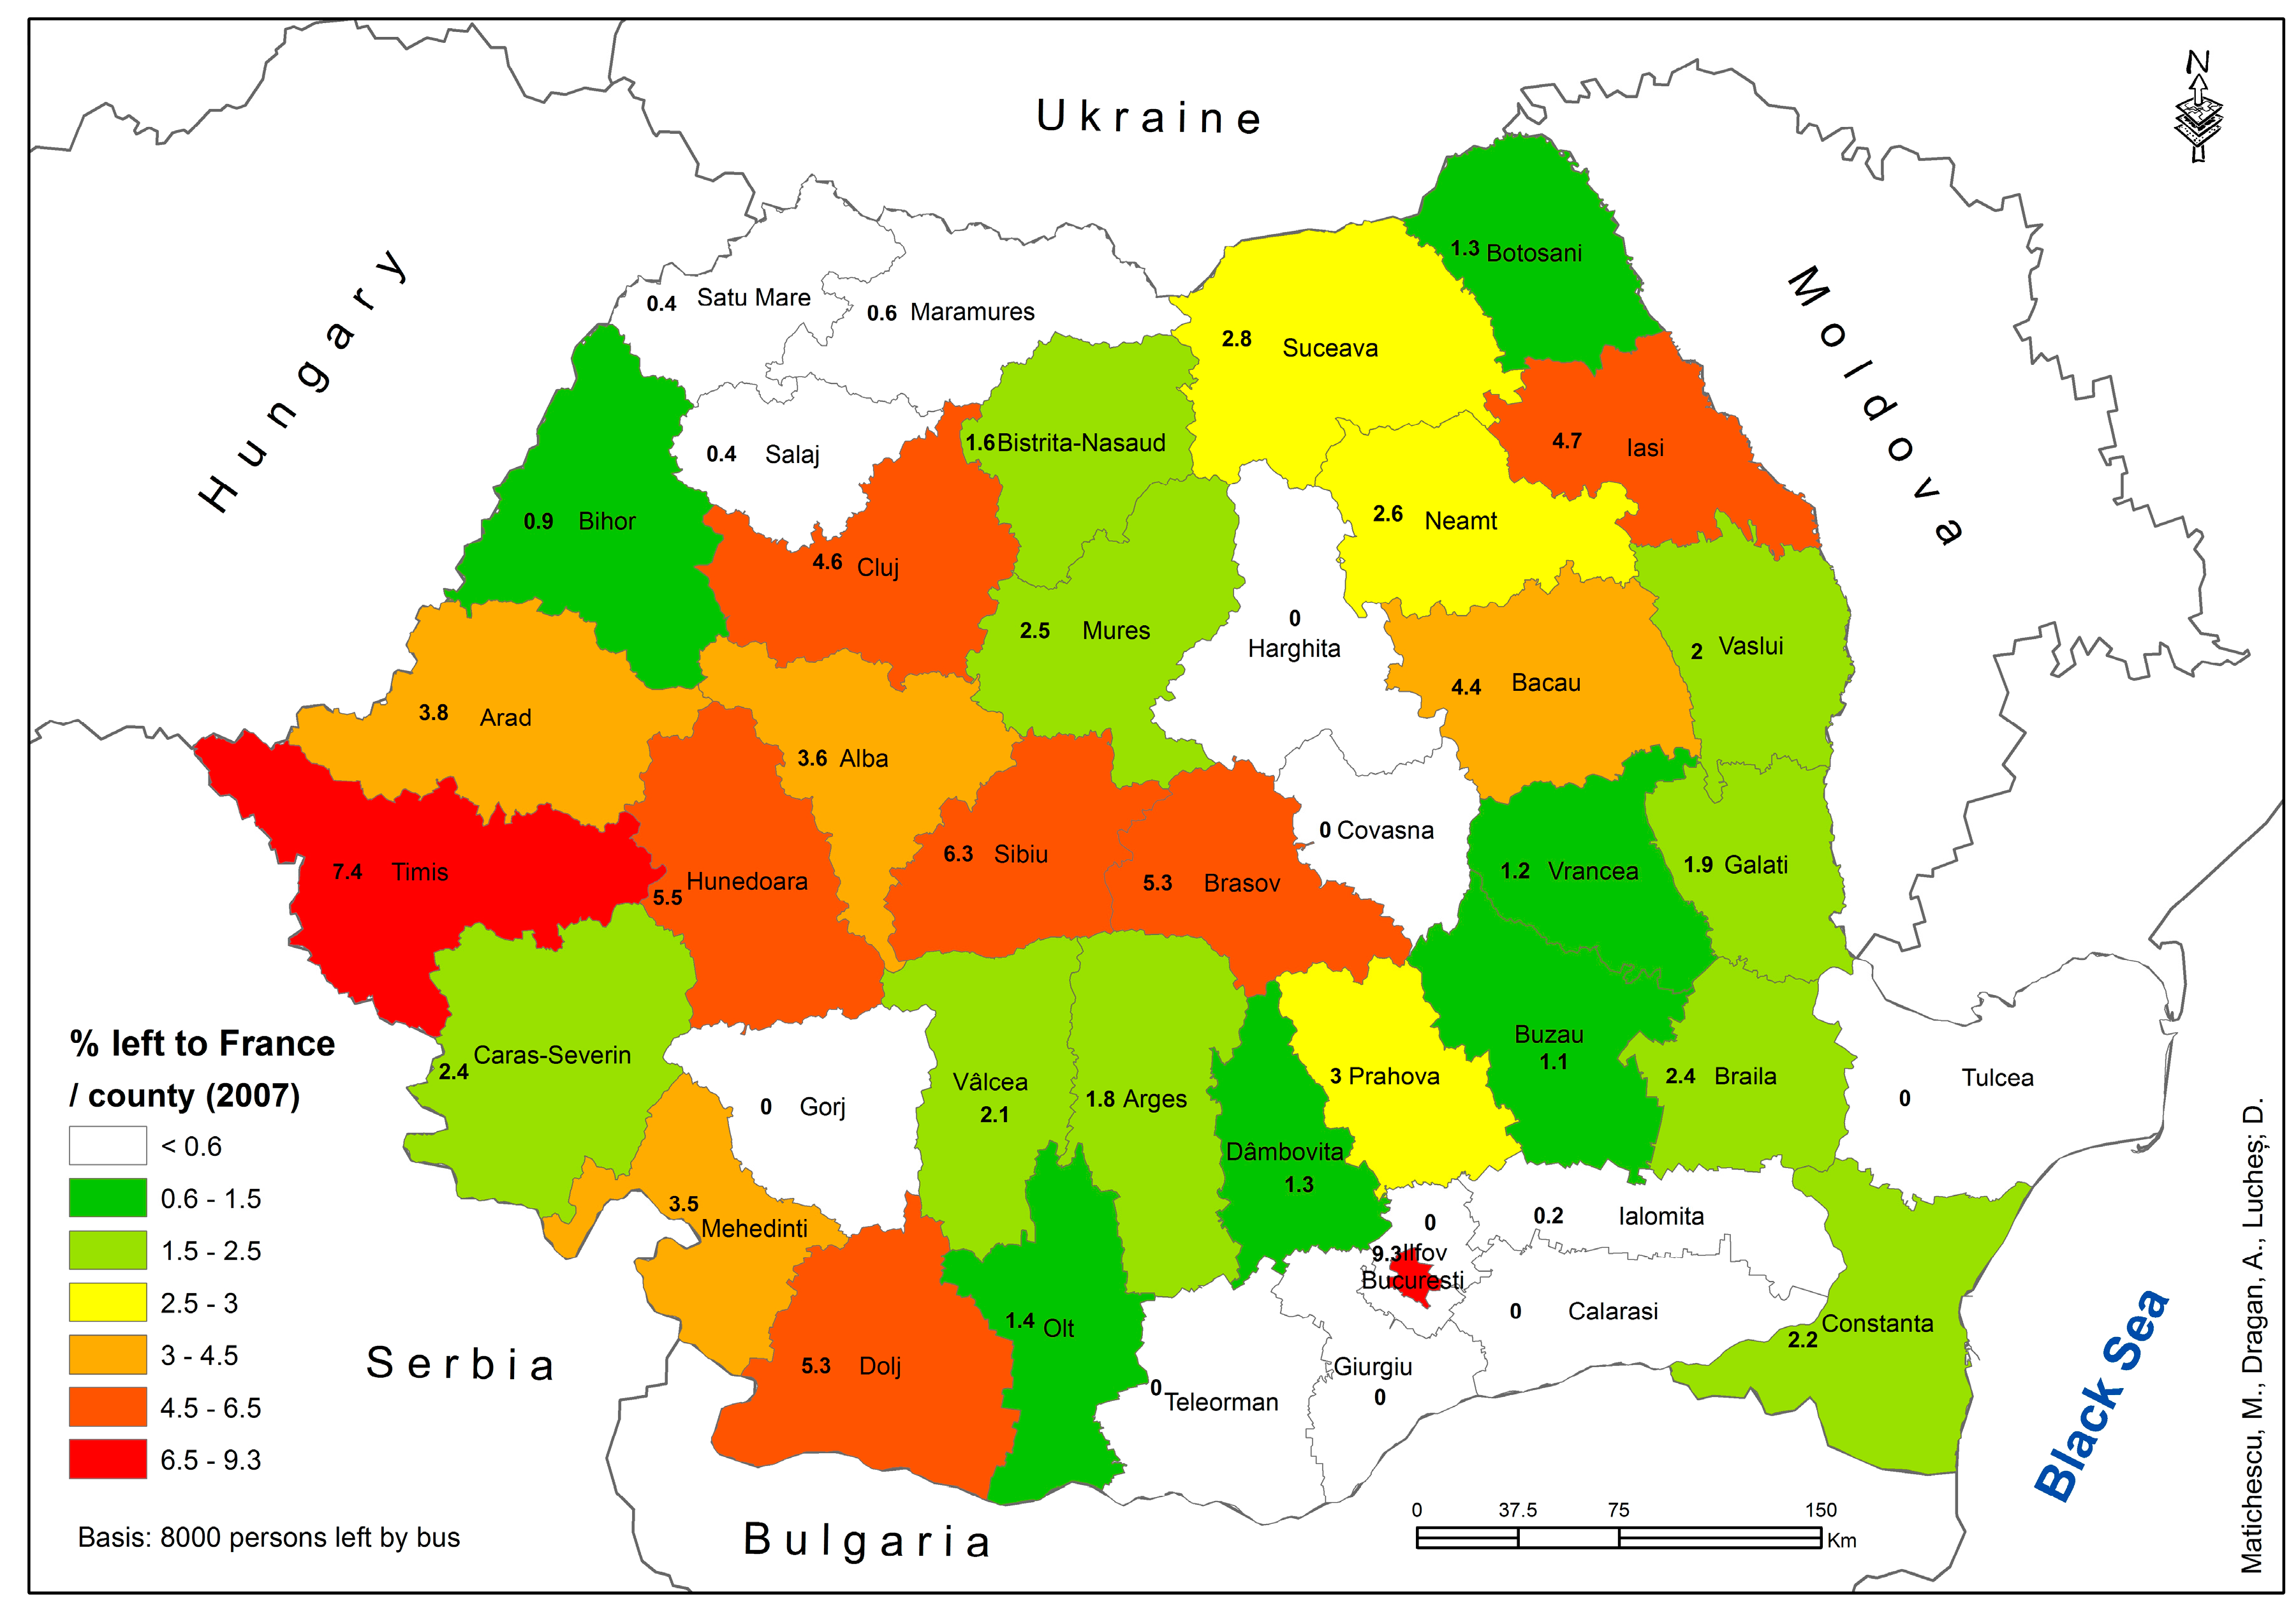
As far as our study is concerned, we have at least one city at each department’s level, from which the departures were made. In all cases where only one city is mentioned, it is the primary location in the department and the only one from where the departures were made. Thus, by grouping all the departures carried out at the departmental level, we can say that the data become representative of this level. The result of this approach, as we have seen, highlights the fact that the departments with the highest emigration rates are the ones having the highest rate of emigration from their major towns. The average rate was 238 departures per department and it corresponds to 2.93% of our samples taken at the national level.
Using this standard deviation of 2.10 for the percentage analysis, we have defined four categories of departments (see
Table 1). The first category concerns the departments with a very small migratory rate represented by the cities that have an emigration rate between 0% and 1%. In this category we find the departments in the North-west of the country: Satu Mare, Salaj and Bihor and another department near Bucharest, Ialomita.
We want to draw attention to the following question: why is the emigration rate lowest in these departments? For the region surrounding Bucharest, the low level of international migration can be explained by the proximity to the capital, which attracts the labor force. Studies on urban dynamics show the capacity of Bucharest to act as a magnet and to attract people from the departments around it [
45]. As for the other three departments in the North West part of the country, there are data and sociological studies that could explain their reduced presence on this migration route. Dana Diminescu in her study on the young people of Satu Mare, considered Romanian emigrants moving to France in the early 90s as pioneers [
18]. In this regard, in this region we have a strong migratory community, which is well developed and has already accumulated a considerable amount of resources. Considering that the bus transportation concern mainly migrants with low level of resources, in the first period of emigration, we assume that people from the north of Romania, being a developed migration community, do not use national bus companies anymore. Moreover, having an old migration network, the individuals from the North developed their own local transportation opportunities (local companies, relatives, neighbors, etc.). More precisely, in the three departments, migration to France is not necessarily less stronger than in other departments, but because people have emigrated for a long time from these regions, they developed their own means of transportation [
18].
The impetus for showing that people in this region use buses less than any other means of transport is that the resources of emigrants are growing in direct proportion to their time spent abroad, and by using these resources, one of the first purchases made by the Romanian emigrants is a personal vehicle. Resource growth can be associated with the purchase of a car and thereby to the movement between the two countries by immigrant’s own means or with the assumption of the involvement of other factors in regard to the choice of means of transport.
The second category of department is the one which has an emigration rate between 1% and 3%. In this category, with the standard deviation below average, we find the Romanian departments of north, north east, east, south east and south.
Departments with an above-average emigration rate towards France, i.e., between 3 and 5 percent and more than 5 percent, are located in the central and western part of Romania. If one divides the Romanian map into two from the west to the east, it is possible to observe, apart from the Romanian capital and two departments, a very strong regionalization between the west and the east. In 2007, the western part and the central part had an above-average migratory rate towards France, while the emigration to France was below average for the east, north and south.
4.2. The Intensity of Emigration among the Population of the Department
In order to find out whether the regionalization of emigration in relation to cities and departments is an effect of their demographic quota, a question is posited in our analysis: if the emigration rate is higher for some cities and lower for other cities, is it the result of the size of the city? Bucharest has the highest migration rate, but it is, at the same time, the largest urban center of Romania. This interrogation thereby becomes central to our study; it is about the relation between the emigration rate and the size of the city.
By comparing the emigration rate with the size of the city/department, we can relate cities having a larger, smaller or equal emigration rate as compared to their demographic quota. More precisely, we can observe the cities having a higher or a lower emigration flow towards France in comparison to their own sizes. In order to compare these two variables at each city/departmental level, we will have to compare the emigration rate with the demographic contingent of the same city/department in relation to the national total.
But before we move on to this type of analysis, we interrogate into the possibility of lending our data to this type of analysis. Our data represent the departures made from the principal towns of the Romanian departments. As the data are not representative only for the city but for the entire area around the city or even for the whole department, the calculations that we have made are not possible by using our data in their primary form at each city level; to be more precise, although we may have official statistical data on the size of the population in each city, we cannot use those data just at the city level. We cannot substantiate it for a simple reason that all the emigrants who left one city or another did not live in the city in question.
Following this logic, our approach, which aims to relate the emigration rate (A) to the demographic quota (B), becomes feasible only at the departmental level. To implement this approach, we compared the emigration rate percentage of the department (A) with its population percentage at the national level (B). Taking the official population census figures from 2002 we have calculated the population percentage in each department.
In a uniform emigration situation of the same intensity throughout the department, for an X percentage in the national population, one must have the same X percentage for the emigration rate. Specifically, the population size of each department must represent, in terms of percentage, the probable emigration rate of the same department. For example, a department with 3% of the population must have a probable emigration rate of 3%. Therefore, the population rate is equal to the probable emigration rate (C) for the same department.
Once we know the probable emigration rate for each department we can calculate the emigration intensity in each department. The intensity of the emigration process (I) in the department is the result of the difference between the actual emigration rate (A) and the probable emigration rate (C)
By calculating the difference between the actual emigration rate and the probable emigration rate, we can know from which department emigration is more intense or weak towards France, in each case. In the case where I (A − C) is a negative number, emigration could be said to be below its expected rate in relation to the population. Therefore, the intensity is lower in this department.
In the case where intensity (I) is a positive number—thereby suggesting that the actual emigration rate exceeds the probable emigration rate—we can conclude that the department experiences an intense rate of emigration towards France. Case 0 represents the ideal case in which the actual emigration rate is equal to the expected emigration rate.
For example, in our sample, the department of Timis has a real emigration rate (A) of 7.4% at the national level. At the same time, its population (B) is equivalent to the probable emigration (C) at national level, representing 3.12%. Since the result of the difference between the actual emigration rate and that of probable emigration rate is a positive number, it may be deduced that emigration towards France is an intense phenomenon in this department. Moreover, since the number obtained by this difference is equal to the probable emigration rate, it may be said that the actual emigration is two times higher than the probable emigration in that department. It means that the emigration flow towards France in the department of Timis is very intense and involves a very large percentage of its population.
The case of Timis department:
A = 7.4%
B = 3.12%
C = 3.12%
I= 7.4% − 3.13% = 4.27%
According to our calculation, in other departments such as Bihor, the size of the emigration rate is much smaller than the size of the probable emigration; as a result the intensity of emigration is very low. Even though the department holds 2.77% of the national population, the emigration rate in this department, calculated at the national level (A) is only 0.9%. In this case, (I) is a negative number, (−1.87), which means that the emigration in this department is a process that does not concern a very large percentage of the population. Therefore, the intensity of the emigration phenomenon is very low in this department.
From a similar viewpoint, the intensity of emigration to France was calculated for all the Romanian departments. They are presented according to their intensity (
Figure 1).
Firstly, we defined four categories of departments in relation to the intensity of the emigration phenomenon (I) (Between −2% and −1%, “between −1% and 0%”, “between 0% and 2%” and “more than 2%”). The first category, “between −2% and −1%”, defines the departments with very low migratory intensity. The “between −1% and 0%” category is specific for departments with low emigration intensity while the “between 0% and 2%” category defines the departments with high migratory intensity. Finally, in the last category, we find the departments with very high migration intensity. In these departments, the actual emigration rate in some cases is twice as large as the probable emigration rate that corresponds to the size of the department.
As
Figure 1 shows, we can observe that the departments of the west and the center have the highest intensity of the migration process. The departments of Timis and Sibiu are those where the emigration is the strongest, exceeding several times the national average. In the same category of departments in which the intensity of the migration process is very high, there are other departments such as Mehedinti, Dolj, Hunedoara and Brasov.
In the western part of the country also we can find the departments where emigration is enclosed in a standard deviation above average. More precisely, these departments have an intensity “between 0% and 2%”: namely the departments of Caraş-Severin, Arad, Cluj and Alba.
In the same interval provided by the standard deviation, but lower than the average (with an intensity “between −1% and 0%”), we find most of the northern and eastern regions of Romania. Bucharest, Ilfov and Prahova fall into this category.
The department table is filled with the departments of northern Romania where the strength of the migratory process is the lowest in comparison to the size of their population. In this category are the departments of Bihor, Maramures and Satu Mare. The same situation can be observed for the departments around Bucharest: Dâmboviţa, Arges, Buzau, Ialomita or Constanta.
If we make assumptions about the departments in the north of the country, we can say that these results are the consequence of the limitation of our data, restricted to the bus transport. The migration by bus in 2007 is no longer representative of the population of this region having prospered due to long-term emigration. As a result of their prosperity and development of their migration network, as we assumed before, migrants may now prefer to travel by private cars or by plane or by local transportation companies to arrive in France.
With regard to very low emigration for the departments around the capital, the explanation that we are putting forward, and which remains to be verified later, refers to other aspects such as industrialization of the region and other economic indicators. Knowing that Bucharest was the most industrialized region of Romania, with the greatest amount of investment received after the fall of the communist period, it can be said that the region has always needed manpower. Competitive and diversified offers may have encouraged migrants to move towards the country capital instead of moving to abroad [
45]. As far as the results of our approach are concerned, we have observed that the emigration towards France in the year 2007 specifically concerned the central and the western Romania. The departments of these two regions, as well as the capital Bucharest, are those that exceed the national average. The administrative centers of these departments and cities such as Timisoara, Sibiu, Deva or Bucharest, are the departure points that have not only brought together the population of the city but also the rural population around the city. Once the departments with the highest migratory rate were identified, the intensity of the migration process at each department level was the next question that our study proposed to answer. By comparing the emigration rate with the population of the department we have seen that the departments where emigration is very intense are the departments of the west, the south-west and the center of the country; in these departments, the migration towards France is the most intense in comparison to the population of the department.
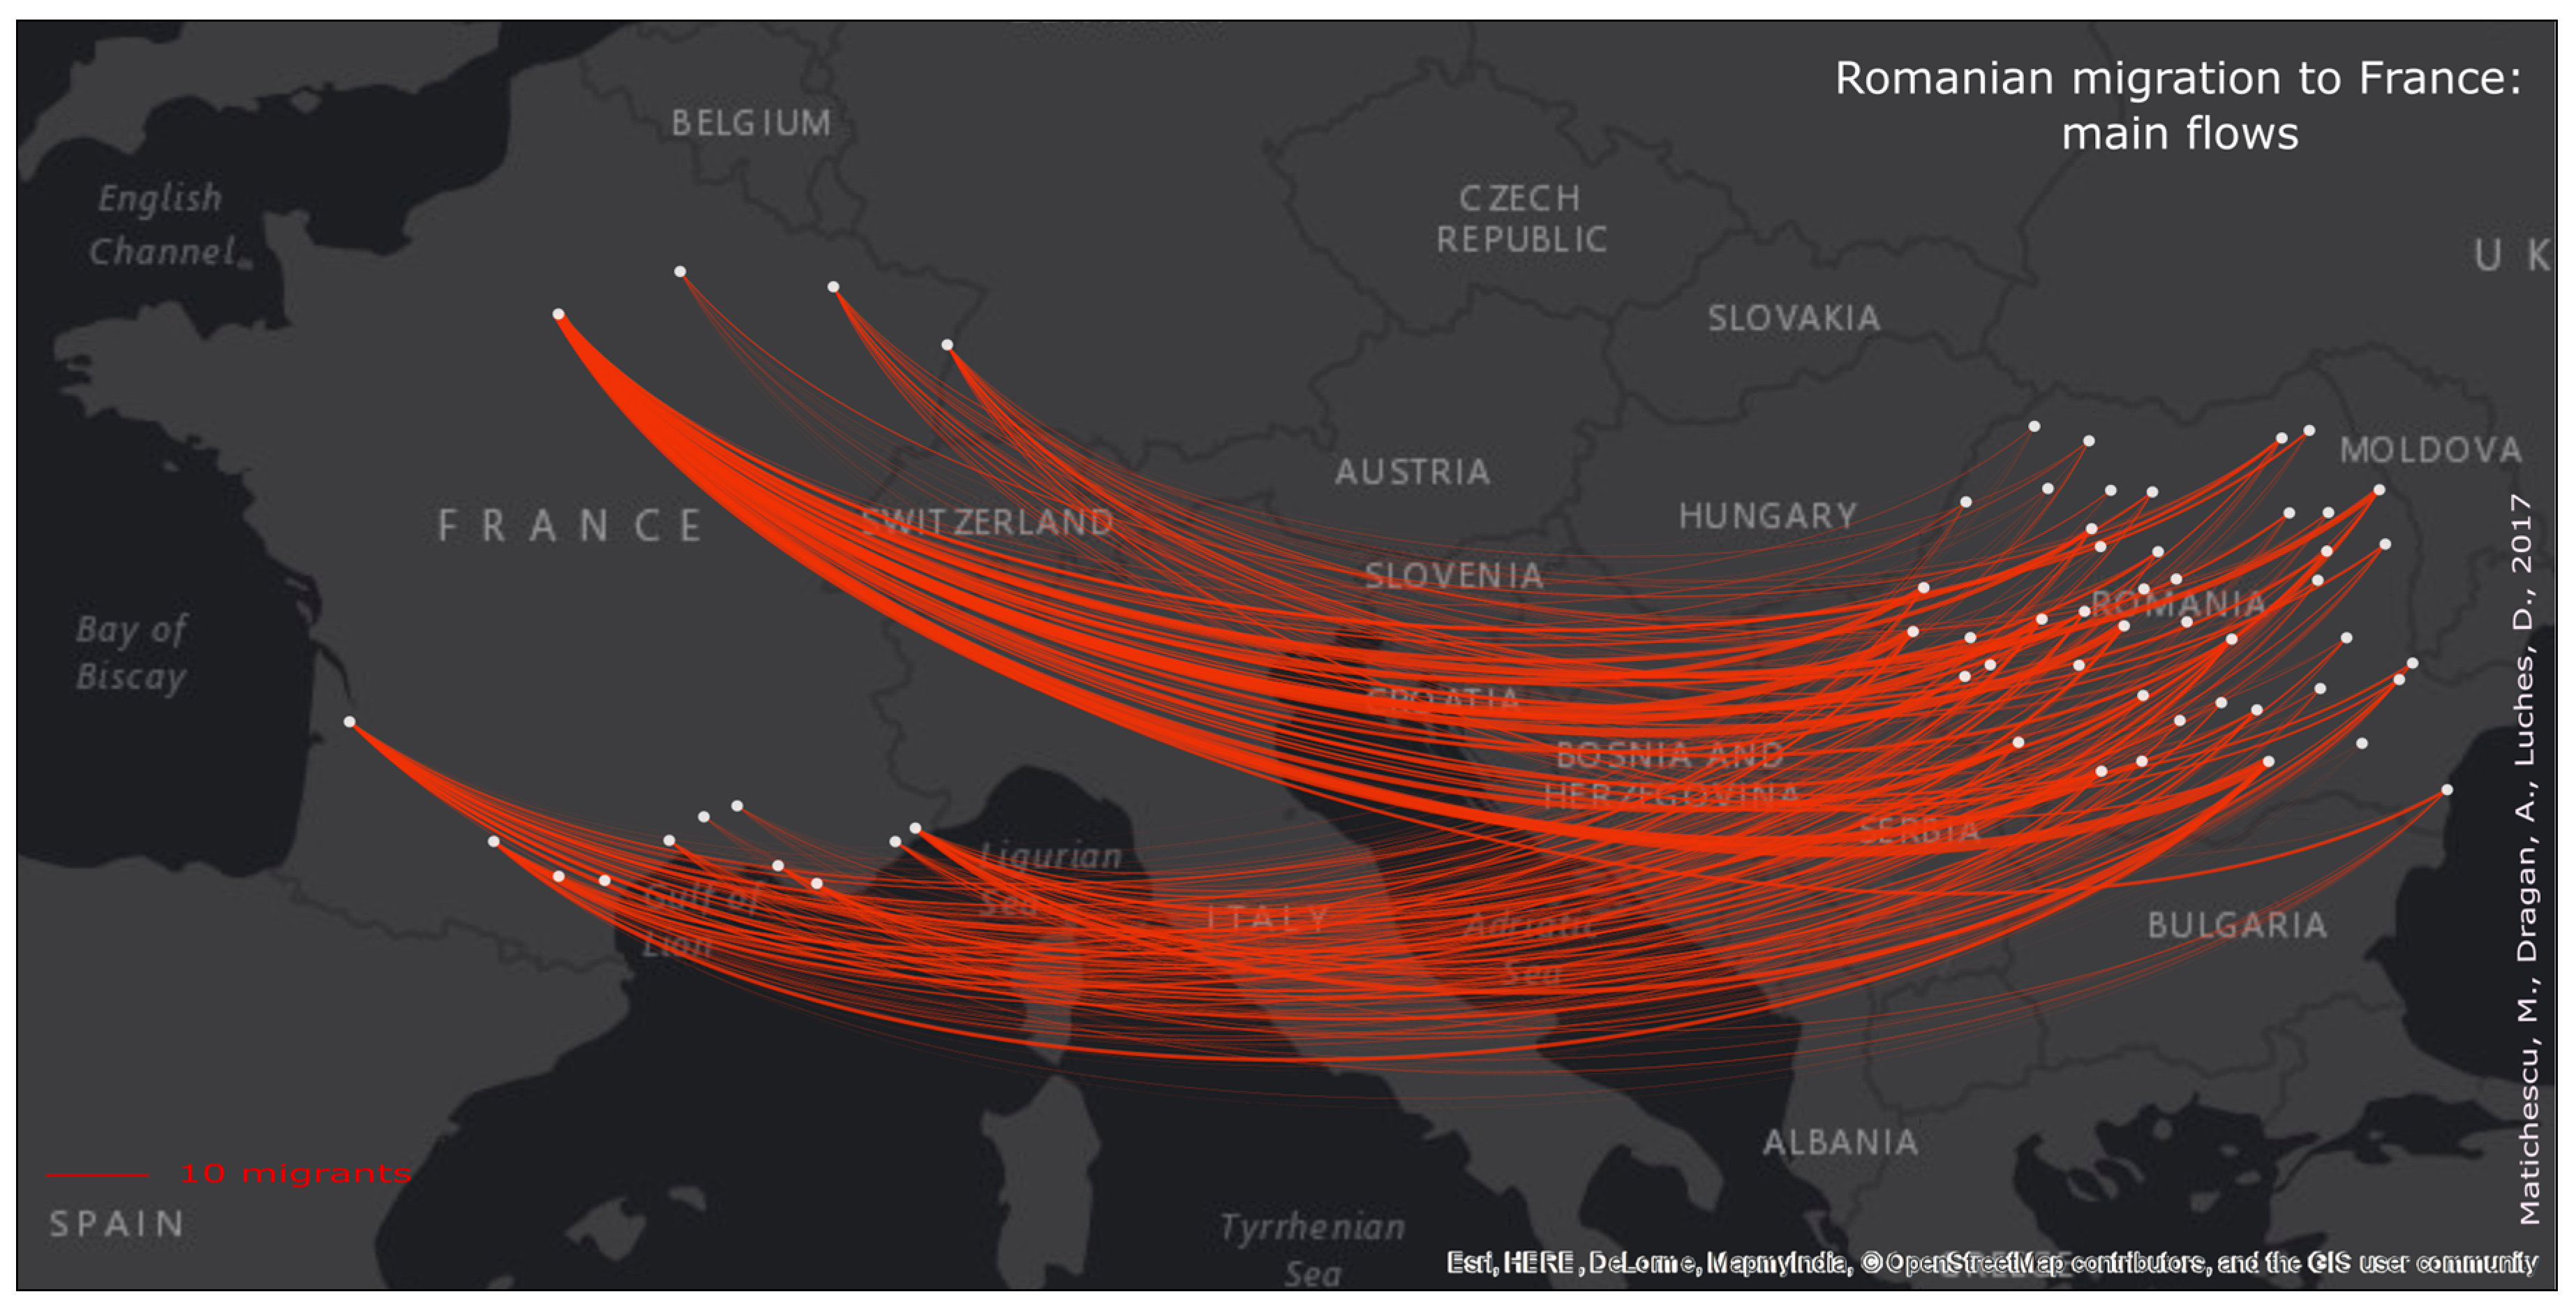
4.4. The Migratory Circuit between Romania and France
Once the main destination cities have been identified, another question relevant to our study is whether there are strong correlations between the Romanian and the French cities. This new reasoning can help us to identify the principal migration networks between Romania and France.
Our next goal is to study “concomitant variations” [
46], i.e., relationships or correlations between the departure or arrival regions. The main tool that we will use to study the relationships between the “departure regions” variable and the “destination region” variable is the cross-tabulation. It is a table showing the distribution of individuals according to two simultaneous variables. These tables are intended to highlight the influence of one variable over another (in order to identify the social determinants) or, in a simpler way, the dependence of a cross-variable (in order to show the existence of interdependence between the phenomena) [
40] (p. 67).
The question to which this type of picture responds is “to what extent such phenomena depend on social characteristics.” Using the cross-tabulation as type of analysis for our study, we want to identify the extent to which the presence of a migrant in a French region is dependent on his/her departure from a particular Romanian region.
By taking the cities of arrival one by one, and making the calculations of the cross table, it has been observed that there are some cities in France where the emigrants come from some specific cities of Romania. In the case of Avignon, 21% of the migrant population comes from Iasi city/region, 7% from the region of Sibiu and 5% from the region of Piatra Neamţ. All other cities in Romania have an emigration rate of 0–2% towards Avignon.
Similar cases to that of Avignon can be identified for other city-pairs such as Cannes, where 27% of Romanian migrants come from the city of Iasi, Carcassonne, where 24% of the migrants are from the city/region of Târgu Mures, and Reims where, in a ratio of 33%, Romanian migrants come from Suceava. In the same category falls the city of Toulon where 20% of the migrants come from the city of Sebes.
The case of Bordeaux is different; we do not have a Romanian city from where most of the population arrives to this particular city. The highest percentage belongs to the city of Bacau with 8.7%, followed by Bucharest with 7.8%, Brasov with 7.4 and Braila with 6.7%. Some other cities like Timisoara, Craiova and Focşani have a percentage around 5%, while the others have a lower percentage of departure.
Marseille or Nice represent similar cases as Bordeaux. In Marseille, it cannot be said that the migrant population comes from a particular region/city of Romania. The population originates, in almost equal proportions, from several cities and regions: Iasi, Bucharest or Sibiu. In the case of Nice, apart from the migrants from Bucharest (15%) and others from cities with a percentage between 4% and 6%, such as Deva (6%), Ploiesti (5.7%), Sebes 6.4%), Targoviste or Timisoara (5%), the origin from all other cities is almost uniformly “distributed” among other Romanian cities.
For the city of Paris and the region of Ile-de-France, Romanians arriving in this geographical region come from Bucharest (8.3%), Sibiu (6.5%) or Timisoara (7.3%). Other cities are included in a normal trend curve, proof that the migration to Paris affected more or less all the regions of Romania.
If the analysis we have just presented highlights the cities from which most migrants come to the cities of France, another type of approach puts emphasis on the cities of Romania. By focusing on these Romanian cities, we can trace the preferred destinations in France from each city. More precisely, in the framework of first calculations, we identified the regions from which the immigrants come in order to settle down in Ile de France and other regions of France. In this type of calculation, only those regions are taken into consideration which have provided a large number of migrants, and because of a very low percentages of migration, one cannot see the migration trend for the cities having a very low rate. For this reason, we have chosen to carry out a second type of calculation in order to highlight the preferred destination for each city taken into account.
To identify the advantage of this type of analysis, we will take the case of the city of Turda (in the central part of the country, department of Cluj). As the number of migrants from Turda to Paris is not large enough in comparison to cities like Bucharest, Sibiu or Timisoara, it was not considered as a main Romania city sending migrants to Paris. In this second calculation of destination cities for migrants from Turda, we observed that 93% of its population included in our study chose Paris as their destination city. This information becomes very important for our study because it highlights the existence of a strong migratory network between Turda and Paris. In similar cases there are thirteen cities which have a percentage superior to 47% of departures to Paris: Arad (48.5%); Botoşani (62%); Constanta (48.9%), Craiova (56.7%), Dej (59%); Medias (70%), Piatra Neamţ (51.6%), Ramnicu Vâlcea (55.7%), Resita (62.8%) Sibiu (47.7%) Slatina (55.5%); Timisoara (48.6%), Turda (93.3%), Turnu Severin (54.7%).
But Paris is not the only city to become a favorite destination because, for Romanian cities like Bacau or Focşani, the main destination is Bordeaux in France. The city of Nice is also a destination chosen primarily by the migrants of Targoviste. This migration route was also identified through field work carried out by Swanie Potot in her research carried out between 1997 and 2000 [
47]. Similarly, Nice, as well as Toulouse, are important destinations for those who come from Bucharest (see
Figure 2).
We can observe by looking at these calculations that there is a strong relation of correspondence between the regions of Romania and some regions of France. The fact that more than 40% or even 50% of migrants from one region have chosen the same destination shows that there is a strong migration network between these two regions. Through this statistical approach carried out at the national level, our results on the existence of migration networks are again confirmed, indicating the presence of geographic clusters we treated in the first section of this article (see
Figure 3).
In addition, geographic distribution, with regard to cities, is also an important phenomenon to observe. If we look at the Romanian cities that have as their main destination the Parisian region, we can remark that they are mostly part of the western and central regions of Romania. On the other hand, regarding migration to the south of France, it concerns the population coming from the east and the south-east of Romania.


