2. Methodology
This study explores the environmental performance of fixed types of canopies, which are attached to school buildings and extend from the building boundary. The type of canopy most frequently found takes the form of an overhang, one side of which is attached to a wall and acts as a mono-pitched roof. Once this canopy is installed, it is not possible to change either the form or the angle at which it is attached. Hence, it is defined as a fixed canopy. Environmental factors (e.g., solar radiation, wind speed, etc.) play an important role in influencing the outdoor thermal comfort in an unheated sheltered semi-outdoor space. Therefore, obtaining values for the environmental parameters on the site to be examined by simulation is a prerequisite for calculating outdoor thermal comfort. In order to calculate PET comfort, different software packages were combined. As there is currently no single software package available to calculate PET comfort using a three-dimensional model (with different transparencies) that takes into consideration the building’s materials, it was necessary to use other software packages to generate the required data to be entered into Rayman v1.2 for the calculation of outdoor thermal comfort [
30,
35].
Before simulating outdoor thermal comfort using Rayman 1.2, preliminary calculations of solar radiation on an hourly basis and wind speed were necessary. Following that, the combined effect of both environmental factors on outdoor thermal comfort was explored, allowing the maximum possible thermal comfort under the combined effects to be determined, as illustrated in
Figure 1.
Simplifying the model is a way of reducing the calculation time; it is impossible to model the whole built environment as the physical conditions vary from place to place. It is important to use a simplified model that focuses on the main building elements and to observe how variations in environmental factors alter the environmental performance of the space. For this purpose, software packages for environmental simulation were used to review the impact of each environmental factor. Rayman v1.2 [
32] was selected for the calculation of outdoor thermal comfort using the thermal comfort index, Physiological Equivalent Temperature (PET).
It was necessary to analyse UK climates in different places so that it is possible to identify how the use of transitional space in schools can be adapted to consider the local climate. Three large UK cities (London, Manchester and Glasgow) were chosen to represent each climate zone in the UK (north, middle and south climate zones) in order to check how differences in the physical conditions chosen for examination would affect the outdoor thermal index: PET. The UK climate is categorised as temperate maritime, in that there is relatively little seasonal variation in temperature between summer and winter. Though it is difficult to predict the weather due to its changeability, the UK climate is affected by the Atlantic Ocean, which reduces the variation of temperature over the whole year.
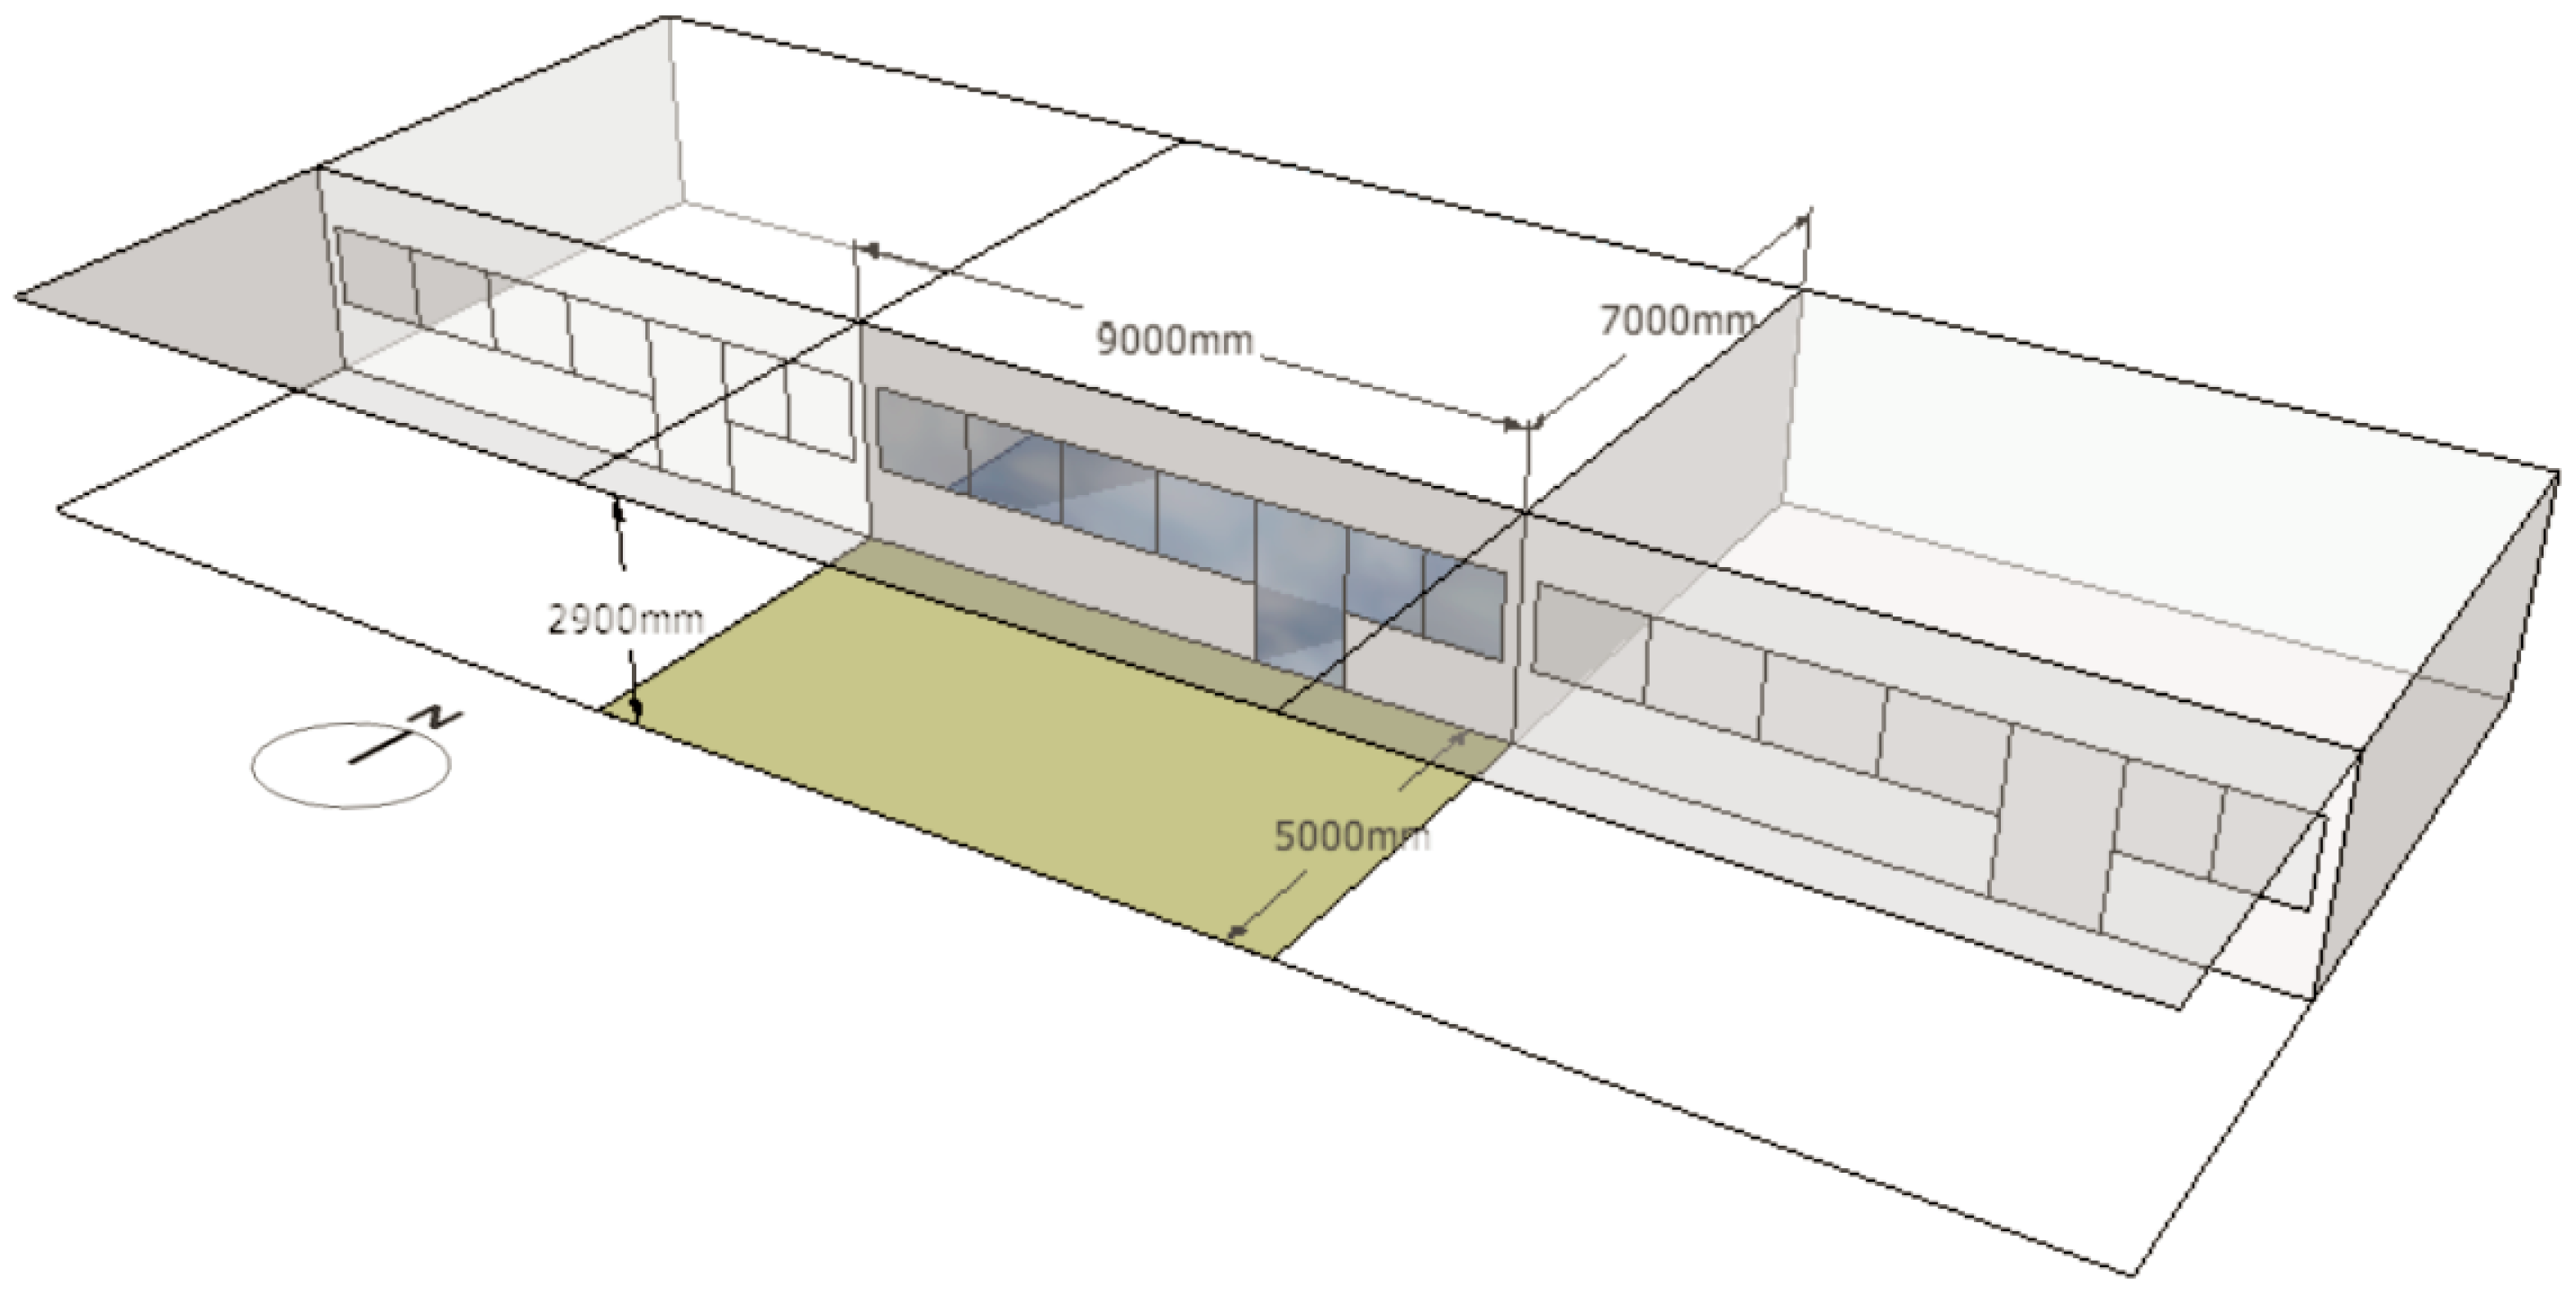
The model was based on a design characterised by preliminary research into the common-practice design of classrooms [
36]. The size of the classroom under test was 63 square metres (9 m × 7 m) with three classrooms in a row, with a height of 2.9 m. A sheltered semi-outdoor space (represented by a light-green colour in
Figure 2) consisting of a 5 m canopy, the general size of an outdoor classroom, was explored to determine the outdoor thermal comfort. The simulated model was assumed to be built with high-performance building materials according to building regulations (
Table 1). The materials in the transitional space were allocated as bricks for wall, timber floor for ground and glass with three different transparencies for the canopy in the computer simulations.
The classroom located in the middle of the row of three was selected for the environmental simulation as it more clearly represents environmental performance affected by orientation and wind speed, in comparison to classrooms located at the corner or end. The meteorological data applied in this study came from Meteonorm 6.0, which includes weather data measured at Heathrow airport, London. Hourly data for the 10-year period of 1996–2005 was used for the detailed simulation.
The size of a semi-outdoor space can vary according to the needs of the school. As an extended classroom or supplementary shared teaching area, for example, for use on a rainy day, the space needs to be large enough to hold all students from the classrooms that share the semi-outdoor space. As there is no specific area schedule for external classrooms, it was necessary to refer to the recommendations for other areas suggested by DfES [
37], which shows recommended learning resource areas for any primary school. DfES suggests that the formula used for calculating such areas is 4 + 1.5 G (G = number of pupils), so the attached area for external education can be calculated and applied to the simulation as having an area of 46 m
2 based on the normal number of pupils in a small classroom of 28 people in
Table 2.
The Ecotect software is best known as a three-dimensional tool with an intelligible interface that is useful for both architects and engineers at the design stage of projects. The role of solar radiation is significant to human thermal perception. Therefore, it was essential to calculate the precise amount of radiation falling on the site under investigation. Autodesk Ecotect was used to compute the incident solar radiation on the specific area.
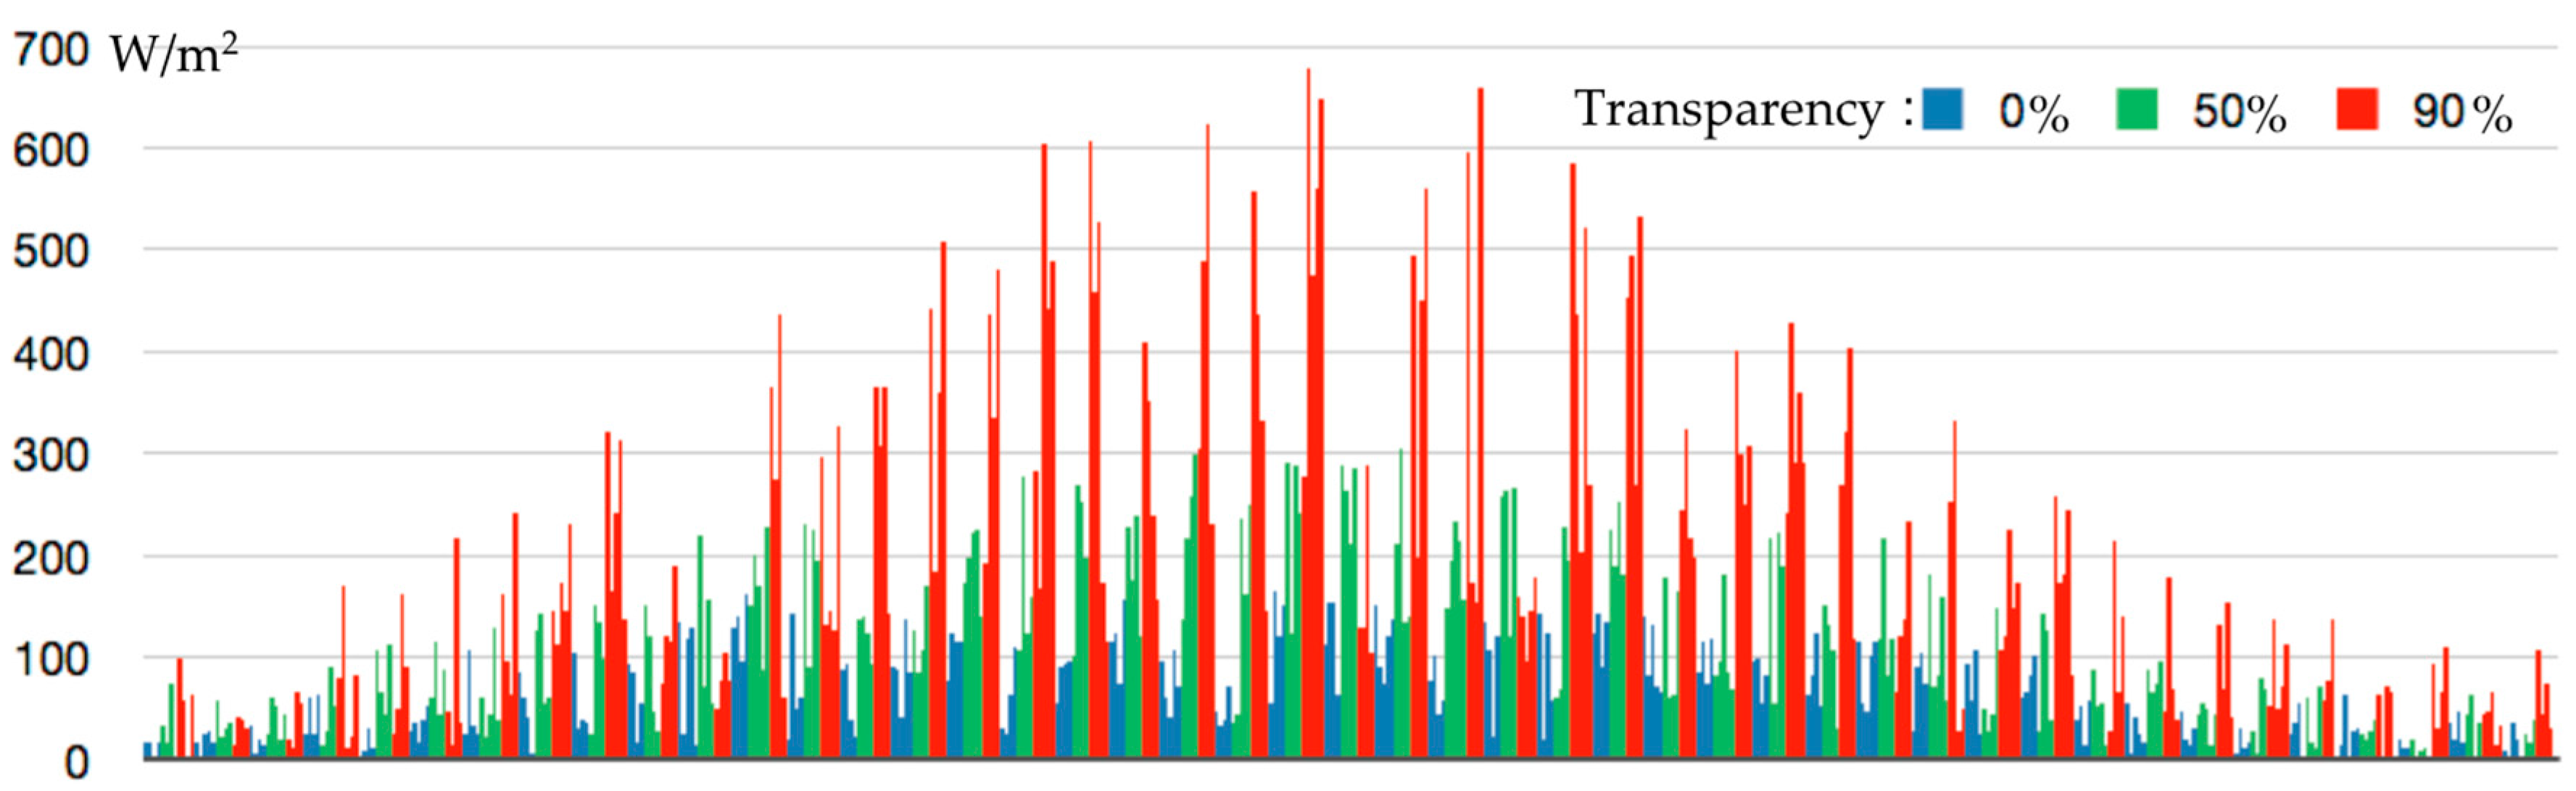
Simulations of the south-facing sheltered semi-outdoor space next to the classroom were made with different transparency rates of canopy: 0%, 50% and 90%. A 0% transparency canopy refers to canopies made from opaque materials that do not allow any light to pass through. The 50% and 90% transparencies of canopy permit light to pass through with solar heat gain coefficients of 0.5 and 0.9 respectively.
The canopy used for the simulation is composed of glass painted black, which can be adjusted to give visible transmittance (0, 0.5, 0.9) and solar heat gain (0.1, 0.5, 0.9). In particular, the 0% transparency (opaque) canopy used to provide theoretical data in this study can be considered as equivalent to other opaque canopies (e.g., timber frame or concrete cantilever). The average hourly solar radiation falling on the experimental grid in
Figure 3 was calculated by Autodesk Ecotect [
38] from thousands of readings with the help of script functions.
As the contribution of wind speed to thermal comfort is significant, it was an important part of the process to determine the wind speed over a particular area throughout the year. WinAir4 was used for the CFD (Computational Fluid Dynamics) simulation, to transfer the simulated data of the three-dimensional model to Autodesk Ecotect to discern the wind speed. As many researchers have shown from their investigations into the mechanisms by which wind approaches a building [
13], wind speed is affected by the terrain roughness, which leads to a decrease in wind speed at low levels in either urban or suburban areas. This varies according to the conditions of the local area. Local wind data is therefore vital when assessing the wind environment in an open space. The mean wind velocity and the direction of the wind during the time the space is occupied are the most important factors to consider. If space is occupied for the whole year, weather data in London should be obtained for all seasons and each month. Wind data can be obtained from the closest meteorological station or from a weather data pack (e.g., Meteonorm 6.0) in which wind speed is usually measured at the height of 10 m above ground level. The wind data can be modified in a graphical overview of the local wind velocities and directions for a specific site, based on measurements over a period.
Wind speed in the canopy area was calculated for different designs of the sheltered semi-outdoor space. Wind speed varies in relation to site conditions such as the height of the building, its layout and the presence of adjacent trees, all of which influence the wind speed in some way. Calculating the hourly wind speed was essential, and a crucial environmental factor in simulating the PET thermal comfort index, as the simulation uses hourly-based weather data to make detailed predictions.
To modify the wind speed, the formula of wind speed estimation in Equation (3), suggested by Spagnolo and de Dear, [
39] was adopted and wind speed for each location was derived.
where
Vzex: the mean wind speed at height Z (m/s);
Vz10: the mean wind speed at reference height Z10 (m/s);
Zex: the height above ground level (m);
Z10: the reference height (m);
α: the exponent characteristic of terrain roughness.
The exponent (α) can be varied according to the design of the sheltered semi-outdoor spaces in Equation (3a). Variables include the degree of openness or obstruction by trees or walls, as well as the shape and openness of the canopy, all of which can alter the air flow magnitudes and patterns within the sheltered semi-outdoor space.
Hourly wind speed under the canopy was calculated with exponents obtained from the simulation of WinAir4. A different value of exponent (α) can be generated for different types of windbreak or openness for the sheltered semi-outdoor spaces, which will help architects to understand and apply the various design criteria essential to the improvement of outdoor spaces in
Table 3.
Solar radiation and wind speed modified by different canopy conditions were applied as the main variable climate parameters, while temperature and humidity were applied with the original data obtained from Meteonorm 6.0. Rayman v1.2. Software was then applied to simulate the long-term thermal comfort in order to assess conditions in the transitional outdoor space.
Researchers [
40,
41] have indicated that the mean radiant temperature (Tmrt) has a stronger effect on thermal perception and the values of thermal indices (e.g., PET) than air temperature in an outdoor environment during the summer. That is, solar radiation and the level of shading at various locations play more important roles than air temperature and wind speed when calculating thermal indices. Therefore, although differences exist in atmospheric parameters between specific locations and their nearest weather station, the differences between thermal indices, as calculated by RayMan v1.2 for weather station data and field-measured data, are relatively small and can be discounted [
32]. Therefore, this study applied long-term climate data obtained from a weather station for subsequent calculations and analysis. Relative humidity and cloud cover are assumed to be the same as local weather data.
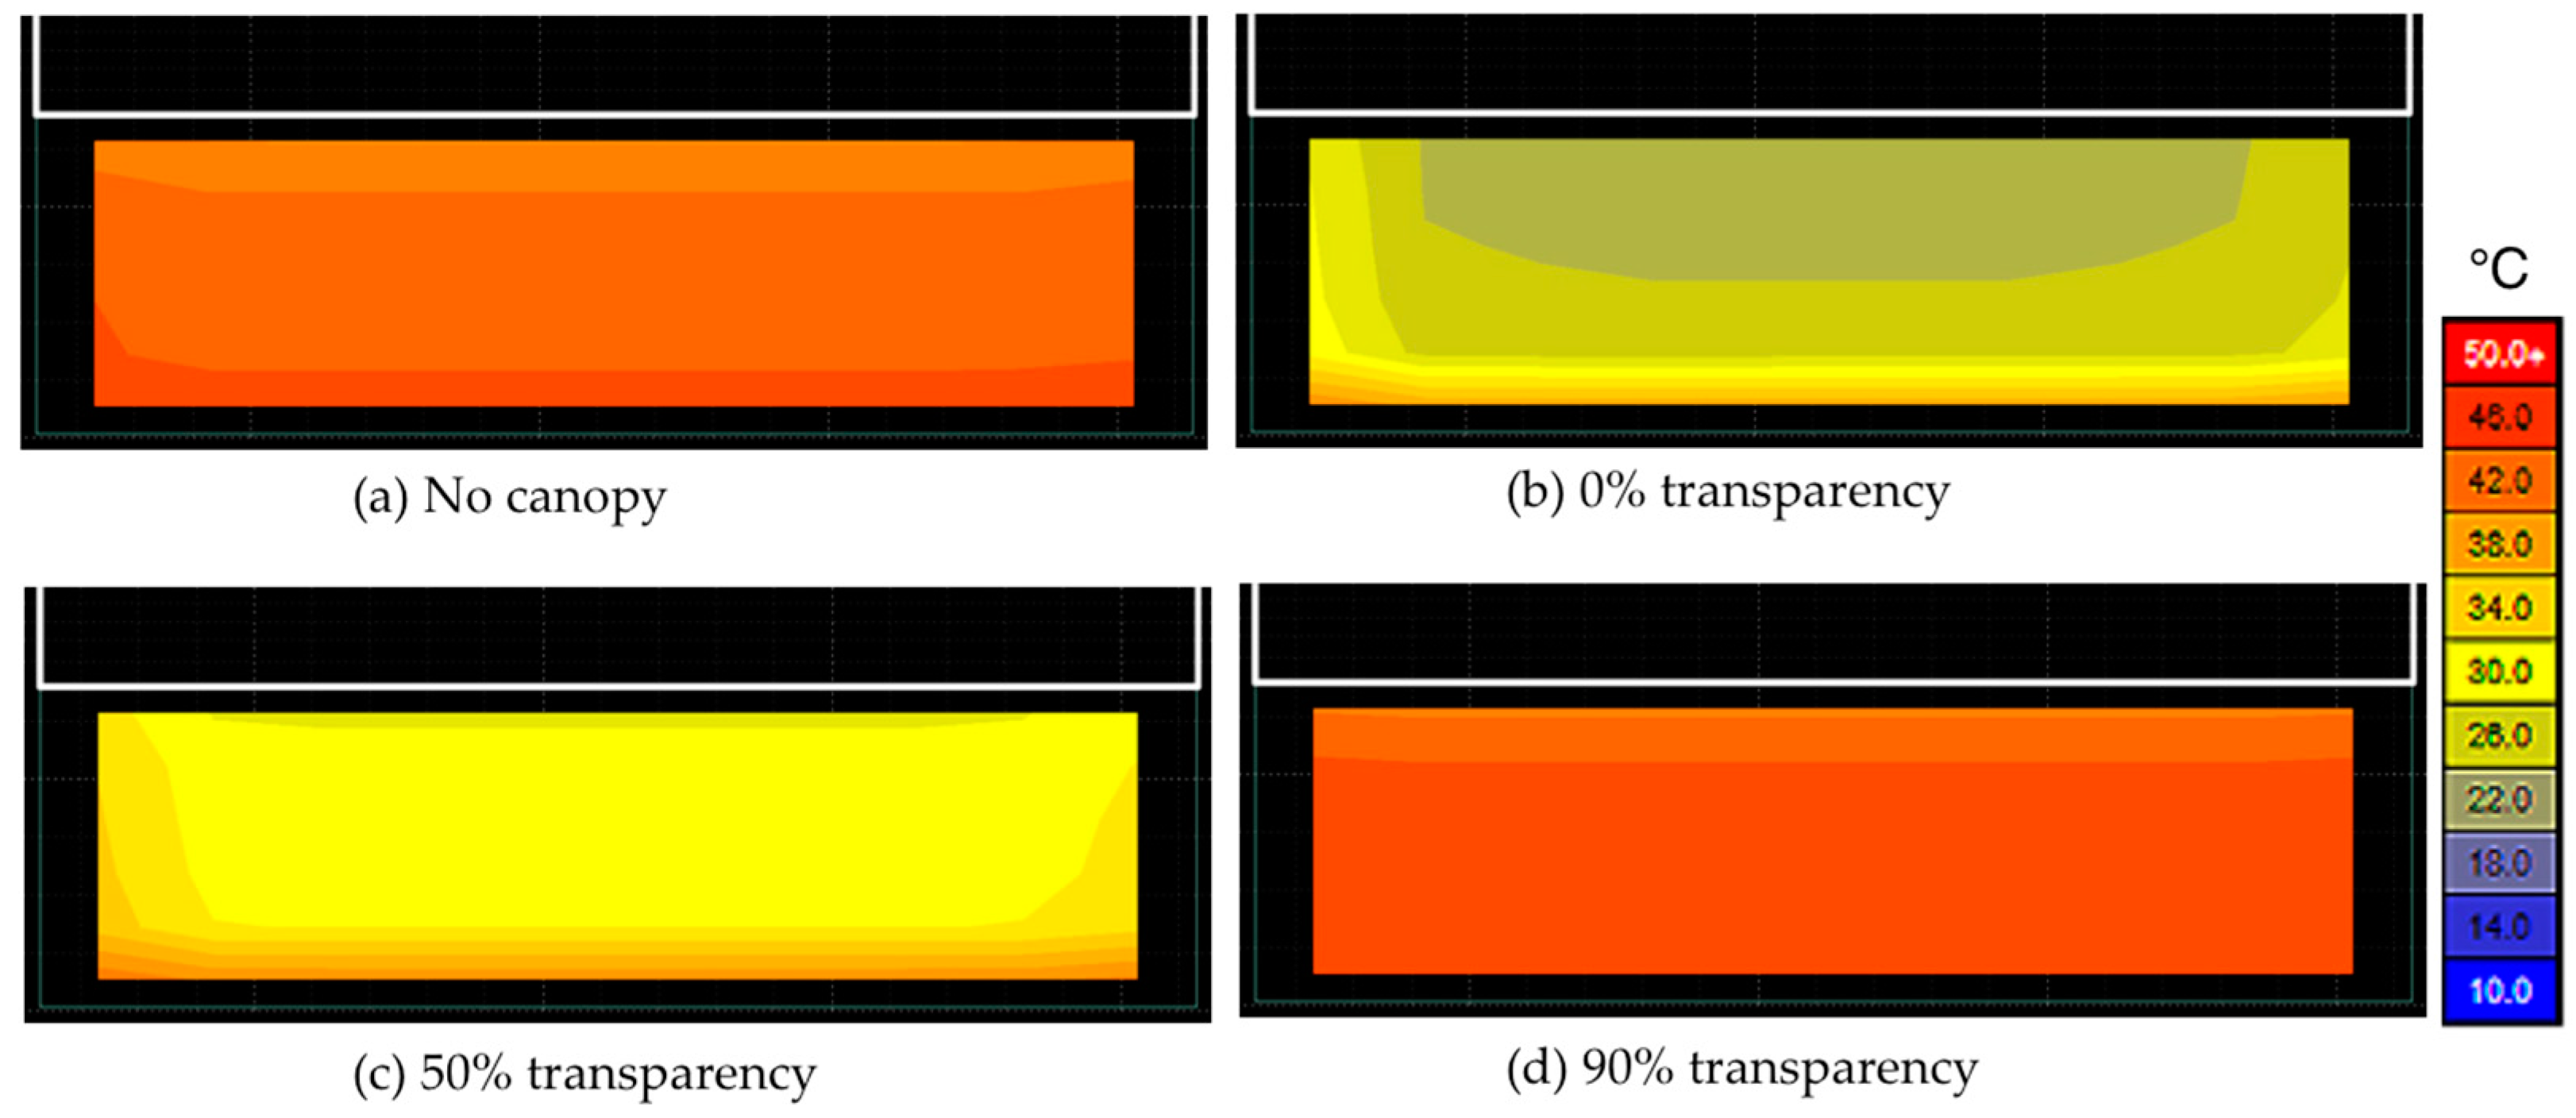
Simulations were conducted for four types of canopy: no canopy and canopies with transparencies of 0%, 50%, and 90%. Once PET comfort levels were calculated, the data was imported into Ecotect and visualised. The graphic displays of these calculations help in understanding the performance of a canopy in accordance with spatial variation. As an extreme case scenario applied in
Table 4, the PET levels at noon on 22 July, the sunniest day with a clear sky, fall in the range of between 28 °C (0% transparency canopy) and 47.2 °C (90% transparency canopy). In particular, the area shaded by a 90% transparency canopy reached 47.2 °C, which is thermally equivalent to
very hot, whilst the area shaded by a 0% transparency canopy remained at 28 °C, thermally equivalent to
slightly warm as illustrated in
Figure 4.
PET values change with increased or decreased wind speed on a typical summer or winter day, as seen in
Table 5.
An opaque canopy blocks incoming solar radiation, which dramatically increases thermal comfort in summer from 90% transparency to 0% transparency canopy; 47.2 °C decreases to 25.3 °C. If the wind increases from 0.25 m/s to 0.75 m/s, the PET falls to 22.7 °C, which makes pupils thermally comfortable. However, the change of PET in winter is small as there is insufficient incident solar radiation to increase pupils’ thermal perception. This shows that the PET comfort index is particularly affected by solar radiation as opposed to other environmental parameters. It is useful to examine this for different cities with varied climate conditions, which would have an impact on the outdoor environment.
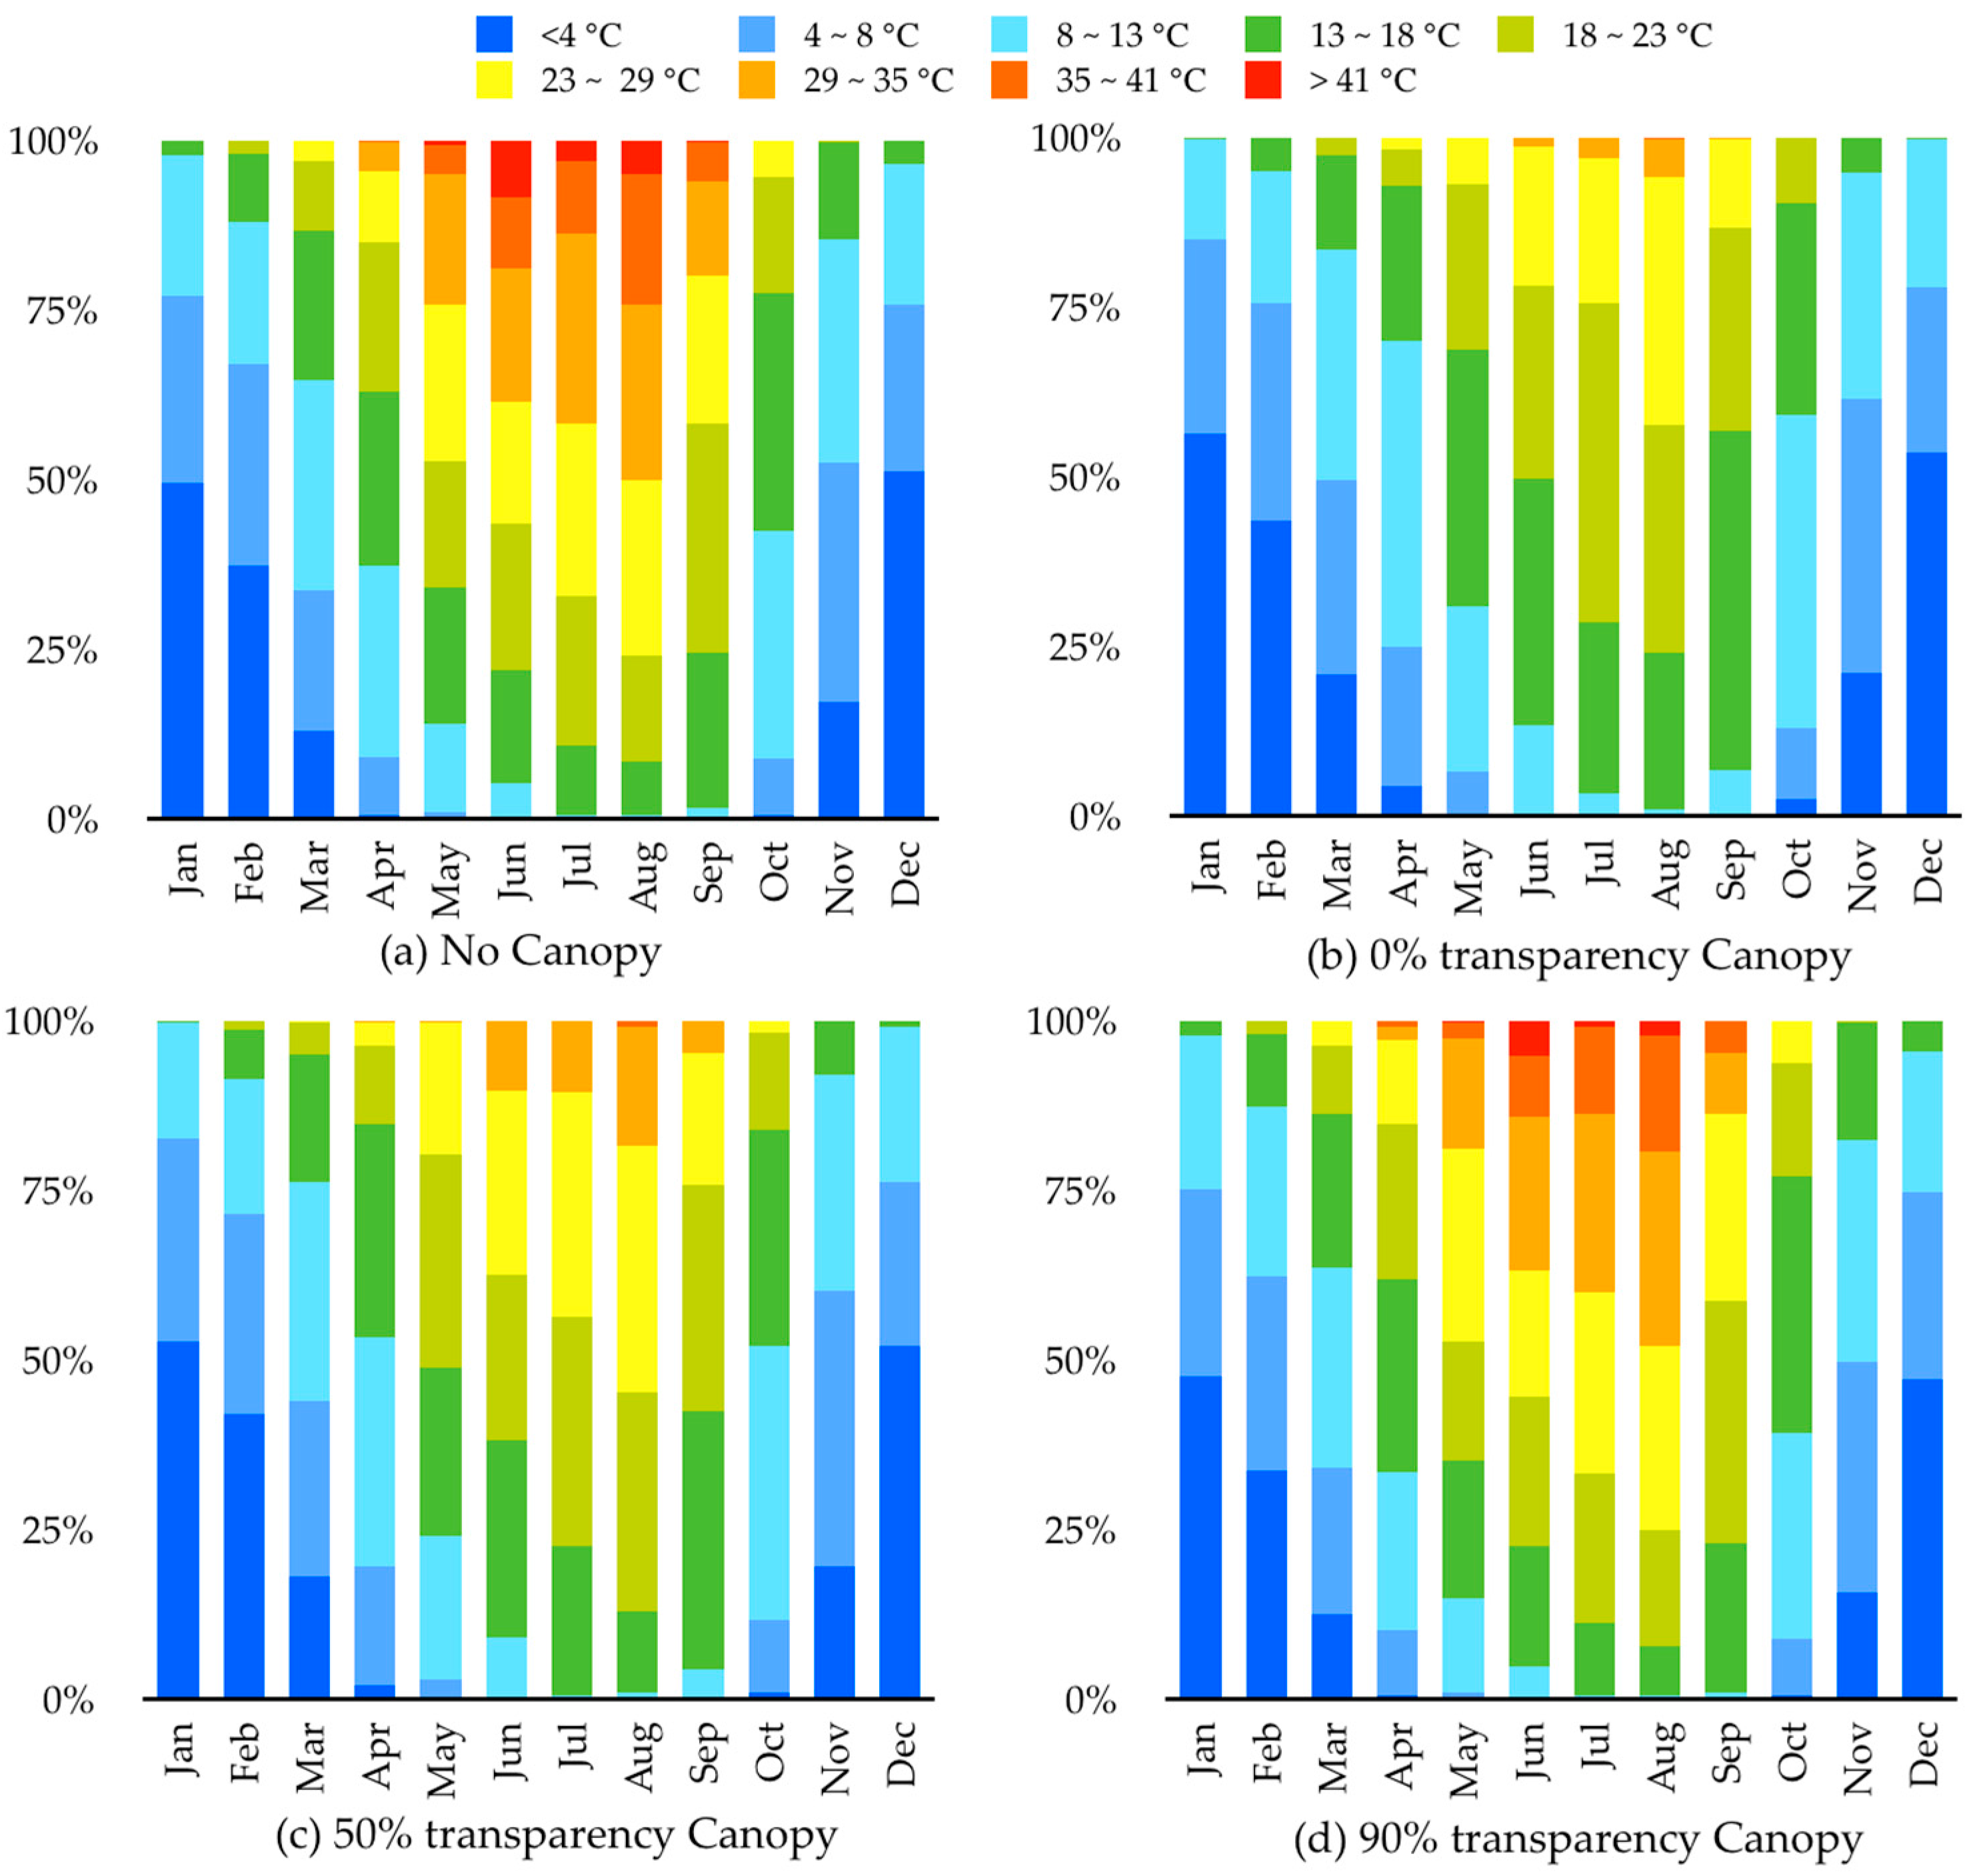
The frequency of thermal comfort in each month during school hours (09:00–16:00) as shown in
Figure 5. Column graphs display thermal comfort ranges in detail, with a nine-colour spectrum used to represent each thermal comfort band in the range of very cold (<4 °C) to very hot (>41 °C). These divided thermal comfort extents can be analysed efficiently for each month. The light green, dark green and yellow coloured areas represent the thermally comfortable frequency; PET values ranging between 13–29 °C relate to a perceived comfortable temperature of slightly cool to slightly warm. The light green areas represent the neutral temperatures, neither hot nor cold; comfortable temperatures are found between 18–23 °C, which corresponds to PMV = 0. Above 29 °C, temperatures are represented by colours of orange to red to show thermally warm, hot and very hot. In contrast, light and dark blue colours represent temperatures that thermally ranged below 13 °C, cool to very cold. From the simulation of conditions in London, use of a 0% transparency canopy would provide comfort in 93.5% of daytime hours in July. Also, use of a canopy with 90% transparency would only provide comfort in 59.4% of daytime hours and 57.6% of daytime hours would be comfortable if no canopy were used, as seen in
Figure 5.
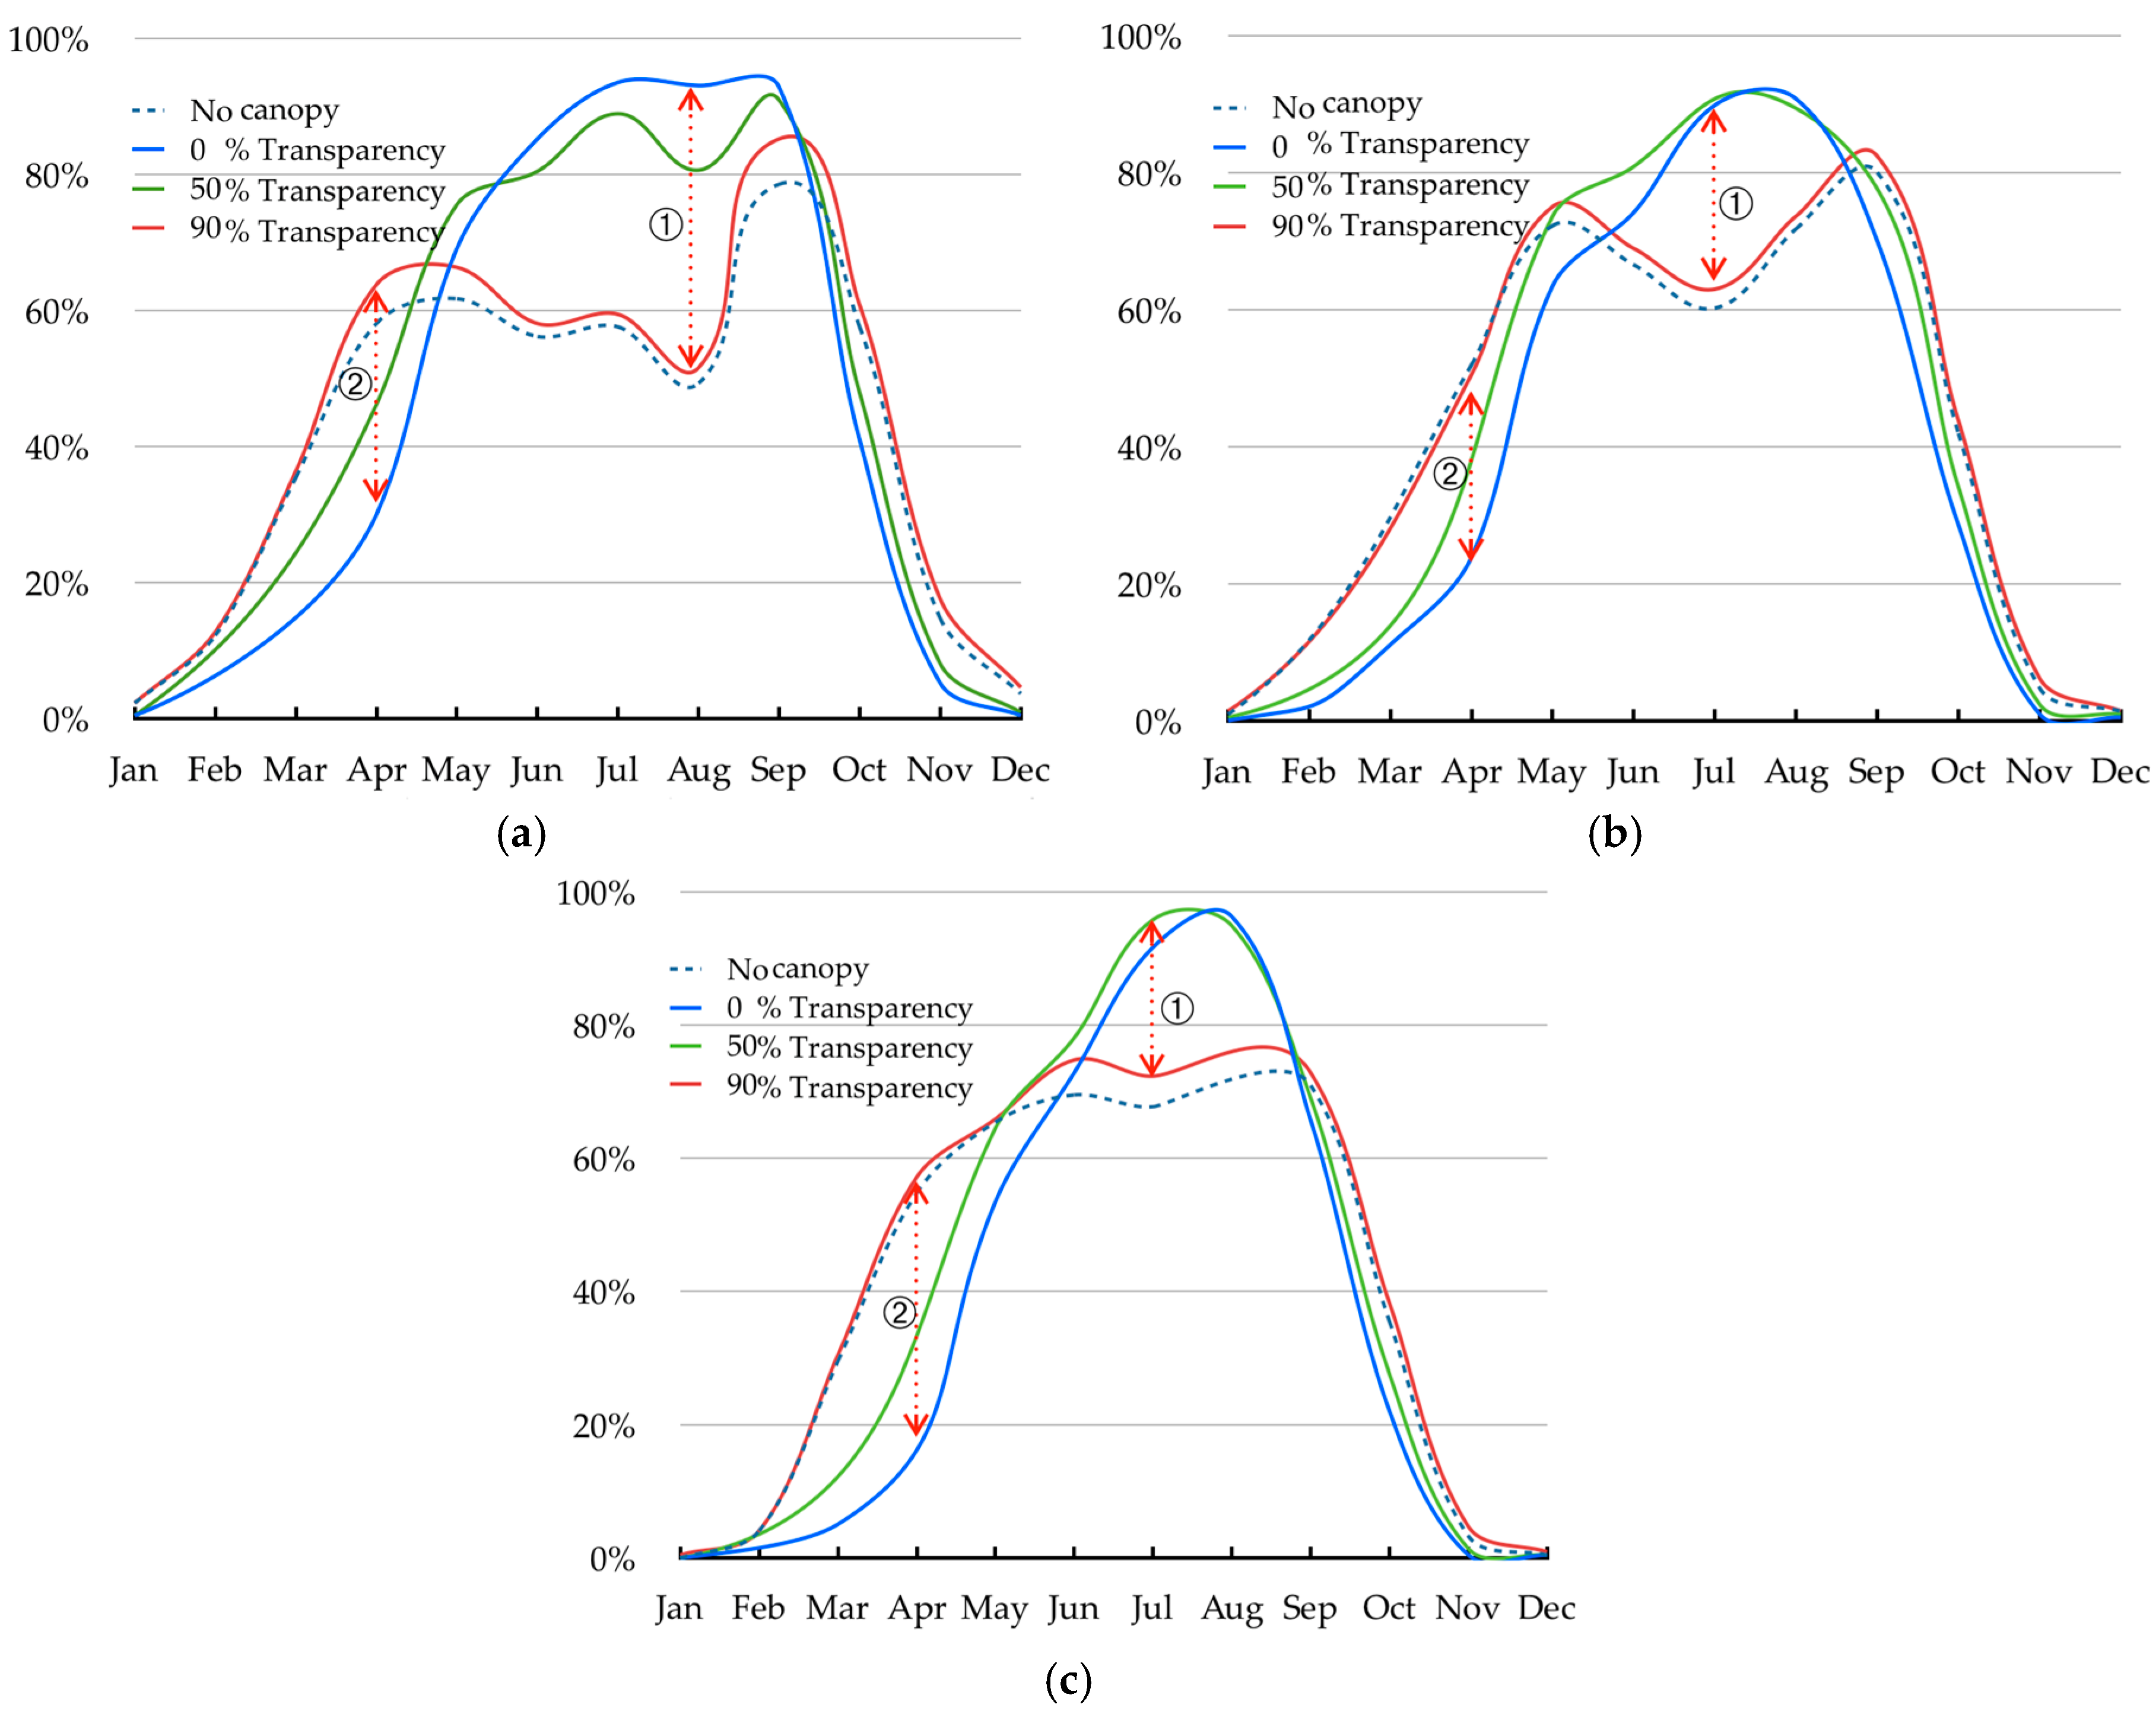
Monthly PETs are calculated for a south orientation and shown for each city in
Figure 6, (a) for London, (b) for Manchester and (c) for Glasgow. The monthly thermal comfort frequency (
Figure 6) shows thermal comfort ranges over the whole year during the daytime (09:00–16:00), revealing that ranges of PET temperature between 13–29 °C are equivalent to thermal perceptions of slightly cool (13 °C) and slightly warm (29 °C). The simulations that suggest using higher transparencies of the canopy should be considered carefully, mainly because of the thermal discomfort that can arise in summer.
From the point of view of using the outdoor space, using 50% transparency canopy can provide the most comfortable outdoor space as 46.3% hours during daytime (09:00–16:00) were in the comfortable range with this canopy in London. Other transparencies of canopy also show similar performance such as 44.6% with 0% transparency and 43.4% with 90% transparency of canopy. This clearly showed that seasonal variations in thermal comfort within the transitional outdoor space changed with different canopy transparencies in all the cities. Even though the school summer holidays fall mainly in August, the most problematic period, there can be thermal discomfort between May and July if a canopy with 90% transparency of canopy is utilised. In winter, a canopy with a higher transparency would lead to a greater number of thermally comfortable hours than one with a lower transparency, though the difference would be less than in summer since there is a relative scarcity of solar radiation in the UK during that period.
The sum of thermal comfort frequency in
Table 6 in each month shows that in London maximum enhancement of thermal comfort to ➀ 41.5% growth in August can be achieved by using a canopy with 0% transparency as opposed to a canopy with 90% transparency, and to ➁ 33.8% increase in April by using a canopy with 90% transparency as opposed to a canopy of 0% transparency.
In Manchester, maximum enhancement of thermal comfort to ➀ 27.7% improvement in July can be achieved by using a canopy of 50% transparency rather than of 90% transparency and ➁ 26.7% enhancement in April by using a canopy of 90% transparency rather than of 0% transparency canopy, while in Glasgow maximum enhancement of thermal comfort to ➀ 23.5% in July can be achieved with a canopy of 50% transparency rather than 90% transparency and to ➁ 40.9% increase in April with a canopy of 90% transparency rather than one of 0% transparency.
Findings are summarised as follows.
It is difficult to achieve outdoor thermal comfort during school hours in January, February, November and December in all of the cities studied;
Though it is not possible to provide temperatures that reach the thermal comfort temperature threshold from January to February by using a canopy of any transparency, use of a canopy of 90% transparency will produce PET values of around 3.5 °C higher than those achieved using an opaque canopy at noon in February in London;
In April, use of a canopy of 90% transparency allows thermal comfort to be achieved during most of the school day. However, canopies of other transparencies lead to a value mostly below 13 °C, the minimum thermally comfortable temperature;
During the summer term from late April through to the middle of July, outdoor thermal comfort can be achieved during the school day with most canopies, with the exception of the canopy of 90% transparency at around noon in June and July;
A canopy of 50% transparency showed the best performance across a range of thermal comfort values between 18–23 °C during the summer term;
School summer holidays are normally 6 weeks from the middle of July until the end of August, thus allowing the school to avoid the highest amount of solar radiation of the year. However, if school premises are used for extended education for the general community during this period, use of an opaque canopy is preferable to keep solar radiation from reaching the ground;
Outdoor thermal comfort levels drop quickly in October but the use of a canopy of 90% transparency will allow temperatures above 13 °C to be maintained over most of the school day;
The period from December to February is the most difficult period in which to keep the temperature of an outdoor space high enough, as thermal temperatures range between only 2.8–7.6 °C at noon each month, giving a thermal perception of “very cold” to “cold”.
If it is not possible to vary the transparency of the canopy used, teachers can achieve better outdoor comfort by changing the time patterns of use of the outdoor spaces. For instance, in the summer term, they could encourage pupils to use the space in the early morning or late afternoon instead of using it as an outdoor classroom in the middle of the day. Conversely, during the spring and winter terms, the outdoor classroom might be most comfortable at around noon when solar radiation is at its peak.
Outdoor thermal comfort simulations are extended to different orientations and other cities using typical climate data for each area.
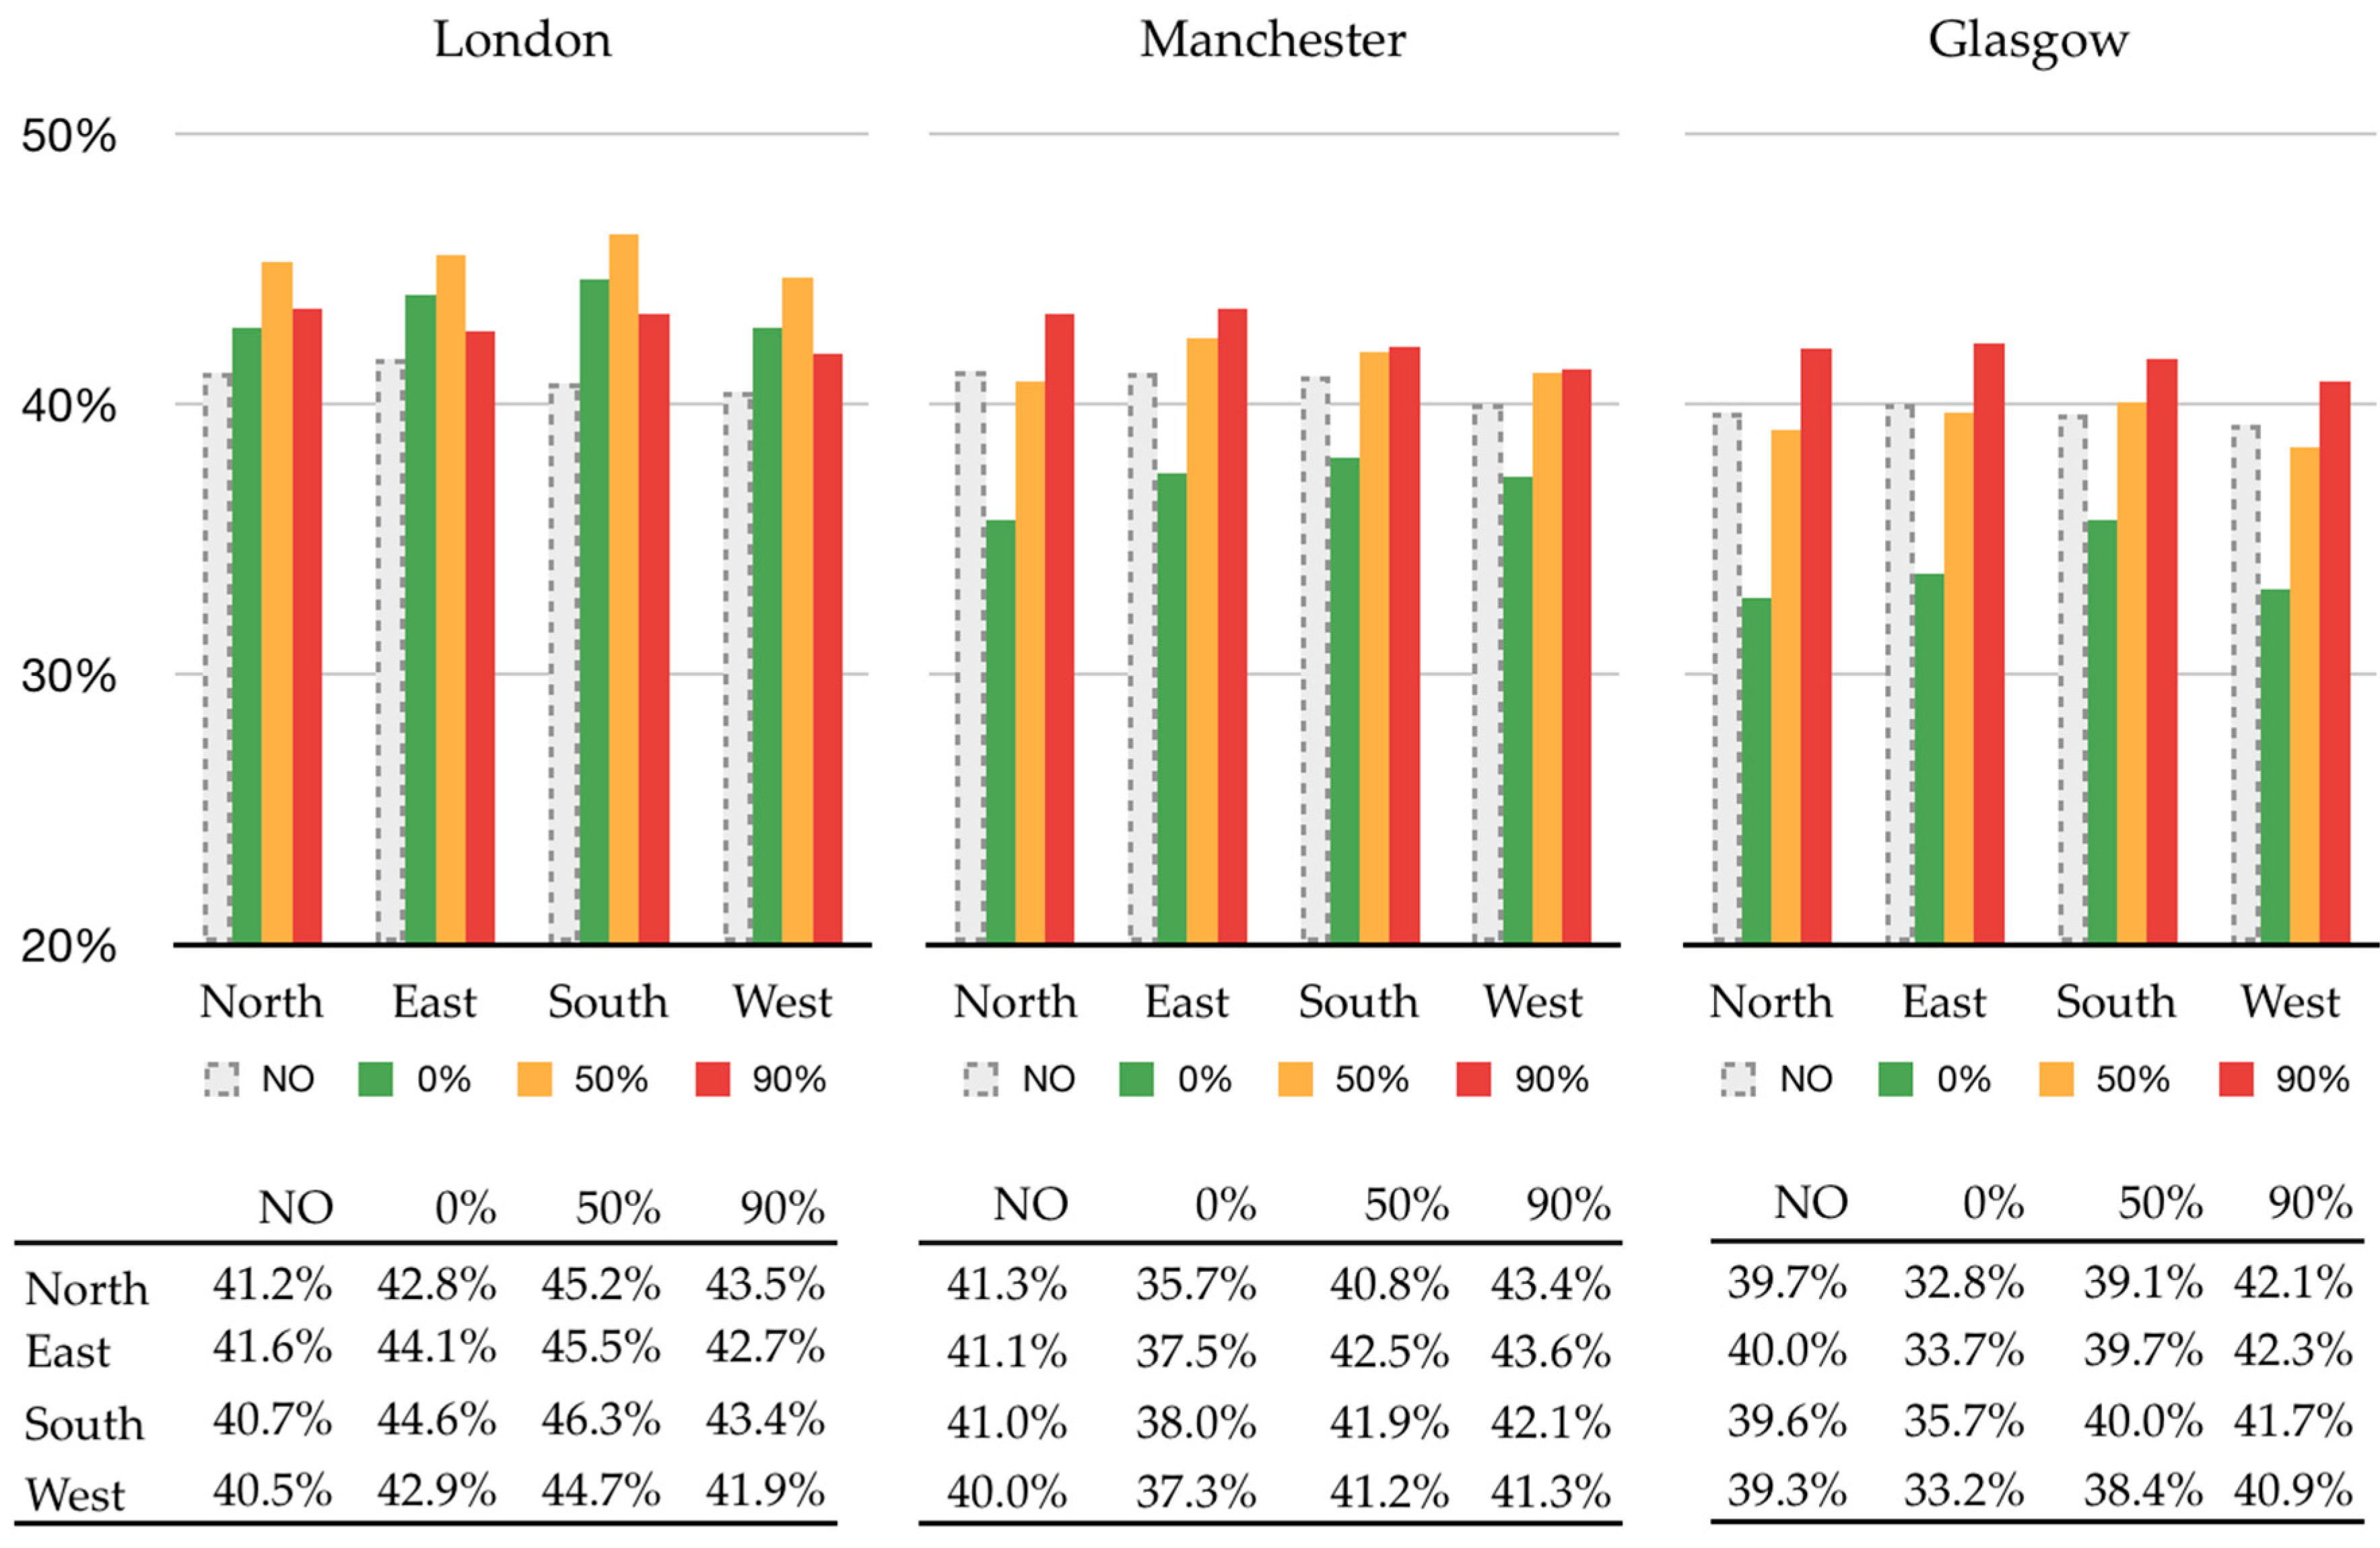
Figure 7 has been generated to show annual thermal comfort in the transitional outdoor space for each of four installation orientations (east, south, west and north) for three main cities; London, Manchester, Glasgow. It provides an overview of how much thermal comfort falls annually within the range of between 13–29 °C, using the PET index for outdoor thermal comfort.
When no canopy is provided, there is little difference between orientations for outdoor thermal comfort, whilst once a canopy is applied, thermal comfort achievement varies greatly depending on orientations and transparency;
Thermal comfort using 0% transparency canopy (green bar) becomes lower in higher latitudes, mainly due to reduced solar radiation;
Performance of a 0% transparency (green bar) canopy facing south in London is particularly noticeable; improving thermal comfort by 6.6% and 8.9% compared with Manchester and Glasgow respectively;
A 50% transparency canopy (orange bar) shows mostly good results for all orientations in all three cities. Only a 0% transparency canopy oriented south or east in London represents slightly better performance, because incident solar radiation is higher than when oriented to north or west;
The higher the latitude of the city, the higher the transparency of canopy is needed in order to maximise outdoor thermal comfort;
Installation of a canopy with any transparency is shown to provide better overall outdoor comfort than can be achieved without a canopy for all orientations, with the exception of a 0% transparency canopy in Manchester and Glasgow. Those cases show worse performance when using an opaque canopy because of the lack of solar radiation reduced by high latitudes.
More specific findings for each of the cities are as follows:
London
Where no canopy is provided, orientation to north or east can provide slightly better outdoor comfort than orientation to the south or west as south and west orientations are subject to relatively high amounts of solar radiation;
The simulation shows that a 50% transparency canopy provides the best performance in all directions. Overall, canopies with transparencies of 50% or less should be recommended for use in London. Using a canopy of 90% transparency provides little improvement (in the range of 2.4–2.9%) regardless of orientation compared with no provision of a canopy, according to the simulation;
For south-facing outdoor spaces, the provision of a canopy of 50% transparency in particular shows around 6% improvement in outdoor comfort compared with situations where no canopy is provided; 6% is equivalent to around 83.7 h (12 days) during school terms.
Manchester
A 90% transparency canopy displays the best performance for all orientations of the outdoor space. When space faces north, using a 90% transparency canopy provides more than 4.1% (59.4 h) improvement in the provision of outdoor comfort than in the case where a 0% transparency canopy is provided;
A 0% transparency canopy also shows comparatively poor thermal comfort performance for transitional spaces in all directions, even worse than without a canopy. When the outdoor space faces north using an opaque canopy, thermal comfort performance is poor, which indicates that opaque and low transparency canopies should be avoided in higher latitudes;
A 90% transparency of canopy provides the best improvement (a range of 4.0–7.7%, equivalent to 58–112 h) in comparison to a situation where 0% transparency canopy is provided;
Canopies of 90% transparency can be used to prolong outdoor comfort for outdoor spaces facing north or east, while both 50% and 90% transparency canopies are appropriate for spaces with orientations to south or west;
Glasgow
Overall, outdoor comfort levels are slightly lower than in other cities as there is a relatively long winter period, during which outdoor thermal comfort is difficult to achieve;
A canopy of 90% transparency is the most appropriate choice regardless of the orientation of the outdoor space, providing an improvement in thermally comfortable occupancy in the range of 40.9–42.3% (593–613 h).
Transitional outdoor spaces oriented north and east also show good performances of around 42% thermal comfort frequency with 90% transparency canopy. In general, high transparencies (above 50%) of canopy show better results than low transparencies in all directions.


