
Assessing the Availability of Terrestrial Biotic Materials in Product Systems (BIRD)


Abstract
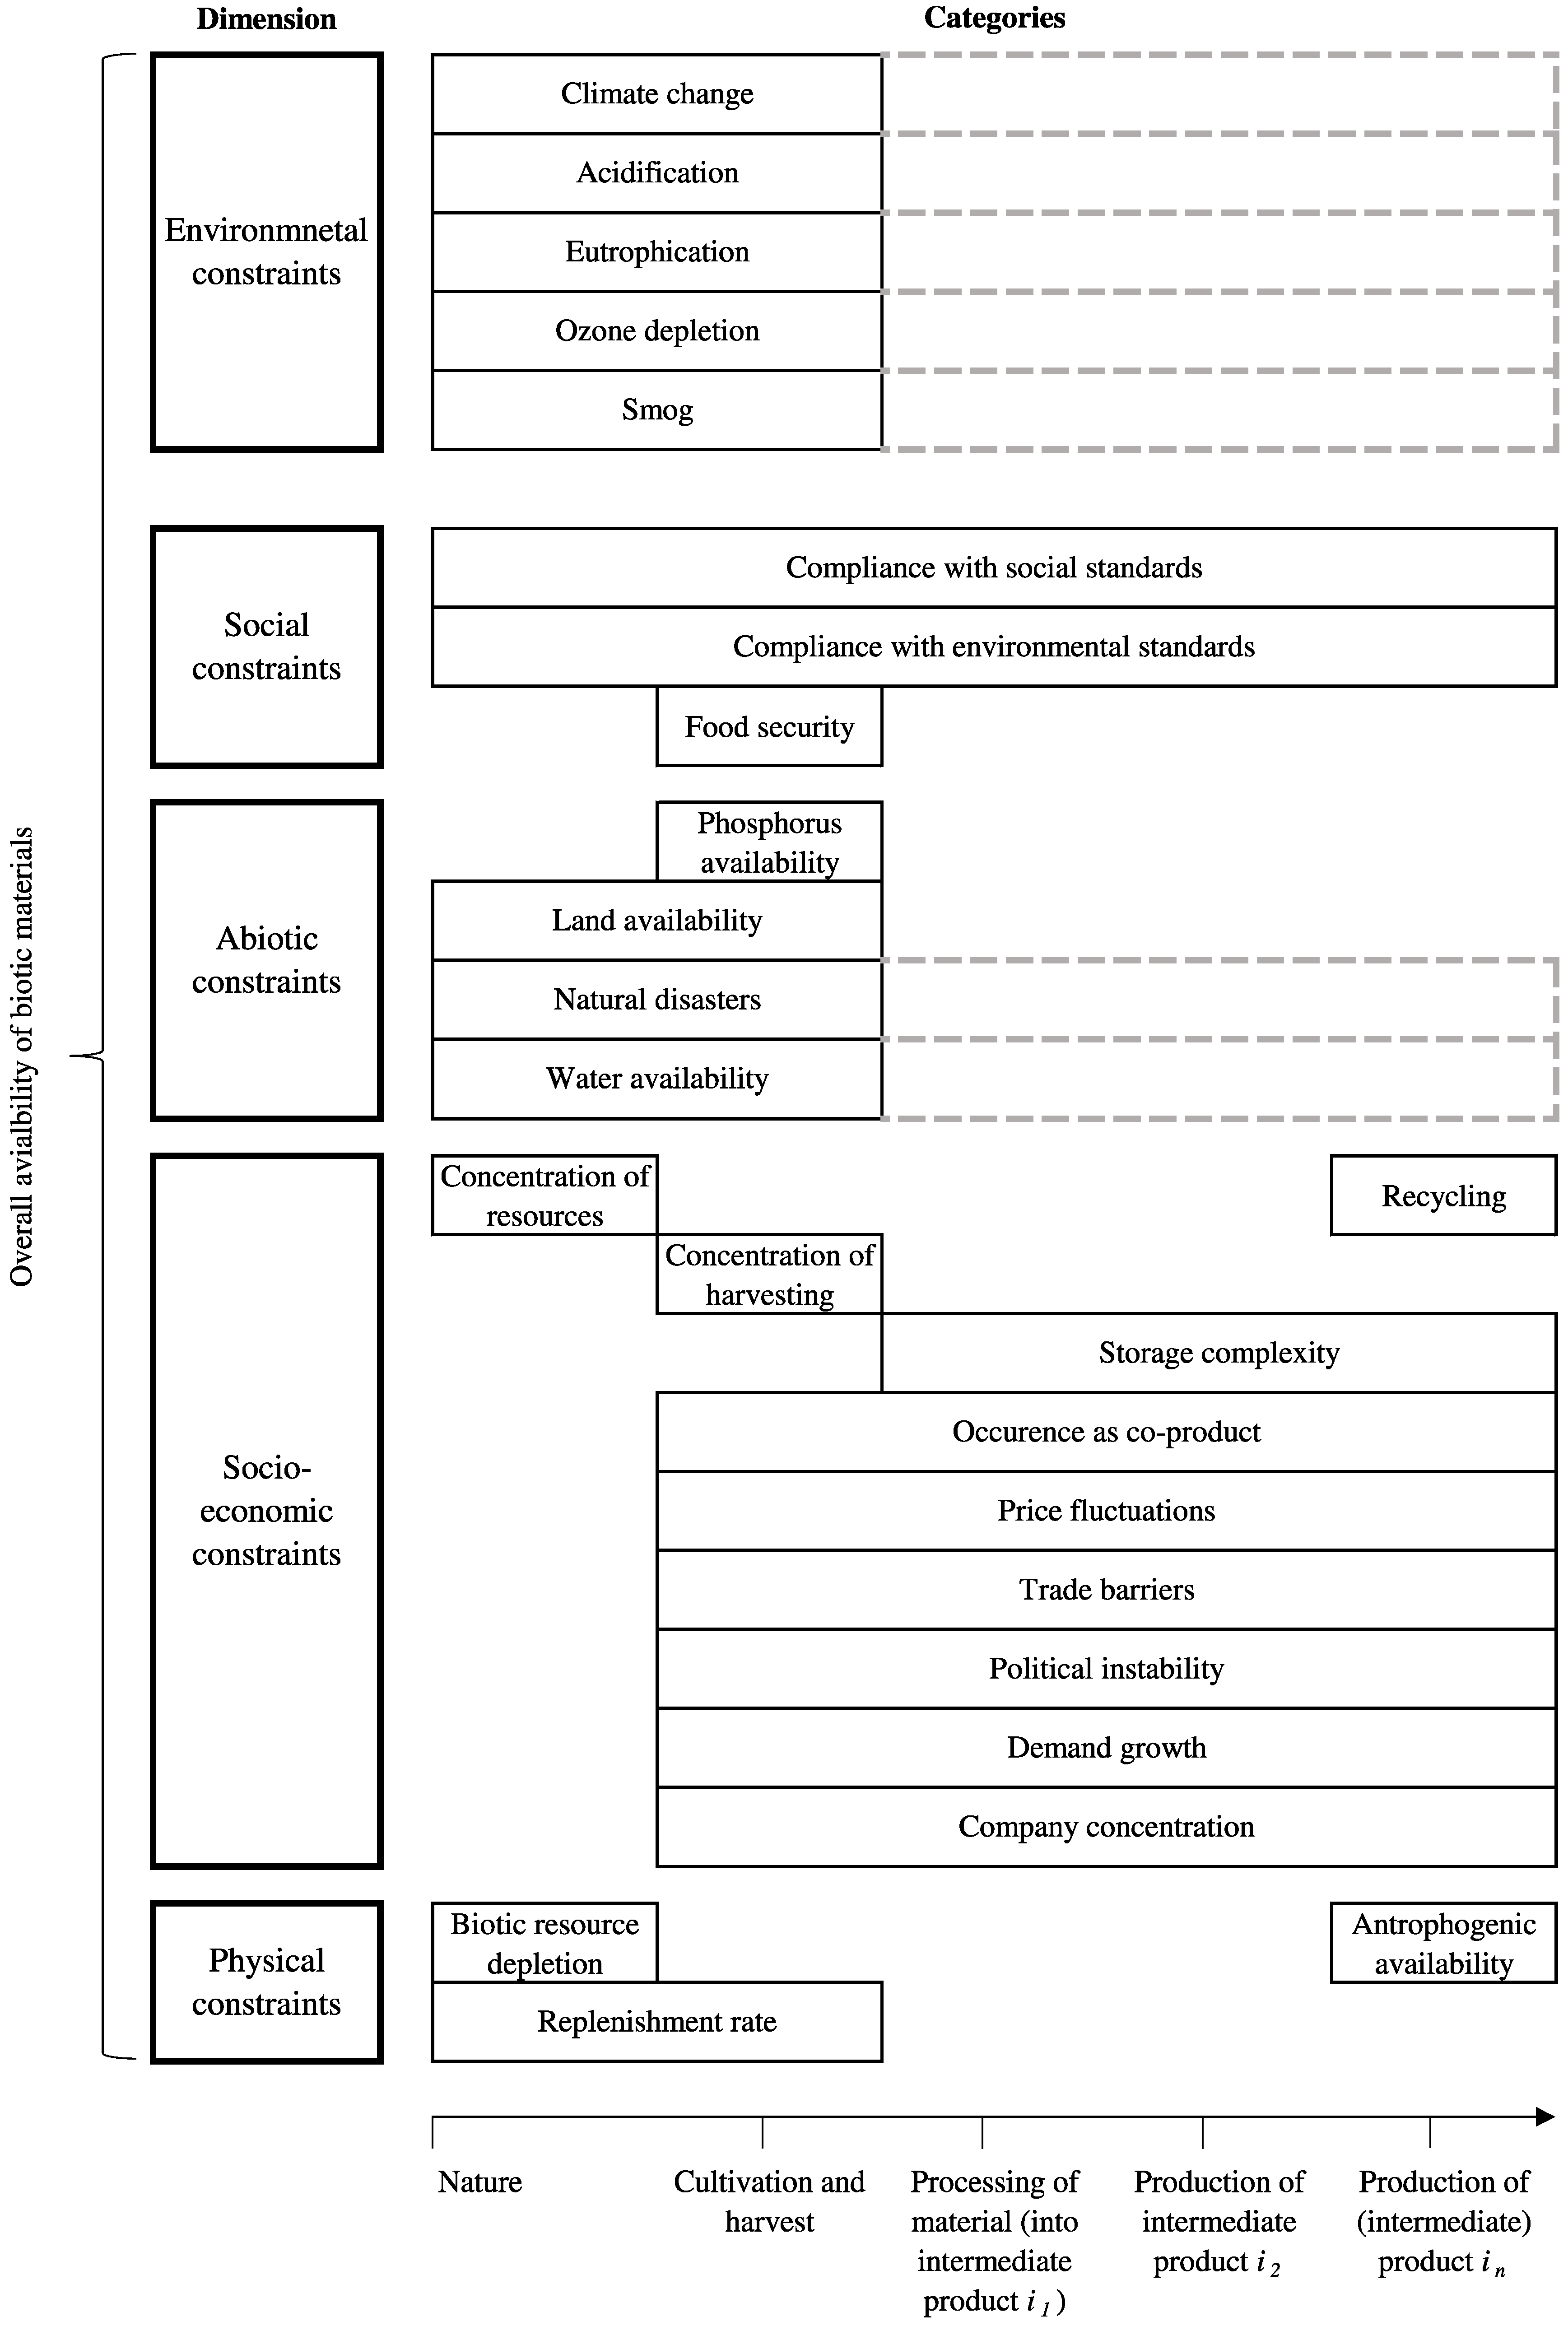
:1. Introduction
- physical constraints
- socio-economic constraints
- abiotic constraints
- social constraints and
- environmental constraints
2. BIRD Method
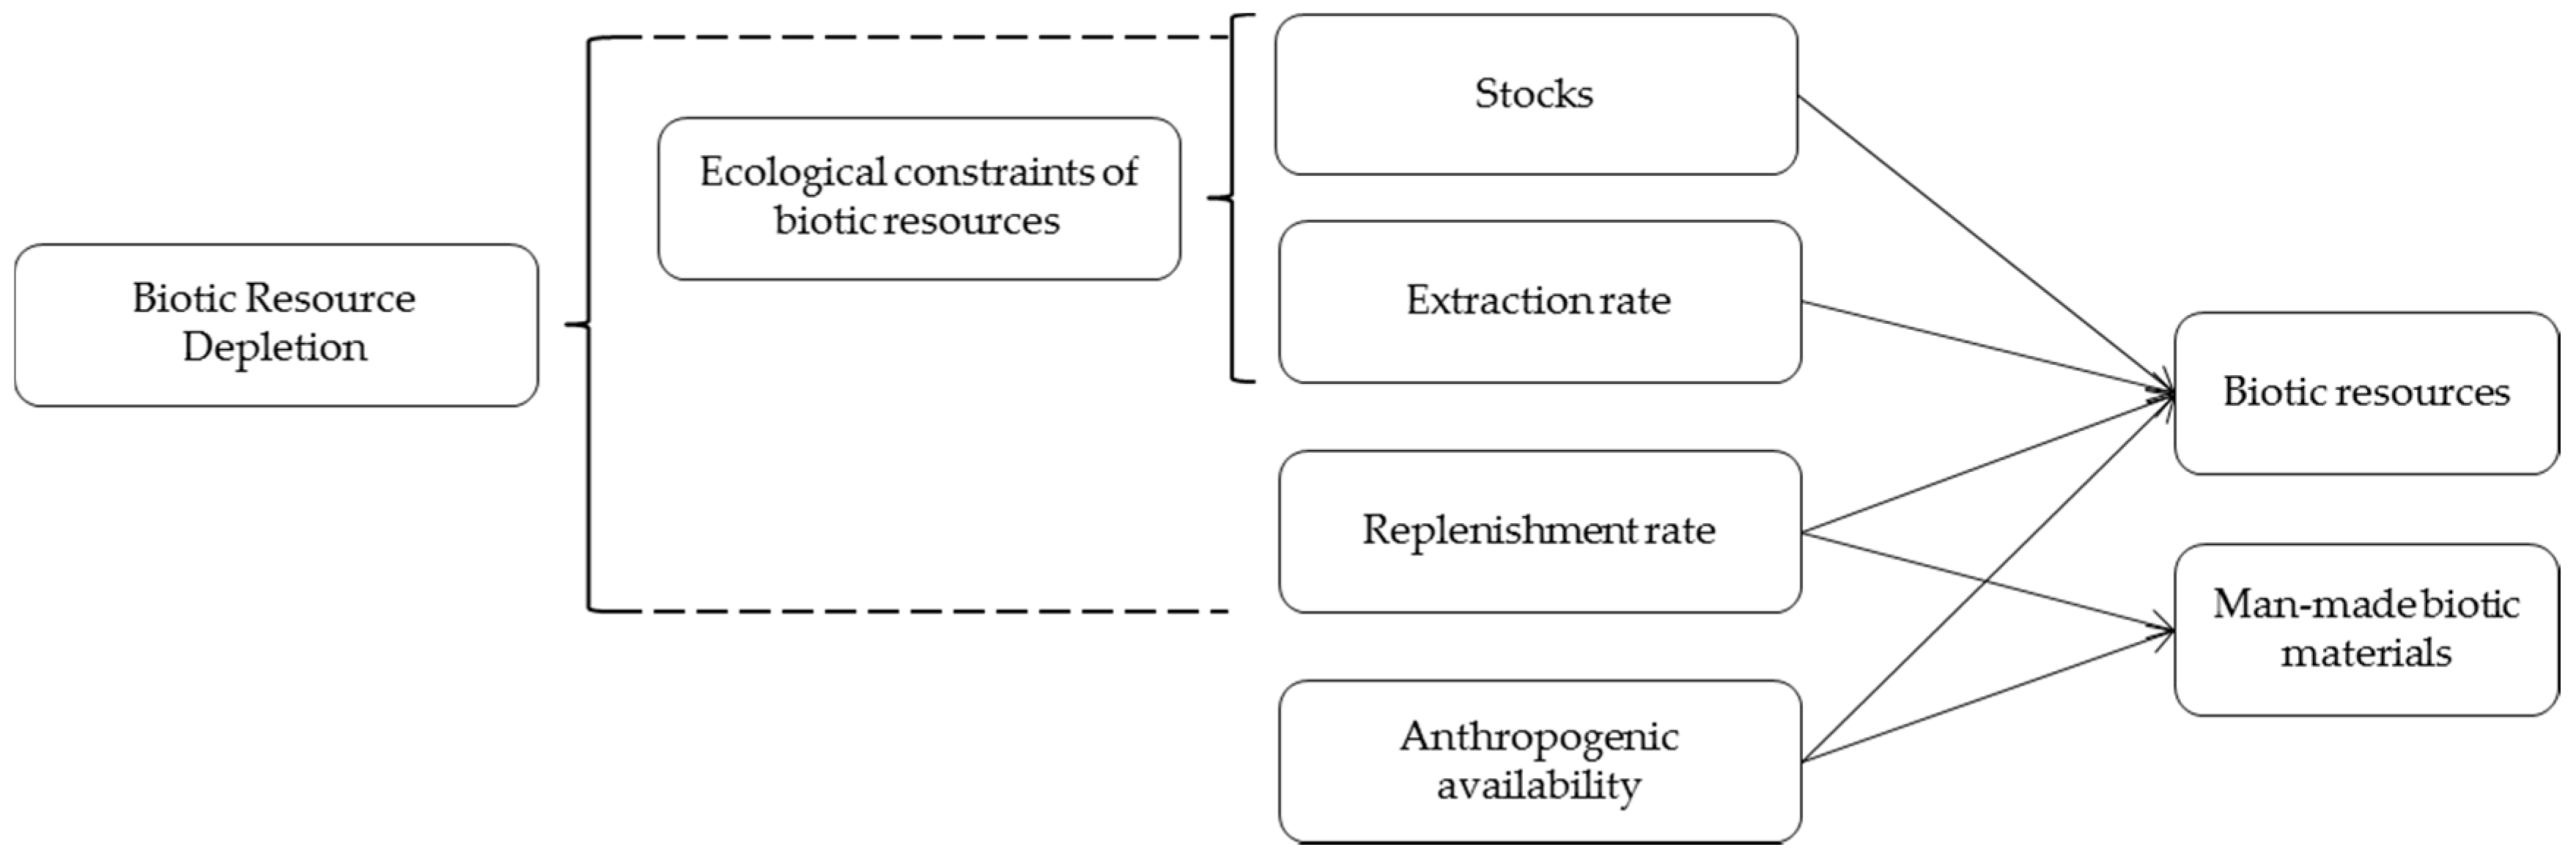
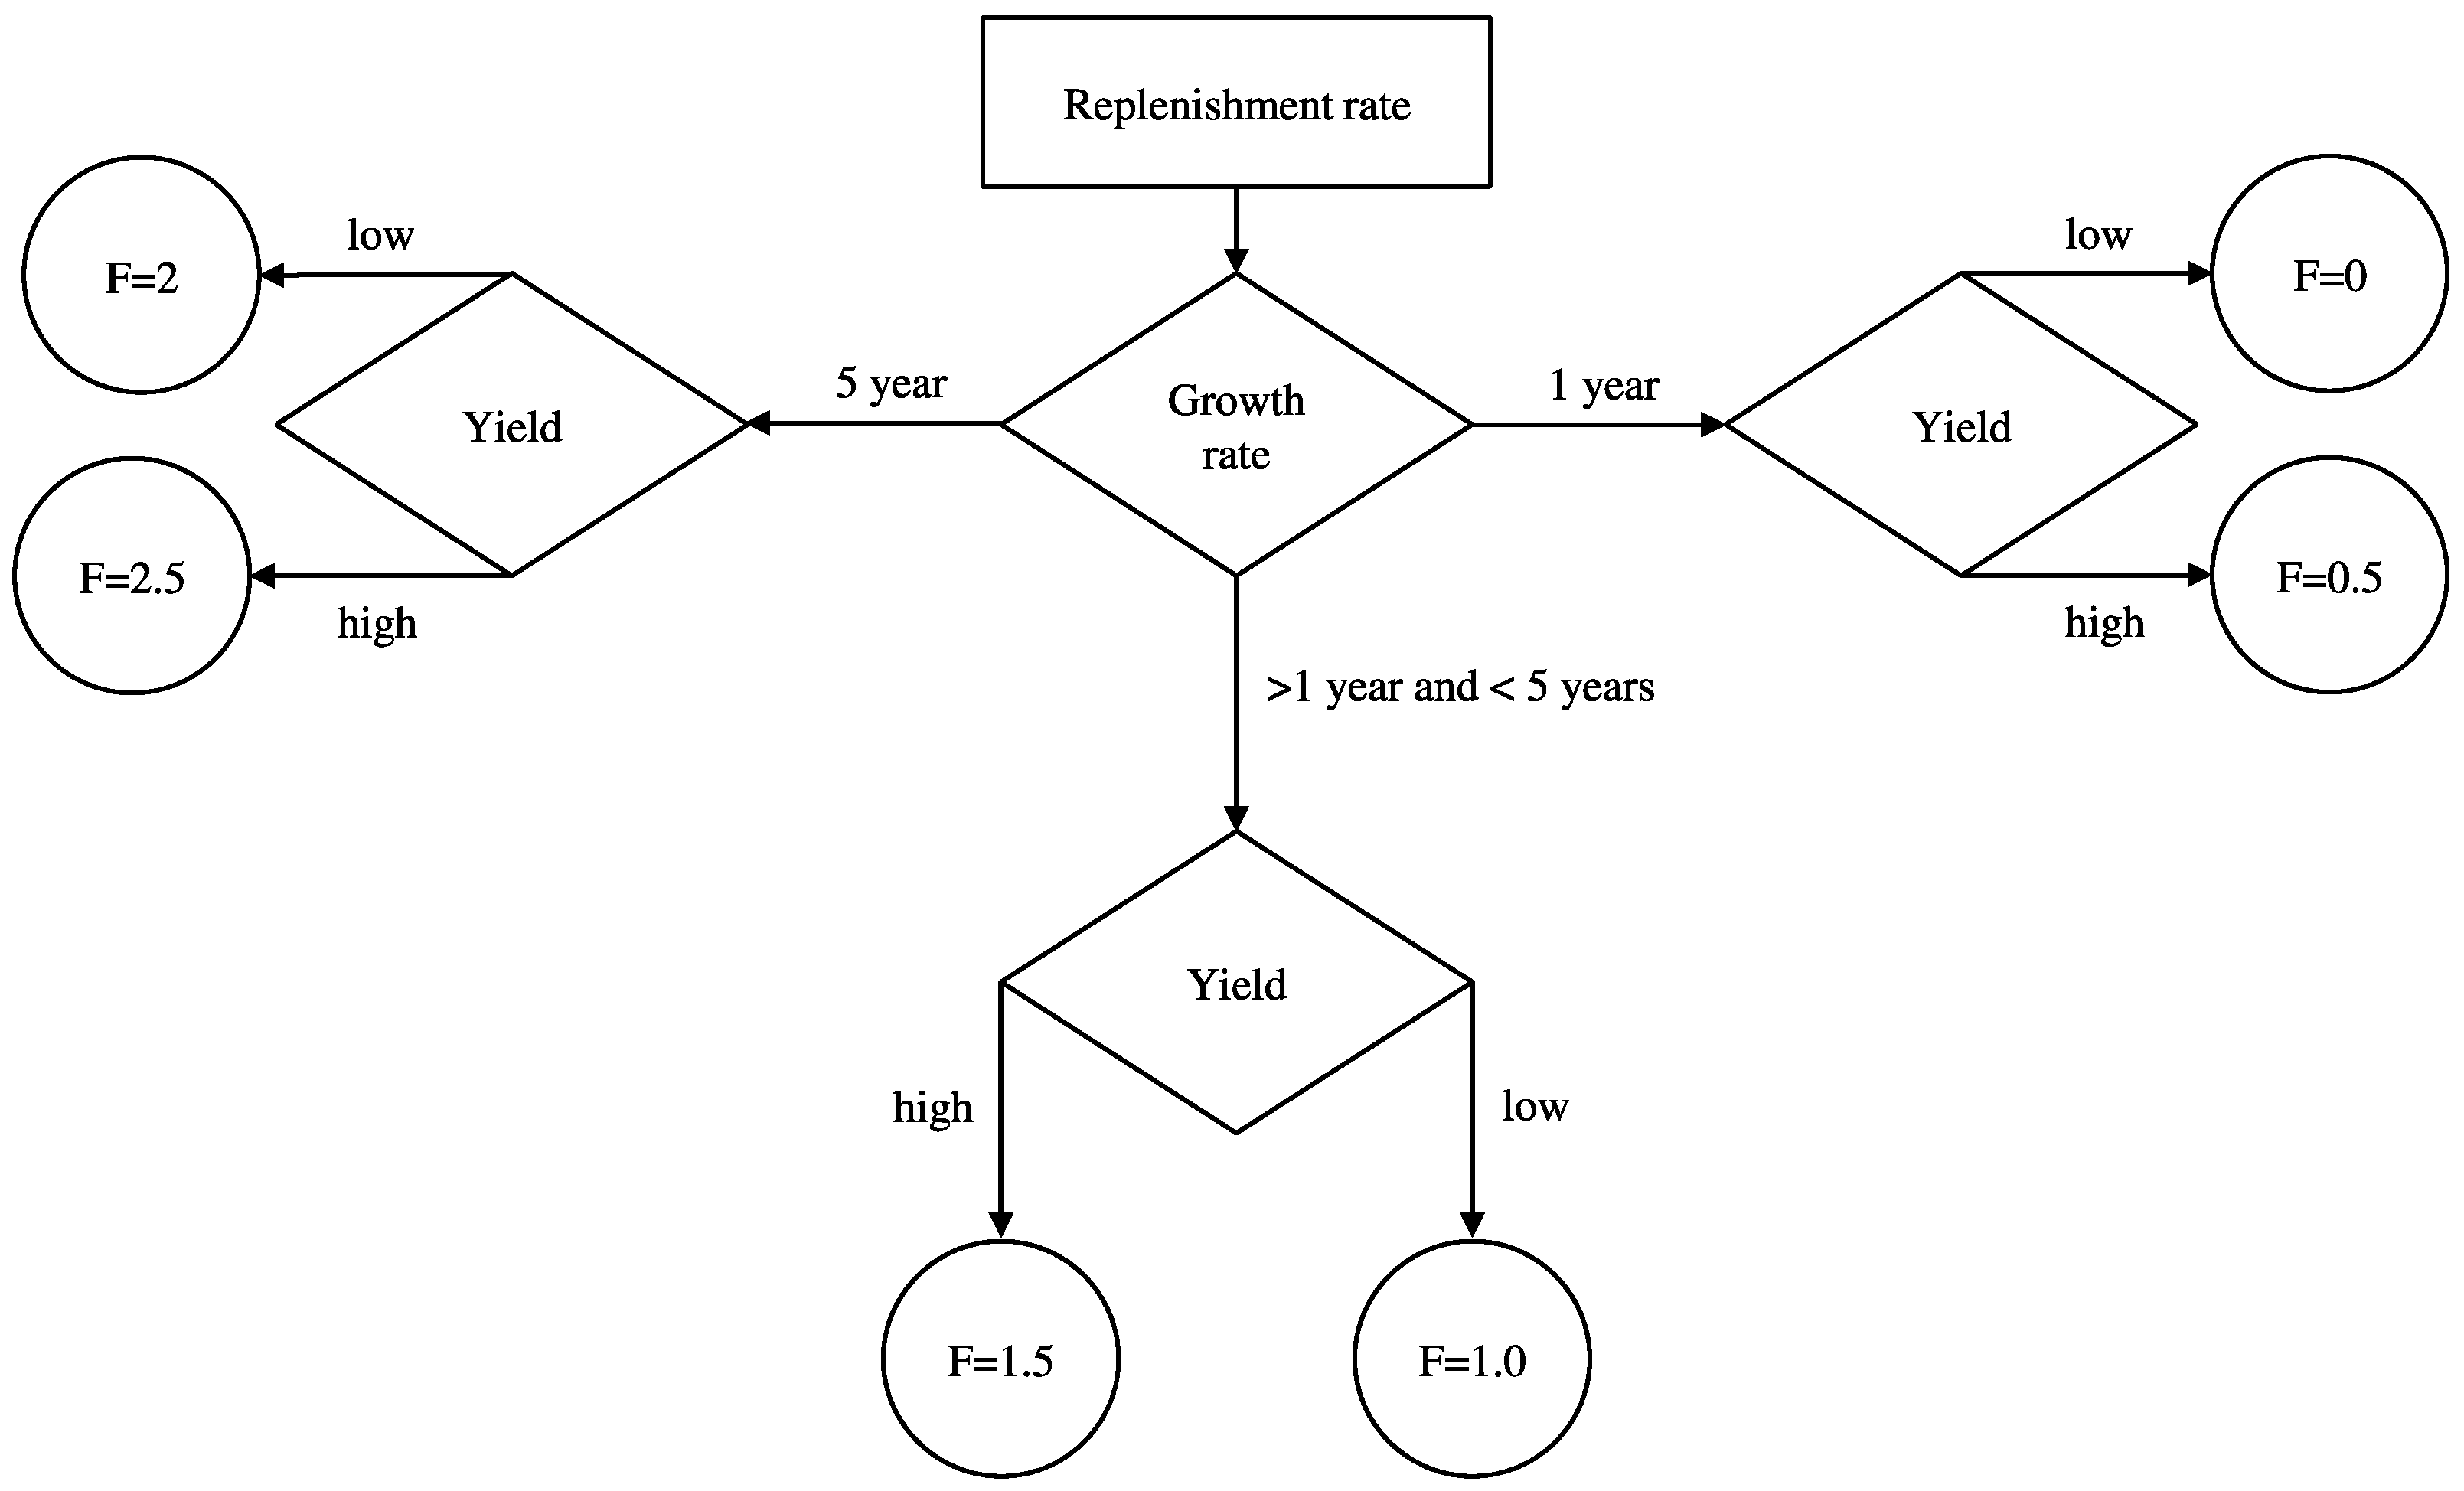
2.1. Physical Constraints
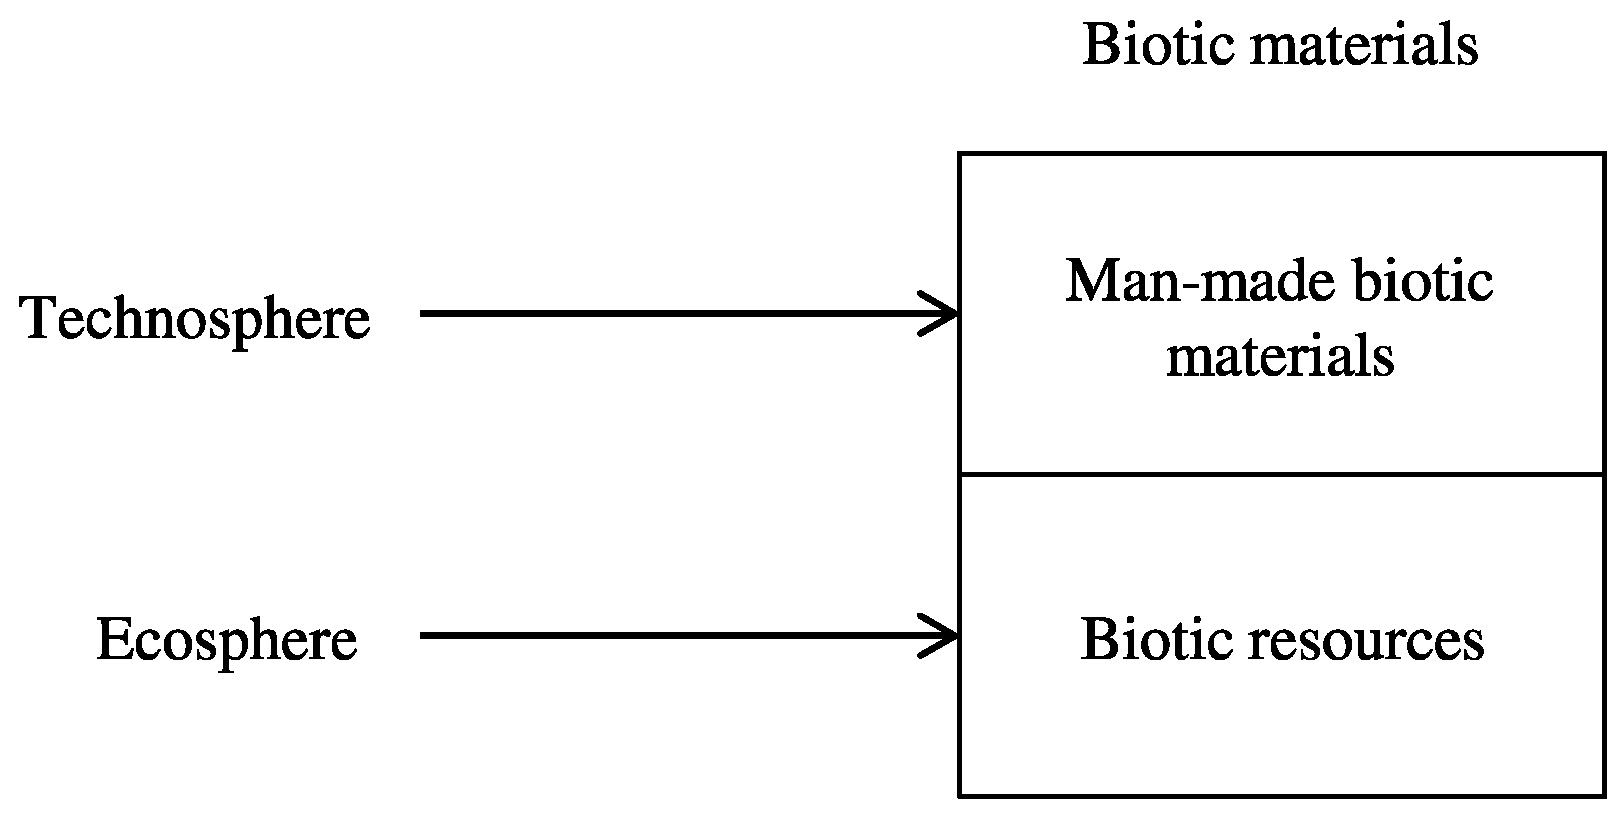
2.1.1. Biotic Resources
2.1.2. Man-Made Biotic Materials
2.1.3. Biotic Materials
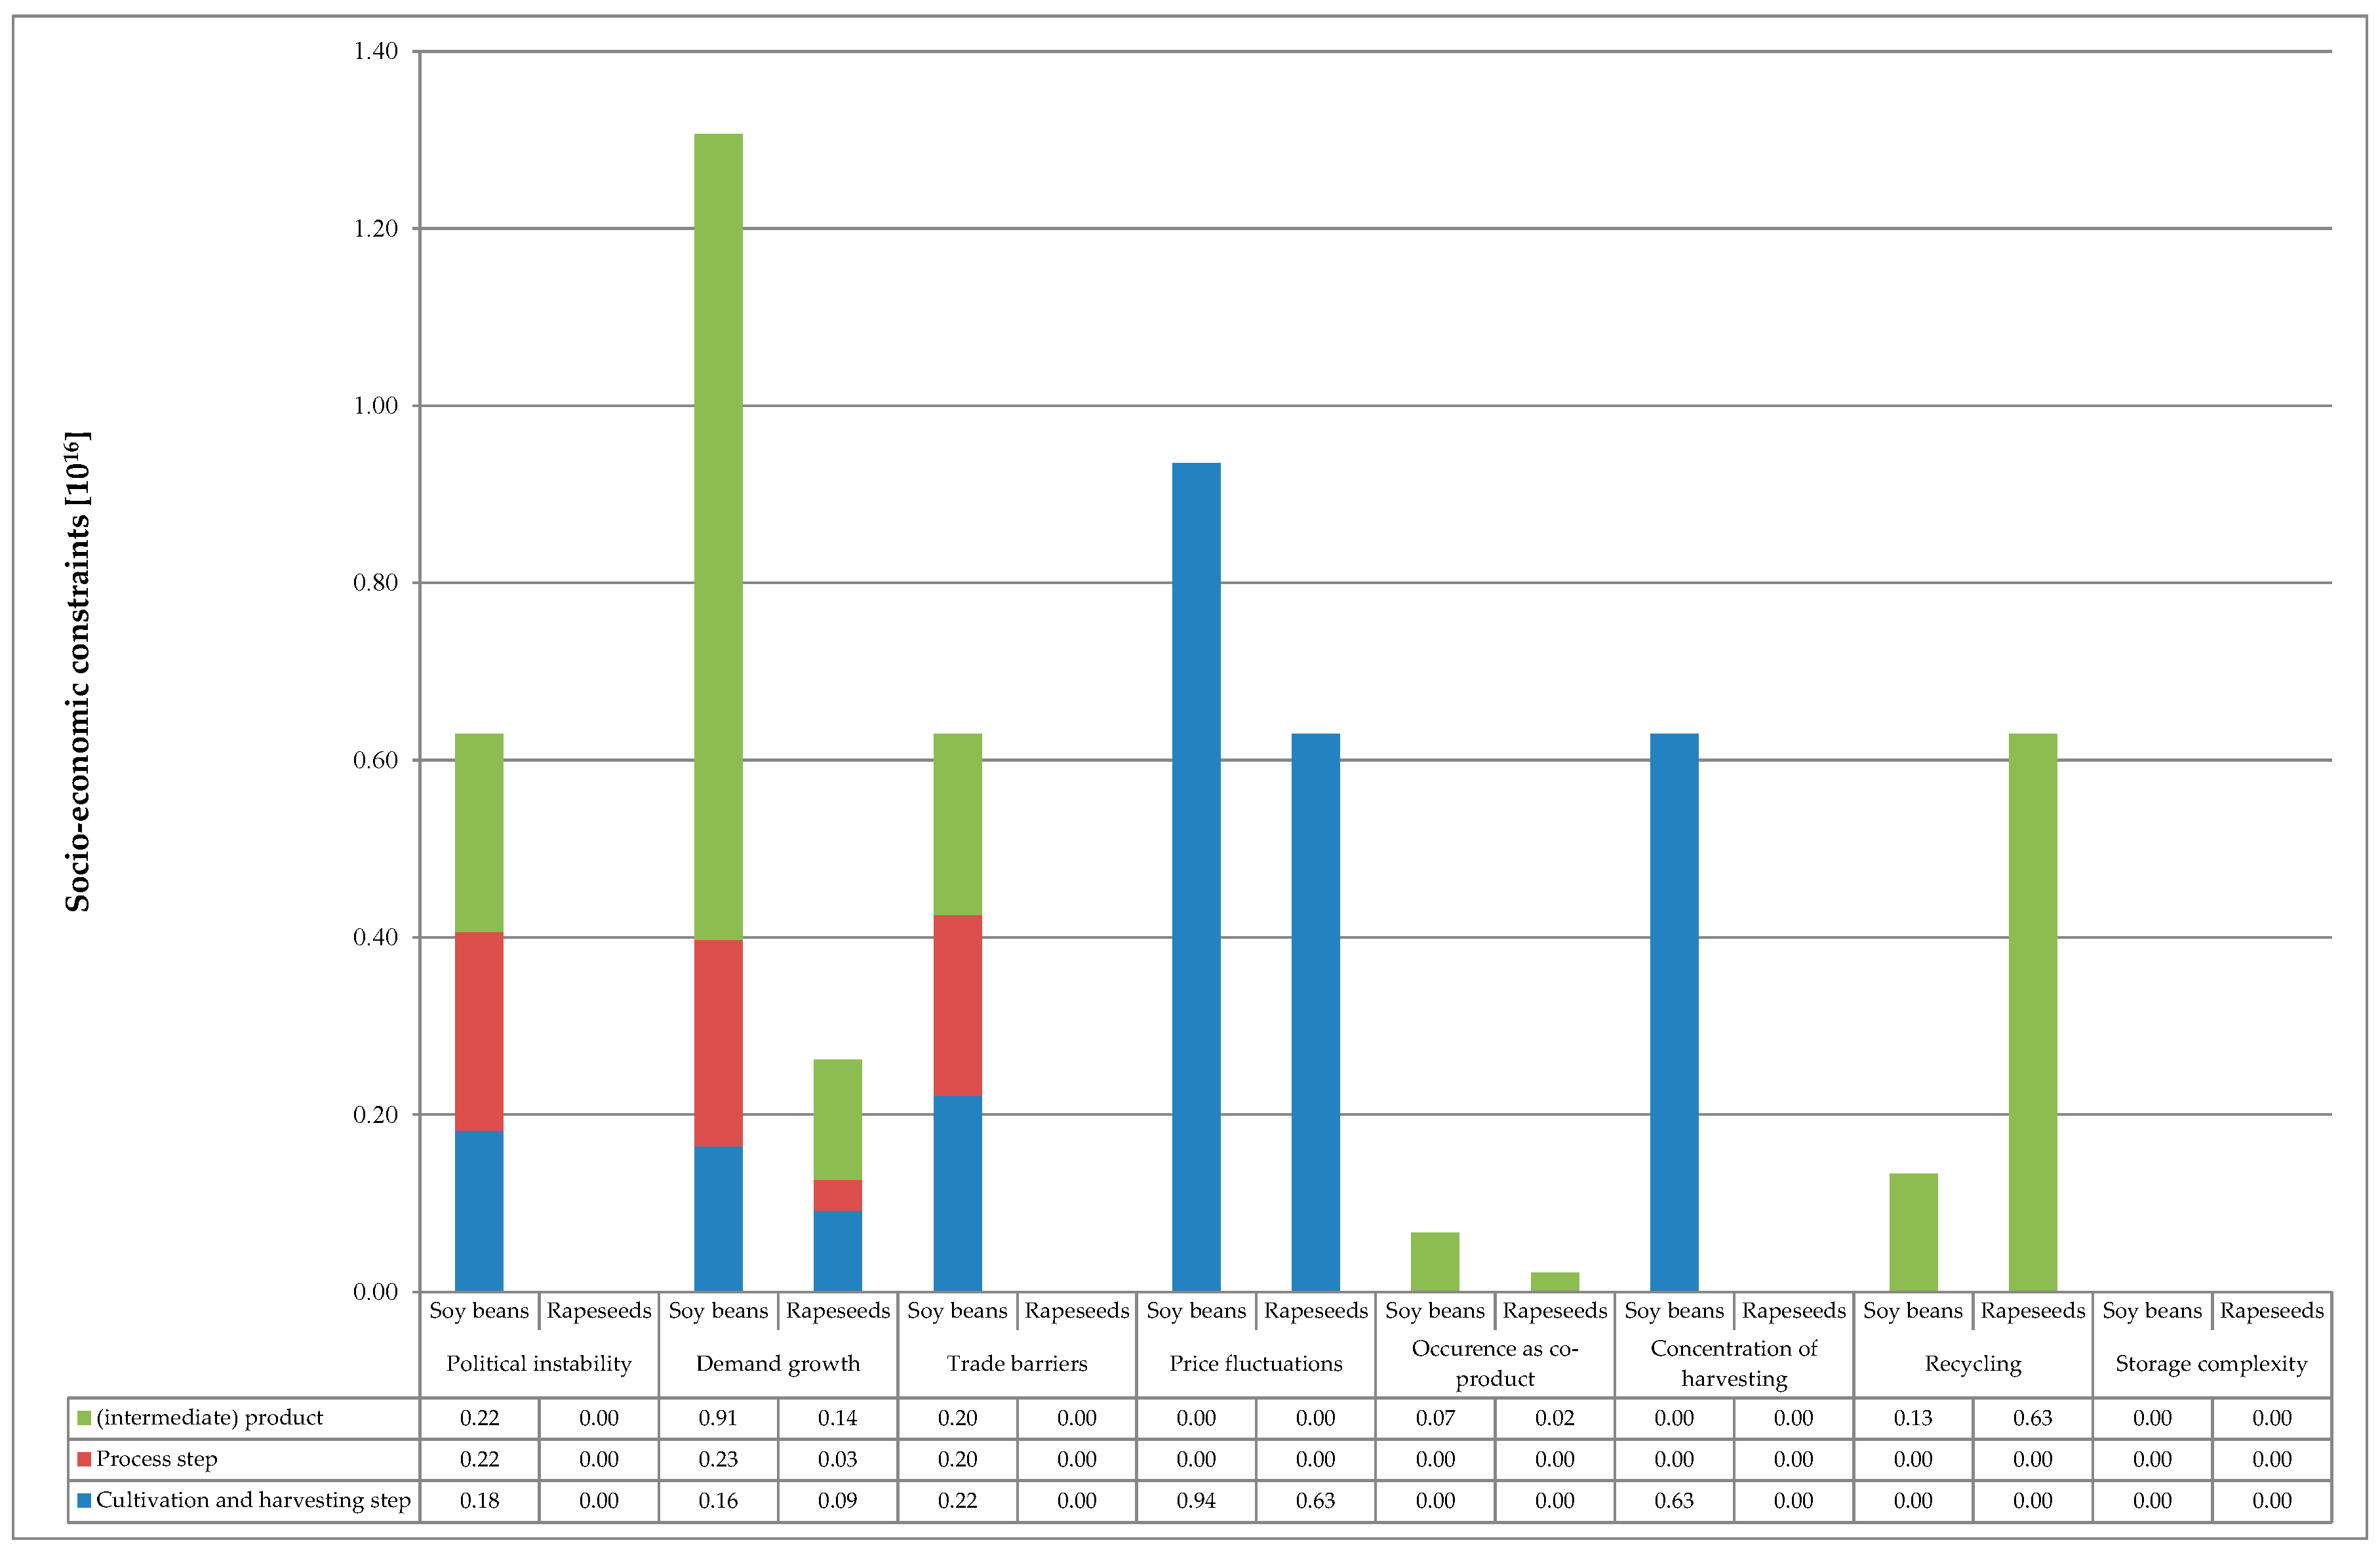
2.2. Socio-Economic Constraints
2.2.1. Concentration of Resources, Harvesting and Company Concentration
2.2.2. Political Instability
2.2.3. Demand Growth
2.2.4. Trade Barriers
2.2.5. Price Fluctuation
2.2.6. Occurrence as Co-Product
2.2.7. Storage Complexity
2.2.8. Recycling
2.2.9. Determination of Characterization Factors
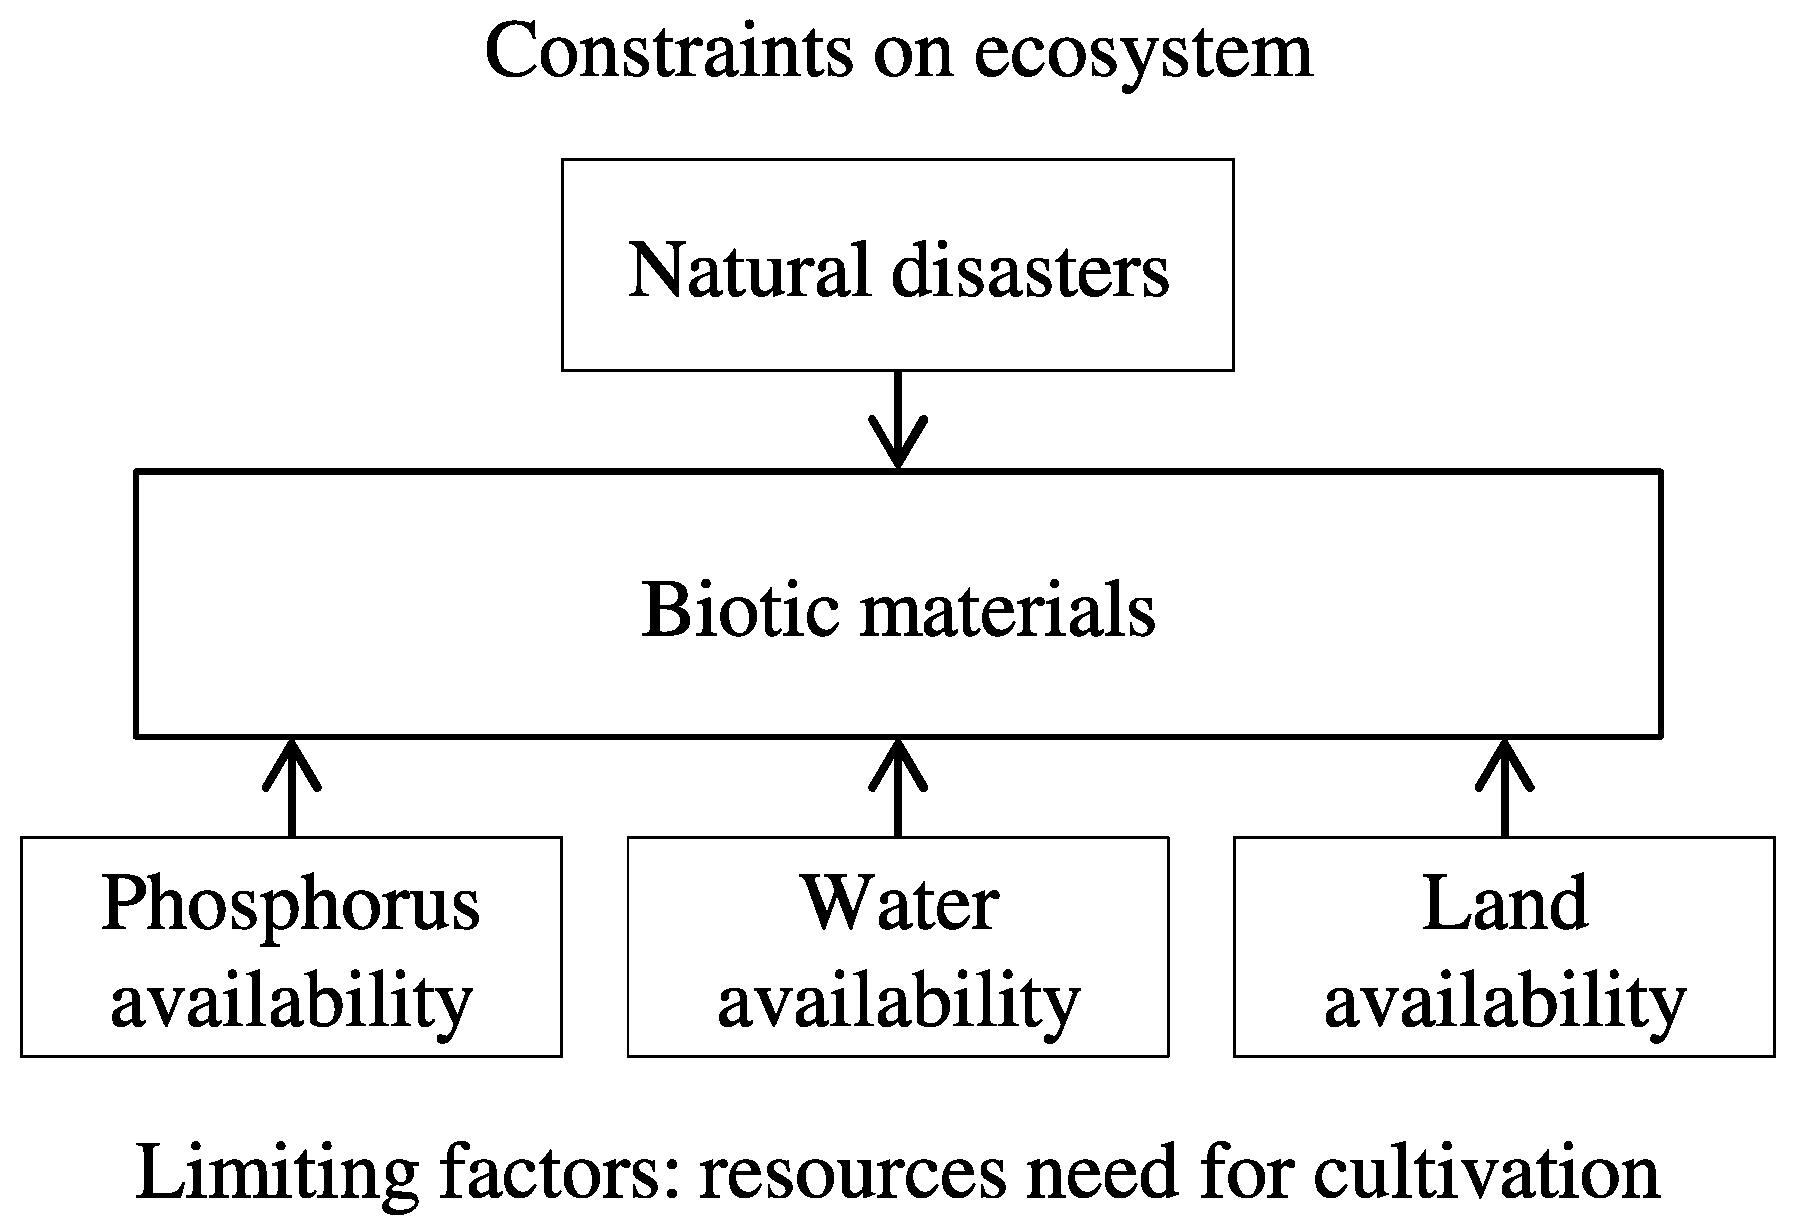
2.3. Abiotic Constraints
2.4. Social Constraints
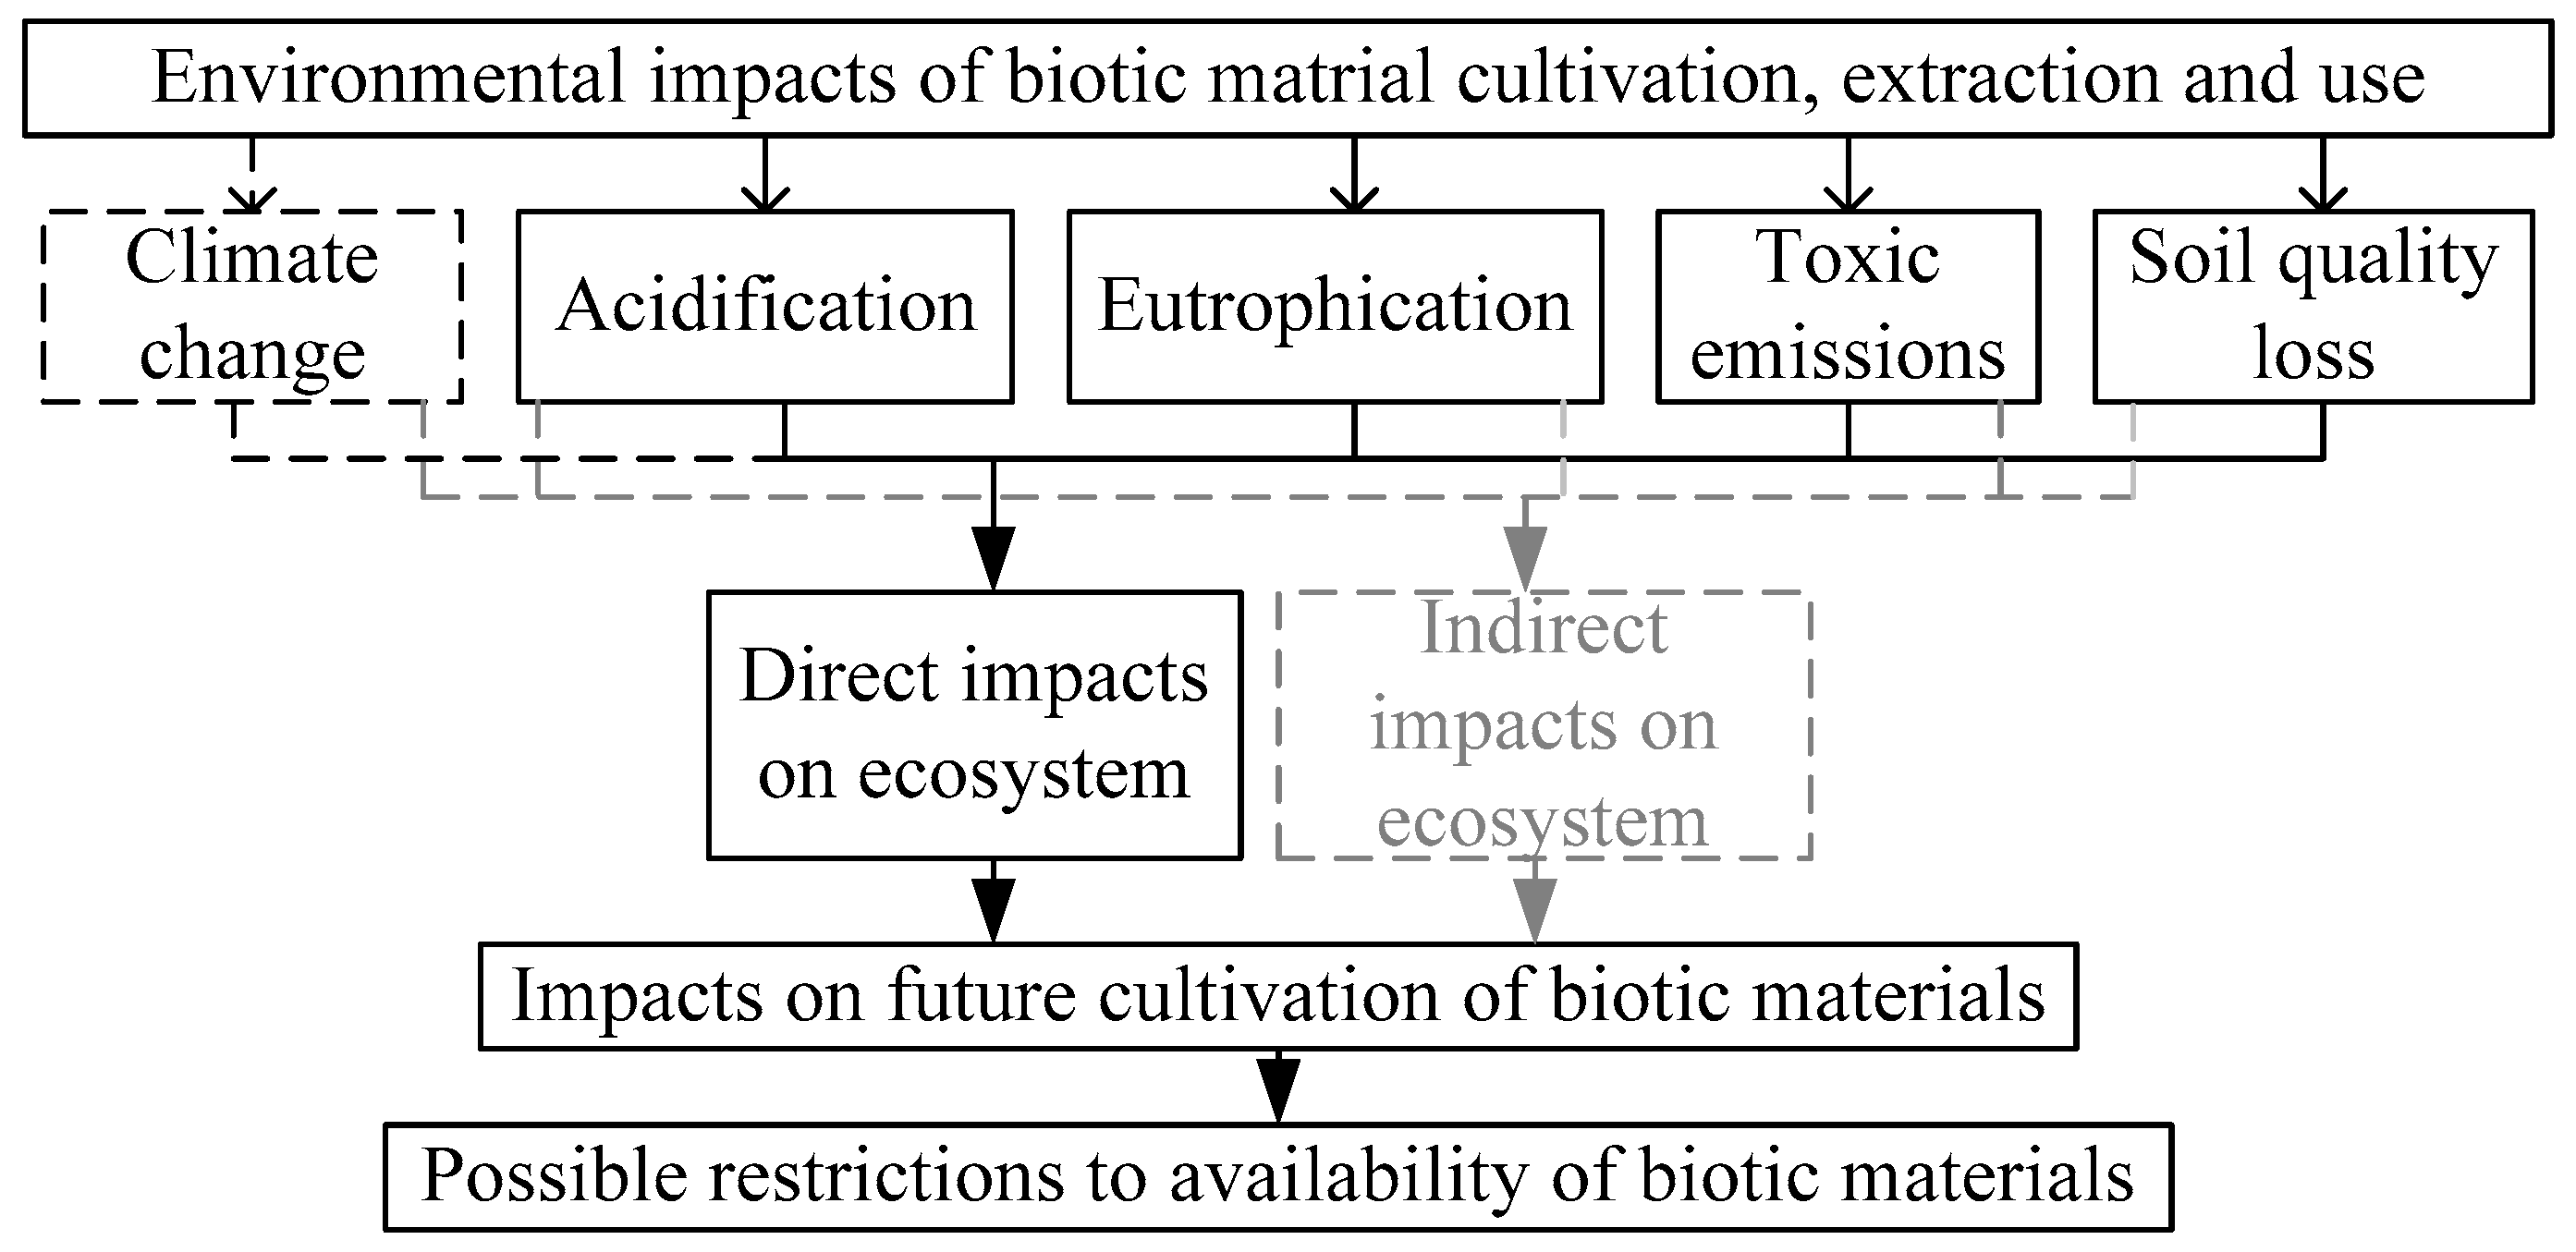
2.5. Environmental Constraints
3. Case Study
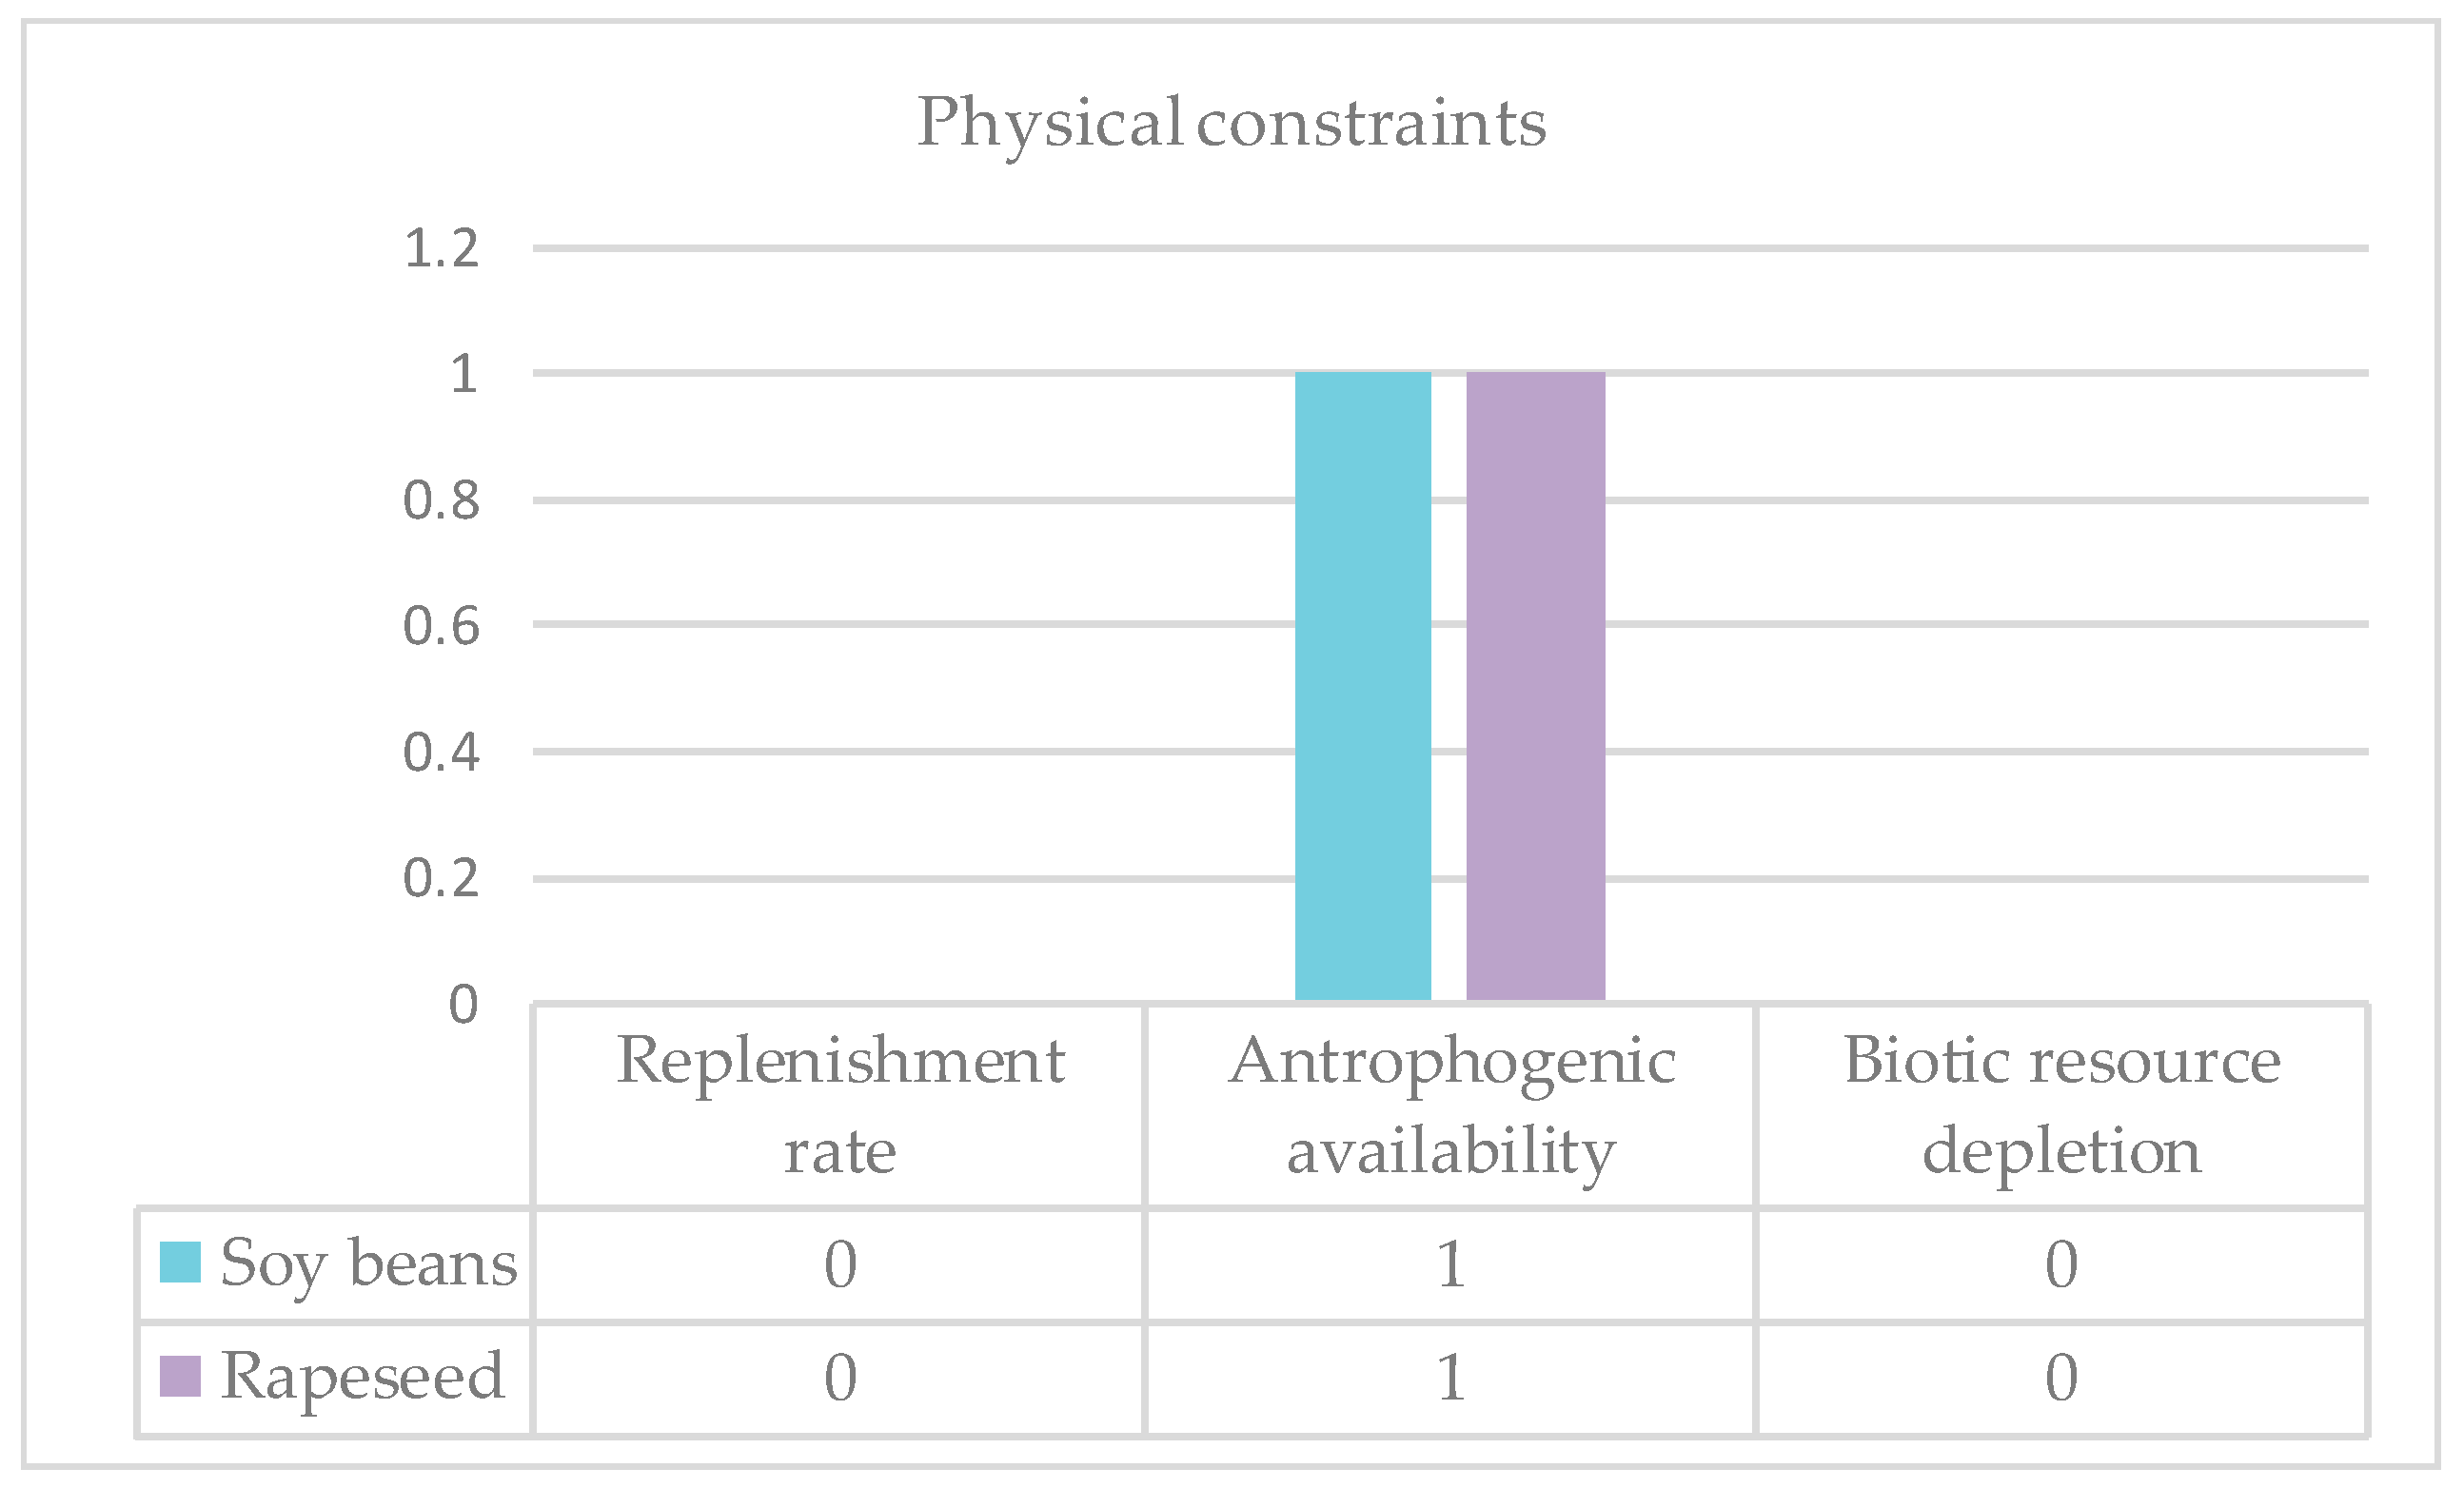
3.1. Physical Constraints
3.2. Socio-Economic Constraints
3.3. Abiotic Constraints
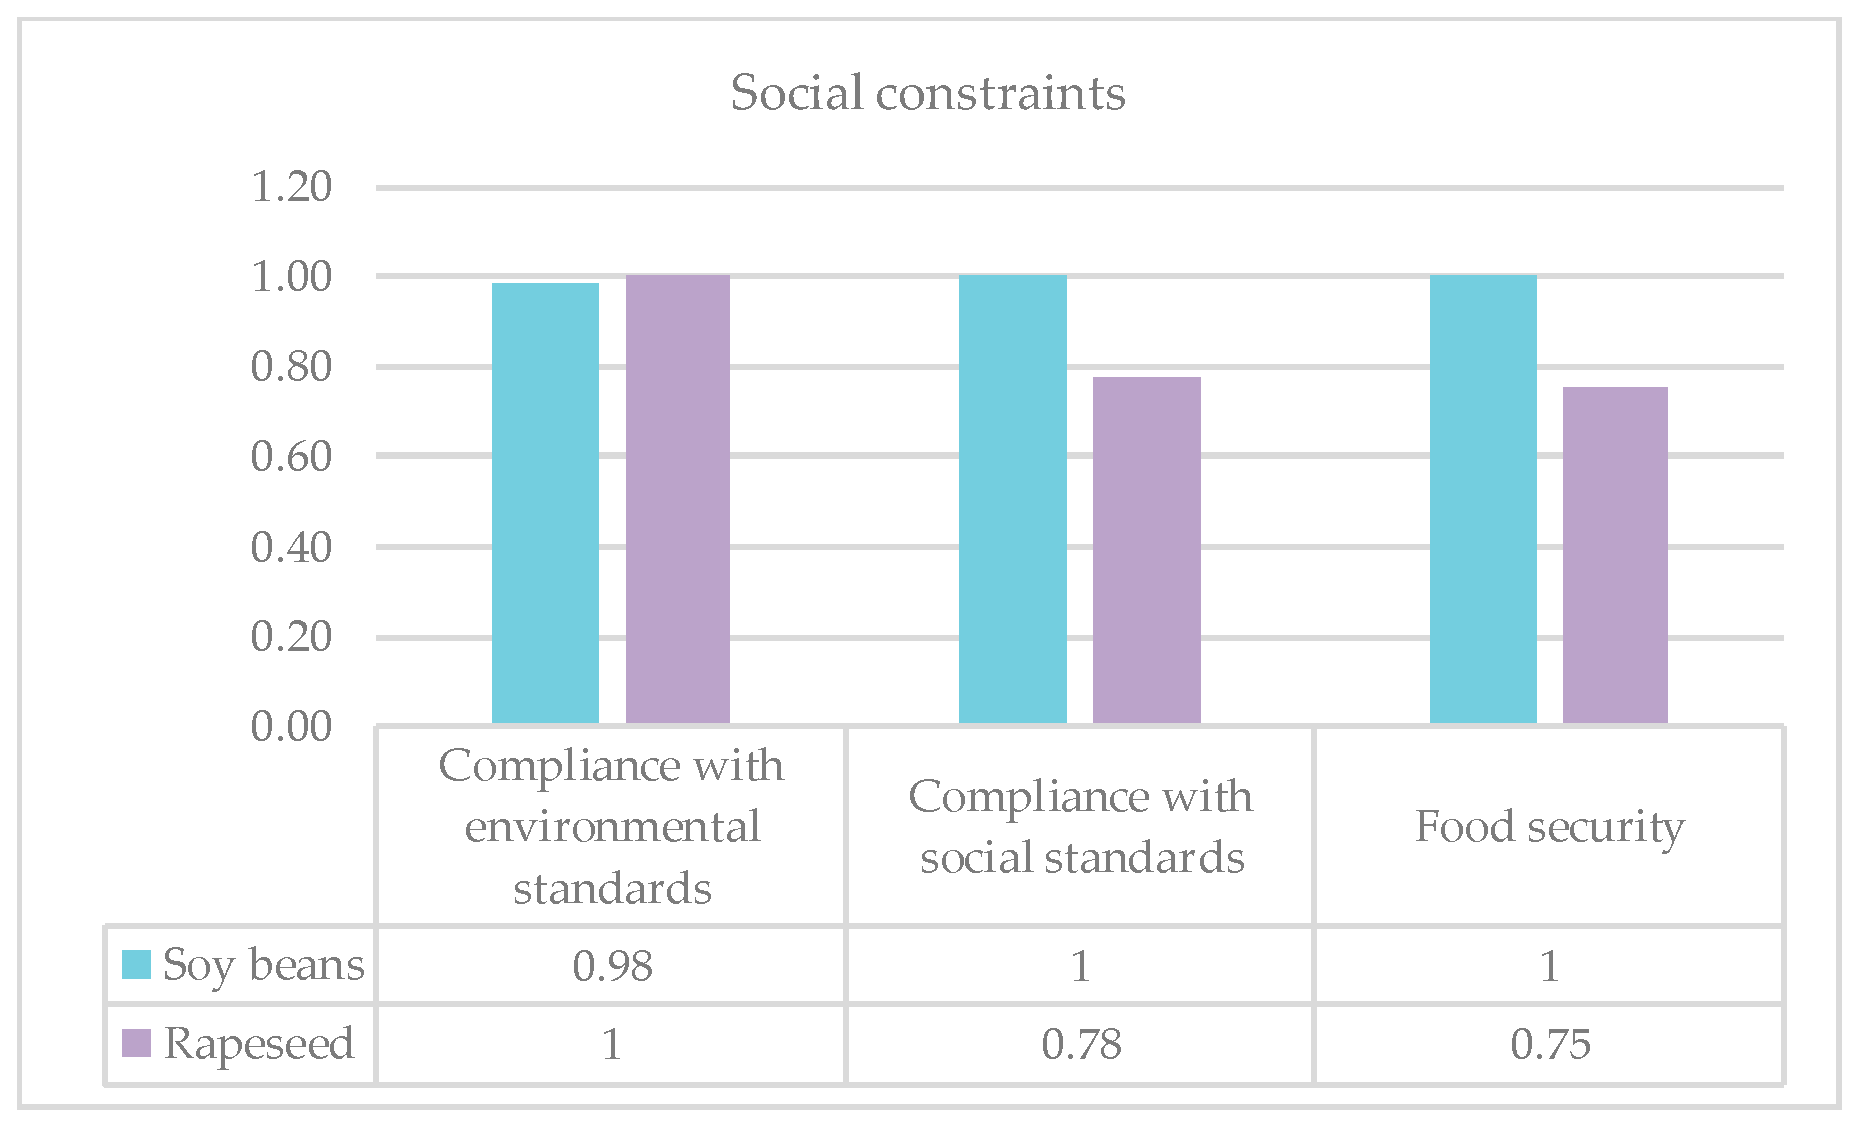
3.4. Social Constraints
3.5. Environmental Constraints
4. Discussion
4.1. Physical Constraints
4.2. Socio-Economic Constraints
4.3. Abiotic Constraints
4.4. Societal Constraints
4.5. Environmental Constraints
4.6. General
5. Conclusions and Outlook
Supplementary Materials
Acknowledgments
Author Contributions
Conflicts of Interest
References
- Schneider, L.; Berger, M.; Schüler-Hainsch, E.; Knöfel, S.; Ruhland, K.; Mosig, J.; Bach, V.; Finkbeiner, M. The economic resource scarcity potential (ESP) for evaluating resource use based on life cycle assessment. Int. J. Life Cycle Assess. 2013, 19, 601–610. [Google Scholar]
- Nassar, N.T.; Barr, R.; Browning, M.; Diao, Z.; Friedlander, E.; Harper, E.M.; Henly, C.; Kavlak, G.; Kwatra, S.; Jun, C.; et al. Criticality of the geological copper family. Environ. Sci. Technol. 2012, 46, 1071–1078. [Google Scholar] [CrossRef] [PubMed]
- Erdmann, L.; Behrendt, S.; Feil, M. Kritische Rohstoffe für Deutschland “Identifikation aus Sicht Deutscher Unternehmen Wirtschaftlich Bedeutsamer Mineralischer Rohstoffe, deren Versorgungslage Sich Mittel-Bis Langfristig als Kritisch Erweisen Könnte”; Institute for Futures Studies and Technology Assessment: Berlin, Germany, 2011. [Google Scholar]
- European Commission. Report on Critical Raw Materials for the EU; European Commission: Brussels, Belgium, 2014. [Google Scholar]
- Panousi, S.; Harper, E.M.; Nuss, P.; Eckelman, M.J.; Hakimian, A.; Graedel, T.E. Criticality of Seven Specialty Metals. J. Ind. Ecol. 2016, 20, 837–853. [Google Scholar] [CrossRef]
- Harper, E.M.; Kavlak, G.; Burmeister, L.; Eckelman, M.J.; Erbis, S.; Sebastian Espinoza, V.; Nuss, P.; Graedel, T.E. Criticality of the Geological Zinc, Tin, and Lead Family. J. Ind. Ecol. 2015, 19, 628–644. [Google Scholar] [CrossRef]
- Habert, G.; Bouzidi, Y.; Chen, C.; Jullien, A. Development of a depletion indicator for natural resources used in concrete. Resour. Conserv. Recycl. 2010, 54, 364–376. [Google Scholar] [CrossRef]
- Lindeijer, E.W.; Müller-Wenk, R.; Steen, B. Chapter 2: Impact Assessment of Resources and Land Use. In Life Cycle Impact Assessment: Striving towards Best Practice; SETAC Press: Pensacola, FL, USA, 2002. [Google Scholar]
- Dewulf, J.; Mancini, L.; Blengini, G.A.; Sala, S.; Latunussa, C.; Pennington, D. Toward an Overall Analytical Framework for the Integrated Sustainability Assessment of the Production and Supply of Raw Materials and Primary Energy Carriers. J. Ind. Ecol. 2015, 19, 963–977. [Google Scholar] [CrossRef] [Green Version]
- United Nations Environment Programme (UNEP). Assessing the Environmental Impacts of Consumption and Production, Priority Products and Materials; A Report of the Working Group on the Environmental Impacts of Products and Materials to the International Panel for Sustainable Resource Management; United Nations Environment Programme: Washington, DC, USA, 2010. [Google Scholar]
- Eisenmenger, N.; Giljum, S.; Lutter, S.; Marques, A.; Theurl, M.; Pereira, H.; Tukker, A. Towards a Conceptual Framework for Social-Ecological Systems Integrating Biodiversity and Ecosystem Services with Resource Efficiency Indicators. Sustainability 2016, 8, 201. [Google Scholar] [CrossRef]
- Schneider, L.; Bach, V.; Finkbeiner, M. LCA Perspectives for Resource Efficiency Assessment. In Special Types of LCA; Springer: Berlin/Heidelberg, Germany, 2016. [Google Scholar]
- BIO Intelligence Service. Assessment of Resource Efficiency Indicators and Targets; Final Report Prepared for the European Commission, DG Environment; Institute for Social Ecology (SEC): Vienna, Austria; Sustainable Europe Research Institute (SERI): Cologne, Germany, 2012. [Google Scholar]
- Schneider, L. A Comprehensive Approach to Model Abiotic Resource Provision Capability in the Context of Sustainable Development; Technische Universität Berlin: Berlin, Germany, 2014. [Google Scholar]
- Gemechu, E.D.; Helbig, C.; Sonnemann, G.; Thorenz, A.; Tuma, A. Import-based Indicator for the Geopolitical Supply Risk of Raw Materials in Life Cycle Sustainability Assessments. J. Ind. Ecol. 2016, 20, 154–165. [Google Scholar] [CrossRef]
- Bringezu, S.; Potočnik, J.; Schandl, H.; Lu, Y.; Ramaswami, A.; Swilling, M.; Suh, S. Multi-Scale Governance of Sustainable Natural Resource Use—Challenges and Opportunities for Monitoring and Institutional Development at the National and Global Level. Sustainability 2016, 8, 778. [Google Scholar] [CrossRef]
- World Wildlife Fund Protecting Wildlife for a Healthy Planet. Available online: http://www.worldwildlife.org/species/african-elephant (accessed on 7 Febuary 2016).
- Food and Agriculture Oganization of the United Nations. The State of World Fisheries and Aquaculture—Opportunities and Challenges 2014; Food and Agriculture Oganization of the United Nations: Rome, Italy, 2014. [Google Scholar]
- Krausmann, F.; Richter, R.; Eisenmenger, N. Resource Use in Small Island States. J. Ind. Ecol. 2014, 18, 294–305. [Google Scholar] [CrossRef] [PubMed]
- International Union for Conservation of Nature IUCN Red List of Threatened Species. Available online: http://www.iucnredlist.org/ (accessed on 5 Febuary 2016).
- CITES Secretariat-IUCN/SSC African Elephant Specialist Group—TRAFFIC International. Status of African Elephant Populations and Levels of Illegal Killing and the Illegal Trade in Ivory: A Report to the African Elephant Summit; IUCN/SSC African Elephant Specialist Group, International Union for Conservation of Nature (IUCN): Gland, Switzerland, 2013. [Google Scholar]
- Langlois, J.; Fréon, P.; Delgenes, J.P.; Steyer, J.P.; Hélias, A. Biotic resources extraction impact assessment in LCA of fisheries. In Proceedings of the 8th International Conference on Life Cycle Assessment in the Agri-Food Sector, Saint-Malo, France, 2–4 October 2012.
- Ziegler, F.; Emanuelsson, A.; Eichelsheim, J.L.; Flysjö, A.; Ndiaye, V.; Thrane, M. Extended Life Cycle Assessment of Southern Pink Shrimp Products Originating in Senegalese Artisanal and Industrial Fisheries for Export to Europe. J. Ind. Ecol. 2011, 15, 527–538. [Google Scholar] [CrossRef]
- Vázquez-Rowe, I.; Moreira, M.T.; Feijoo, G. Inclusion of discard assessment indicators in fisheries life cycle assessment studies. Expanding the use of fishery-specific impact categories. Int. J. Life Cycle Assess. 2012, 17, 535–549. [Google Scholar] [CrossRef]
- Mattila, T.; Helin, T.; Antikainen, R. Land use indicators in life cycle assessment. Int. J. Life Cycle Assess. 2011, 17, 277–286. [Google Scholar] [CrossRef]
- Koellner, T.; Baan, L.; Beck, T.; Brandão, M.; Civit, B.; Margni, M.; Canals, L.M.; Saad, R.; Souza, D.M.; Müller-Wenk, R. UNEP-SETAC guideline on global land use impact assessment on biodiversity and ecosystem services in LCA. Int. J. Life Cycle Assess. 2013, 18, 1188–1202. [Google Scholar] [CrossRef] [Green Version]
- Hämmerle, F.M. The cellulose gap (the future of cellulose fibres). Lenzing. Ber. 2011, 89, 12–21. [Google Scholar]
- Bach, V.; Berger, M.; Henßler, M.; Kirchner, M.; Leiser, S.; Mohr, L.; Rother, E.; Ruhland, K.; Schneider, L.; Tikana, L.; et al. Integrated method to assess resource efficiency—ESSENZ. J. Clean. Prod. 2016, 137, 118–130. [Google Scholar] [CrossRef]
- Gutzler, C.; Helming, K.; Balla, D.; Dannowski, R.; Deumlich, D.; Glemnitz, M.; Knierim, A.; Mirschel, W.; Nendel, C.; Paul, C.; et al. Agricultural land use changes—A scenario-based sustainability impact assessment for Brandenburg, Germany. Ecol. Indic. 2015, 48, 505–517. [Google Scholar] [CrossRef]
- Martire, S.; Castellani, V.; Sala, S. Carrying capacity assessment of forest resources: Enhancing environmental sustainability in energy production at local scale. Resour. Conserv. Recycl. 2015, 94, 11–20. [Google Scholar] [CrossRef]
- Oakdene Hollins; Fraunhofer Isi. Study on Critical Raw Materials at EU Level—Final Report; Oakdene Hollins: Aylesbury, UK; Fraunhofer Isi.: Karlsruhe, Germany, 2013. [Google Scholar]
- Graedel, T.E.; Barr, R.; Chandler, C.; Chase, T.; Choi, J.; Christoffersen, L.; Friedlander, E.; Henly, C.; Jun, C.; Nassar, N.T.; et al. Methodology of metal criticality determination. Environ. Sci. Technol. 2012, 46, 1063–1070. [Google Scholar] [CrossRef] [PubMed]
- Helbig, C.; Wietschel, L.; Thorenz, A.; Tuma, A. How to evaluate raw material vulnerability—An overview. Resour. Policy 2016, 48, 13–24. [Google Scholar] [CrossRef]
- Bach, V.; Möller, F.; Finogenova, N.; Emara, Y.; Finkbeiner, M. Characterization model to assess ocean acidification within life cycle assessment. Int. J. Life Cycle Assess. 2016, 21, 1463–1472. [Google Scholar] [CrossRef]
- Hattam, C.; Atkins, J.P.; Beaumont, N.; Bӧrger, T.; Bӧhnke-Henrichs, A.; Burdon, D.; de Groot, R.; Hoefnagel, E.; Nunes, P.A.L.D.; Piwowarczyk, J.; et al. Marine ecosystem services: Linking indicators to their classification. Ecol. Indic. 2015, 49, 61–75. [Google Scholar] [CrossRef]
- Food and Agriculture Organization of the United Nations. Countries Requiring External Assistance for Food. Available online: http://www.fao.org/giews/english/hotspots/index.htm (accessed on 6 Febuary 2016).
- Guinée, J.B.; Gorrée, M.; Heijungs, R.; Huppes, G.; Kleijn, R.; de Koning, A.; van Oers, L.; Sleeswijk, A.W.; Suh, S.; de Haes, H.A.U.; et al. Handbook on Life Cycle Assessment; Operational Guide to the ISO Standards, I: LCA in Perspective, IIa: Guide, IIb: Operational Annex, III: Scientific Background; Leiden University: Leiden, The Netherlands, 2002. [Google Scholar]
- Finkbeiner, M.; Inaba, A.; Tan, R.; Christiansen, K.; Klüppel, H.-J. The New International Standards for Life Cycle Assessment: ISO 14040 and ISO 14044. Int. J. Life Cycle Assess. 2006, 11, 80–85. [Google Scholar] [CrossRef]
- International Organization for Standardization. ISO 14040: International Standard—Environmental Management—Life Cycle Assessment—Principles and Framework; International Organization for Standardization: Geneva, Switzerland, 2006. [Google Scholar]
- Guinée, J.B. Development of a Methodology for the Environmental Life-Cycle Assessment of PROducts: With a Case Study on Margarines. Ph.D. Thesis, Leiden University, Leiden, The Netherlands, 1995. [Google Scholar]
- Van Oers, L.; de Koning, A.; Guinée, J.B.; Huppes, G. Abiotic Ressource Depletion in LCA; Improving Characterisation Factors for Abiotic Resource Depletion as Recommended in the Dutch LCA Handbook; Road and Hydraulic Engineering Institute: Amsterdam, The Netherlands, 2002. [Google Scholar]
- Heijungs, R.; Guinée, J.B.; Huppes, G.; Lankreijer, R.M.; Udo de Haes, H.A.; Wegener Sleeswijk, A.; Ansems, A.M.M.; Eggels, P.G.; van Duin, R.; de Goede, H.P. Environmental Life Cycle Assessment of PROducts: Guide and Backgrounds (Part 1); Centre of Environmental Science (CML), Section and Substances & Products, Leiden University: Leiden, The Netherlands, 1992. [Google Scholar]
- Sas, H. Extraction of Biotic Resources: Development of a Methodology for Incorporation in LCAs, with Case Studies on Timber and Fish; Ministry of Housing, Spatial Planning and the Environment: The Hague, The Netherlands, 1997.
- International Union for Conservation of Nature and Natural Resources. IUCN Red List Categories and Criteria Version 3.1—Categories and Criteria; International Union for Conservation of Nature and Natural Resources: Gland, Switzerland, 2001. [Google Scholar]
- Verein Deutscher Ingenieure (VDI). Verein Deutscher Ingenieure e.V. 4800 Blatt 2 Bewertung des Rohstoffaufwands—Bilanzierungsgrundsätze und Rohstoffkritikalität; Verein Deutscher Ingenieure: Berlin, Germany, 2013. [Google Scholar]
- Rosenau-Tornow, D.; Buchholz, P.; Riemann, A.; Wagner, M. Assessing the long-term supply risks for mineral raw materials-a combined evaluation of past and future trends. Resour. Policy 2009, 34, 161–175. [Google Scholar] [CrossRef]
- Rhoades, S.A. The Herfindahl-Hirschman index. Fed. Reserv. Bull. 1993, 79, 188–189. [Google Scholar]
- Kaufmann, D.; Kraay, A.; Mastruzzi, M. The Worldwide Governance Indicators: Methodology and Analytical Issues. Hague J. Rule Law 2011, 3, 220–246. [Google Scholar] [CrossRef]
- World Bank Group The Worldwide Governance Indicators. Available online: http://info.worldbank.org/governance/wgi/index.aspx#home (accessed on 4 January 2017).
- Hanouz, M.D.; Geiger, T.; Doherty, S. The Global Enabling Trade Report 2014; World Economic Froum: Geneva, Switzerland, 2014. [Google Scholar]
- Federal Institute for Geosciences and Natural Resources Volatilitätsmonitor. 2014. Available online: http://www.bgr.bund.de/DE/Themen/Min_rohstoffe/Produkte/Volatilitaetsmonitor/vm_14_12.html (accessed on 9 January 2017).
- Barrientos, M.; Soria, C. IndexMundi. Available online: http://www.indexmundi.com/about.html (accessed on 6 Febuary 2016).
- Forster-Carneiro, T.; Berni, M.D.; Dorileo, I.L.; Rostagno, M.A. Biorefinery study of availability of agriculture residues and wastes for integrated biorefineries in Brazil. Resour. Conserv. Recycl. 2013, 77, 78–88. [Google Scholar] [CrossRef]
- Kemausuor, F.; Kamp, A.; Thomsen, S.T.; Bensah, E.C.; Østergård, H. Assessment of biomass residue availability and bioenergy yields in Ghana. Resour. Conserv. Recycl. 2014, 86, 28–37. [Google Scholar] [CrossRef]
- Palumbo, M.; Avellaneda, J.; Lacasta, A.M. Availability of crop by-products in Spain: New raw materials for natural thermal insulation. Resour. Conserv. Recycl. 2015, 99, 1–6. [Google Scholar] [CrossRef] [Green Version]
- Food and Agriculture Organization of the United Nations. Chapter 13. Storage Problems of Feedstuffs; Food and Agriculture Organization of the United Nations: Rome, Italy, 1978. [Google Scholar]
- Ng’ang’a, J.; Mutungi, C.; Imathiu, S.M.; Affognon, H. Low permeability triple-layer plastic bags prevent losses of maize caused by insects in rural on-farm stores. Food Secur. 2016, 8, 621–633. [Google Scholar] [CrossRef]
- Mutters, R.G.; Thompson, J.F. Rice Quality Handbook; ANR, University of California Press: Berkeley, CA, USA, 2009. [Google Scholar]
- Orji, S.C. Major Problems of Food & Agriculture in Nigeria. Available online: https://www.modernghana.com/news/453864/major-problems-of-food-agriculture-in-nigeria.html (accessed on 6 Febuary 2016).
- Organisation for Economic Cooperation and Development Economic Resilience. Available online: http://www.oecd.org/economy/growth/economic-resilience.htm (accessed on 6 Febuary 2016).
- Müller-Wenk, R.; Ahbe, S. Methodik für Ökobilanzen auf der Basis Ökologischer Optimierung; Bundesamt für Umwelt, Wald und Landschaft: Bern, Switzerland, 1990. [Google Scholar]
- Frischknecht, R.; Steiner, R.; Jungbluth, N.; Büsser Knöpfel, S. The Ecological Scarcity Method: Eco-Factors 2006—A Method for Impact Assessment in LCA; Environmental Studies No. 0906; Federal Office for the Environment: Bern, Switzerland, 2009. [Google Scholar]
- United States Department of Agriculture World Crop Production Summary. Available online: http://apps.fas.usda.gov/psdonline/circulars/production.pdf (accessed on 6 Febuary 2016).
- Swetz, F.; Kangshen, S.; Crossley, J.N.; Lun, A.W.C. The Nine Chapters on the Mathematical Art: Companion and Commentary. Am. Math. Mon. 2001, 108, 673. [Google Scholar] [CrossRef]
- Food and Agriculture Organization of the United Nations. Coping with Water Scarcity—An Action Framework for Agriculture and Food Security; Food and Agriculture Organization of the United Nations: Rome, Italy, 2008. [Google Scholar]
- Berger, M.; Finkbeiner, M. Water Footprinting: How to Address Water Use in Life Cycle Assessment? Sustainability 2010, 2, 919–944. [Google Scholar] [CrossRef]
- Berger, M.; Finkbeiner, M. Methodological Challenges in Volumetric and Impact-Oriented Water Footprints. J. Ind. Ecol. 2013, 17, 79–89. [Google Scholar] [CrossRef]
- Aitken, D.; Rivera, D.; Godoy-Faúndez, A.; Holzapfel, E. Water Scarcity and the Impact of the Mining and Agricultural Sectors in Chile. Sustainability 2016, 8, 128. [Google Scholar] [CrossRef]
- Berger, M.; van der Ent, R.; Eisner, S.; Bach, V.; Finkbeiner, M. Water accounting and vulnerability evaluation (WAVE): considering atmospheric evaporation recycling and the risk of freshwater depletion in water footprinting. Environ. Sci. Technol. 2014, 48, 4521–4528. [Google Scholar] [CrossRef] [PubMed]
- Pfister, S.; Koehler, A.; Hellweg, S. Assessing the Environmental Impacts of Freshwater Consumption in LCA. Environ. Sci. Technol. 2009, 43, 4098–4104. [Google Scholar] [CrossRef] [PubMed]
- Neset, T.-S.S.; Cordell, D. Global phosphorus scarcity: Identifying synergies for a sustainable future. J. Sci. Food Agric. 2012, 92, 2–6. [Google Scholar] [CrossRef] [PubMed]
- Cordell, D.; Drangert, J.-O.; White, S. The story of phosphorus: Global food security and food for thought. Glob. Environ. Chang. 2009, 19, 292–305. [Google Scholar] [CrossRef]
- Vance, C.P. Symbiotic Nitrogen Fixation and Phosphorus Acquisition. Plant Nutrition in a World of Declining Renewable Resources. Plant Physiol. 2001, 127, 390–397. [Google Scholar] [CrossRef] [PubMed]
- Heinemann, T. Multi-Level Multi-Scale Framework for Enhancing Energy and Resource Efficiency in Production. In Energy and Resource Efficiency in Aluminium Die Casting; Springer International Publishing: Cham, Switzerland, 2016; pp. 91–123. [Google Scholar]
- Foley, J.A. Global Consequences of Land Use. Science 2005, 309, 570–574. [Google Scholar] [CrossRef] [PubMed]
- Hurtt, G.C.; Chini, L.P.; Frolking, S.; Betts, R.A.; Feddema, J.; Fischer, G.; Fisk, J.P.; Hibbard, K.; Houghton, R.A.; Janetos, A.; et al. Harmonization of land-use scenarios for the period 1500–2100: 600 years of global gridded annual land-use transitions, wood harvest, and resulting secondary lands. Clim. Chang. 2011, 109, 117–161. [Google Scholar] [CrossRef]
- Dodd, R.J.; Sharpley, A.N. Recognizing the role of soil organic phosphorus in soil fertility and water quality. Resour. Conserv. Recycl. 2015, 105, 282–293. [Google Scholar] [CrossRef]
- Cordell, D.; White, S. Peak Phosphorus: Clarifying the Key Issues of a Vigorous Debate about Long-Term Phosphorus Security. Sustainability 2011, 3, 2027–2049. [Google Scholar] [CrossRef]
- Roberts, T.L.; Johnston, A.E. Phosphorus use efficiency and management in agriculture. Resour. Conserv. Recycl. 2015, 105, 275–281. [Google Scholar] [CrossRef]
- Reijnders, L. Phosphorus resources, their depletion and conservation, a review. Resour. Conserv. Recycl. 2014, 93, 32–49. [Google Scholar] [CrossRef]
- Erisman, J.W.; Sutton, M.A.; Galloway, J.; Klimont, Z.; Winiwarter, W. How a century of ammonia synthesis changed the world. Nat. Geosci. 2008, 1, 636–639. [Google Scholar] [CrossRef]
- Dawson, C.J.; Hilton, J. Fertiliser availability in a resource-limited world: Production and recycling of nitrogen and phosphorus. Food Policy 2011, 36, S14–S22. [Google Scholar] [CrossRef]
- Santos, W.O.; Mattiello, E.M.; Vergutz, L.; Costa, R.F. Production and evaluation of potassium fertilizers from silicate rock. J. Plant Nutr. Soil Sci. 2016, 179, 547–556. [Google Scholar] [CrossRef]
- United States Geological Survey Commodity Statistics and Information. Available online: http://minerals.usgs.gov/minerals/pubs/commodity/ (accessed on 20 May 2004).
- Pradhan, A.; Shrestha, D.S.; van Gerpen, J.; McAloon, A.; Yee, W.; Haas, M.; Duffield, J.A. Reassessment of Life Cycle Greenhouse Gas Emissions for Soybean Biodiesel. Trans. Am. Soc. Agric. Biol. Eng. ASABE 2012, 55, 2257–2264. [Google Scholar] [CrossRef]
- Zulka, K.P.; Lichtblau, G.; Pölz, W.; Stix, S.; Winter, R.; Deweis, M. Ökobilanzen Ausgewählter Biotreibstoffe—Erstellt im Rahmen des Projekts “Biokraftstoffe—Potentiale, Risiken, Zukunftsszenarien”. Available online: http://www.umweltbundesamt.at/fileadmin/site/publikationen/REP0360.pdf (accessed on 7 Febuary 2016).
- March, M.D.; Toma, L.; Stott, A.W.; Roberts, D.J. Modelling phosphorus efficiency within diverse dairy farming systems—Pollutant and non-renewable resource? Ecol. Indic. 2016, 69, 667–676. [Google Scholar] [CrossRef]
- Curran, M.; de Souza, D.M.; Antón, A.; Teixeira, R.F.M.; Michelsen, O.; Vidal-Legaz, B.; Sala, S.; Mila i Canals, L. How well does LCA model land use impacts on biodiversity?—A comparison with approaches from ecology and conservation. Environ. Sci. Technol. 2016, 50, 2782–2795. [Google Scholar] [CrossRef] [PubMed]
- Beck, T.; Bos, U.; Wittstock, B.; Baitz, M.; Fischer, M.; Sedlbauer, K. LANCA® Land Use Indicator Value Calculation in Life Cycle Assessment—Method Report; University of Stuttgart: Sttutgart, Germany, 2010. [Google Scholar]
- Thinkstep GaBi. Product Sustainability Software; Thinkstep GaBi: Leinfelden-Echterdingen, Germany, 2016. [Google Scholar]
- Ecoinvent. Ecoinvent Database; Ecoinvent Center: Bern, Switzerland, 2016. [Google Scholar]
- Ioannidou, D.; Nikias, V.; Brière, R.; Zerbi, S.; Habert, G. Land-cover-based indicator to assess the accessibility of resources used in the construction sector. Resour. Conserv. Recycl. 2015, 94, 80–91. [Google Scholar] [CrossRef]
- Sivakumar, M.V.K.; Motha, R.P.; Das, H.P. (Eds.) Natural Disasters and Extreme Events in Agriculture; Springer: Berlin/Heidelberg, Germany, 2005.
- Food and Agriculture Oganization of the United Nations. The Impact of Natural Hazards and Disasters on Agriculture and Food Security and Nutrition; Food and Agriculture Organization of the United Nations: Rome, Italy, 2015. [Google Scholar]
- Tanikawa, H.; Managi, S.; Lwin, C.M. Estimates of Lost Material Stock of Buildings and Roads Due to the Great East Japan Earthquake and Tsunami. J. Ind. Ecol. 2014, 18, 421–431. [Google Scholar] [CrossRef]
- Thomas, C.D.; Cameron, A.; Green, R.E.; Bakkenes, M.; Beaumont, L.J.; Collingham, Y.C.; Erasmus, B.F.N.; de Siqueira, M.F.; Grainger, A.; Hannah, L.; et al. Extinction risk from climate change. Nature 2004, 427, 145–148. [Google Scholar] [CrossRef] [PubMed] [Green Version]
- Martínez-Graña, A.M.; Boski, T.; Goy, J.L.; Zazo, C.; Dabrio, C.J. Coastal-flood risk management in central Algarve: Vulnerability and flood risk indices (South Portugal). Ecol. Indic. 2016, 71, 302–316. [Google Scholar] [CrossRef]
- United Nations Office for Disaster Risk Reduction Global Risk Data Platform. Available online: http://preview.grid.unep.ch/index.php?preview=data&events=floods&evcat=1&lang=eng (accessed on 7 Febuary 2016).
- Socioeconomic Data and Applications Center Socioeconomic Data and Applications Center. Available online: http://sedac.ciesin.columbia.edu/data/set/ndh-landslide-hazard-distribution (accessed on 4 January 2017).
- European Commission. A Bioeconomy Strategy for Europe; The European Commission: Brussels, Belgium, 2013. [Google Scholar]
- Food and Agriculture Organization of the United Nations. The State of Food Insecurity in the World; Food and Agriculture Organization of the United Nations: Rome, Italy, 2015. [Google Scholar]
- Food and Agriculture Organization of the United Nations. Food Security Indicators; Food and Agriculture Organization of the United Nations: Rome, Italy, 2016; Available online: http://www.fao.org/economic/ess/ess-fs/ess-fadata/en/#.V2jUO1SLSUn (accessed on 6 Febuary 2016).
- Shuaib, M.; Seevers, D.; Zhang, X.; Badurdeen, F.; Rouch, K.E.; Jawahir, I.S. Product Sustainability Index (ProdSI). J. Ind. Ecol. 2014, 18, 491–507. [Google Scholar] [CrossRef]
- Zhang, M.; Chen, C.; Hu, W.; Chen, L.; Zhan, J. Influence of Source Credibility on Consumer Acceptance of Genetically Modified Foods in China. Sustainability 2016, 8, 899. [Google Scholar] [CrossRef]
- Bacon, D. Farm Workers in Two Countries Boycott Driscoll’s Berries. Available online: http://www.progressive.org/news/2016/03/188606/farm-workers-two-countries-boycott-driscoll%25E2%2580%2599s-berries (accessed on 7 Febuary 2016).
- Keller, E. Palm Reading: Should We Buy or Boycott Products Containing Palm Oil? Available online: http://blogs.wwf.org.uk/blog/green-sustainable-living/green-sustainable-living-food/palm-reading-should-we-buy-or-boycott-products-containing-palm-oil/ (accessed on 1 January 2016).
- Norris, C.B.; Norris, G.; Aulisio, D. Social Hotspots Database. Available online: http://socialhotspot.org/ (accessed on 4 January 2017).
- Benoit-Norris, C.; Cavan, D.A.; Norris, G. Identifying Social Impacts in Product Supply Chains:Overview and Application of the Social Hotspot Database. Sustainability 2012, 4, 1946–1965. [Google Scholar] [CrossRef]
- Yale Center for Environmental Law & Policy Environmental Performance Index. Available online: http://epi.yale.edu/ (accessed on 4 January 2017).
- Cazcarro, I.; Duarte, R.; Sánchez-Chóliz, J.; Sarasa, C.; Serrano, A. Environmental Footprints and Scenario Analysis for Assessing the Impacts of the Agri-Food Industry on a Regional Economy: A Case Study in Spain. J. Ind. Ecol. 2015, 19, 618–627. [Google Scholar] [CrossRef]
- Gomiero, T. Soil Degradation, Land Scarcity and Food Security: Reviewing a Complex Challenge. Sustainability 2016, 8, 281. [Google Scholar] [CrossRef]
- Rosenzweig, C.; Iglesias, A.; Yang, X.B.; Epstein, P.R.; Chivian, E. Climate Change and Extreme Weather Events; Implications for Food Production, Plant Diseases, and Pests. Glob. Chang. Hum. Heal. 2001, 2, 90–104. [Google Scholar] [CrossRef]
- McMichael, A.J.; Woodruff, R.E.; Hales, S. Climate change and human health: Present and future risks. Lancet 2006, 367, 859–869. [Google Scholar] [CrossRef]
- Piao, S.; Ciais, P.; Huang, Y.; Shen, Z.; Peng, S.; Li, J.; Zhou, L.; Liu, H.; Ma, Y.; Ding, Y.; et al. The impacts of climate change on water resources and agriculture in China. Nature 2010, 467, 43–51. [Google Scholar] [CrossRef] [PubMed]
- Joint Research Centre. International Reference Life Cycle Data System (ILCD) Handbook-Recommendations for Life Cycle Impact Assessment in the European Context; European Joint Research Centre: Belgirate, Italy, 2011. [Google Scholar]
- Lehmann, A.; Bach, V.; Finkbeiner, M. Product Environmental Footprint in policy and market decisions—applicability and impact assessment. Integr. Environ. Assess. Manag. 2015, 11, 417–424. [Google Scholar] [CrossRef] [PubMed]
- Bach, V.; Finkbeiner, M. Approach to qualify decision support maturity of new versus established impact assessment methods—Demonstrated for the categories acidification and eutrophication. Int. J. Life Cycle Assess. 2016. [Google Scholar] [CrossRef]
- UNEP. SETAC Life Cycle Initiative Reaching Consensus on Recommended Environmental Indicators and Characterisation Factors for Life Cycle Impact Assessment (LCIA). Available online: http://www.lifecycleinitiative.org/reaching-consensus-on-recommended-environmental-indicators-and-characterisation-factors-for-life-cycle-impact-assessment-lcia/ (accessed on 6 Febuary 2016).
- European Commission Product Environmental Footprint News. Available online: http://ec.europa.eu/environment/eussd/smgp/ef_news.htm (accessed on 9 January 2017).
- Intergovernmental Panel on Climate Change. Working Group I Contribution to the IPCC Fifth Assessment Report—Summary for Policymakers; Intergovernmental Panel on Climate Change: Geneva, Switzerland, 2013; pp. 1–36. [Google Scholar]
- World Meteorological Organization. Scientific Assessment of Ozone Depletion: 2010 Global Ozone Research and Monitoring Project; Report No. 52; World Meteorological Organization: Geneva, Switzerland, 2010. [Google Scholar]
- European Vegetable Oil and Proteinmeal Industry Rapeseed & Soybeans. Available online: http://www.fediol.be/web/rapeseed/1011306087/list1187970106/f1.html (accessed on 7 Febuary 2016).
- Zentkovà, I.; Cvengrosova, E. The utilization of rapeseed for biofuels production in the EU. Visegr. J. Bioecon. Sustain. Dev. 2013, 2, 11–14. [Google Scholar] [CrossRef]
- Erickson, D.R. Practical Handbook of Soybean Processing and Utilization; Academic Press and AOCS Press: St. Louis, MO, USA, 2015. [Google Scholar]
- Carré, P.; Pouzet, A. Rapeseed market, worldwide and in Europe. OCL 2014, 21, D102. [Google Scholar] [CrossRef]
- U.S. Department of Agriculture—Economic Research Service World Oilseed Supply and Distribution. Available online: http://www.ers.usda.gov/data-products/oil-crops-yearbook.aspx (accessed on 6 Febuary 2016).
- US Department of Agriculture—Economic Research Service GAINS—Global Agricultural Information. Available online: http://gain.fas.usda.gov/Pages/Default.aspx (accessed on 6 Febuary 2016).
- Eaton Center Commodity Price Index (CPI). Available online: http://www.cooperindustries.com/content/public/en/power_systems/resources/cpi.html (accessed on 27 December 2016).
- Glithero, N.J.; Wilson, P.; Ramsden, S.J. Straw use and availability for second generation biofuels in England. Biomass Bioenergy 2013, 55, 311–321. [Google Scholar] [CrossRef] [PubMed]
- Sanz Requena, J.F.; Guimaraes, A.C.; Quirós Alpera, S.; Relea Gangas, E.; Hernandez-Navarro, S.; Navas Gracia, L.M.; Martin-Gil, J.; Fresneda Cuesta, H. Life Cycle Assessment (LCA) of the biofuel production process from sunflower oil, rapeseed oil and soybean oil. Fuel Process. Technol. 2011, 92, 190–199. [Google Scholar] [CrossRef]
- Liang, S.; Xu, M.; Zhang, T. Life cycle assessment of biodiesel production in China. Bioresour. Technol. 2013, 129, 72–77. [Google Scholar] [CrossRef] [PubMed]
- Iowa State University Soybean Drying and Storage. Available online: https://www.extension.iastate.edu/grain/files/Migrated/soybeandryingandstorage.pdf (accessed on 27 December 2016).
- Gawrysiak-Witulska, M.; Rudzińska, M.; Wawrzyniak, J.; Siger, A. The Effect of Temperature and Moisture Content of Stored Rapeseed on the Phytosterol Degradation Rate. J. Am. Oil Chem. Soc. 2012, 89, 1673–1679. [Google Scholar] [CrossRef] [PubMed]
- Mofijur, M.; Rasul, M.G.; Hyde, J.; Azad, A.K.; Mamat, R.; Bhuiya, M.M.K. Role of biofuel and their binary (diesel–biodiesel) and ternary (ethanol–biodiesel–diesel) blends on internal combustion engines emission reduction. Renew. Sustain. Energy Rev. 2016, 53, 265–278. [Google Scholar] [CrossRef]
- Panichelli, L.; Dauriat, A.; Gnansounou, E. Life cycle assessment of soybean-based biodiesel in Argentina for export. Int. J. Life Cycle Assess. 2009, 14, 144–159. [Google Scholar] [CrossRef]
- Hou, J.; Zhang, P.; Yuan, X.; Zheng, Y. Life cycle assessment of biodiesel from soybean, jatropha and microalgae in China conditions. Renew. Sustain. Energy Rev. 2011, 15, 5081–5091. [Google Scholar] [CrossRef]
- González-García, S.; García-Rey, D.; Hospido, A. Environmental life cycle assessment for rapeseed-derived biodiesel. Int. J. Life Cycle Assess. 2013, 18, 61–76. [Google Scholar] [CrossRef]
- Vázquez-Rowe, I.; Hospido, A.; Moreira, M.T.; Feijoo, G. Best practices in life cycle assessment implementation in fisheries. Improving and broadening environmental assessment for seafood production systems. Trends Food Sci. Technol. 2012, 28, 116–131. [Google Scholar] [CrossRef]
- Avadí, A.; Fréon, P. Life cycle assessment of fisheries: A review for fisheries scientists and managers. Fish. Res. 2013, 143, 21–38. [Google Scholar] [CrossRef]
- Dutta, S.; Rahmani, A.R.; Jhala, Y.V. Running out of time? The great Indian bustard Ardeotis nigriceps—status, viability, and conservation strategies. Eur. J. Wildl. Res. 2011, 57, 615–625. [Google Scholar] [CrossRef]
- Mohammed, G.; Indira, P. Dwindling status of great Indian Bustard—(Ardeotis nigriceps) of Rollapadu wild life sanctuary—a bioindicator of Grassland Ecosystem. Biosci. Discov. 2015, 6, 53–57. [Google Scholar]
- Lado, C. Socio-economic factors influencing sustainable water supply in Botswana. GeoJournal 1997, 41, 43–53. [Google Scholar] [CrossRef] [PubMed]
- Heijungs, R.; de Koning, A.; Guinée, J.B. Maximizing affluence within the planetary boundaries. Int. J. Life Cycle Assess. 2014, 19, 1331–1335. [Google Scholar] [CrossRef]
- Sandin, G.; Peters, G.M.; Svanström, M. Using the planetary boundaries framework for setting impact-reduction targets in LCA contexts. Int. J. Life Cycle Assess. 2015, 20, 1684–1700. [Google Scholar] [CrossRef]
- Fanning, A.L.; O’Neill, D.W. Tracking resource use relative to planetary boundaries in a steady-state framework: A case study of Canada and Spain. Ecol. Indic. 2016, 69, 836–849. [Google Scholar] [CrossRef]
- Canals, L.M.I.; Azapagic, A.; Doka, G.; Jefferies, D.; King, H.; Mutel, C.; Nemecek, T.; Roches, A.; Sim, S.; Stichnothe, H.; et al. Approaches for Addressing Life Cycle Assessment Data Gaps for Bio-based Products. J. Ind. Ecol. 2011, 15, 707–725. [Google Scholar] [CrossRef]
- Lehmann, A.; Bach, V.; Finkbeiner, M. EU Product Environmental Footprint—mid-term review of the pilot phase. Sustainability 2016, 8, 92. [Google Scholar] [CrossRef]
- European Commission The Product Environmental Footprint Pilots. Available online: http://ec.europa.eu/environment/eussd/smgp/pef_pilots.htm (accessed on 4 January 2017).
- Pimentel, D.; Zuniga, R.; Morrison, D. Update on the environmental and economic costs associated with alien-invasive species in the United States. Ecol. Econ. 2005, 52, 273–288. [Google Scholar] [CrossRef]
- Klinglmair, M.; Sala, S.; Brandão, M. Assessing resource depletion in LCA: A review of methods and methodological issues. Int. J. Life Cycle Assess. 2014, 19, 580–592. [Google Scholar] [CrossRef]


| Classes of IUCN Red List of Threatened Species | TSI Value |
|---|---|
| Least concern | 1 |
| Near threatened | 25 |
| Vulnerable | 50 |
| Endangered | 75 |
| Critically endangered | 100 |
| Classes Related to Use of Biotic Material | Quantitative Factor F |
|---|---|
| F: Food, feed and fuel | 1 |
| P1: Product, made from several materials | 0.5 |
| P2: Product, primarily made from biotic materials | 0 |
| Information Regarding Production as Main or Co-Product | Quantitative Value |
|---|---|
| Only main product | 0 |
| Mostly main product | 0.33 |
| Mostly co-product | 0.67 |
| Only co-product | 1 |
| Dimension | Category | Supply Chain Stage | |||
|---|---|---|---|---|---|
| Nature | Cultivation and Harvest of Soy Beans and Rapeseed | Processing (and Corresponding Steps) of Soy Beans and Rapeseed | Production Steps to Produce Biodiesel | ||
| Environmental constraints | Acidification | SB > RS | |||
| Eutrophication | SB > RS | ||||
| Climate change | SB > RS | ||||
| Social constraints | Compliance with environmental standards | SB = 11.0 | |||
| RS = 11.2 | |||||
| Compliance with social standards | SB = 9.0 | ||||
| RS = 7.0 | |||||
| Food security | SB = 25.4 | ||||
| RS = 19.1 | |||||
| Abiotic constraints | Phosphorus availability | SB = 9.64 | |||
| RS = 42.5 | |||||
| Land availability | SB = 7.6 | ||||
| RS = 7.7 | |||||
| Natural disasters | SB = 16.8 | ||||
| RS = 10.8 | |||||
| Water availability | SB = RS = 0.33 | ||||
| Socio-economic constraints | Recycling | SB = 1.3 × 10¹⁵ | |||
| RS = 6.3 × 10¹⁵ | |||||
| Storage complexity | SB = 0 | ||||
| RS = 0 | |||||
| Concentration of harvesting | SB = 9.4 × 10¹⁵ | ||||
| RS = 0 | |||||
| Occurrence as co-products | SB = 0 | SB = 6.7 × 10¹⁴ | |||
| RS = 0 | RS = 2.2 × 10¹⁴ | ||||
| Price fluctuations | SB = 9.4 × 10¹⁵ | ||||
| RS = 6.3 × 10¹⁴ | |||||
| Trade barriers | SB = 2.2 × 10¹⁵ | SB = 2.0 × 10¹⁵ | |||
| RS = 0 | RS = 0 | ||||
| Demand growth | SB = 1.6 × 10¹⁵ | SB = 2.3 × 10¹⁵ RS = 3.5 × 10¹⁴ | SB = 9.1 × 10¹⁵ | ||
| RS = 9.2 × 10¹⁴ | RS = 1.4 × 10¹⁵ | ||||
| Political instability | SB = 1.8 × 10¹⁵ | SB = 2.2 × 10¹⁵ | |||
| RS = 0 | RS = 0 | ||||
| Concentration of resources | SB = 0 | ||||
| RS = 0 | |||||
| Physical constraints | Replenishment rate | SB = 0 | |||
| RS = 0 | |||||
| Anthropogenic availability | SB = 1 | ||||
| RS = 1 | |||||
| Biotic resource depletion | SB = 0 | ||||
| RS = 0 | |||||
© 2017 by the authors; licensee MDPI, Basel, Switzerland. This article is an open access article distributed under the terms and conditions of the Creative Commons Attribution (CC-BY) license (http://creativecommons.org/licenses/by/4.0/).
Share and Cite
Bach, V.; Berger, M.; Finogenova, N.; Finkbeiner, M. Assessing the Availability of Terrestrial Biotic Materials in Product Systems (BIRD). Sustainability 2017, 9, 137. https://doi.org/10.3390/su9010137
Bach V, Berger M, Finogenova N, Finkbeiner M. Assessing the Availability of Terrestrial Biotic Materials in Product Systems (BIRD). Sustainability. 2017; 9(1):137. https://doi.org/10.3390/su9010137
Chicago/Turabian StyleBach, Vanessa, Markus Berger, Natalia Finogenova, and Matthias Finkbeiner. 2017. "Assessing the Availability of Terrestrial Biotic Materials in Product Systems (BIRD)" Sustainability 9, no. 1: 137. https://doi.org/10.3390/su9010137