Article

A Novel Approach for Assessing the Performance of Sustainable Urbanization Based on Structural Equation Modeling: A China Case Study

1
School of Construction Management and Real Estate, Chongqing University, Chongqing 40045, China
2
International Research Center for Sustainable Built Environment, Chongqing University, Chongqing 40045, China
*
Author to whom correspondence should be addressed.
Sustainability 2016, 8(9), 910; https://doi.org/10.3390/su8090910
Submission received: 15 June 2016 / Revised: 31 August 2016 / Accepted: 5 September 2016 / Published: 7 September 2016
(This article belongs to the Section Sustainable Urban and Rural Development)

Abstract

:
The rapid urbanization process has brought problems to China, such as traffic congestion, air pollution, water pollution and resources scarcity. Sustainable urbanization is commonly appreciated as an effective way to promote the sustainable development. The proper understanding of the sustainable urbanization performance is critical to provide governments with support in making urban development strategies and policies for guiding the sustainable development. This paper utilizes the method of Structural equation modeling (SEM) to establish an assessment model for measuring sustainable urbanization performance. Four unobserved endogenous variables, economic variable, social variable, environment variable and resource variable, and 21 observed endogenous variables comprise the SEM model. A case study of the 31 provinces in China demonstrates the validity of the SEM model and the analysis results indicated that the assessment model could help make more effective policies and strategies for improving urban sustainability by recognizing the statue of sustainable urbanization.

1. Introduction

It is well known that urbanization plays a significant role in improving economic and social development, especially for developing countries [1,2,3]. In the past years, the development of world urbanization has represented a dramatic growth tendency [4]. For example, in China, according to the statistics of the Ministry of Construction of China, the urbanization rate in China was only 17.9% in 1978 [5], but this rate first passed 50% in 2011 [6]. Moreover, it has been predicted that the urbanization rate of China will reach 70% in 2030 and nearly one billion people will live in urban areas [7]. However, the rapid urbanization process is also companied with problems, such as traffic congestion, air pollution, water pollution and resources scarcity [1,8,9]. In order to solve or avoid these problems in the future urbanization process, a consensus has been reached that the pattern of sustainable urbanization should be adopted to guide urbanization development [9,10,11,12].
Various strategies and policies have been attempted by many governments and organizations around the world to promote sustainable urbanization development. Certainly, the accurate assessment of the results of sustainable urbanization performance plays an important guiding role in better understanding the status of the process of urbanization and providing supports to make the relevant urban development strategies and policies for guiding the sustainable development [4,13,14,15]. Many researchers have assessed the performance of sustainable urbanization from different aspects using various methods [4,10,11,15,16,17,18,19,20]. Among them, a comprehensive indicator system is widely used in academia and practice to evaluate the sustainable urbanization performance. However, although the indicator system can assess the sustainable urbanization performance quantitatively and comprehensively, this kind of method has some shortcomings and applicable restrictions. For example, Huang et al. [21] pointed out that as urban development is a complex system including various variables, the indicators cannot reflect the systemic interactions among these variables and also cannot provide normative indications in what direction the urbanization should be developed. This is echoed by Uwasu and Yabar [14] who stated that the existing sustainable indicators and tools may ignore some important features of sustainability and do not explicitly address the relationships between environmental aspects and socio-economic aspects. Zhao and Chai [4] appreciated that setting the interaction weights between the indicators is sometimes subjective, which would decrease the accurate level of evaluation results.
Therefore, there is a need to introduce a new method for determining the weights between indicators objectively and considering the interactions among the indicators. This paper aims to: (1) examine the existing literatures on comprehensive indicator system to assess the performance of sustainable urbanization; (2) establish an assessment model to evaluate the performance of sustainable urbanization based on the principle of Structural equation modeling; and (3) demonstrate the validity of the model by applying the collected data of the 31 provinces in China to the proposed model.

2. Literature Review

2.1. Constructs of Sustainable Urbanization

As pointed out by Tan et al. [12], the expansion of urban areas and growth of the urban population are the key indexes of urbanization. Urbanization is widely considered as a major variable affecting the performance of sustainable development for a city or area. Sustainable development is commonly quoted as that “development must meet the needs of the present without compromising the ability of future generations to meet their own needs” [22]. Accordingly, the concept of sustainable urbanization is usually defined as “urbanization practices that complies with sustainable development principles” [1,23]. There is a consensus that sustainable urbanization can be assessed from four dimensions, namely, economic, social, environment and resource sustainability of a city [24,25,26]. The economic dimension plays an important role for diving urbanization process of a city [24]. Previous study suggests that good economic sustainability during urbanization is characterized by several indicators such as a high GDP level and stable economic condition [27]. Social development is also appreciated as a main purpose of urbanization. As opined by Dye [28], urbanization should bring social benefits in the areas of literacy, political participation, education and health. Other studies emphasize the equality of education, medical treatment, social safety and good infrastructure for good social sustainability [1,27,29]. There are two major environmental problems induced by rapid urbanization that are commonly appreciated, namely, ecological degradation and environmental pollution [30,31]. As appreciated by previous researchers, better environmental sustainability during the urbanization process should be the case where population growth and human activity exert the least pressure on air, land, water, and biodiversity [32,33,34]. Furthermore, urbanization process will consume a large scale of natural resource, including land, water and fossil energy. At the same time, consumption of fossil fuels generates large amounts of greenhouse gases, resulting in the problems of global warming and acid rain [12]. Therefore, effective resource utilization and less use of fossil energy are considered as key indicators of good resource sustainability [9].

2.2. Evaluation of Sustainable Urbanization

Numerous indicators and assessment tools have been developed and introduced by previous researchers to assess the performance of sustainable urbanization. One main aspect of the comprehensive indicator system is to identify the indicators [35,36,37]. Due to different purposes and criteria, there exist some differences among the indicators identified to assess the sustainable urbanization performance by different researchers. For example, Huang and Chen [19] selected 15 indicators from six categories, land use, population, transportation, water resource, solid waste and waste water treatment, to evaluate the performance of the urban sustainability of Taipei. Shen et al. [38] discussed the urban sustainability indicators comprehensively through conducting comparison between various practices and summarized the indicators from four different dimensions, environmental, economic, social and governance, with 115 indicators. Considering the data availability, the indexes for assessing the urbanization quality introduced by Zhang [10] consist of thirty-two indicators. In assessing the urban sustainability of Chinese megacities, Huang et al. [20] listed eight indicators, such as City Development Index and Gini coefficient.
These existing indicators are good references for studying the development of sustainable urbanization. Another main aspect of the comprehensive indicator system is to determine the weights of the identified indicators. There are two main categories of methods in determining the weights: subjective method and objective method. For the subjective method, Delphi method and Analytic Hierarchy process (AHP) are usually used for determining the weights [39,40,41]. However, in application of Delphi method and Analytic Hierarchy process, the results greatly depend on the experience of experts. Therefore, because experts have different knowledge backgrounds, the accuracy of the weights would be influenced by the experts’ knowledge. For the objective method, Principal component analysis (PCA) and Entropy method are often used [42,43,44]. Although the Entropy method and Principal component analysis can eliminate the disadvantage of the experts’ knowledge and is a more commonly used method compared with the subjective method. There also exist some shortcomings in applying these two methods [45]. For example, to some extent, there will be a phenomenon of weighted average by Entropy method and this method cannot be used to determine the weight of panel data. Furthermore, only based on the difference with the data to decide the weights, the results may not agree with the importance of the index itself and cannot reflect the relative importance between the indicators.
There are few previous studies considering the interactional relationship between the selected indicators when determining the weights of the indicators. The traditional assessment methods usually assumed that all the indicators can directly evaluate the sustainable urbanization performance without error. However, in fact, due to the limits of original data, there must be observational errors between the dependent and independent variables. If these errors are ignored, the evaluation results of sustainable urbanization performance cannot reflect true level. However, the method of Structural equation model can effectively solve the above questions. Structural equation model (SEM) is an important branch of the area of applied statistics. It is widely used in different research areas, such as sociology, management science, behavioral science and econometrics [46,47,48,49]. This method has the following advantages: handling multiple dependent variables at the same time; robustness to the observational error between the dependent and independent variables; and allowing the existence of latent variable that consist of multiple observation indexes when the latent variables are hard to measure. It is commonly appreciated that the Structural equation model is an effective tool for analyzing the relationships between the latent variables and observation indexes in the model.
Structural equation model has also been applied in evaluation process. For example, Liu and You [50] adopted the Structural equation model to evaluating the development level of urban eco-system. Guan et al. [51] applied the Structural equation model to construct a set of urban competitiveness evaluation index systems, and found that it provided high accuracy and reliability for calculating performance of urban system. Mo et al. [52] utilized the SEM to evaluate quantitatively the passengers’ satisfaction level to the service of urban pubic bus system. Yu and Yang [53] selected five factors to SEM model to evaluate the regional tourism industry competitiveness. However, there are few researches focusing on applying SEM to sustainable urbanization. This research will apply SEM to assess the performance of sustainable urbanization in China.

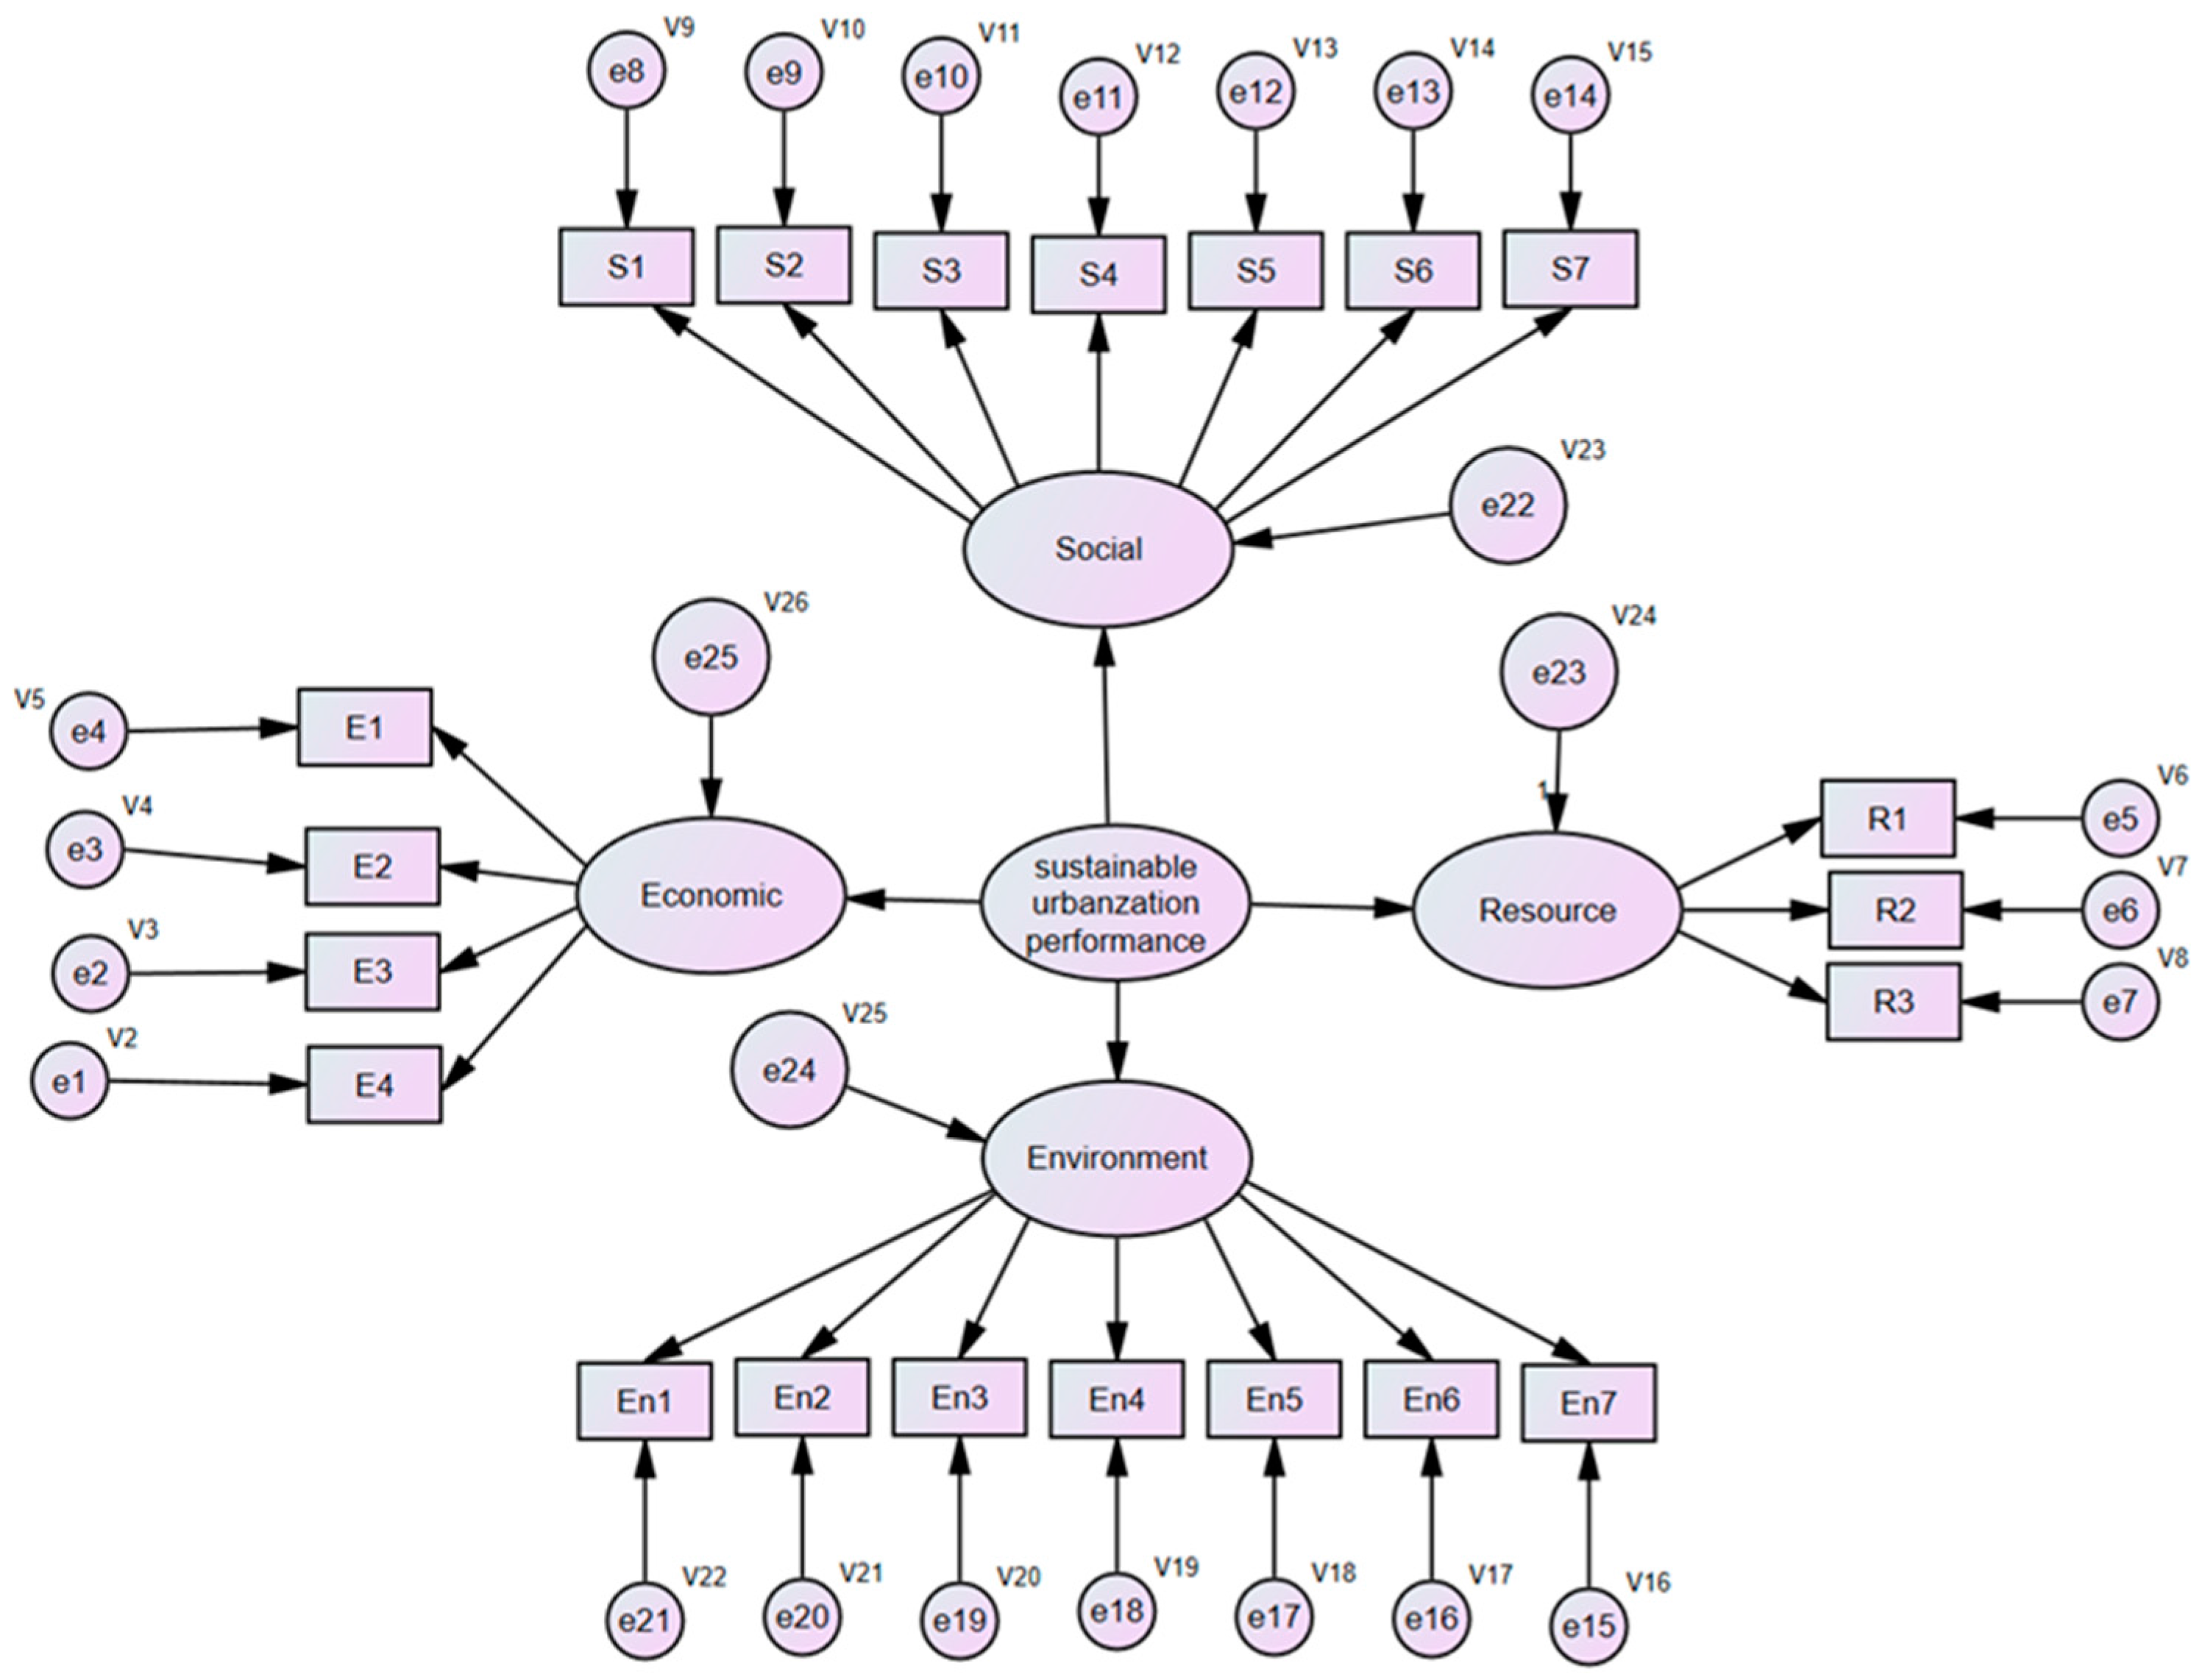
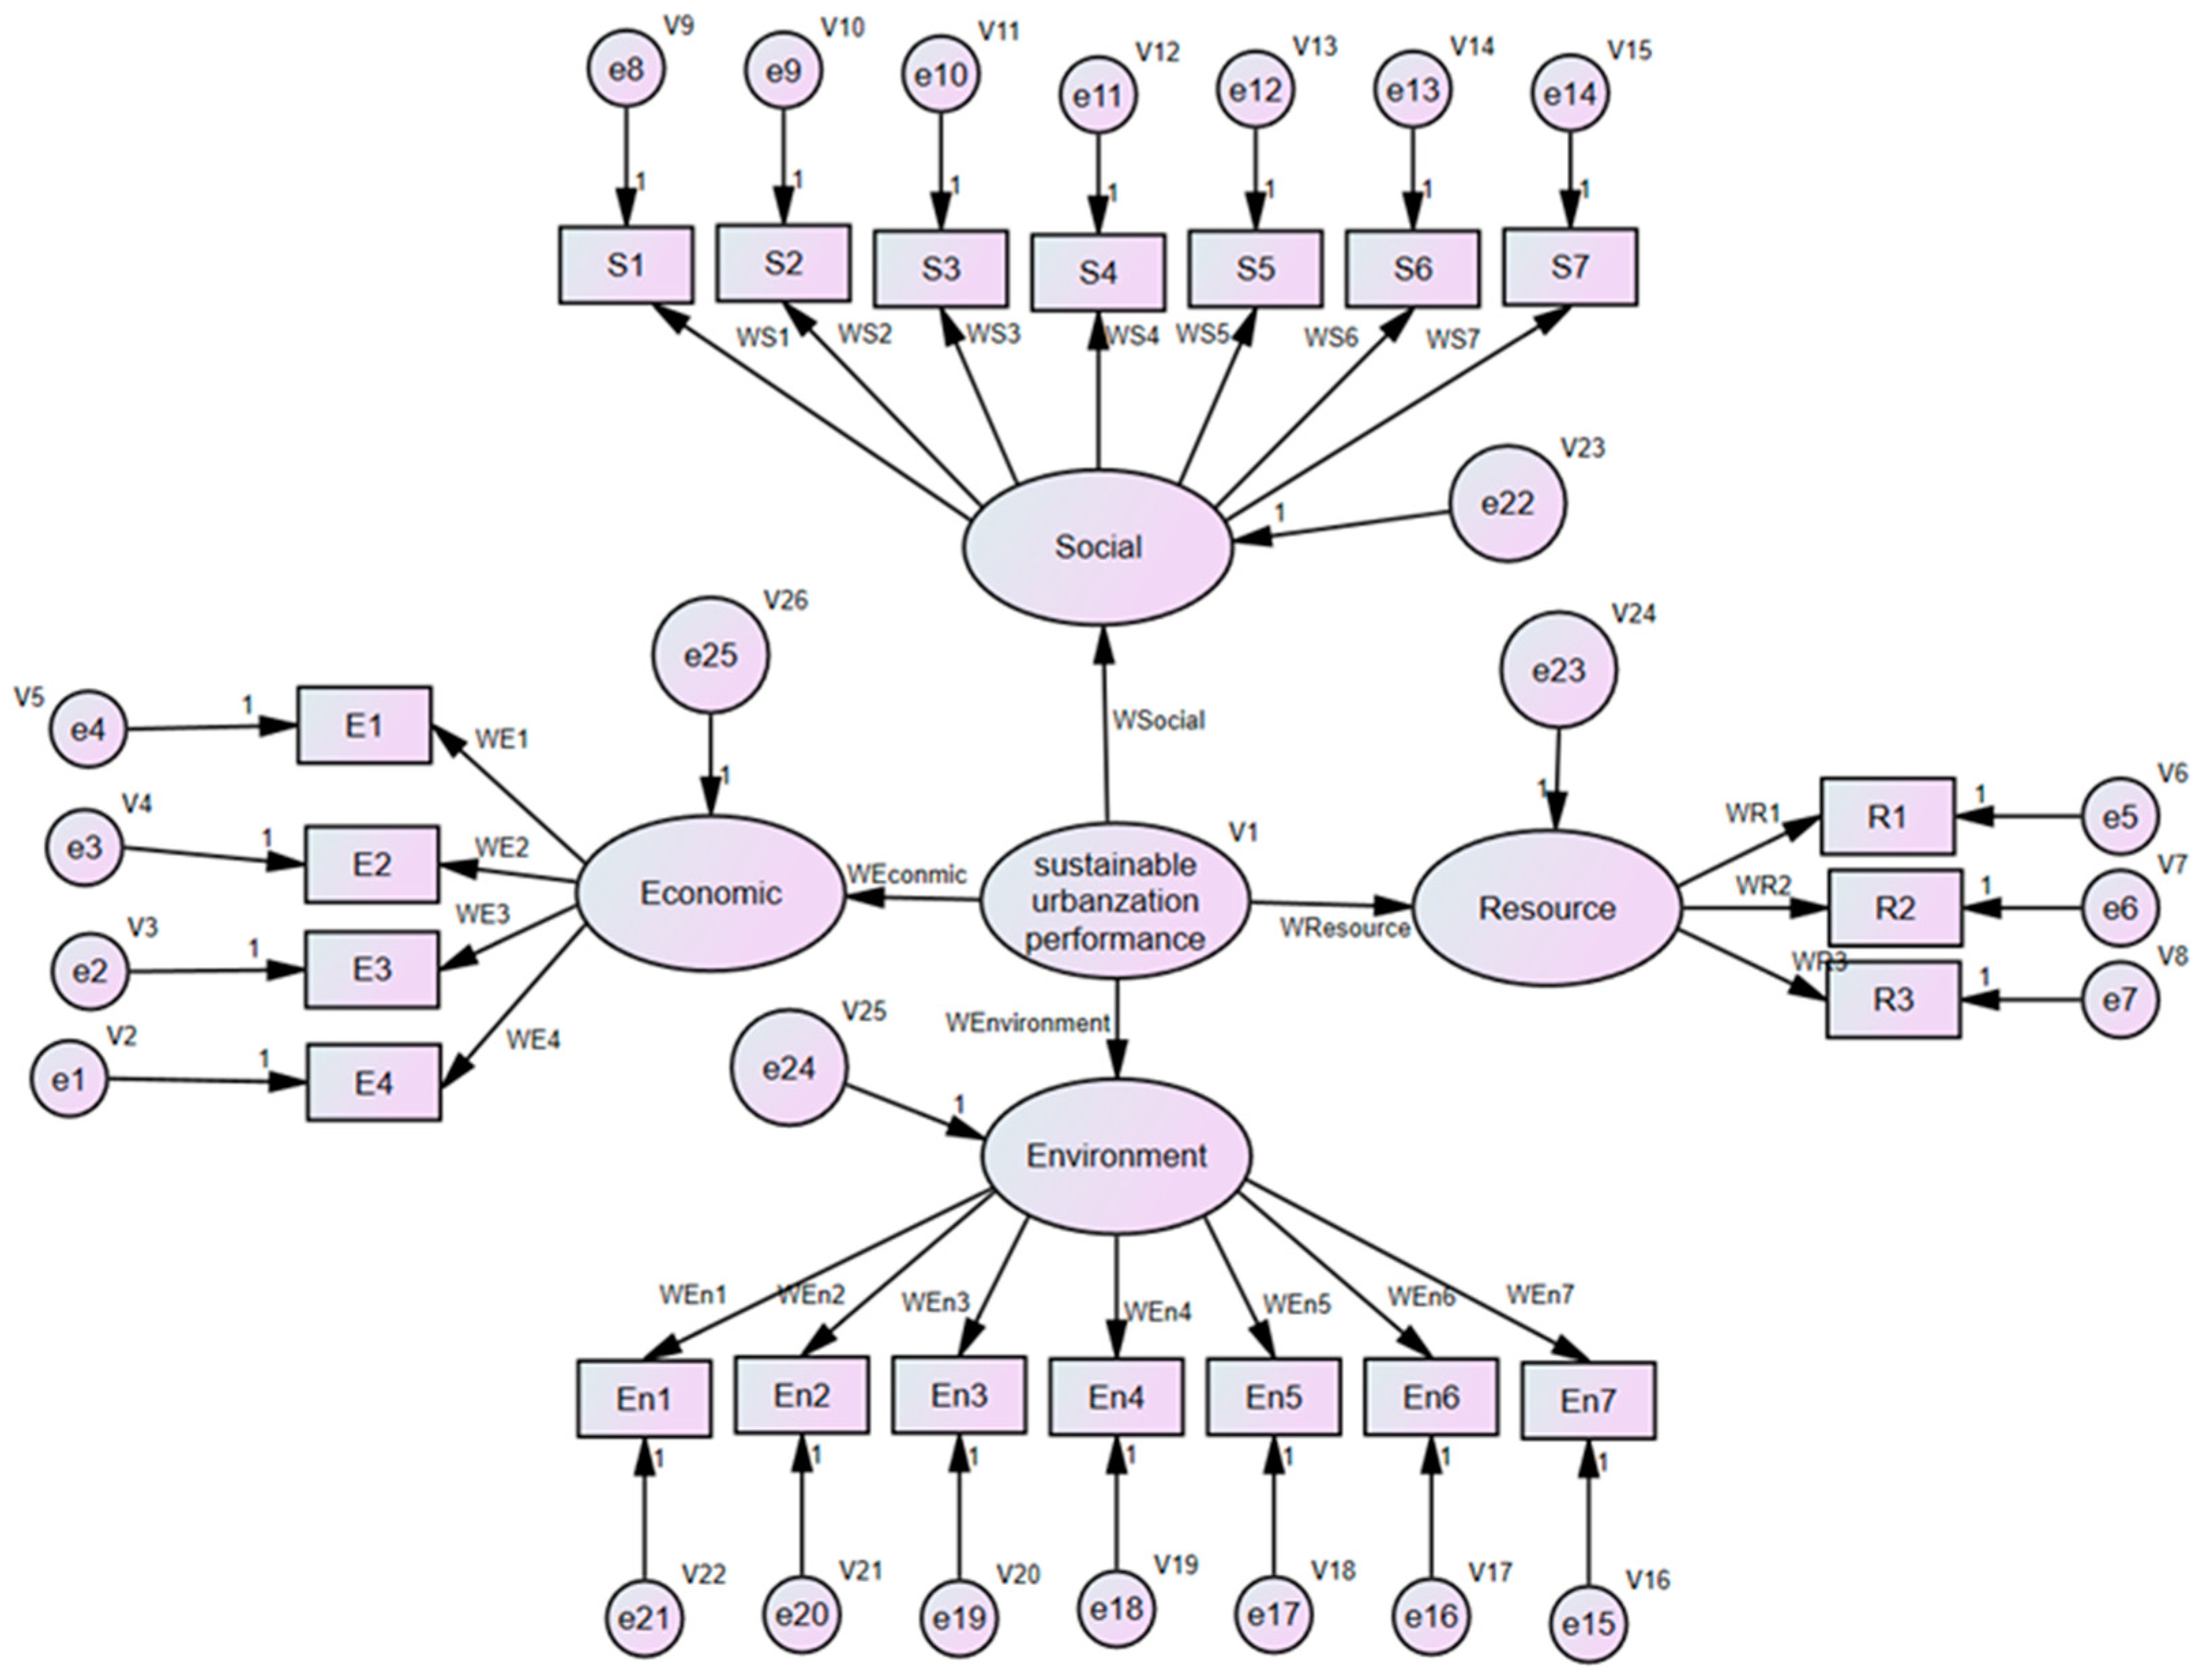
3. A New Assessment Model Based on Structural Equation Modeling

3.1. Conceptual Framework of the Assessment Model

Based on the principle of the second-order CFA model, one of the forms of the Structural equation model, this study established the conceptual framework of the assessment model for evaluating the performance of sustainable urbanization. Based on the literature, there are different dimensions and indicators for assessing the sustainable urbanization performance by previous studies. In this study, according to the indicators system established by McKinsey Company and Tsinghua University in China (UCI) [54], which is the authority in the practice of urban development in China, four dimensions—economic, social, environment and resource—with 21 indicators were identified as critical variables for evaluating the sustainable urbanization performance, as shown in Table 1.
According to the indicators in Table 1, the variables consisting of the conceptual framework of the assessment model are identified, as shown in Figure 1, and the performance of sustainable urbanization is measured by four unobserved endogenous variables: economic variable, social variable, environment variable and resource variable. Then, 21 observed endogenous variables are used to describe and quantify the four unobserved endogenous variables.

3.2. Model Solution

According to the principle of using SEM method, the correlations among the variables, factor loading and the direct effects connecting the variables should be calculated. The calculations are performed through two main components of SEM model: the measurement model telling the relations between latent variables and indicators, and the structural model showing the potential causal dependencies between endogenous and exogenous variables.
The basic equation of the measurement model is defined as [48]:
X = Λ x ξ + δ
Y = Λ y η + ε
where X is the vector of exogenous manifest variables; Λx denotes the factor loading matrix for the effects of the exogenous manifest variables on exogenous latent variables; ξ represents the vector of exogenous latent variables; δ is vector of measuring error; Y is the vector of endogenous manifest variables; Λy denotes the factor loading matrix for the effects of endogenous manifest variables on endogenous latent variables; η represents the vector of endogenous latent variables; and ε vector of measuring error.
The basic equation of the structural model is defined as [48]:
η = β η + γ ξ + ζ
where η is the vector of endogenous latent variables; ξ denotes the vector of exogenous latent variables; β represents the matrix of path coefficients associated with η; γ is matrix of path coefficients associated with ξ and η; and ζ is residual vector of the equation.

3.3. Assess the Performance of the Sustainable Urbanization

3.3.1. Normalization for All Indicators

In order to utilize the collected data of the 21 indicators in the SEM model, the data first need be normalized. For those positive indicators, for example, Government investment in R&D per capita, a larger value indicates a better result. Therefore, xij is one of original value of indicator i, and max(xi) is the maximum value for the i indictor across all the data. Pij is the proximity of xij to max(xi). Thus, the normalized value Pij can be obtained from the following equation [43]:
P i j = x i j max ( x i )
On the contrary, for the negative indicators, such as Urban unemployment rate, a smaller value indicates a better result. Therefore, xij is one of original value of indicator i, and min(xi) is the minimum value for the i indictor across all the data. Pij is the proximity of xij to min(xi). Thus, the normalized value Pij can be obtained from the following equation:
P i j = min ( x i ) x i j

3.3.2. Weights for All Indicators

To solve SEM model with the normalized data, various fit indices were adopted to assess the fit of the SEM model, such as goodness-of-fit index (GFI), adjusted goodness-of-fit index (AGFI), comparative fit index (CFI) and root mean square error of approximation (RMSEA). In the final refined SEM, each variable owns a factor loading value, Wi, as shown in Figure 2.
The weight of an indicator reflects its importance in the overall indicator system. This importance can be reflected by the factor loading values in the SEM model. The higher the factor loading values, the more consistent the observed endogenous variables are with the latent variables [46,47]. This means the observed variable with the higher factor loadings had more influence on the latent variables, since it possesses the highest-level characteristics of its factor. In line with the different impacts of the variables, the weights of the indicators to assess the performance of the sustainable urbanization can be obtained according the value of the factor loading. For example, qE1, the weight of the indicator E1 of the economic dimension, can be calculated by the following equation:
q E 1 = W E 1 W E 1 + W E 2 + W E 3 + W E 4
Similarly, the weights of other indicators and the four dimensions all can be obtained.

3.3.3. Evaluation of Sustainable Urbanization Performance

After determining all the weights of the indicators, the performance of each dimension—economic performance (ep), social performance (sp), environment performance (enp), and resource performance (rp)—can be calculated according Equations (7)–(10):
e p = q e 1 × p e 1 j + q e 2 × p e 2 j + q e 3 × p e 3 j + q e 4 × p e 4 j
s p = q S 1 × p S 1 j + q S 2 × p S 2 j + q S 3 × p S 3 j + q S 4 × p S 4 j + q S 5 × p S 5 j + q S 6 × p S 6 j + q S 7 × p S 7 j
e n p = q e n 1 × p e n 1 j + q e n 2 × p e n 2 j + q e n 3 × p e n 3 j + q e n 4 × p e n 4 j + q e n 5 × p e n 5 j + q e n 6 × p e n 6 j + q e n 7 × p e n 7 j
r p = q r 1 × p r 1 j + q r 2 × p r 2 j + q r 3 × p r 3 j + q r 4 × p r 4 j
In Equations (7)–(10), for example, pe1j denotes the value of indicator E1 after normalization; ps1j denotes the value of indicator S1 after normalization; pen1j denotes the value of indicator En1 after normalization; and pr1j denotes the value of indicator R1 after normalization.
Accordingly, the whole sustainable urbanization performance (sup) will be calculated as follows:
sup = e p × p e p + s p × p s p + e n p × p e n p + r p × p r p

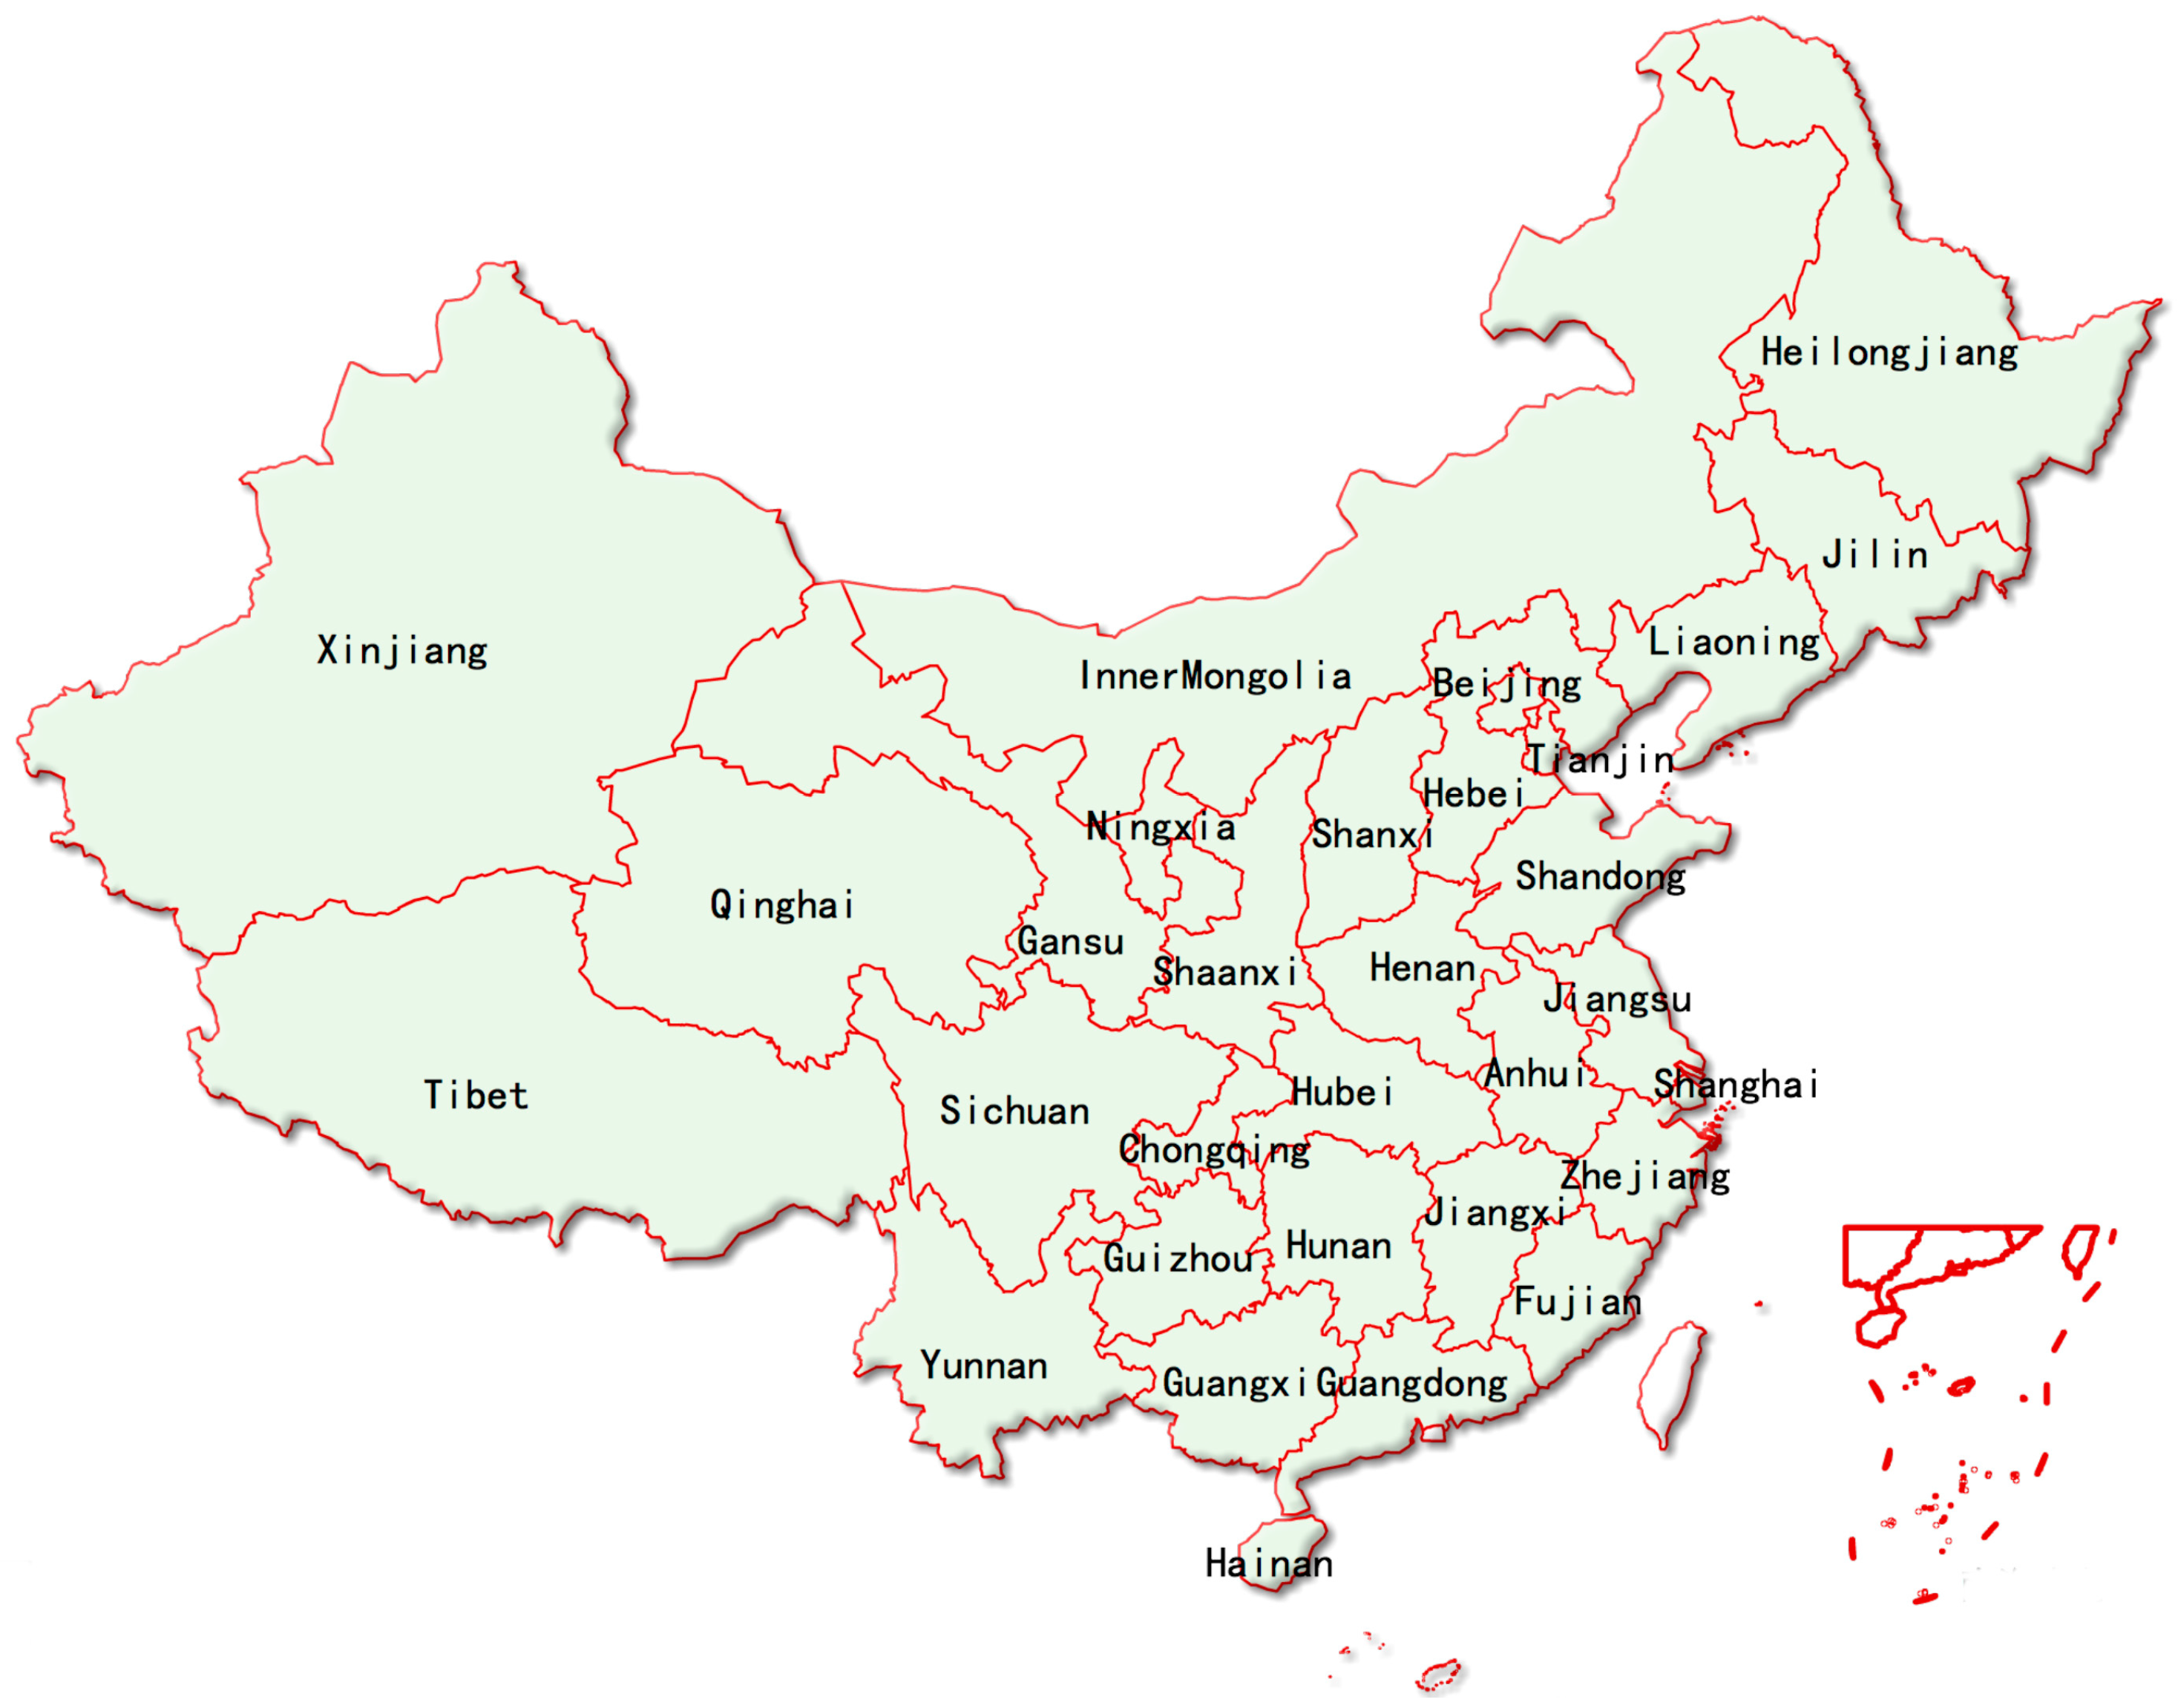
4. Applications of the New Assessment Model

4.1. Data Collection and Preparation

The established SEM assessment model is used to evaluate the sustainable urbanization performance of 31 provinces and municipalities in Mainland China. The data for the 21 indicators from 2007–2014 are collected from the National Bureau of statistics of China [55]. Figure 3 shows the map of the 31 provinces and municipalities in Mainland China in the case study. Then, the collected data are all normalized according to Equations (4) and (5). There are no missing data of the 21 indicators for the 31 provinces and municipalities.

4.2. Construct Validity

After the normalization process, the reliability test of the data was conducted and the Cronbach’s α value of 0.909 indicated that the overall collected data result in a high degree of reliability, well above the cut-off value of 0.7 [56]. Thus, the data used in the analysis can be considered reliable. Then, discriminant validity of the four dimensions—economic, social, environment and resource—were conducted. A successful evaluation of discriminant validity suggests that two dimensions, such as economic and social aspects, measure two different constructs. In this study, the coefficient R in Equation (12) is used for measuring the discriminant validity between two dimensions [57].
R = r x y r x x . r y y
In Equation (12), rxy is correlation between variable x and variable y, rxx is the reliability of the variable x, and ryy is the reliability of variable y. If the value of R is less than 0.85, it indicates that discriminant validity likely exists between the variable x and y. The value of R among the four dimensions in this study are shown in Table 2.
In Table 2, we can conclude that discriminant validity exists between economic and environment, social and environment, environment and resource for the value of R is less than 0.85.

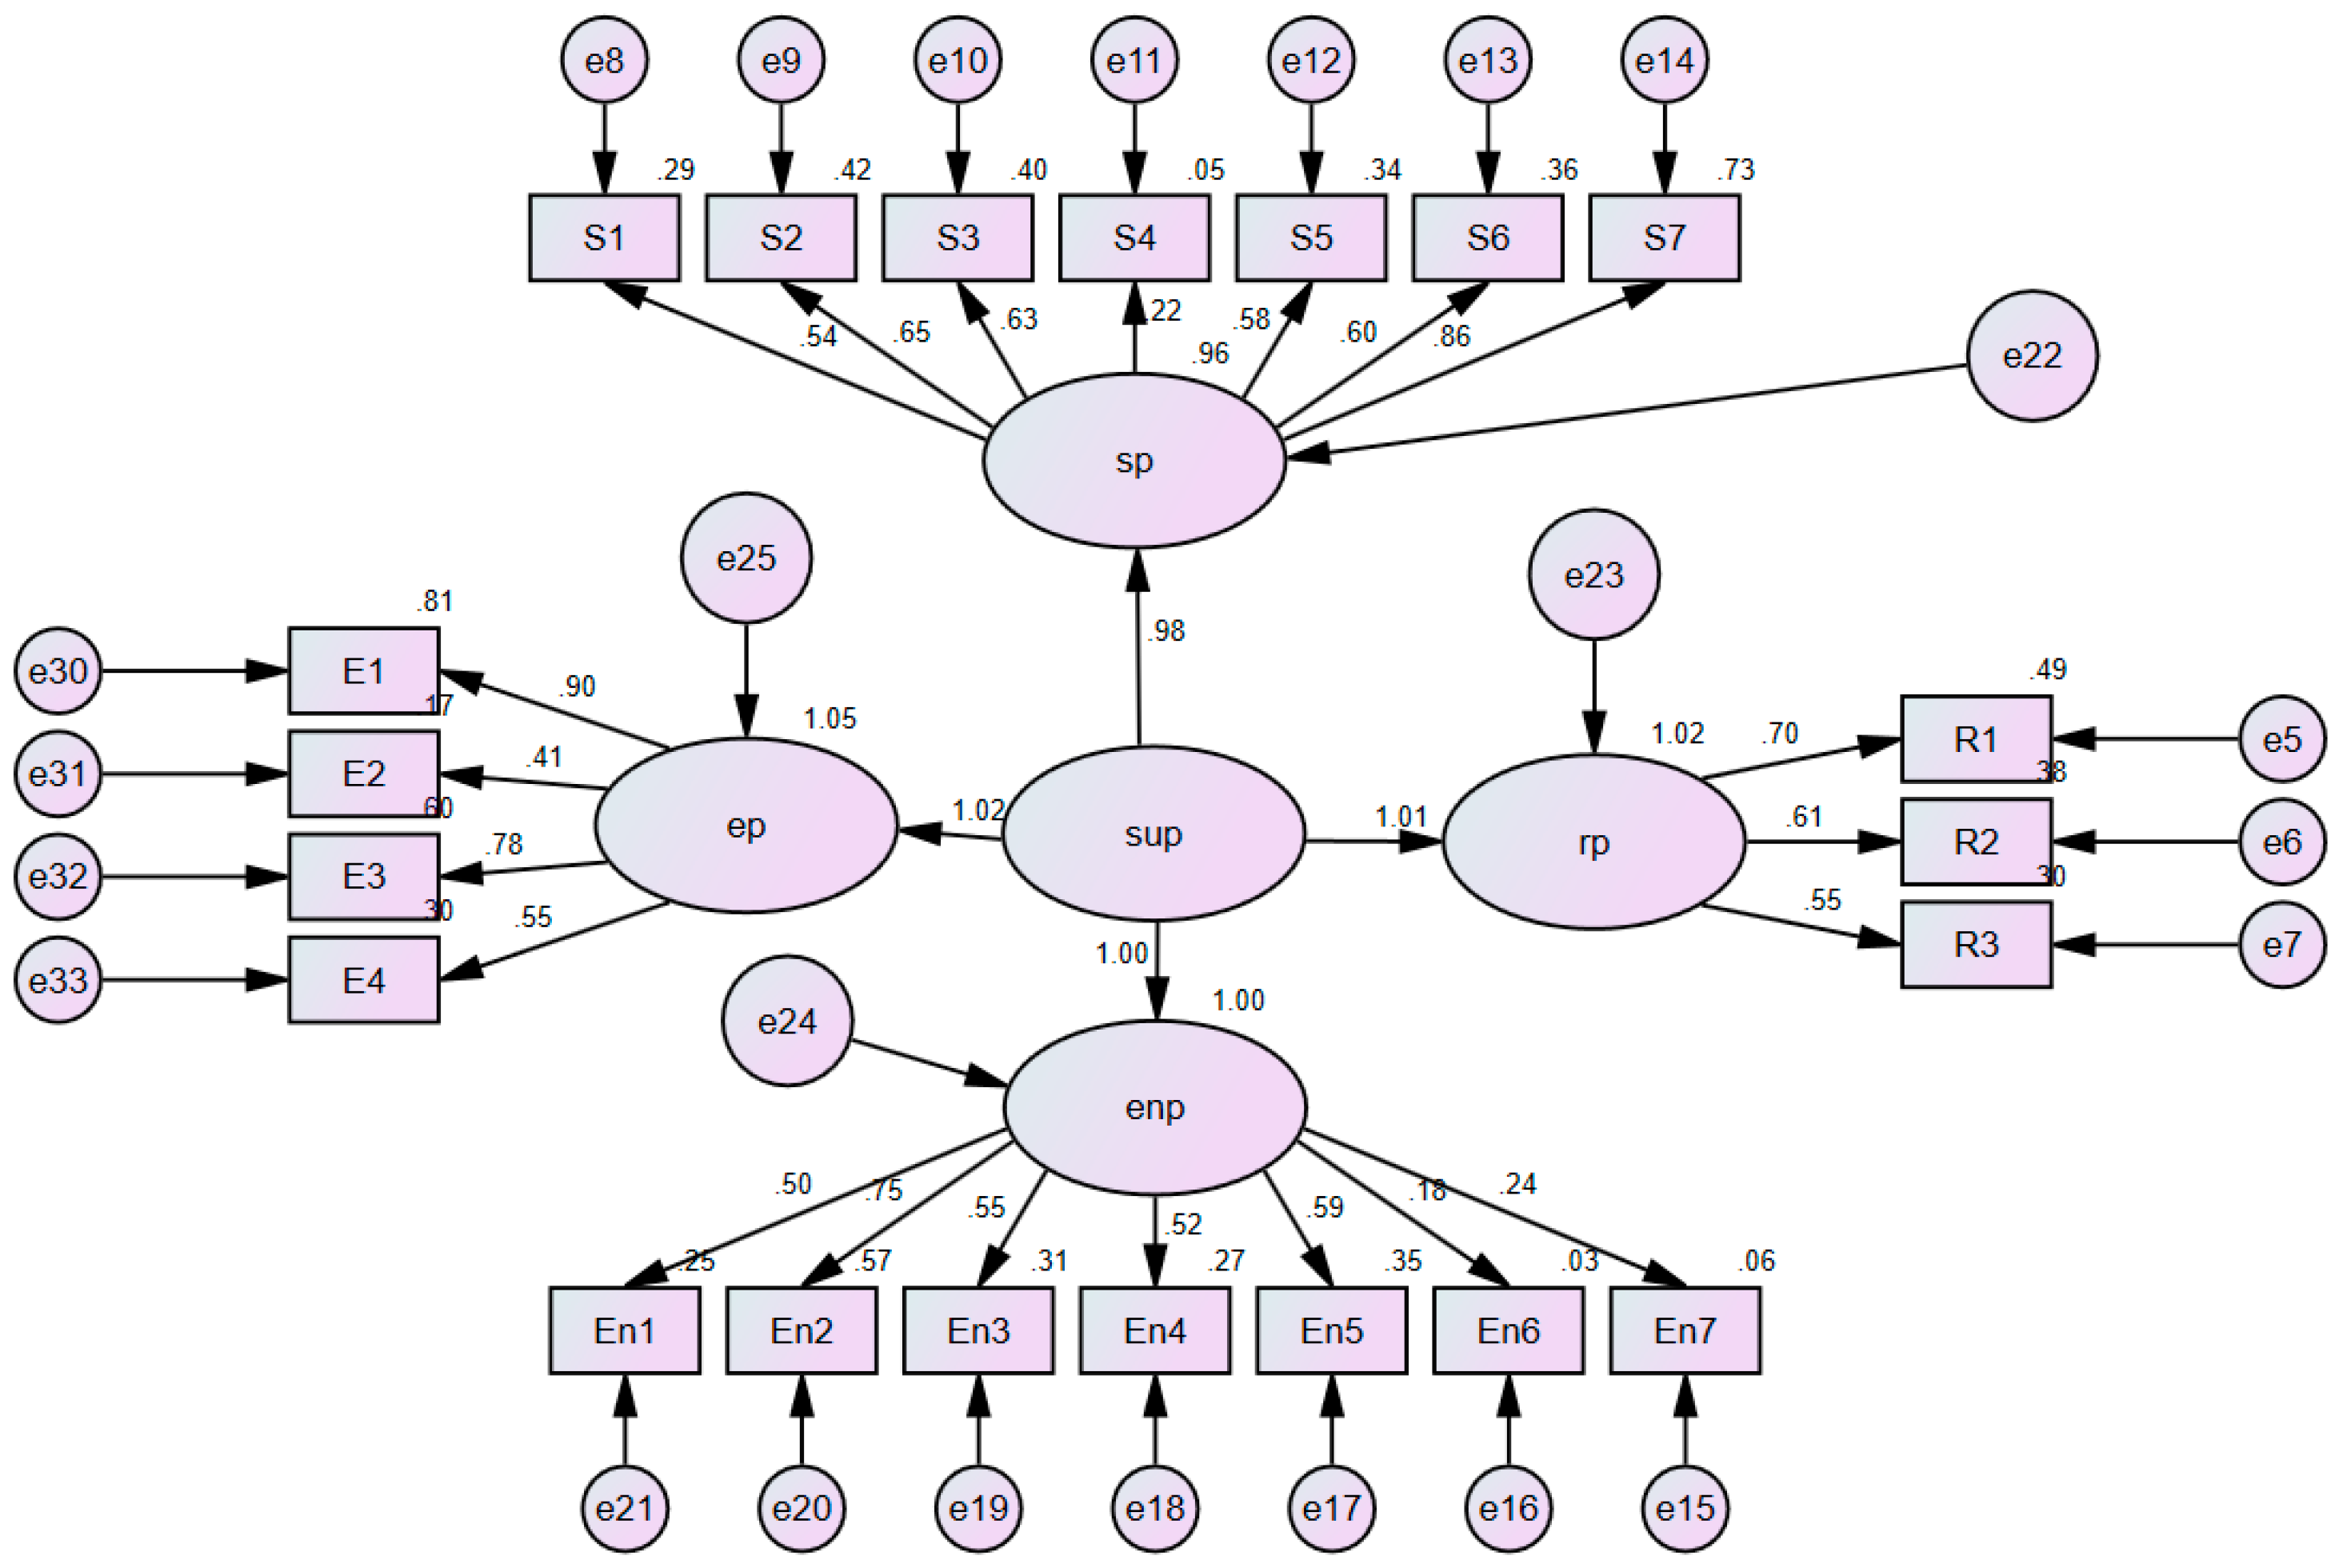
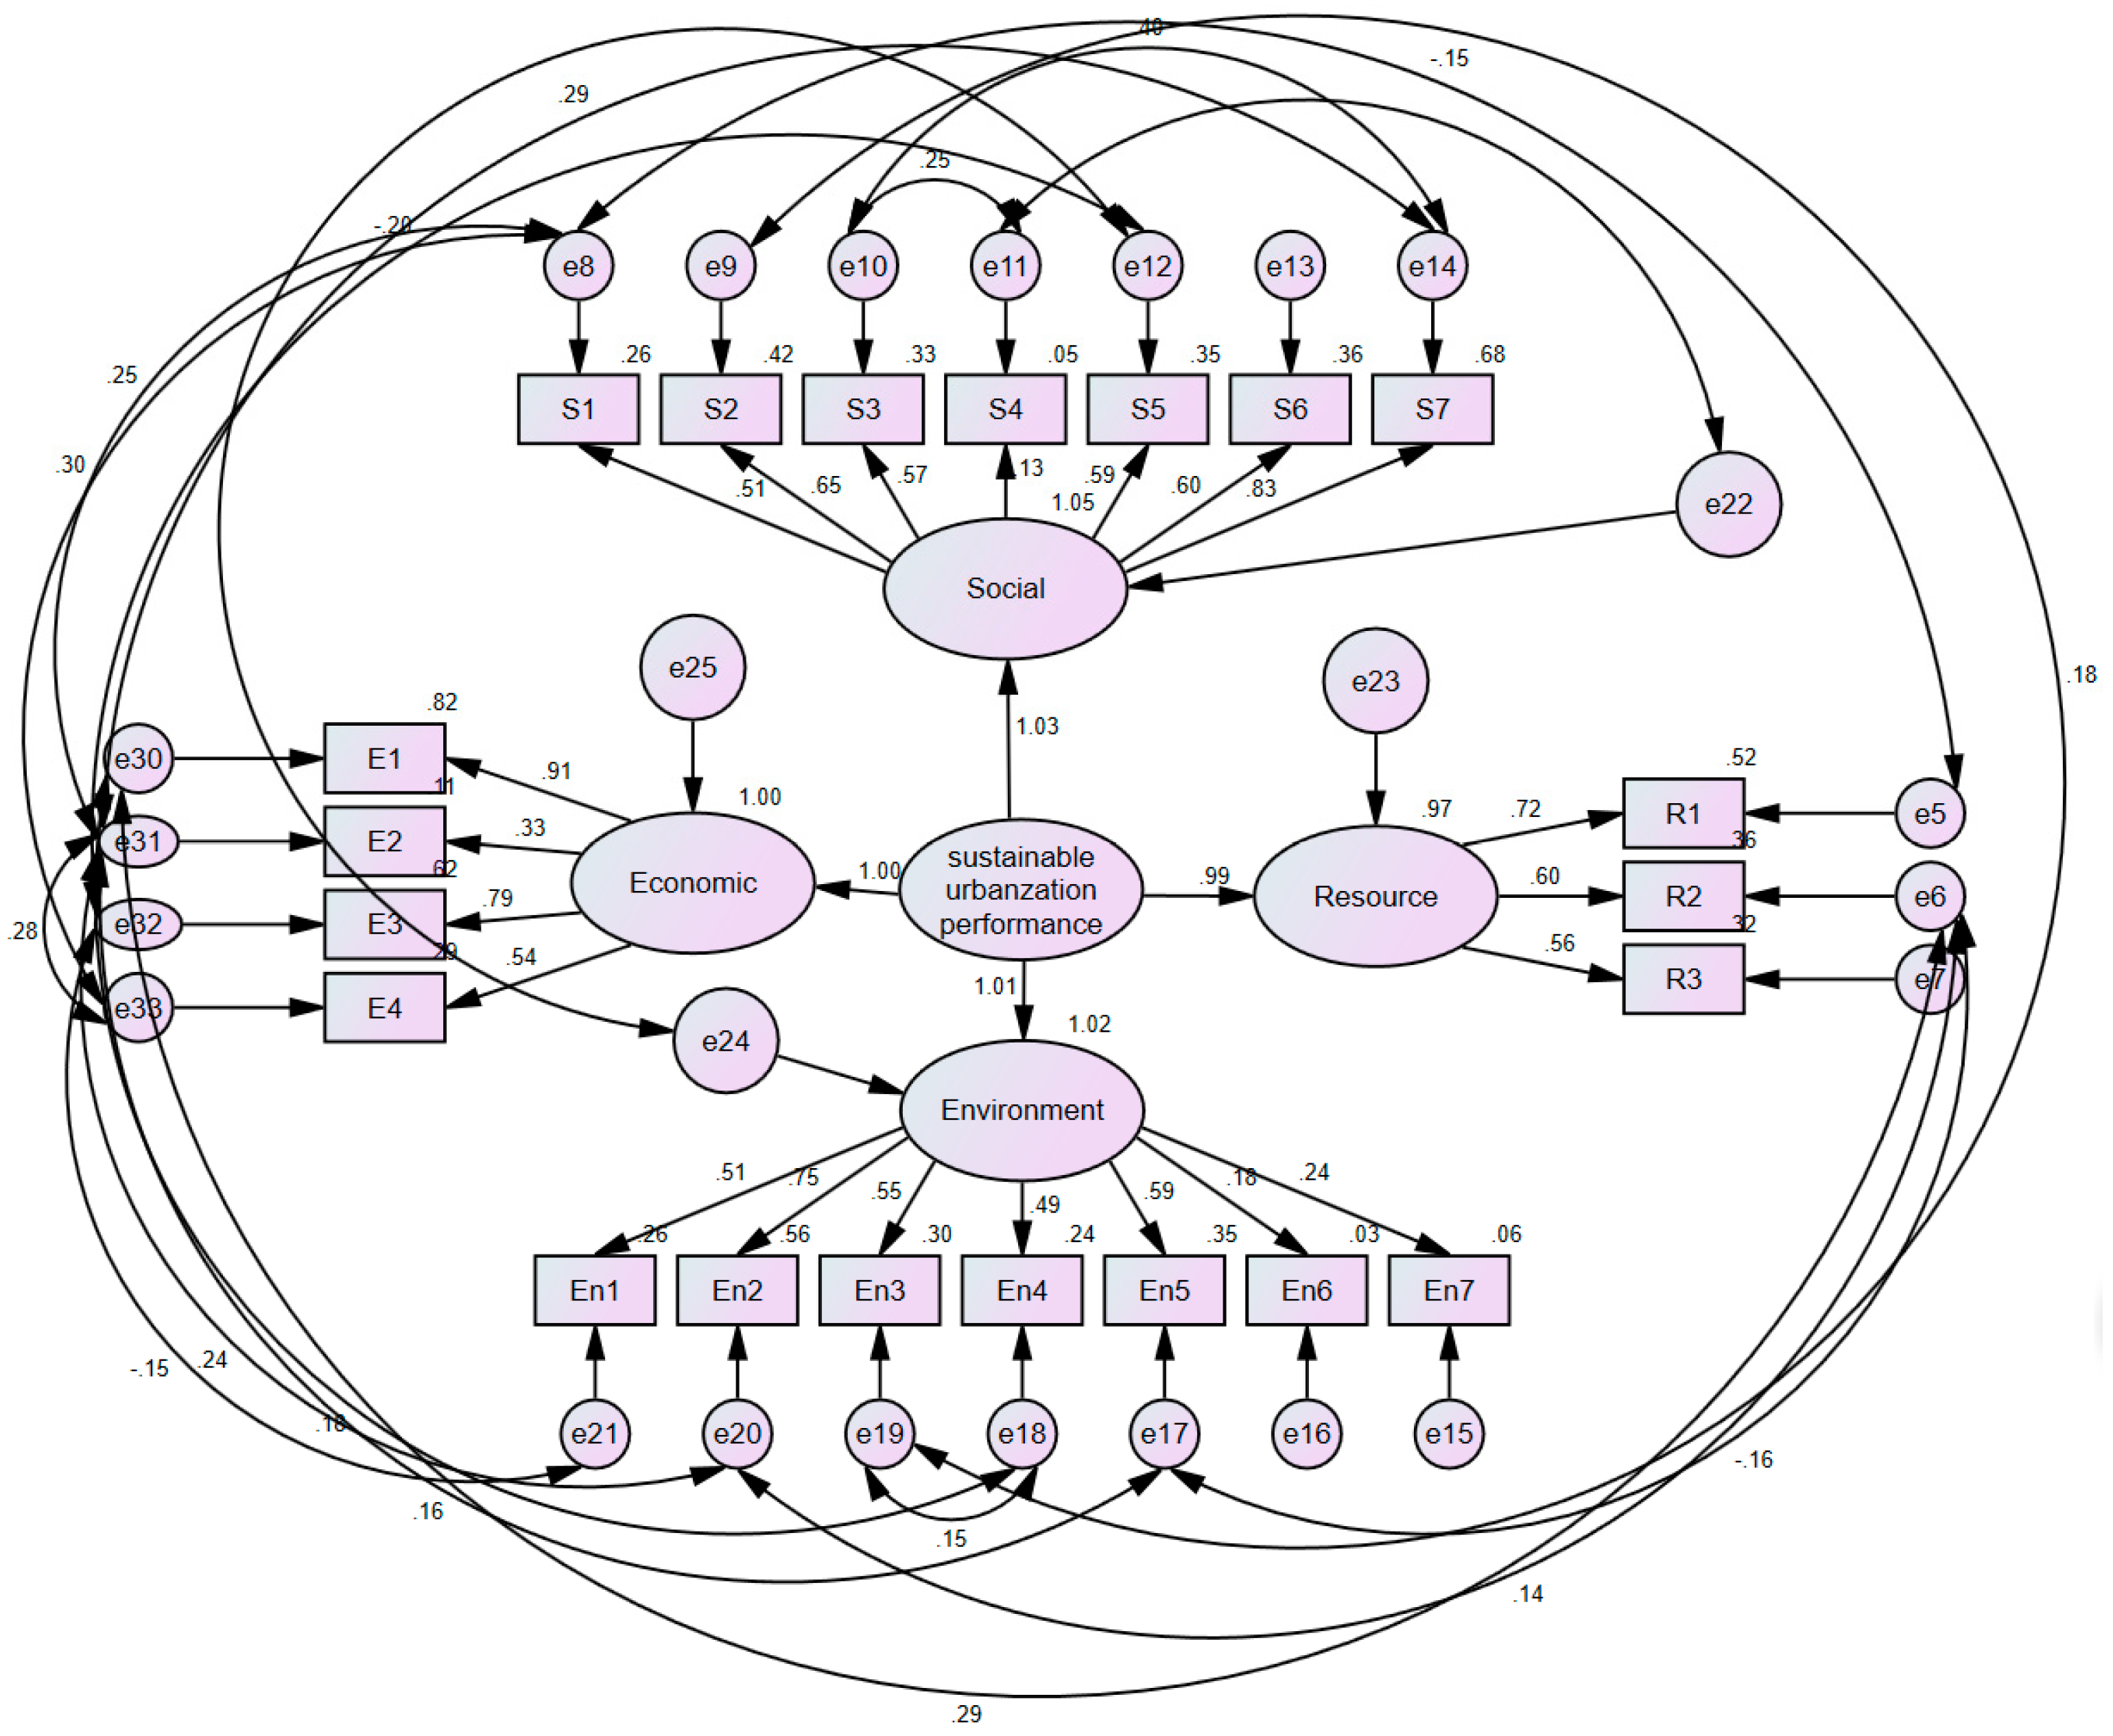
4.3. SEM Model Calculation and Refinement

Then, the software AMOS 21.0 (IBM: New York, NY, USA) was used to undertake the SEM analysis for calculating the factor loading values. Covariance matrix and the method of maximum likelihood were adopted for analysis. The initial processing results of the SEM model are shown in Figure 4 in detail.
However, the initial model could not meet the goodness-of-fit (GOF) measures standard indices of model fit totally, when compared with recommended levels, as shown in Table 3.
As shown in Table 3, some main goodness-of-fit (GOF) measures, such as χ2/degrees of freedom (2.31 > 2), adjusted goodness-of-fit index (AGFI 0.807 < 0.9), and root mean square error of approximation (RMSEA 0.073 > 0.05), were not achieved. Therefore, the SEM needed to be simplified and refined to satisfy both the theoretical expectations and the GOF measures.
After improving the hypothetical model according to the suggestions of the GOF measures and the modification indices (MI)—adding covariance error paths among variables or latent factors—the model showed a good fit and all of the GOF measures values were found to be satisfied with the recommended levels. For example, the ratio of χ2/degrees of freedom is 1.1, indicating that the theoretical model fits the data collected. The values for the indexes of GFI and AGFI are all greater than 0.9, indicating that the fit between the measurement model and the raw data are absolutely accepted. The RMSEA value of 0.02, being less than 0.5, indicates that the final refined model is accepted with a very high level of confidence. Additionally, all of the relative indexes of NFI, RFI, IFI, TLI, and CFI are above 0.9, providing strong evidence for the acceptable fit between the measurement model and the data [56,58,59,60]. Although the correlation setup in this study is according to the suggestions by the MI, the modifications are considered as theoretically and practically plausible. Because urban development is a complex system including various variables and these variables will interact with each other or have high correlation, the co-variation among the variables or latent factors can be established [21,47]. In summary, the GOF measures of the final refined SEM demonstrate a successful fit between the hypothesized SEM and the raw data. According to Jackson et al. [60], the detail of GOF measures of refined SEM is shown in Table 4.
The final refined SEM with standardized coefficients and factor loadings are shown in Figure 5. Table 5 presents the standardized regression weights and covariance estimates for the final SEM with the corresponding standard effort of estimates and p-values.

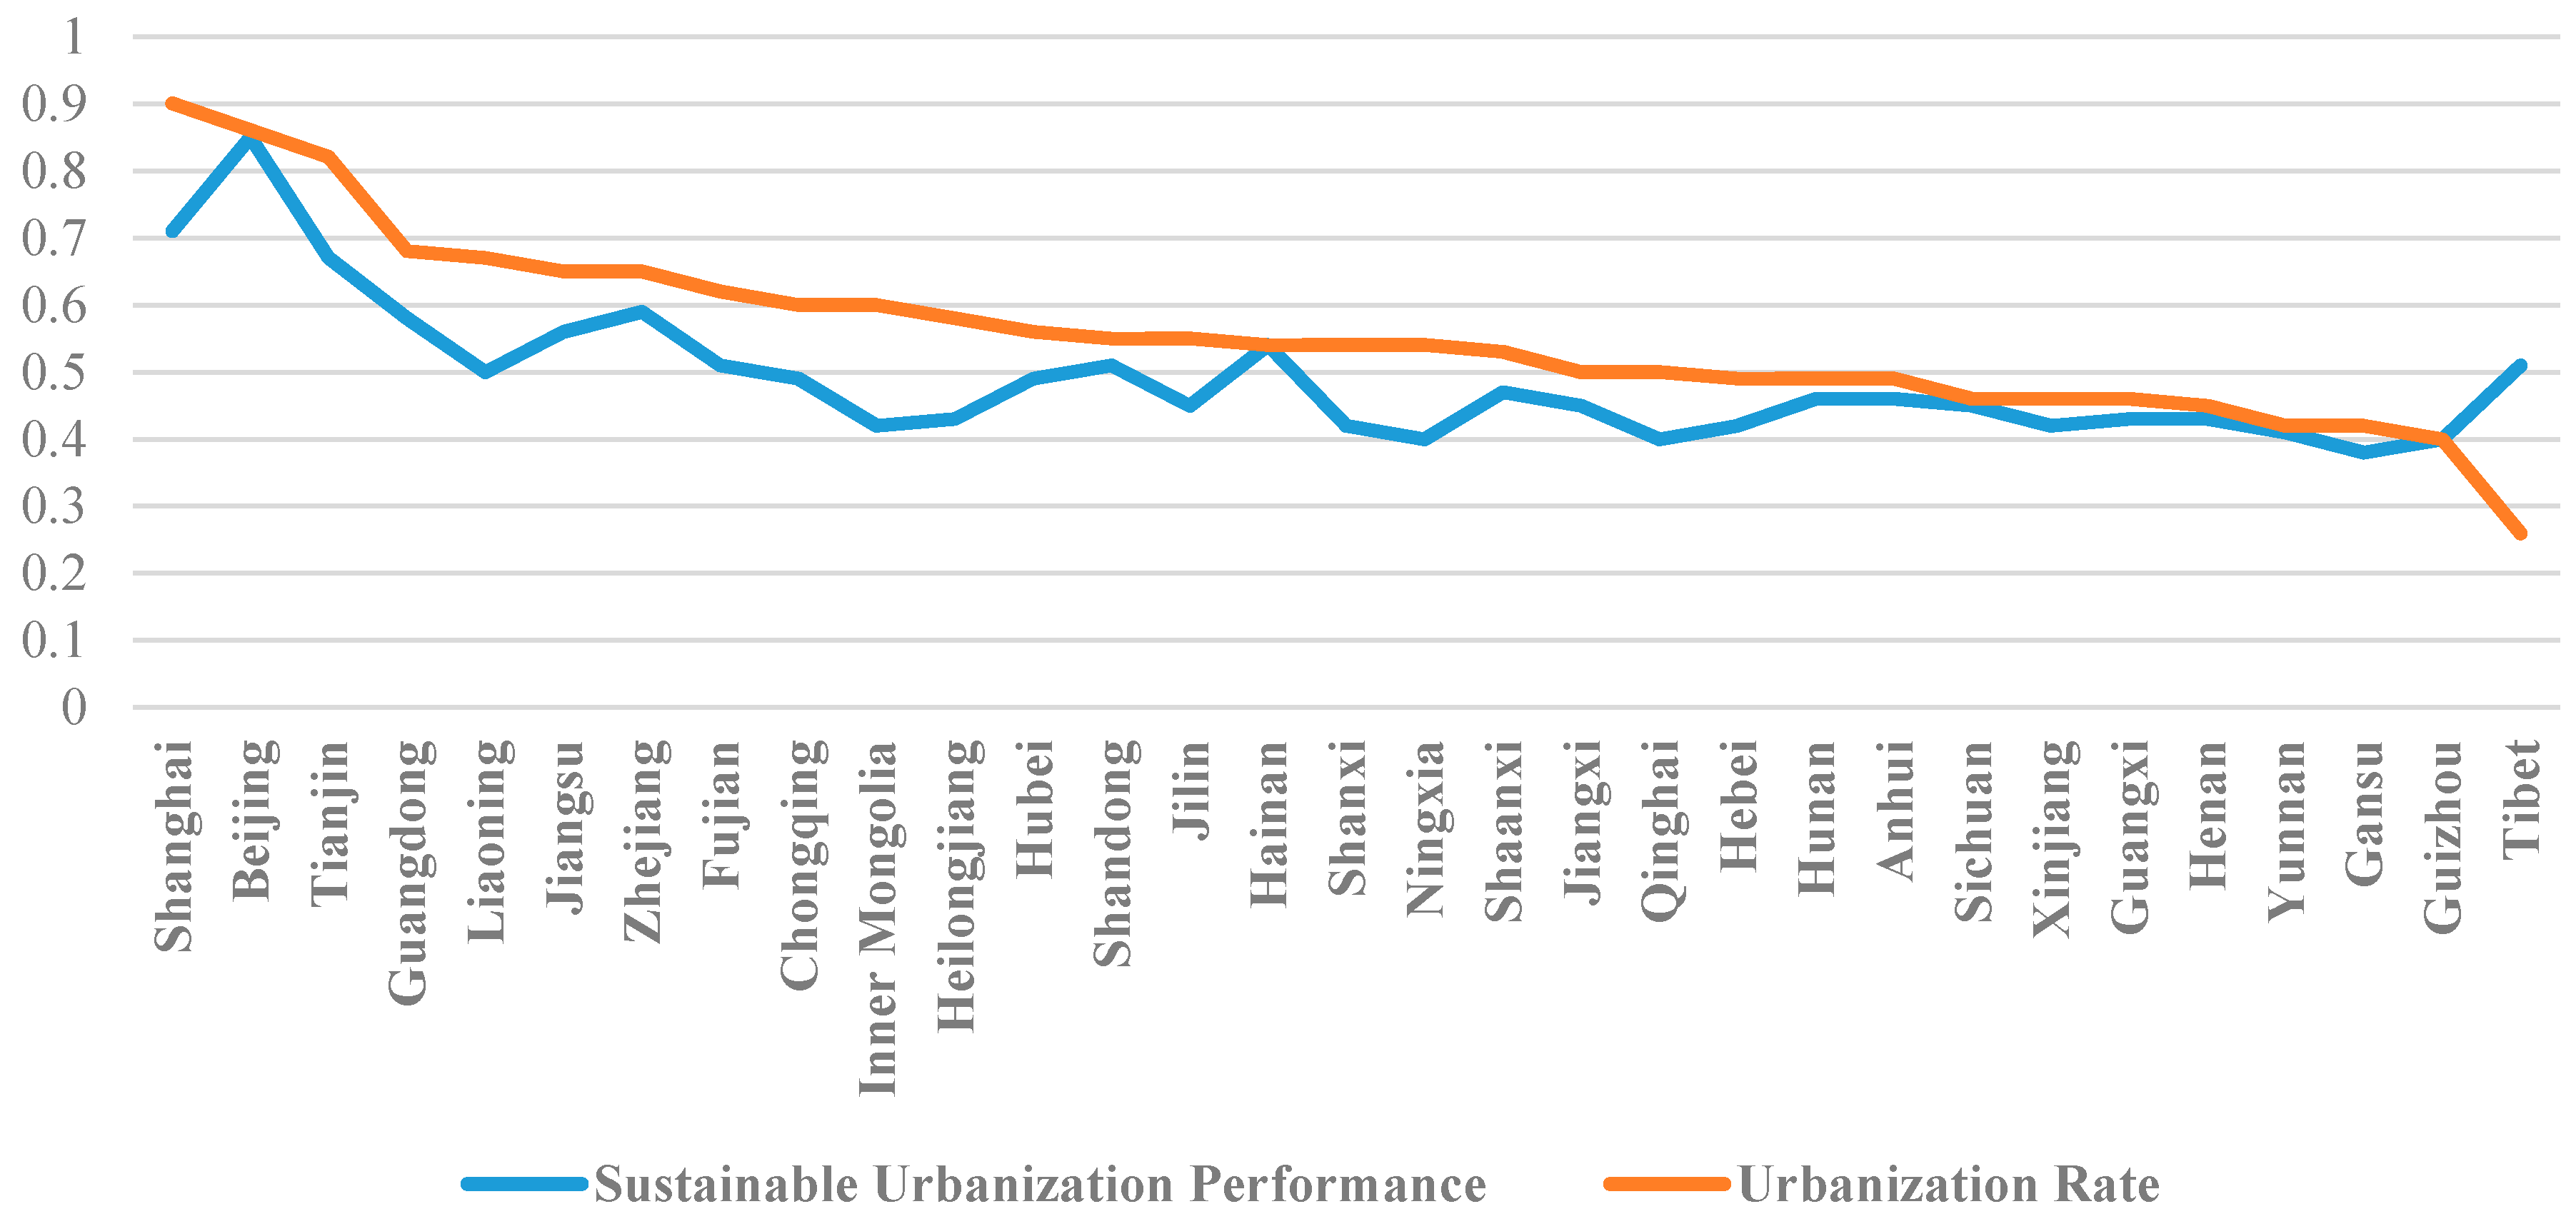
4.4. Calculation Results and Analysis

As shown in Table 5, all of the standardized path coefficients for regression weights and covariance are highly positive and significant at the 0.001 level, indicating that all of the regression weights and the covariance are significantly. In Table 5, it can be seen that the variable of per capita GDP owns the highest factor loading of the economic variable, indicating that this variable has the most influence on the economic performance. Therefore, the weight of this variable would also be the highest, considering its highest influence. For the three other dimensions—social, environment and resource—the most influential indicators are Household access to Internet in total urban household, Industrial SO2 discharged per unit GDP, and Water efficiency. Consequently, by applying the path coefficients to Equation (6), the weight of each indicator is calculated and the result is shown in Table 6.
Through applying the weights in Table 6 and the normalized data to Equations (7)–(11), the sustainable urbanization performance of 31 provinces and municipalities in China in 2014 is calculated, and ranked according to their overall sustainable urbanization performance, as presented in Table 7. The information in Table 7 shows that the whole sustainable urbanization development level is not very high in China and the development of sustainable urbanization among the 31 provinces is also unbalanced. There are three provinces—Beijing, Shanghai and Tianjin—with the calculation value exceeding 0.6, indicating a high level of sustainable urbanization. The other provinces in China range from 0.4 to 0.6, indicating a low level of sustainable urbanization. According to the rank, the top five best sustainable urbanization performance provinces are Beijing, Shanghai, Tianjin, Zhejiang and Guangdong and the five worst provinces are Yunnan, Ningxia, Guizhou, Qinghai and Gansu.
From the above calculation results, the sustainable performance of the provinces in the eastern coastal regions, such as Zhejing, Jiangsu, and Shanghai, are better than the provinces in central and west regions of China, such as Guangxi, Yunnan, and Gansu. This imbalanced development has also been appreciated by previous studies. For example, Deng et al. [61] pointed out that the whole urbanization level in western China is still very low and shows great regional imbalance among provinces of western China. The development of industrialization and socioeconomic development level plays a great role in promoting the sustainable urbanization of western China. The research work by Xie et al. [62] also demonstrated that, although the urbanization quality in China had been improved in the past years, the sustainable urbanization development among the 31 provinces is not balanced. In their further discussion, they proposed that the urbanization quality of eastern region is high and the quality of west region is very low.
Further analysis is conducted between the urbanization rate and sustainable urbanization performance in this study, as shown in Table 8 and graphically demonstrated in Figure 6.
In Table 8 and Figure 6 it can be seen that there exists a phenomenon among these 31 provinces that the higher urbanization rate, the higher sustainable urbanization performance, except Tibet. For example, the urbanization rate of Beijing, Shanghai and Tianjin are the top three provinces with the urbanization rate value 0.82, 0.85 and 0.90. These three provinces are also the top three best sustainable urbanization performance. Contrarily, the five provinces Tibet, Henan, Yunnan, Gansu, and Guizhou have the lowest urbanization rate. Meanwhile, Yunnan, Guizhou, and Gansu are also listed in the five worst provinces for sustainable urbanization performance. The urbanization rates of the other provinces are also in accordance with their sustainable urbanization performance, and ranged from 0.4 to 0.7.
This comparison result is found to be compatible with previous studies. For example, He and Ni [63] analyzed the urbanization quality of 31 provinces in China, and in their results, the top three provinces of high quality of urbanization are Shanghai, Beijing, and Tianjin, which have high urbanization rates. Shen et al. [24] shared that, because urbanization is a dynamic process, the sustainable urbanization is also dynamic. In the initial stage of urbanization, the impact of urbanization on economic and social development is low, and therefore, the sustainable urbanization performance is also low. With the development of urbanization, the impacts are increasing and the sustainable performance is improved. Zhan and Huang [64] suggested that the mission of different provinces in China should be different, as the 31 provinces are at different stages of urbanization. For the provinces of the eastern regions, which exist at a more mature stage of urbanization, their major mission is to improve the quality of urbanization, focusing on the environment condition and resource protection. The provinces of central and west regions with low urbanization rate, their major mission is to improve the speed of the urbanization, focusing on promoting the development of economic and social dimension.

5. Conclusions

Accurate assessment of the sustainable urbanization performance is very important in assisting the government in adopting policies and strategies to guide the sustainable development. The findings of this study indicate that the performance of sustainable urbanization can be assessed by the model introduced in this study. The assessment model is developed based on the principle of Structural equation model. The case study of 31 provinces in China shows that the performance of sustainable urbanization can be effectively evaluated by using Structural equation model. The typical advantages of using SEM include the following. First, it offers a new method for calculating weight values between indicators. The SEM method is different from other methods such as Entropy method and AHP method in determining weights of indicators. Second, this method can tell the most influential indicators to the different dimensions of sustainable urbanization. For example, in this study, the most influential indicators of the four dimensions, economic, social, environment and resource, are Per capita GDP, Household access to Internet in total urban household, Industrial SO2 discharged per unit GDP, and Water efficiency, respectively. Third, the assessment results can display the overall status of an individual province’s sustainable urbanization performance. By referring to this message, decision makers can identify effective and adequate policies for improving sustainable urbanization performance. It is considered that this research also adds value to the development of literature in this research discipline. While the assessment model introduced in this paper is for assessing the performance of sustainable urbanization within the Chinese context, the principle of the model can also be applied in other countries. It is also appreciated that the sustainable urbanization performance of the surveyed 31 provinces is different. The policies guiding the development of different provinces should be different, and this issue is currently under study by the research team.

Acknowledgments

The authors would like to acknowledge the financial support for this research received from the National Social Science Foundation of China (Grant No. 15AZD025 and Grant No. 15BJY038).

Author Contributions

All authors have contributed to the designed research, researched and analyzed the data, and wrote up the paper. All authors have read and approved the final manuscript.

Conflicts of Interest

All authors have no conflict of interests to any other parties.

References

  1. Zhou, J.; Zhang, X.; Shen, L. Urbanization bubble: Four quadrants measurement model. Cities 2015, 46, 8–15. [Google Scholar] [CrossRef]
  2. Ann, T.W.; Wu, Y.; Zheng, B.; Zhang, X.; Shen, L. Identifying risk factors of urban-rural conflict in urbanization: A case of China. Habitat Int. 2014, 44, 177–185. [Google Scholar]
  3. Shen, L.Y.; Zhou, J. Examining the effectiveness of indicators for guiding sustainable urbanization in China. Habitat Int. 2014, 44, 111–120. [Google Scholar] [CrossRef]
  4. Zhao, J.; Chai, L. A novel approach for urbanization level evaluation based on information entropy principle: A case of Beijing. Phys. A Stat. Mech. Appl. 2015, 430, 114–125. [Google Scholar] [CrossRef]
  5. Ministry of Construction of China. Statistical Communiqué on Urban Construction 2003; Ministry of Construction of China: Beijing, China, 2003. (In Chinese)
  6. Zhang, C.; Lin, Y. Panel estimation for urbanization, energy consumption and CO2 emissions: A regional analysis in China. Energy Policy 2012, 49, 488–498. [Google Scholar] [CrossRef]
  7. The World Bank. Urban China: Toward Efficient, Inclusive, and Sustainable Urbanization. Available online: http://www.worldbank.org/content/dam/Worldbank/document/EAP/China/urban-china-overview-cn.pdf (accessed on 28 March 2014).
  8. Zhang, X.; Wu, Y.; Skitmore, M.; Jiang, S. Sustainable infrastructure projects in balancing urban-rural development: Towards the goal of efficiency and equity. J. Clean. Prod. 2014, 107, 445–454. [Google Scholar] [CrossRef]
  9. Ma, L.; Liu, P.; Fu, F.; Li, Z.; Ni, W. Integrated energy strategy for the sustainable development of China. Energy 2011, 36, 1143–1154. [Google Scholar] [CrossRef]
  10. Zhang, X. Sustainable urbanization: A BI-dimensional matrix model. J. Clean. Prod. 2016, 134, 425–433. [Google Scholar] [CrossRef]
  11. Michael, F.L.; Noor, Z.Z.; Figueroa, M.J. Review of urban sustainability indicators assessment—Case study between Asian countries. Habitat Int. 2014, 44, 491–500. [Google Scholar] [CrossRef]
  12. Tan, Y.; Xu, H.; Zhang, X. Sustainable urbanization in China: A comprehensive literature review. Cities 2016, 55, 82–93. [Google Scholar] [CrossRef]
  13. Han, J.; Hayashi, Y.; Cao, X.; Imura, H. Application of an integrated system dynamics and cellular automata model for urban growth assessment: A case study of Shanghai, China. Landsc. Urban Plan. 2009, 91, 133–141. [Google Scholar] [CrossRef]
  14. Uwasu, M.; Yabar, H. Assessment of sustainable development based on the capital approach. Ecol. Indic. 2011, 11, 348–352. [Google Scholar] [CrossRef] [Green Version]
  15. Zhou, D.; Xu, J.; Wang, L.; Lin, Z. Assessing urbanization quality using structure and function analyses: A case study of the urban agglomeration around Hangzhou Bay (UAHB), China. Habitat Int. 2015, 49, 165–176. [Google Scholar] [CrossRef]
  16. Grigoroudis, E.; Kouikoglou, V.S.; Phillis, Y.A. SAFE 2013: Sustainability of countries updated. Ecol. Indic. 2014, 38, 61–66. [Google Scholar] [CrossRef]
  17. Phillis, Y.A.; Grigoroudis, E.; Kouikoglou, V.S. Sustainability ranking and improvement of countries. Ecol. Econ. 2011, 70, 542–553. [Google Scholar] [CrossRef]
  18. Zijp, M.C.; Heijungs, R.; van der Voet, E.; van de Meent, D.; Huijbregts, M.A.J.; Hollander, A.; Posthuma, L. An identification key for selecting methods for sustainability assessments. Sustainability 2015, 7, 2490–2512. [Google Scholar] [CrossRef] [Green Version]
  19. Huang, S.L.; Chen, C.W. A System Dynamics Approach to the Simulation of Urban Sustainability; Ecosystems and Sustainable Development II, WIT Press: Southampton, UK, 1999. [Google Scholar]
  20. Huang, L.; Yan, L.; Wu, J. Assessing urban sustainability of Chinese megacities: 35 years after the economic reform and open-door policy. Landsc. Urban Plan. 2016, 145, 57–70. [Google Scholar] [CrossRef]
  21. Huang, S.L.; Yeh, C.T.; Budd, W.W.; Chen, L.L. A Sensitivity Model (SM) approach to analyze urban development in Taiwan based on sustainability indicators. Environ. Impact Assess. Rev. 2009, 29, 116–125. [Google Scholar] [CrossRef]
  22. WCED, U. Our Common Future; World Commission on Environment and Development Oxford University Press: Oxford, UK, 1987. [Google Scholar]
  23. Roy, M. Planning for sustainable urbanization in fast growing cities: Mitigation and adaptation issues addressed in Dhaka, Bangladesh. Habitat Int. 2009, 33, 276–286. [Google Scholar] [CrossRef]
  24. Shen, L.; Peng, Y.; Zhang, X.; Wu, Y. An alternative model for evaluating sustainable urbanization. Cities 2012, 29, 32–39. [Google Scholar] [CrossRef]
  25. Marcotullio, P.J. Asian urban sustainability in the era of globalization. Habitat Int. 2001, 25, 577–598. [Google Scholar] [CrossRef]
  26. Harris, N. Wastes, the environment and the international economy. Cities 1992, 9, 177–185. [Google Scholar] [CrossRef]
  27. Shen, L.; Shuai, C.; Jiao, L.; Tan, Y.; Song, X. A Global Perspective on the Sustainable Performance of Urbanization. Sustainability 2016, 8, 783. [Google Scholar] [CrossRef]
  28. Dye, C. Health and urban living. Science 2008, 319, 766–769. [Google Scholar] [CrossRef] [PubMed]
  29. Zhou, J.; Shen, L.; Song, X.; Zhang, X. Selection and modeling sustainable urbanization indicators: A responsibility-based method. Ecol. Indic. 2015, 56, 87–95. [Google Scholar] [CrossRef]
  30. Jaeger, J.A.G.; Bertiller, R.; Schwick, C.; Kienast, F. Suitability criteria for measures of urban sprawl. Ecol. Indic. 2010, 10, 397–406. [Google Scholar] [CrossRef]
  31. El Araby, M. Urban growth and environmental degradation: The case of Cairo, Egypt. Cities 2002, 19, 389–400. [Google Scholar] [CrossRef]
  32. Dizdaroglu, D.; Yigitcanlar, T.; Dawes, L.A. Sustainable Urban Futures: An Ecological Approach to Sustainable Urban Development. In Proceedings of the Second Infrastructure Theme Postgraduate Conference 2009: Rethinking Sustainable Development-Planning, Infrastructure Engineering, Design and Managing Urban Infrastructure, Brisbane, Australia, 9 July 2010; pp. 187–195.
  33. Yigitcanlar, T.; Dizdaroglu, D. Assessing Urban Ecosystem Sustainability: An Indexing Approach. Available online: http://s3.amazonaws.com/academia.edu.documents/30968394/Assessing-urban-ecosystem-sustainability-an-indexing approach. pdf?AWSAccessKeyId=AKIAJ56TQJRTWSMTNPEA& Expires=1468819753&Signature=dqbGGXjzNGsfUhgrzvlV3FYqR7w%3D&response-content-disposition=inline%3B%20filename%3DAssessing_urban_ecosystem_sustainability.pdf (accessed on 23 May 2014).
  34. Zhang, N.; Lior, N.; Jin, H. The energy situation and its sustainable development strategy in China. Energy 2011, 36, 3639–3649. [Google Scholar] [CrossRef]
  35. Gustavson, K.R.; Lonergan, S.C.; Ruitenbeek, H.J. Selection and modeling of sustainable development indicators: A case study of the Fraser River Basin, British Columbia. Ecol. Econ. 1999, 28, 117–132. [Google Scholar] [CrossRef]
  36. Hezri, A.A.; Hasan, M.N. Management framework for sustainable development indicators in the State of Selangor, Malaysia. Ecol. Indic. 2004, 4, 287–304. [Google Scholar] [CrossRef]
  37. Yigitcanlar, T.; Dur, F. Developing a sustainability assessment model: The sustainable infrastructure, land-use, environment and transport model. Sustainability 2010, 2, 321–340. [Google Scholar] [CrossRef] [Green Version]
  38. Shen, L.Y.; Ochoa, J.J.; Shah, M.N.; Zhang, X. The application of urban sustainability indicators—A comparison between various practices. Habitat Int. 2011, 35, 17–29. [Google Scholar] [CrossRef]
  39. Quyên, Đ.T.N. Developing University Governance Indicators and Their Weighting System Using a Modified Delphi Method. Proced. Soc. Behav. Sci. 2014, 141, 828–833. [Google Scholar] [CrossRef]
  40. Hsueh, S.L. Assessing the effectiveness of community-promoted environmental protection policy by using a Delphi-fuzzy method: A case study on solar power and plain afforestation in Taiwan. Renew. Sustain. Energy Rev. 2015, 49, 1286–1295. [Google Scholar] [CrossRef]
  41. Guerrero-Liquet, G.C.; Sánchez-Lozano, J.M.; García-Cascales, M.S.; Lamata, M.T.; Verdegay, J.L. Decision-Making for Risk Management in Sustainable Renewable Energy Facilities: A Case Study in the Dominican Republic. Sustainability 2016, 8, 455. [Google Scholar] [CrossRef]
  42. Shemshadi, A.; Shirazi, H.; Toreihi, M.; Tarokh, M.J. A fuzzy VIKOR method for supplier selection based on entropy measure for objective weighting. Expert Syst. Appl. 2011, 38, 12160–12167. [Google Scholar] [CrossRef]
  43. Shen, L.; Zhou, J.; Skitmore, M.; Xia, B. Application of a hybrid Entropy–McKinsey Matrix method in evaluating sustainable urbanization: A China case study. Cities 2015, 42, 186–194. [Google Scholar] [CrossRef]
  44. Liang, X.; Zhang, W.; Chen, L.; Deng, F. Sustainable urban development capacity measure—A case study in Jiangsu Province, China. Sustainability 2016, 8, 270. [Google Scholar] [CrossRef]
  45. Guo, Y.B.; Wei, H.K. A Review of Literature on Urbanization Quality Evaluation. J. Grad. Sch. Chin. Acad. Soc. Sci. 2013, 2, 37–43. (In Chinese) [Google Scholar]
  46. Fang, D.; Wu, C.; Wu, H. Impact of the supervisor on worker safety behavior in construction projects. J. Manag. Eng. 2015, 31, 04015001. [Google Scholar] [CrossRef]
  47. Xiong, B.; Skitmore, M.; Xia, B. A critical review of structural equation modeling applications in construction research. Autom. Constr. 2015, 49, 59–70. [Google Scholar] [CrossRef]
  48. Shen, W.; Xiao, W.; Wang, X. Passenger satisfaction evaluation model for urban rail transit: A structural equation modeling based on partial least squares. Transp. Policy 2016, 46, 20–31. [Google Scholar] [CrossRef]
  49. Evermann, J.; Tate, M. Assessing the predictive performance of structural equation model estimators. J. Bus. Res. 2016, 69, 4565–4582. [Google Scholar] [CrossRef]
  50. Liu, G.; You, T. The evaluation the development level of integrated urban Eco-system. Urban Dev. Stud. 2013, 20, 108–112. (In Chinese) [Google Scholar]
  51. Guan, W.F.; Zhang, K.; Yang, X. Urban competitiveness evaluation based on the structural equation model. Econ. Manag. 2013, 24, 41–45. (In Chinese) [Google Scholar]
  52. Mo, Y.K.; Deng, J.; Yan, K.F. Public evaluation of urban transit system based on structural equation modeling. J. Hefei Univ. Technol. 2010, 33, 704–708. (In Chinese) [Google Scholar]
  53. Yu, S.H.; Yang, W. The evaluation model of regional tourism industry competition via structural equation. J. Dalian Univ. Technol. 2011, 32, 44–47. (In Chinese) [Google Scholar]
  54. USI 2013 Index System Framework. Available online: http://www.urbanchinainitiative.org/en/resources/dev_page.html (accessed on 31 August 2016).
  55. National Bureau of Statistics of China. National Data. Available online: http://data.stats.gov.cn (accessed on 15 March 2016).
  56. Doloi, H.; Iyer, K.C.; Sawhney, A. Structural equation model for assessing impacts of contractor’s performance on project success. Int. J. Proj. Manag. 2011, 29, 687–695. [Google Scholar] [CrossRef]
  57. Discriminant Validity. Available online: https://en.wikipedia.org/wiki/Discriminant_validity#cite_note-henseler 2014-3 (accessed on 30 August 2016).
  58. Isik, Z.; Arditi, D.; Dikmen, I.; Birgonul, M.T. Impact of corporate strengths/weaknesses on project management competencies. Int. J. Proj. Manag. 2009, 27, 629–637. [Google Scholar] [CrossRef]
  59. Meng, J.; Xue, B.; Liu, B.; Fang, N. Relationships between top managers’ leadership and infrastructure sustainability: A Chinese urbanization perspective. Eng. Constr. Archit. Manag. 2015, 22, 692–714. [Google Scholar] [CrossRef]
  60. Jackson, D.L.; Gillaspy, J.A., Jr.; Purc-Stephenson, R. Reporting practices in confirmatory factor analysis: An overview and some recommendations. Psychol. Methods 2009, 14, 6–23. [Google Scholar] [CrossRef] [PubMed]
  61. Deng, X.Z.; Zhong, H.Y.; Bai, X.M. Path of Sustainable Urbanization in Western China. China Popul. Resour. Environ. 2013, 23, 24–30. (In Chinese) [Google Scholar]
  62. Xie, S.H.; Cai, H.Y.; Lou, T.T. Evaluation on the urbanization quality of province in China. Urban Probl. 2015, 8, 16–21. (In Chinese) [Google Scholar]
  63. He, P.; Ni, P. Study on the quality of China’s Urbanization. Stat. Res. 2013, 6, 11–18. (In Chinese) [Google Scholar]
  64. Zhang, Z.B.; Huang, K. The measurement and evaluation of the health status of China’s new urbanization. Comp. Econ. Soc. Syst. 2014, 4, 32–42. (In Chinese) [Google Scholar]
Figure 1. Conceptual framework of the assessment model.
Sustainability 08 00910 g001
Figure 2. Factor loading of the variables.
Sustainability 08 00910 g002
Figure 3. Map of the 31 provinces and municipalities in Mainland China.
Sustainability 08 00910 g003
Figure 4. The initial Structural equation modeling (SEM) with standardized path coefficients and factor loadings.
Sustainability 08 00910 g004
Figure 5. The final simplified and refined SEM with standardized path coefficients and factor loadings.
Sustainability 08 00910 g005
Figure 6. The sustainable urbanization performance and urbanization rate.
Sustainability 08 00910 g006
Table 1. Evaluating indicators for sustainable urbanization.
DimensionsIndicatorsCodes
EconomicPer capita GDPE1
GDP from service industry (%)E2
Disposable income per urban capitaE3
Government investment in R&D per capitaE4
SocialUrban unemployment rate (%)S1
Number of doctors per capita (per ten thousand urban population)S2
Pension security coverage (%)S3
Number of middle school students (per ten thousand urban population)S4
Number of books per person in public librariesS5
Urban road area per capitaS6
Household access to Internet in total urban household (%)S7
EnvironmentWastewater treatment rate (%)En1
Industrial SO2 discharged per unit GDP (tons per bn RMB)En2
Domestic waste treated rate (%)En3
Coverage of public green space in built area (%)En4
Passengers using public transit (per capita)En5
Public water supply coverage (%)En6
Persons per square kilometer of urban areaEn7
ResourceWater efficiencyR1
Residential power consumption (kwh per capita)R2
Total energy consumption per unit GDPR3
Table 2. The value of R among the four dimensions.
DimensionsValue of R
economic and social0.88
economic and environment0.78
economic and resource0.88
social and environment0.81
social and resource0.89
environment and resource0.85
Table 3. Goodness-of-fit (GOF) measures of the initial SEM.
GOF MeasuresInitial SEMRecommended LevelsResources
χ2/degrees of freedom2.311–2[56,58,59,60]
Goodness-of-fit index (GFI)0.845>0.9[56,58,59,60]
Adjusted goodness-of-fit index (AGFI)0.807>0.9[56,58,59,60]
Root mean square error of approximation (RMSEA)0.073<0.05[56,58,59,60]
Table 4. GOF measures of refined SEM.
Index NameGOF MeasuresRefined SEMRecommended LevelsEvaluation
Absolute fit indexχ2/df1.11–2Acceptable
RMSEA0.02<0.05Acceptable
RMR0.033<0.05Acceptable
GFI0.935>0.9Acceptable
AGFI0.909>0.9Acceptable
Incremental fit indexCFI0.992>0.9Acceptable
TLI0.99>0.9Acceptable
NFI0.922>0.7Acceptable
IFI0.992>0.9Acceptable
TLI0.99>0.9Acceptable
Parsimonious fit measurePNFI0.729>0.5Acceptable
PGFI0.672>0.5Acceptable
PCFI0.784>0.5Acceptable
Table 5. The standardized regression weights and covariance estimates of the final refined SEM.
EstimateS.E.C.R.p
sp<---sup1.027
rp<---sup0.9860.2857.421***
enp<---sup1.0120.173.504***
ep<---sup1.0020.1468.027***
E4<---ep0.543
E3<---ep0.7880.1788.796***
E2<---ep0.3350.1085.394***
E1<---ep0.9060.2289.438***
R1<---rp0.719
R2<---rp0.5980.0898.97***
R3<---rp0.5620.0818.588***
S1<---sp0.505
S2<---sp0.6470.2417.469***
S3<---sp0.5740.216.981***
S4<---sp0.1330.1082.064***
S5<---sp0.5890.2367.012***
S6<---sp0.5990.2297.128***
S7<---sp0.8270.2998.45***
En7<---enp0.241
En6<---enp0.1810.3492.271***
En5<---enp0.5890.7953.607***
En4<---enp0.4920.6713.495***
En3<---enp0.5480.9063.569***
En2<---enp0.7471.1073.723***
En1<---enp0.5140.9083.528***
Note: *** denotes the standardized regression weights and the covariance are significantly different from 0 at the 0.001 level (two-tailed).
Table 6. Weight of the indicators.
Dimension WeightsIndicatorsIndicators Weights
Economic (0.25)Per capita GDP0.35
GDP from service industry (%)0.13
Disposable income per urban capita0.31
Government investment in R&D per capita0.21
Social (0.26)Urban unemployment rate (%)0.13
Number of doctors per capita (per ten thousand urban population)0.17
Pension security coverage (%)0.15
Number of middle school students (per ten thousand urban population)0.03
Number of books per person in public libraries0.15
Urban road area per capita0.15
Household access to Internet in total urban household (%)0.21
Environment (0.25)Wastewater treatment rate (%)0.16
Industrial SO2 discharged per unit GDP (tons per bn RMB)0.23
Domestic waste treated rate (%)0.17
Coverage of public green space in built area (%)0.15
Passengers using public transit (per capita)0.18
Public water supply coverage (%)0.05
Persons per square kilometer of urban area0.07
Resource (0.24)Water efficiency0.38
Residential power consumption (kwh per capita)0.32
Total energy consumption per unit GDP0.3
Table 7. Sustainable urbanization performance of 31 provinces in China.
ProvincesSupRankProvincesSupRank
Beijing0.851Guangxi0.4320
Tianjin0.673Hainan0.547
Hebei0.4223Chongqing0.4912
Shanxi0.4223Sichuan0.4517
Inner Mongolia0.4223Guizhou0.4028
Liaoning0.5011Yunnan0.4127
Jilin0.4517Tibet0.518
Heilongjiang0.4320Shaanxi0.4714
Shanghai0.712Gansu0.3831
Guangdong0.585Qinghai0.4028
Xinjiang0.4223Jiangxi0.4517
Jiangsu0.566Shandong0.518
Zhejiang0.594Henan0.4320
Anhui0.4615Hubei0.4912
Fujian0.518Hunan0.4615
Ningxia0.4028
Table 8. Sustainable urbanization performance and urbanization rate.
ProvincesSustainable Urbanization PerformanceUrbanization RateProvincesSustainable Urbanization PerformanceUrbanization Rate
Shanghai0.710.90Ningxia0.400.54
Beijing0.850.86Shaanxi0.470.53
Tianjin0.670.82Jiangxi0.450.50
Guangdong0.580.68Qinghai0.400.50
Liaoning0.500.67Hebei0.420.49
Jiangsu0.560.65Hunan0.460.49
Zhejiang0.590.65Anhui0.460.49
Fujian0.510.62Sichuan0.450.46
Chongqing0.490.60Xinjiang0.420.46
Inner Mongolia0.420.60Guangxi0.430.46
Heilongjiang0.430.58Henan0.430.45
Hubei0.490.56Yunnan0.410.42
Shandong0.510.55Gansu0.380.42
Jilin0.450.55Guizhou0.400.40
Hainan0.540.54Tibet0.510.26
Shanxi0.420.54

