1. Introduction
Many developing countries are currently in the midst of rapid urbanization and industrialization [
1,
2]. However, despite the numerous economic opportunities brought about by rapid urbanization, it still causes a series of environmental problems because of fundamental changes in the biotic and abiotic environments in and around cities [
3], such as deterioration of water quality [
4,
5], decrease of cultivated land [
6,
7], and increased air pollution [
8].
Urbanization greatly influences urban climate as well. The characteristics of an urban climate can be summarized as the “five island effects”, namely, urban heat island (UHI) [
9], urban humid island [
10], urban arid island [
11], urban turbid island [
12], and urban rainy island [
13,
14]. UHI is the most prominent characteristic of urban climate [
15]. The intensity of UHI is usually proportional to the population size and built-up area of a city, averages 2 °C, and can reach as high as 10 °C [
15].
Wetlands have important functions in climate regulation [
16,
17]. The microclimate effects of wetlands are mainly realized through evapotranspiration and heat storage [
18]. On the one hand, the thermal capacity of water is greater than those of soil, rock, and vegetation. In comparison with land, water bodies can store more heat and decelerate temperature variation; thus, wetlands can regulate the surrounding climate. On the other hand, the temperature difference between water bodies and land causes local lake breeze circulation and increases the average wind speed in a wetland region [
19]. At the same time, the evaporation and heat storage of water bodies are generally larger than those of the land surface; these processes can take away ambient heat and increase air humidity in wetland regions [
20,
21].
Urban climate anomalies caused by rapid urbanization attract numerous scholars to study the microclimate regulation function of urban wetlands. Saaroni and Ziv analyzed the climate effect of a four-hectare pond located in Begin Park, Tel Aviv, Israel. They found that even small bodies of water within a 40 m range have a relieving effect on humans in daytime hours under both dry and humid weather conditions [
22]. Kim et al. used observational data from 2003 to 2005 to investigate the changes in the local thermal environment associated with the restoration of an inner-city stream in Seoul, Korea. They estimated that after the stream was restored, the near-surface temperature averaged over the stream area dropped by 0.4 °C, with the largest local temperature drop being 0.9 °C [
23]. Hou et al. developed a method of near-surface air temperature (NSAT) retrieval that employs Landsat Thematic Mapper images and examined the spatial relationship between NSAT and urban wetlands. They discovered that wetlands have an obvious influence on atmospheric temperature, which decreases as the distance from the wetland increases. Kochi is a fast-growing urban region in coastal South India interlaced by a network of canals and wetlands that is a part of the Vembanad Lake system [
24]. Thomas and Zachariah investigated the UHI records of Kochi in summer and winter, and found that the UHI intensity is moderate compared with that observed in other cities in the region [
25]. These studies confirmed that urban wetlands have a regulation function on the microclimate. However, numerous issues remain unanswered regarding the microclimate regulation function of urban wetlands, such as its link with the urban sprawl, its difference among land cover types in wetland regions, the stabilizing effect of wetlands on microclimate and how to quantify it, and the influence of season and weather factors on the said function.
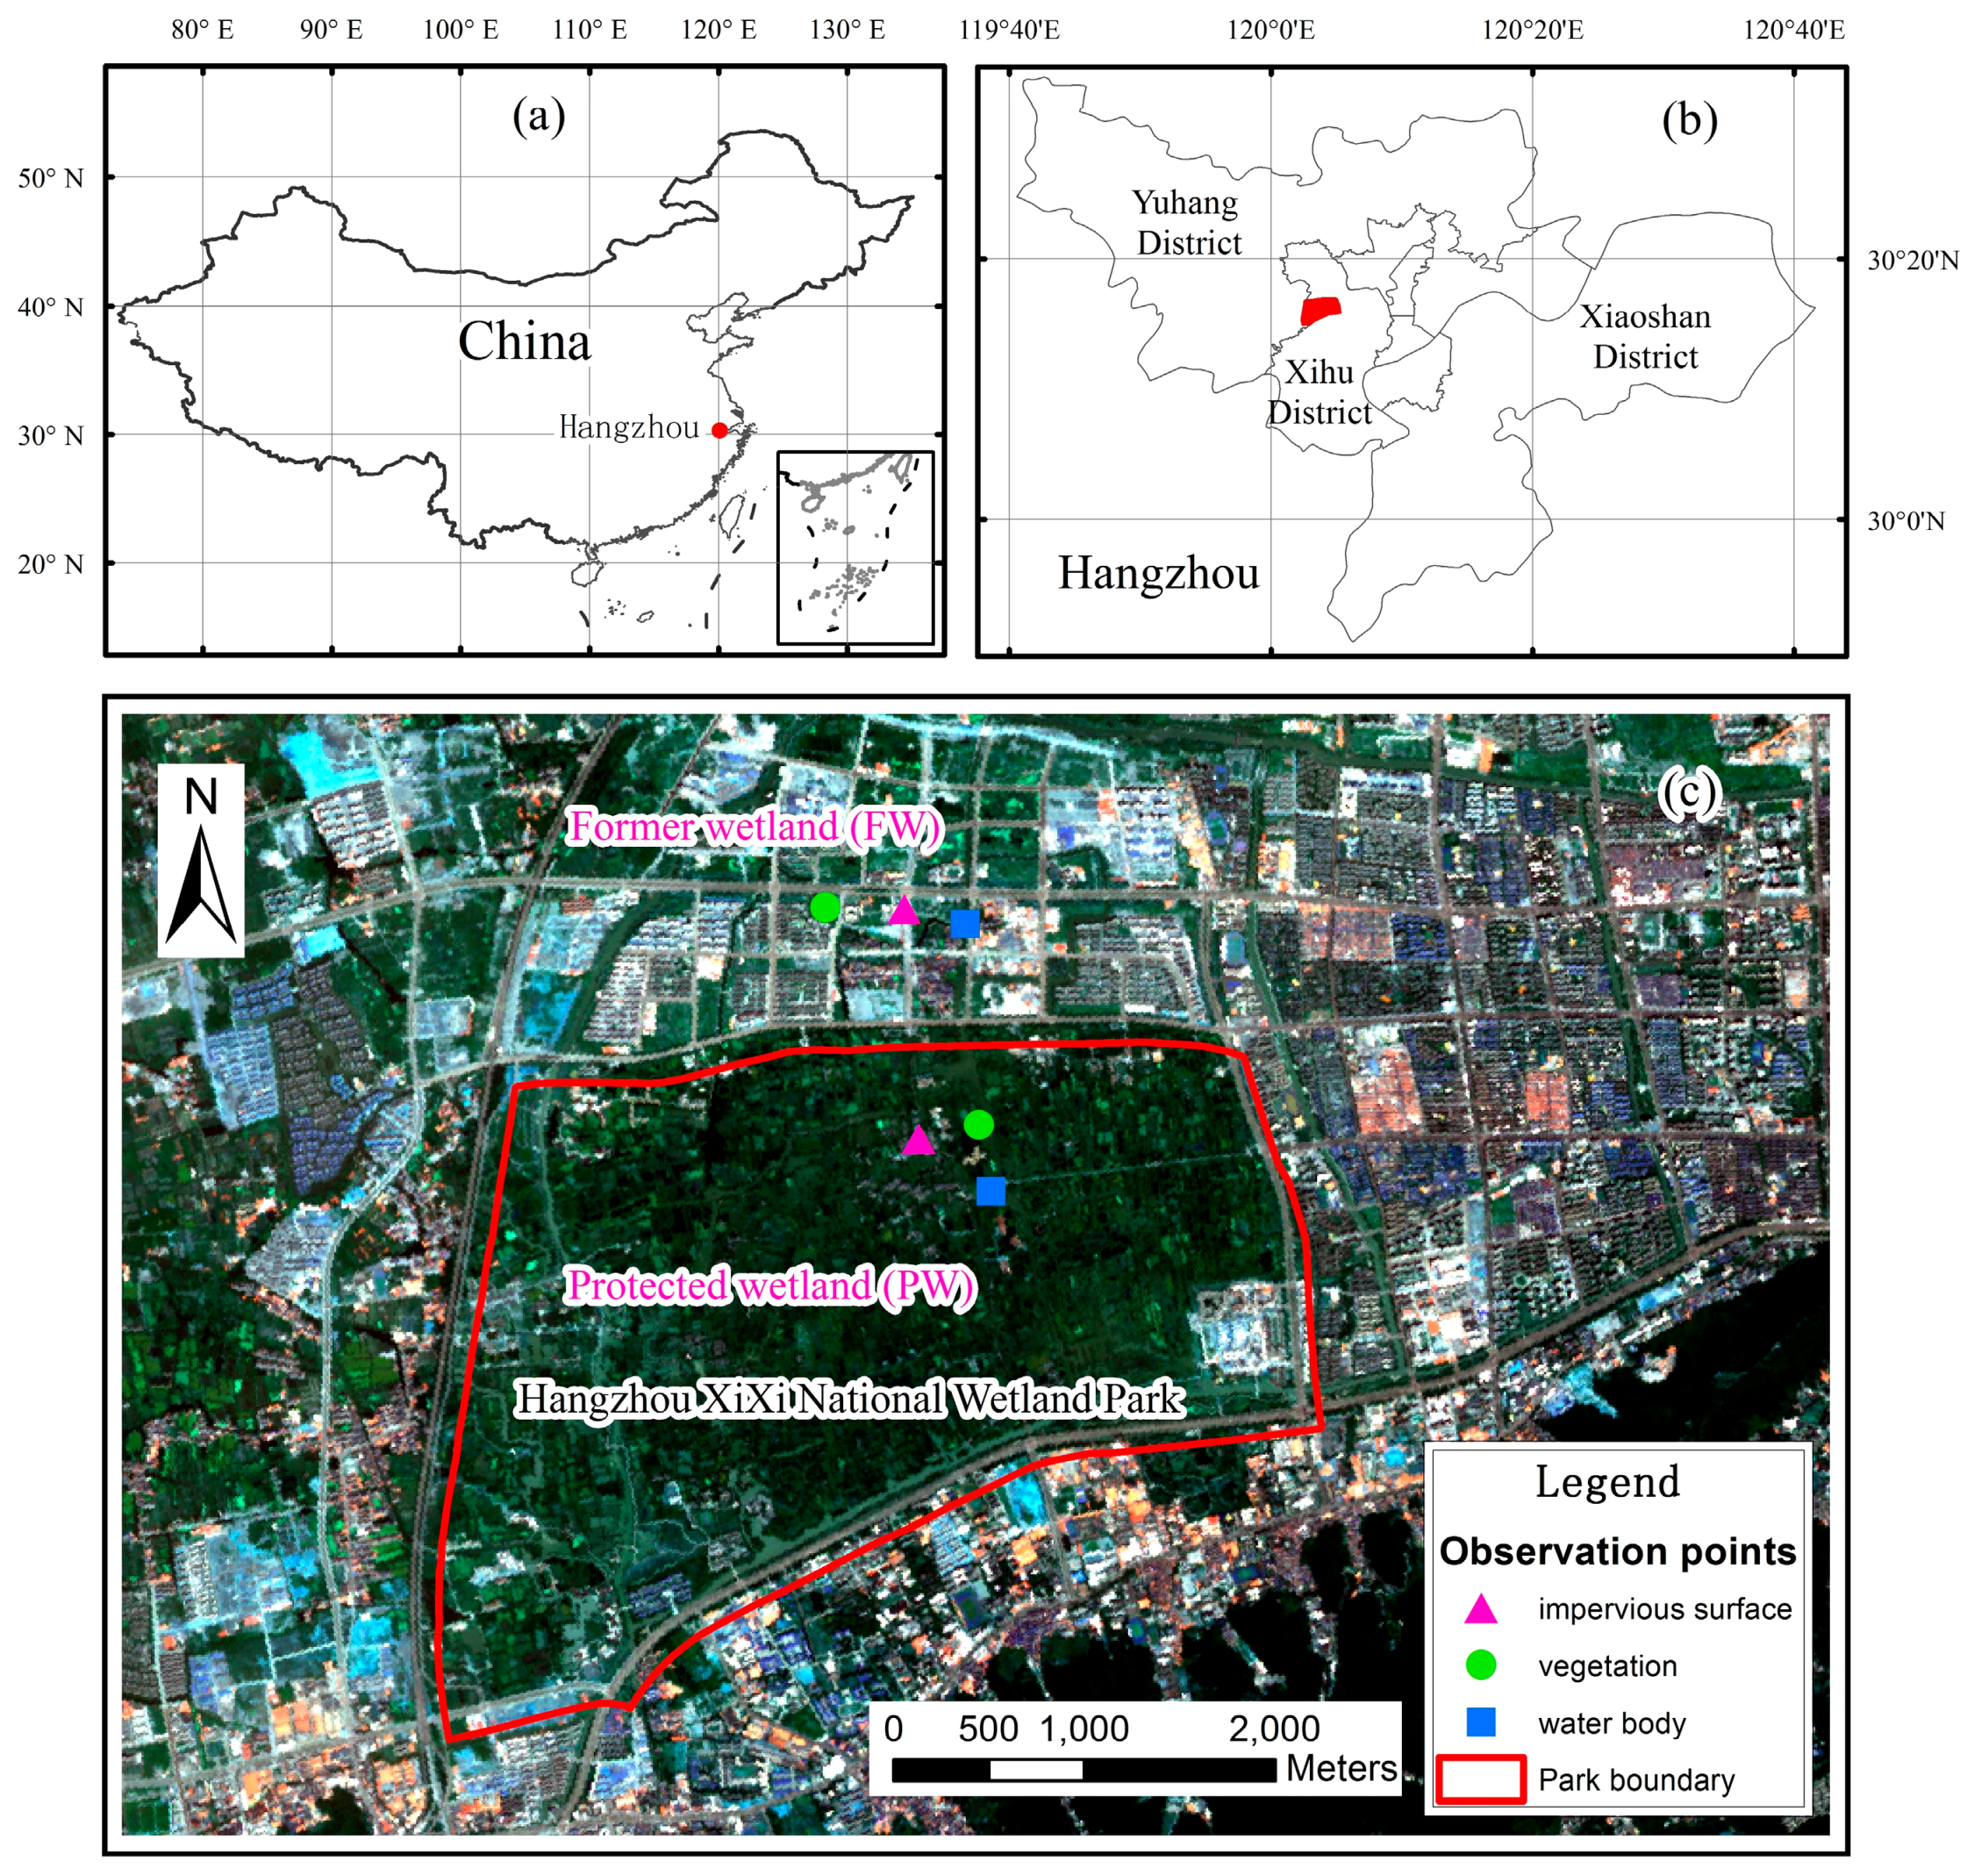
Hangzhou, a city located in East China, has been undergoing rapid urbanization for the past 30 years. According to the China City Statistical Yearbook, the area of Hangzhou’s urban construction land increased from 107 km2 in 1985 to 495 km2 in 2015. A large number of urban wetlands west of the city have been occupied by urban construction. To deepen the understanding on the microclimate regulation function of an urban wetland, this study analyzed the influence of urbanization of a suburb’s wetlands on the local climate by carrying contrast observations of the protected wetland area (PW) and the former wetland area (FW) in Xixi wetland.
2. Study Area
Hangzhou, the capital of Zhejiang Province, is located in a subtropical monsoon region. Its climate belongs to humid subtropical climate (Cfa) according to Köppen climate classification [
26], which characterized by hot, usually humid summers, and cool winters. Hangzhou is rich in wetland resources and has many famous wetlands, such as West Lake, Xixi, Qiantang River, and Grande Canal.
Xixi wetland, which is known as “the kidney of Hangzhou”, is a rare urban secondary wetland located west of the city. Xixi previously covered an area of up to 60 km
2, but has shrunk to 11 km
2 because of the urbanization of Hangzhou in the past 30 years. Hangzhou Xixi National Wetland Park was constructed in 2005 to protect Xixi wetland. In 2009, Xixi was successfully included in the “List of Wetlands of International Importance” [
27].
Xixi wetland mainly consists of fish ponds, rivers, lakes, and vegetation communities. The water body area accounts for approximately 70% of Xixi Wetland Park. The total length of the rivers in Xixi is about 110 km. Xixi wetland has abundant animal and plant resources, including numerous national key protected animals and plants, like
Loetes sinensis,
Glycine soja, and
Accipiter virgatus [
28,
29].
5. Discussions
5.1. Impact of Urbanization on Microclimate
Xixi wetland in the west of Hangzhou previously covered enormous acreages of approximately 60 km
2 of farming wetlands [
31]. However, since the 1990s, most of those wetlands were turned into urban land cover, with the exception of the strictly-protected Hangzhou Xixi National Wetland Park. Therefore, the impact of urbanization on the microclimate can be determined by comparing the meteorological parameters between PW and FW.
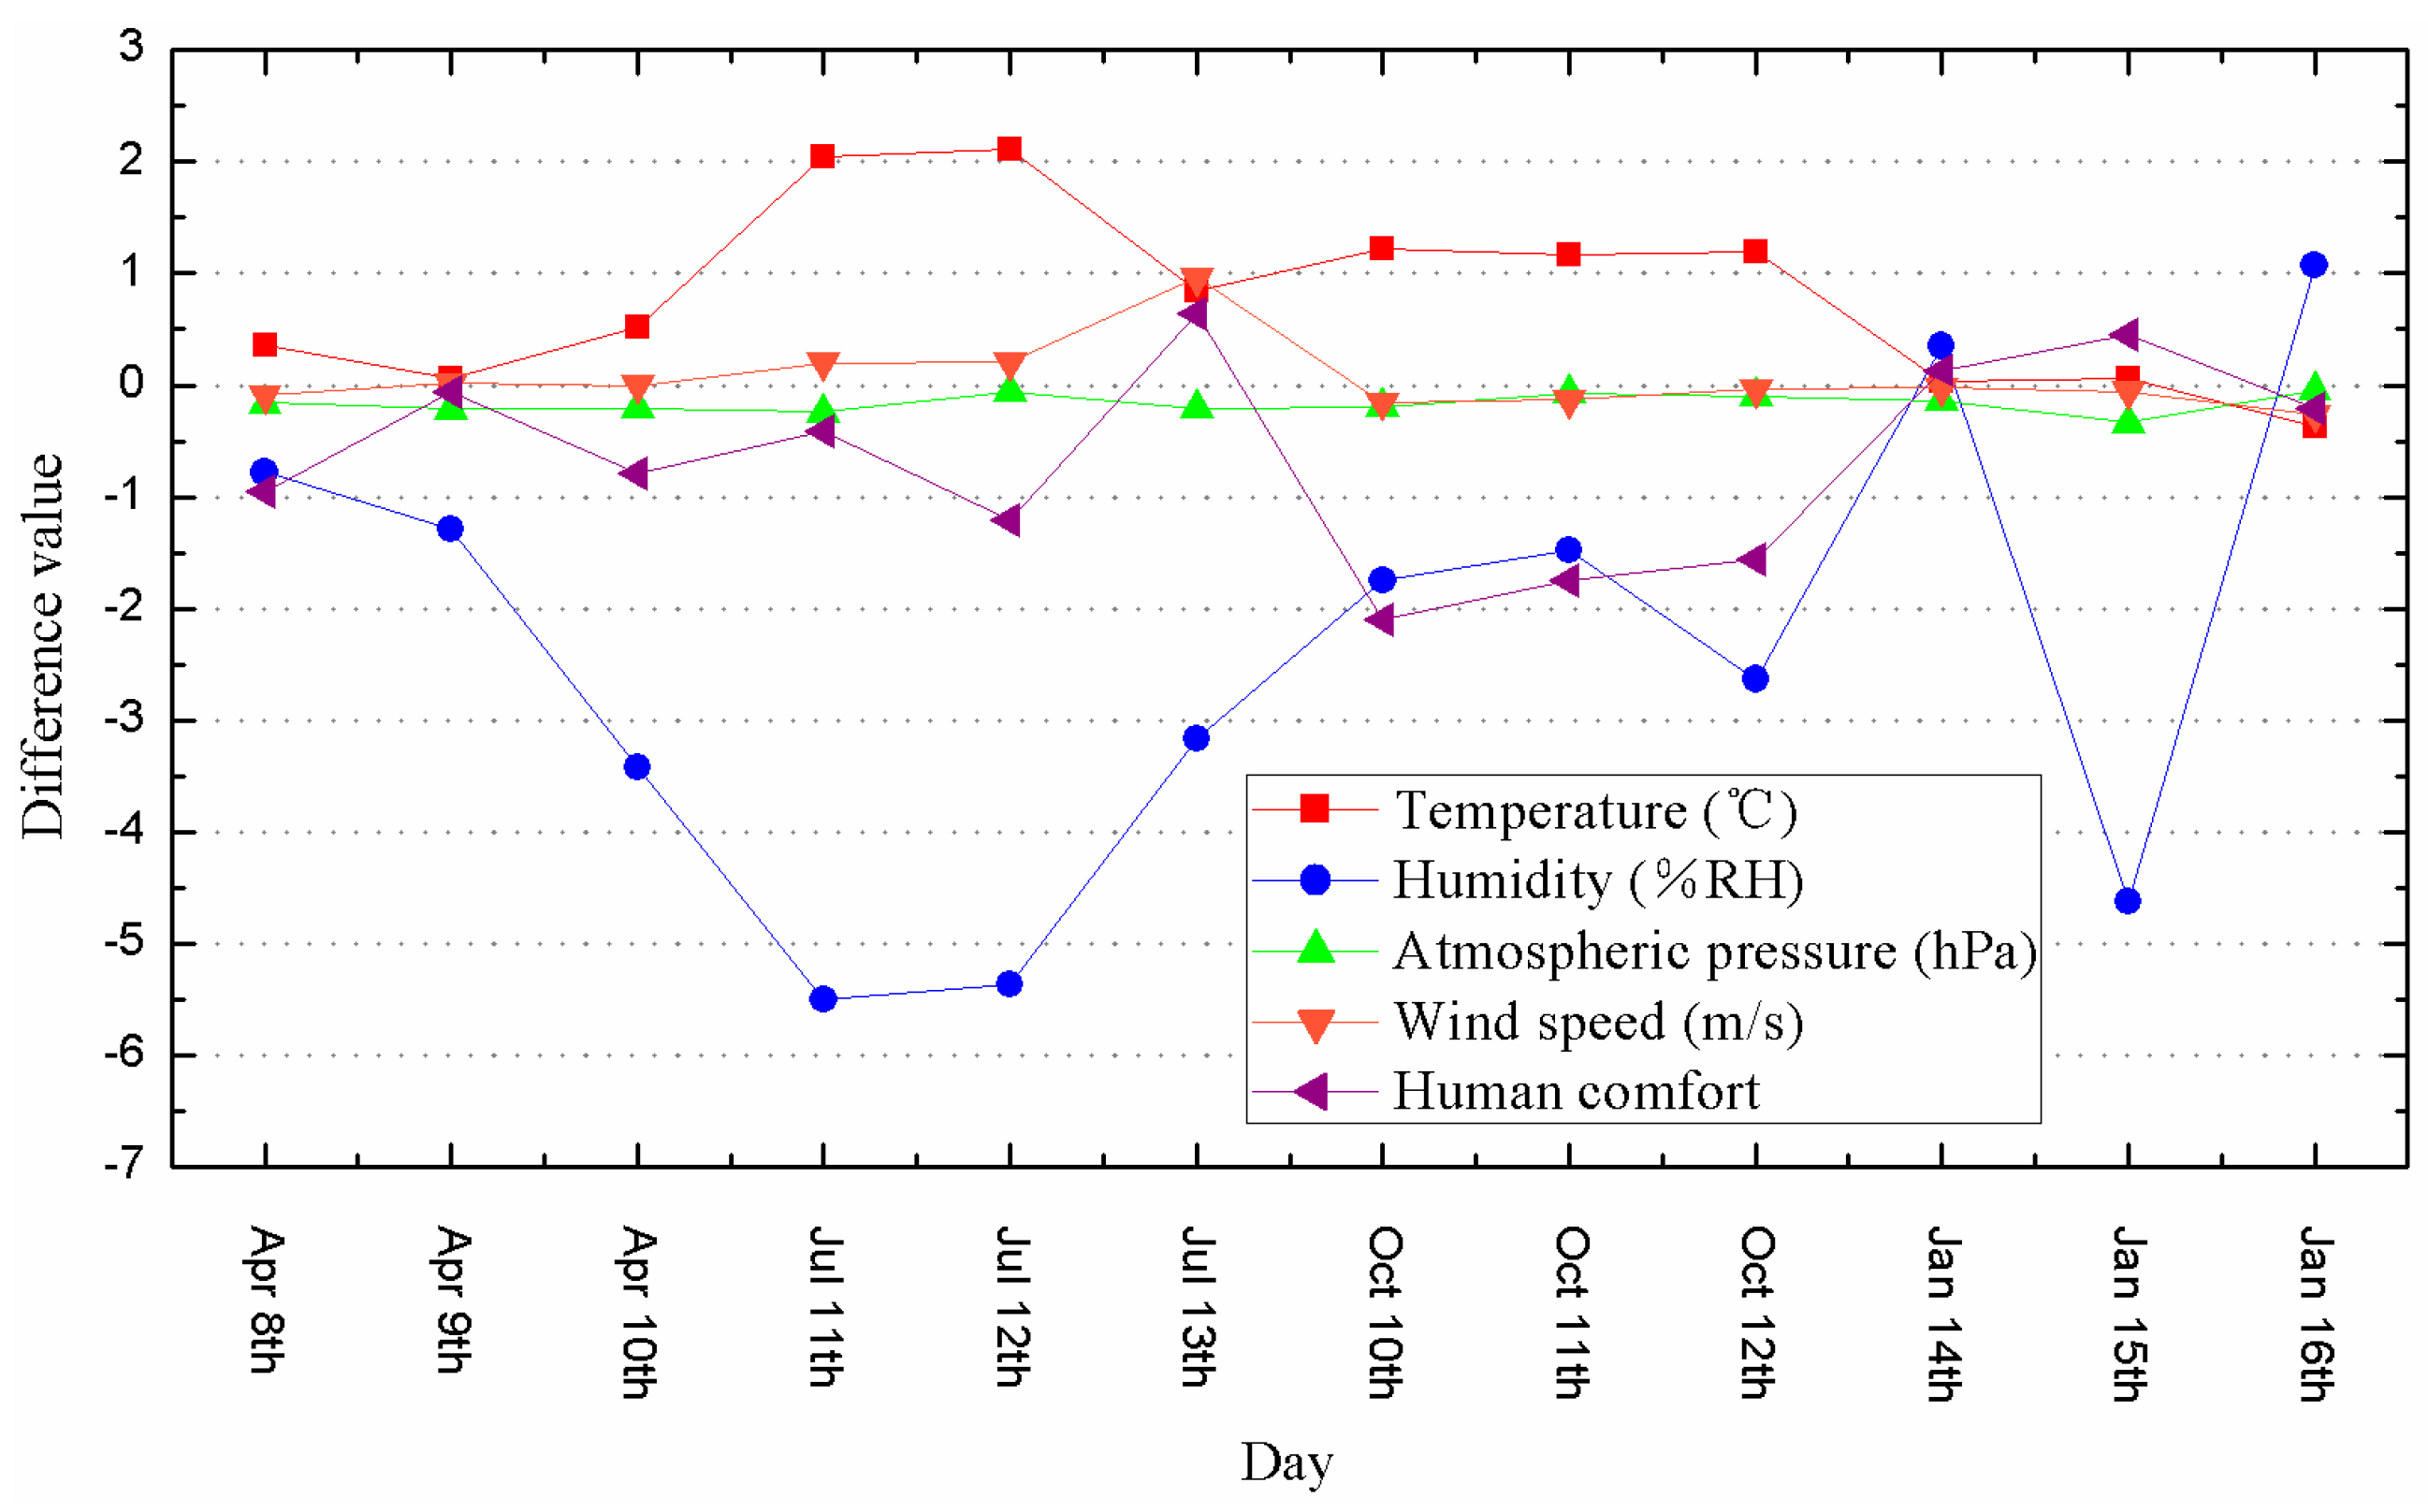
This study calculated the difference between the meteorological parameters of PW and FW and found the following results (
Figure 3).
Temperature. The average temperature of all observation points in FW is 23.11 °C, which is 0.77 °C higher than that in PW (22.34 °C). As for the seasonal distribution, the average temperature of FW is higher than that of PW in spring, summer, and autumn, with the maximum temperature difference of up to 1.67 °C appearing in summer. These findings indicated that Xixi wetland serves a cool-island effect in warm seasons and a warm-island effect in cold seasons. In fact, the cooling effect of Xixi wetland is 0.86 °C higher in summer compared with the observation results of Chang et al. in an urban park in Taipei [
15]. The increased cooling effect of Xixi wetland may be caused by the percentage of water bodies in Xixi wetland being larger than that in the urban park in Taipei.
Relative humidity. The average relative humidity of all observation points in FW is 58 %RH, which is 2.4 %RH lower than that in PW (60.4 %RH). As for the seasonal distribution, the average humidity of FW is lower than that of PW in all seasons. The maximum humidity difference of up to 4.7 %RH appeared in summer, whereas the minimum humidity difference of only 1.1 %RH occurred in winter. These findings imply that Xixi wetland has a humidifying function in all seasons.
Atmospheric pressure. The atmospheric pressure of FW is generally lower than that of PW, but the seasonal variation is not obvious.
Wind speed. The average wind speed of FW is 0.46 m/s higher than that of PW in summer, but has no considerable difference in other seasons.
Human comfort. The human comfort of FW is lower than that of PW in spring, summer, and autumn, with the maximum difference of up to 1.81 appearing in autumn. The human comfort of FW is slightly higher than that of PW in winter (0.12).
5.2. Microclimate Effects of Different Land Cover Types
Previous studies pay little attention to the land cover types in wetland regions, except for the water bodies [
22]. However, in most cases, water bodies, vegetation, and buildings are inseparable in the construction of urban wetland landscapes. Therefore, exploring the effects of various land cover types in wetland landscapes on the microclimate is necessary to present more pertinent criteria on urban wetland landscape planning. The different effects of each land cover type on the microclimate between FW and PW can be determined by comparing the meteorological parameters of each land cover type.
5.2.1. Vegetation
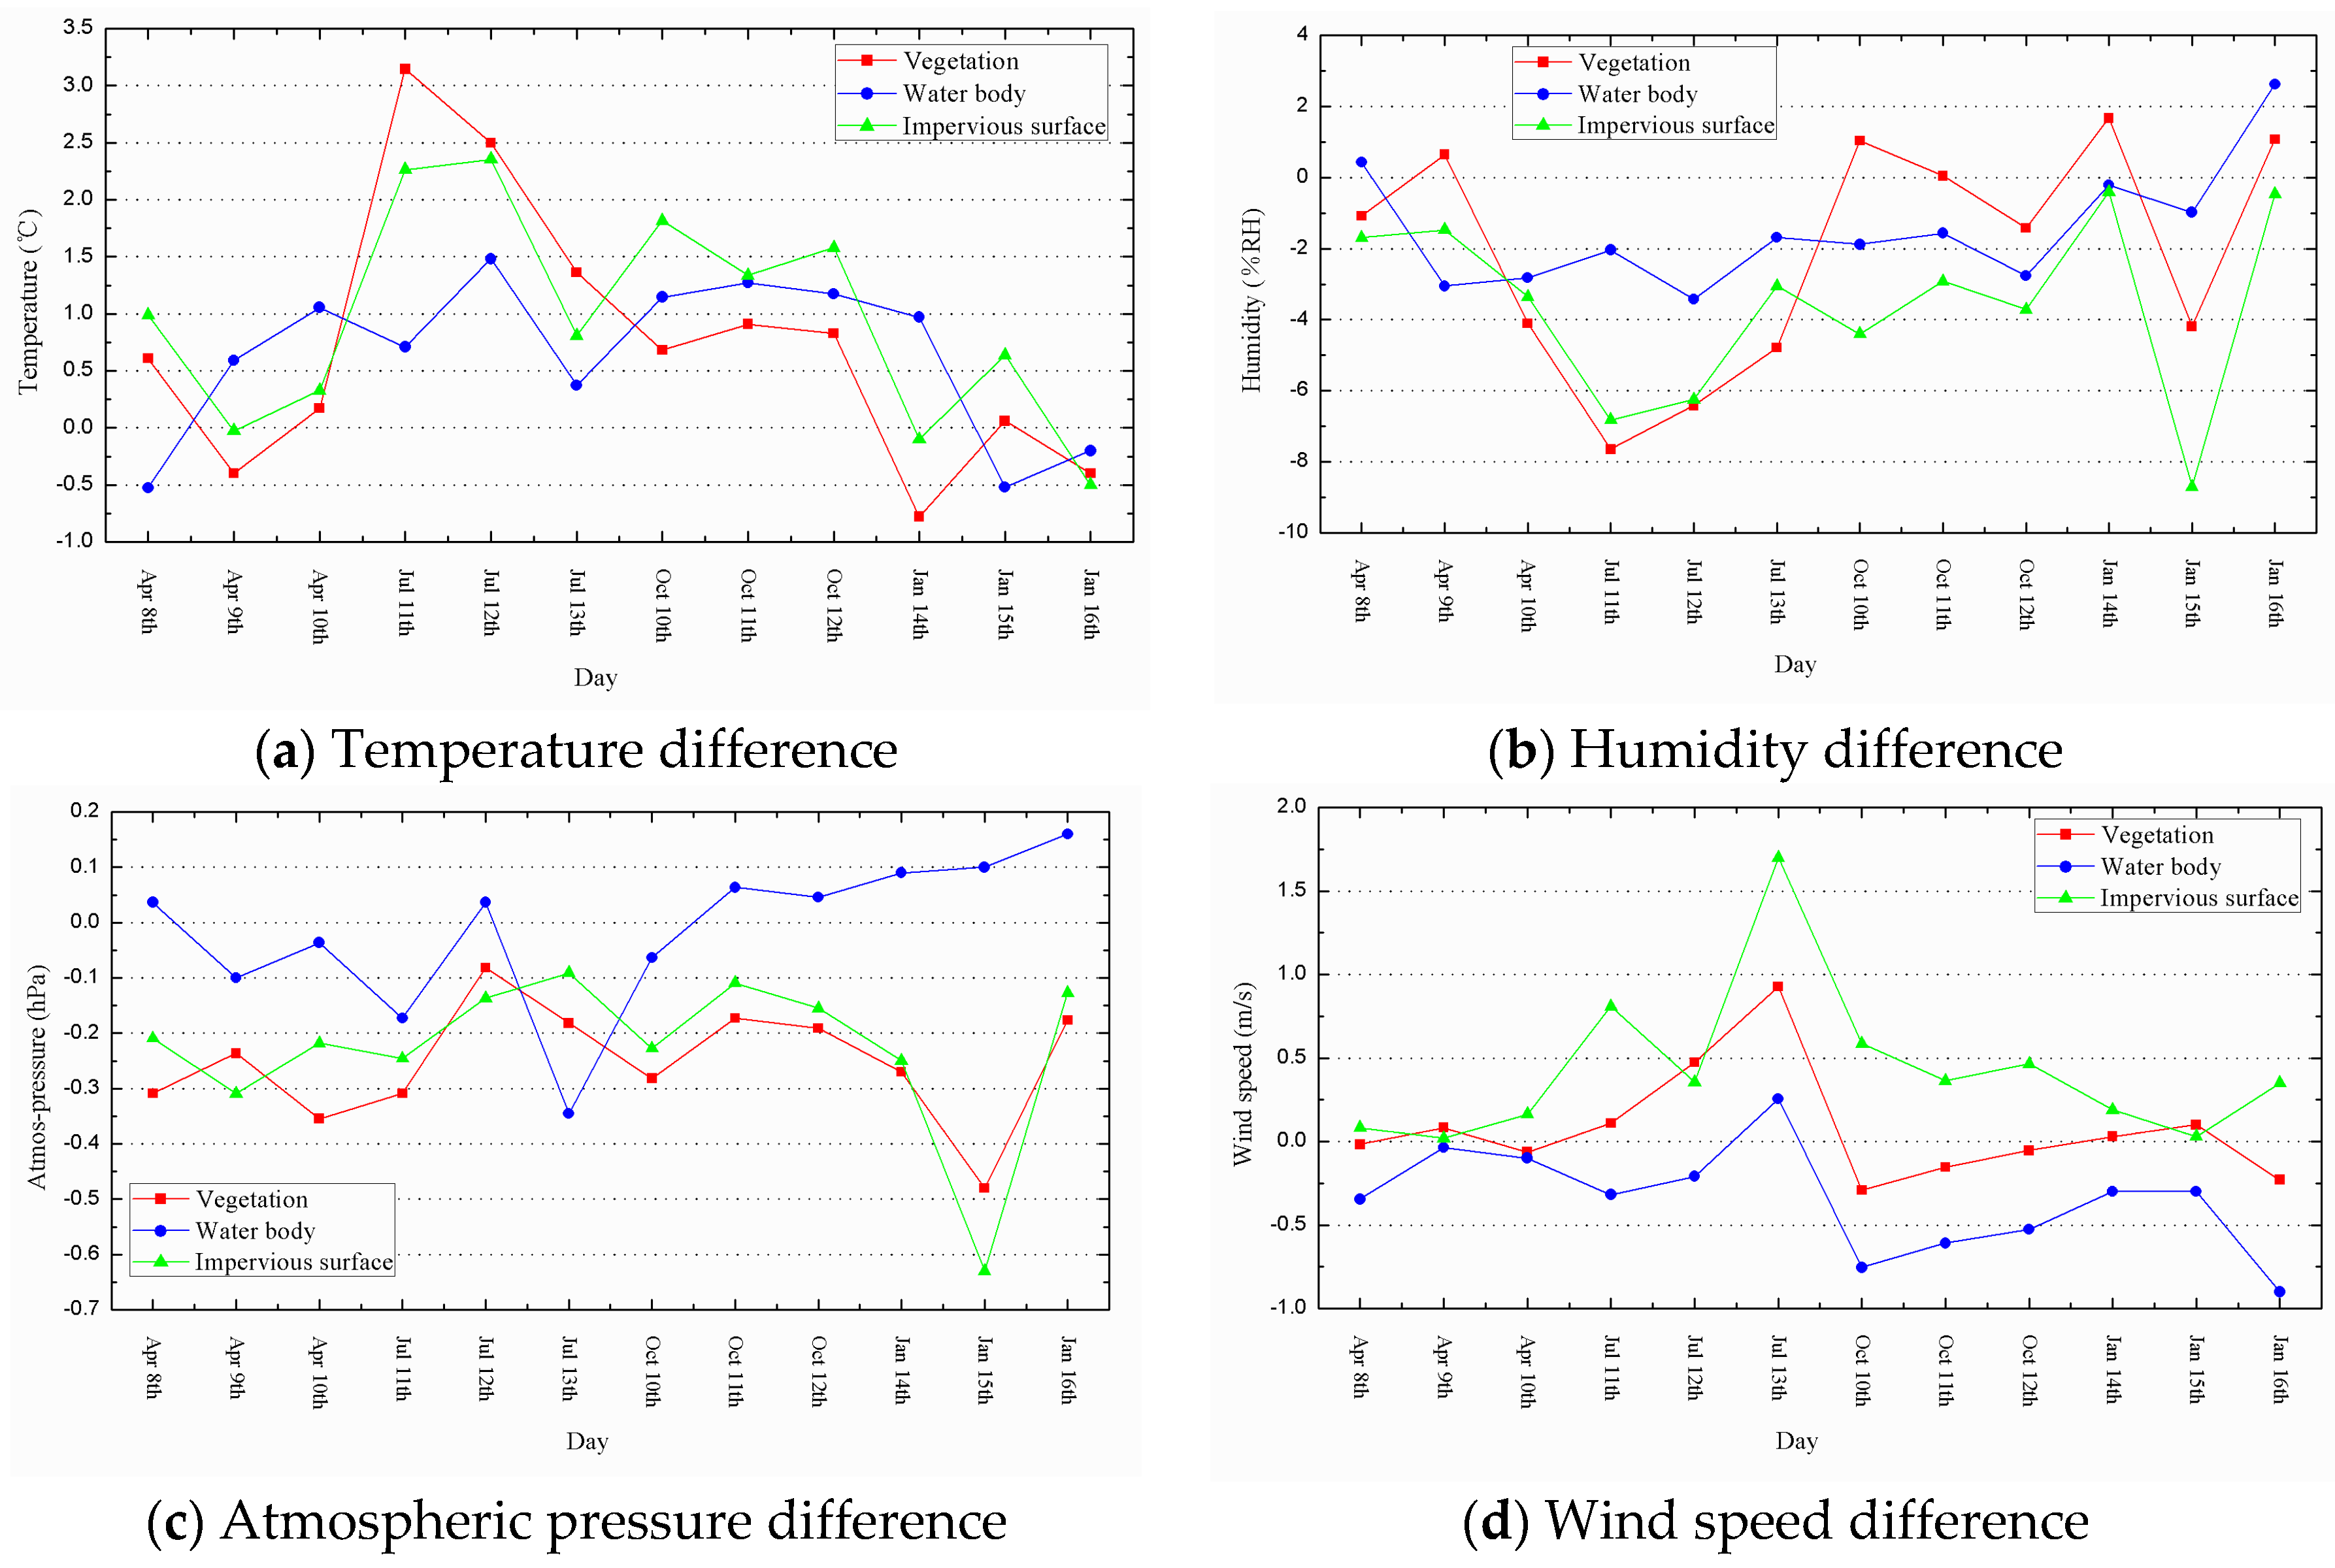
Air temperature.
Figure 4 shows that the air temperature of vegetation in FW is mostly higher than that in PW, indicating that the wetland environment can enhance the microclimate regulation function of vegetation. In addition, previous studies demonstrated that vegetation can reduce the temperature of its surrounding area mainly by shading and evapotranspiration [
32]. Therefore, the microclimate regulation function of vegetation will clearly have a seasonal variation for plants growth [
32], as confirmed by the results of the present study. The main species of trees in Xixi wetland are
Diospyros kaki Thunb,
Pterocarya stenoptera C. DC,
Salix matsudana Koidz, and
Paulownia Sieb. These species have great seasonal variation on vegetation coverage and evapotranspiration and contribute to the seasonal change of the microclimate regulation effects of vegetation.
Relative humidity. The variation tendencies of humidity and temperature generally appear as a negative correlation, with the correlation coefficient of −0.79.
Figure 4 shows that the humidity of vegetation in FW is mostly lower than that in PW, with the maximal difference of up to 7.7 %RH appearing in summer. One reason for this difference is that the water body in the Xixi Wetland Park helps increase the relative humidity. Plant growth is also more exuberant in wetlands, thereby significantly increasing evapotranspiration [
33] and relative humidity.
Atmospheric pressure. The atmospheric pressure of vegetation in FW is generally lower than that in PW, but the variation is not obvious.
Wind speed. The average wind speed of vegetation in FW is 0.93 m/s higher than that in PW in summer, but has no considerable difference in other seasons. The increase of wind speed in FW is due to the larger amplitude of climate change, more airflow, and the effect of narrow urban streets [
34].
5.2.2. Water Body
Air temperature.
Figure 4 illustrates that the air temperature of water bodies in FW is usually higher than in PW. This result, which is in accordance with previous studies [
35], indicates that acreage crucially influences the temperature regulation of wetlands. As for the seasonal variation, the temperature difference between FW and PW is the biggest in summer but the smallest in winter.
Relative humidity.
Figure 4 exhibits that the humidity of water bodies in FW is generally lower than that in PW, denoting that acreage also significantly affects the humidity regulation of wetlands. The larger the acreage is, the stronger the humidity regulation function of a water body. Moreover, the variation tendency of a water body’s humidity and temperature is similar with that of vegetation, which has a correlation coefficient of −0.67, because of the relationship between temperature and relative humidity.
Atmospheric pressure and wind speed. The results show no significant differences between FW and PW in atmospheric pressure and wind speed.
5.2.3. Impervious Surface
Air temperature.
Figure 4 shows that the air temperature of impervious surfaces in FW is mostly higher than that in PW. The air temperature of impervious surfaces is 0.45 °C, which is higher than that of the water bodies in FW and just 0.12 °C higher in PW. This finding indicated that the wetland environment can bring some cooling effects on impervious surfaces. As for the seasonal variation, the temperature difference between FW and PW is the largest in summer and the smallest in winter.
Relative humidity. The variation tendency of the humidity and temperature of impervious surfaces generally appeared as a negative correlation, with a correlation coefficient of −0.64. The absolute value of the impervious surfaces’ correlation coefficient is smaller than that of water body and vegetation, because impervious surfaces do not have a microclimate regulation function, which is only influenced by adjacent water bodies and vegetation.
Figure 4 also displays that the humidity of impervious surfaces in FW are usually lower than that in PW, with the biggest difference of up to 8.7 %RH between FW and PW appearing in winter on 15 January. However, considering that the humidity difference between the adjacent two days (14 January and 16 January) is small, the result is more likely to be caused by incidental factors. The greatest humidity difference between FW and PW appeared in summer from the aspect of each season’s average value.
Atmospheric pressure.
Figure 4 presents that the atmospheric pressure of impervious surfaces in FW is mostly lower than that in PW, but the difference is not obvious.
Wind speed. The wind speed of impervious surfaces in FW is generally higher than that in PW. The maximum difference is 1.7 m/s, which is greater than any other land cover type, because of the larger amplitude of climate change of the impervious surfaces and the effect of narrow urban streets.
5.3. Microclimate Stability Function of Xixi Wetland
The microclimate stability function of wetlands has been referred to in various literature [
36,
37,
38], but related quantitative research is rare. This section presents the quantitative analysis of the stabilizing effects of wetlands on the microclimate.
5.3.1. Overall Stabilizing Effect
The coefficient of variation (CV) for all observation points in FW and PW for each observation day was calculated to analyze the overall stability of meteorological factors in FW and PW.
Table 3 show that all CV of the meteorological factors in FW are higher than those in PW, indicating that Xixi wetland has a stabilizing effect on the microclimate in all seasons. As for a single meteorological factor, the stabilizing effect of wetlands on wind speed is the most obvious, with the difference of CV up to 33.8%, whereas the stabilizing effect on atmospheric pressure shows almost no difference.
5.3.2. Stabilizing Effect of Each Land Cover Type
The CV of each land cover type in FW and PW for every observation day was computed to analyze the stabilizing effect of each land cover type on the microclimate.
Table 4 illustrates that all CV of the land cover types in FW are higher than those in PW, indicating that the Xixi wetland has a stabilizing effect on microclimate for all land cover types. As for a single meteorological factor, the stabilizing effect of wetland vegetation is the most obvious on temperature, in which the difference of the CV between FW and PW is up to 2.99%. Meanwhile, the stabilizing effect of water bodies is the most obvious on humidity and wind speed, in which the difference of CV between FW and PW for each cover type is 2.0% and 104.6%, respectively.
5.4. Impact Factors
To understand the impact mechanism of meteorological factors on the microclimate effect of wetlands, this section presents the differences between each meteorological factor of FW and PW as an explained variable and considers the average value of all meteorological factors as explanatory variables. The impact factors of a wetland’s microclimate effect are also discussed by means of stepwise regressions.
5.4.1. Temperature Difference between FW and PW
Table 5 shows that air temperature significantly affects the cooling effect of wetlands. The higher the air temperature is, the greater the temperature difference between FW and PW and the stronger the wetland’s cooling effect. Moreover, humidity and atmospheric pressure have some positive effects on a wetland’s cooling effect. However, wind speed has certain negative impacts on the cooling effect of wetlands, an outcome that means the greater the wind speed is, the weaker the wetland’s cooling effect. This phenomenon is due to the increase of wind speed, which strengthens the heat exchange within the local scope and reduces the unbalanced distribution of heat.
5.4.2. Humidity Difference between FW and PW
Table 6 illustrates that solar radiation highly influences the humidifying effect of wetlands. The stronger the solar radiation is, the greater the humidity difference between FW and PW and the stronger the wetland’s humidifying effect. This phenomenon is due to the increase of solar radiation, which strengthens the evaporation in PW. Higher evaporation means more moisture in vapor form, which would increase the humidity of PW and enlarge the humidity difference between FW and PW.
5.4.3. Wind Speed Difference between FW and PW
Table 7 demonstrates that atmospheric pressure crucially influences the wind speed difference between FW and PW. The higher the atmospheric pressure is, the greater the wind speed difference between FW and PW.
6. Conclusions
6.1. Overall Impact of Urbanization on Local Microclimate
The results of this study show that the urbanization of suburban wetlands has an overall impact on the local microclimate and decreases human comfort. In the FW after urbanization, the following results were found: (1) the average temperature increased by 0.77 °C in four seasons, with the most intense increase of 1.67 °C occurring in summer; (2) the average relative humidity reduced by 2.4 %RH in four seasons, with the highest decrease of 4.7 %RH occurring in summer; (3) the average wind speed increased by 0.46 m/s in summer, but had no significant changes in other seasons; and (4) the human comfort of FW is lower than that of PW in spring, summer, and autumn, with the maximum difference of up to 1.81 appearing in autumn. Since the 1990s, the UHI effect of Hangzhou has gradually strengthened and the urban climate condition has worsened. These outcomes have a direct relationship with the conversion of wetland to urban construction land in Hangzhou. In the future, we must control the pace of urban sprawl during economic development. In addition, we should take some measures to protect suburbs’ wetlands. For example, we can demarcate the ecological protection red line of wetlands in urban planning.
6.2. Impact of Urbanization on Each Land Cover Type
- (1)
Urbanization reduces the microclimate regulation function of vegetation and water bodies. In comparison with the corresponding land cover type in PW, the average temperature and humidity of vegetation and water bodies in FW are 0.72 and 0.63 °C higher and 2.1 %RH and 1.5 %RH lower, respectively.
- (2)
In comparison with PW, the acreages of vegetation and water bodies in FW are smaller, their distributions are scattered, and their microclimate regulation functions are weaker. Therefore, acreage and spatial distribution affect the microclimate regulation function of vegetation and water bodies. In the process of urban development, we not only need to maintain a certain amount of urban wetlands, but also need to optimize its spatial distribution with relative concentration.
- (3)
The air temperature of impervious surfaces is 0.45 °C higher than that of water bodies in FW but just 0.12 °C higher in PW. This result indicates that the wetland environment can bring some cooling effects on impervious surfaces.
- (4)
The maximum differences between the meteorological elements of FW and PW mainly appear in summer, indicating that the maximum effects of microclimate regulation of wetlands occur in summer. Hangzhou is very hot in summer, which highlights the importance of urban wetland’s microclimate regulation function. Therefore, the cities that have similar climate with Hangzhou should pay more attention to urban wetland protection, so as to take full advantage of wetland’s microclimate regulation function.
6.3. Microclimate Stability Function of Wetlands
- (1)
Overall stabilizing effect. All CV of the meteorological factors in FW are higher than those in PW, implying that Xixi wetland has a stabilizing effect on the microclimate in all seasons.
- (2)
Stabilizing effect of each land cover type. The stabilizing effect of wetland vegetation is the most obvious on temperature, whereas that of water bodies is the most obvious on humidity and wind speed.
6.4. Impact Factors
This study discussed the impact factors of a wetland’s microclimate effect by means of stepwise regression. The following conclusions can be drawn from the results.
- (1)
Air temperature, humidity, and atmospheric pressure have positive influences on a wetland’s cooling effect, with the impact of air temperature as the biggest influence. However, wind speed has a negative impact on a wetland’s cooling effect.
- (2)
Solar radiation has positive effects on a wetland’s humidifying effect. The stronger the solar radiation is, the bigger the humidity difference between FW and PW and the stronger the wetland’s humidifying effect.
- (3)
Atmospheric pressure significantly affects the wind speed difference between FW and PW. The higher the atmospheric pressure is, the greater the wind speed difference between FW and PW.
These findings can be used to carry out the spatial planning of urban wetlands. For example, if we want to construct a wetland park, then we can choose a place that can make full use of wetland’s microclimate regulation function according to the spatial differences of the meteorological parameters.


