Article

Assessment of Urban Ecosystem Health Based on Entropy Weight Extension Decision Model in Urban Agglomeration

1
School of Resource and Environment Science, Wuhan University, Wuhan 430079, China
2
Key Laboratory of Geographic Information System, Ministry of Education, Wuhan University, Wuhan 430079, China
*
Author to whom correspondence should be addressed.
Sustainability 2016, 8(9), 869; https://doi.org/10.3390/su8090869
Submission received: 8 April 2016 / Revised: 25 August 2016 / Accepted: 25 August 2016 / Published: 29 August 2016
(This article belongs to the Section Social Ecology and Sustainability)

Abstract

:
Urban ecosystem health evaluation can assist in sustainable ecological management at a regional level. This study examined urban agglomeration ecosystem health in the middle reaches of the Yangtze River with entropy weight and extension theories. The model overcomes information omissions and subjectivity problems in the evaluation process of urban ecosystem health. Results showed that human capital and education, economic development level as well as urban infrastructure have a significant effect on the health states of urban agglomerations. The health status of the urban agglomeration’s ecosystem was not optimistic in 2013. The majority of the cities were unhealthy or verging on unhealthy, accounting for 64.52% of the total number of cities in the urban agglomeration. The regional differences of the 31 cities’ ecosystem health are significant. The cause originated from an imbalance in economic development and the policy guidance of city development. It is necessary to speed up the integration process to promote coordinated regional development. The present study will aid us in understanding and advancing the health situation of the urban ecosystem in the middle reaches of the Yangtze River and will provide an efficient urban ecosystem health evaluation method that can be used in other areas.

1. Introduction

Urban agglomeration (UA), which plays an important role in integrating regional coordinated development, building competitive industry clusters, and promoting industrial transfers between different areas, has gradually become the principal geographic unit for countries to participate in global competition and China’s international division of labor [1,2]. However, over the past three decades the development of the UA has had profound effects on the sustainability of the ecosystem. As one of populous social-economic-natural complex ecosystem, the UA ecosystem is more fragile, which is further aggravated by the large demand of resources for industrial production, human consumption, and pollutant emissions [3,4]. A considerable amount of factors and its related complex interactions bring a deep impact on ecosystem health and human health with the growth of economy, population, industrialization and urbanization [5]. Sustained and intensive human activities in the UA have caused serious problems, such as water shortages, air and soil pollution, a decline in biodiversity, depletion of natural resources, and the degradation of major ecosystems. These problems have not only placed considerable burdens upon the development quality of the UA and human life, they have also hindered sustainable ecosystem development and threatened regional and national securities [6]. With awareness of eco-environmental protection enhancing, studies on the health and security of ecosystems in the UA cities have drawn more attention.
The study of urban ecosystem health (UEH) originated from natural resource management, environmental sciences, ecosystem ecology, and applied ecology [7,8,9,10,11]. Several scholars have established the theoretical and methodological foundations of studying the health of a natural ecological system [8,9,10,12,13,14] since the 18th century, which laid the theoretical foundation for the healthy development of the urban ecosystem. As research on UEH increased during the 2000s, more scholars have recognized the UEH’s characteristics of uncertainty and fuzziness [15,16] and have actively discussed its assessment method and practical applications [3,15,17,18,19,20]. As the foundation of UEH research, the UEH evaluation is qualitative or quantitative assessment and classification for quality status of complex ecosystem, which the purpose is to understand the underlying stress or health of ecosystems so that can provide scientific basis for the resource utilization, eco-environment protection and the social construction and development [7,8,21]. Extensive efforts have been made to measure UEH by using the health state of the natural ecological system, the socioeconomic system, and human health [9,15,17,18,22]. However, although considerable research has been conducted in cities like Beijing, Shanghai, and Guangzhou [18,19,21], studies regarding the UEH of metropolis areas in China remain scarce until now.
At present, many methods have been used to satisfy a health assessment, including the methods of energy analysis [23], the fuzzy optimal assessment model [24], the attribute theory model [25], and the catastrophe progression method [26]. Although these methods pay attention to the characteristics of UEH [3] and have played a certain role in promoting the research of UEH, there are some weaknesses, such as information omissions in the process of calculation and the computation processes are quite complicated [27,28]. The matter-element extension model is a new method to deal with the incompatibility problems from the quantitative and qualitative perspectives. The model consisted of objects, characteristics and values. In solving problems, it can directly establish a formal model and quantitative analysis methods for an incompatible problem, according the matter-element extension set and correlation function [29]. Therefore, the content and the relationship between the quantity and the quality of the comprehensive evaluation can be clearly illustrated [30]. At the same time, the structure of the model is simple, the calculation is easy, and the calculating result is accurate. Crucially, if the health index exceeds the health grading standard, the model can still be calculated by using the comprehensive correlation degrees, which is barely achieved by using other methods.
This study used the 31 cities of UA in the middle reaches of the Yangtze River as its case and generated an entropy weight extension decision model to diagnose the performance of the UA ecosystem health. It cannot only avoid subjectivity in determination of the index weight, it can also effectively overcome the incompatibility of the evaluation index of UEH. The evaluation results are reasonable and enrich the methods of UEH assessment, and calculations are simple and easy. Furthermore, it provides important practical guidance for promoting the healthy, sustainable, and stable development of the city clusters in Central China.
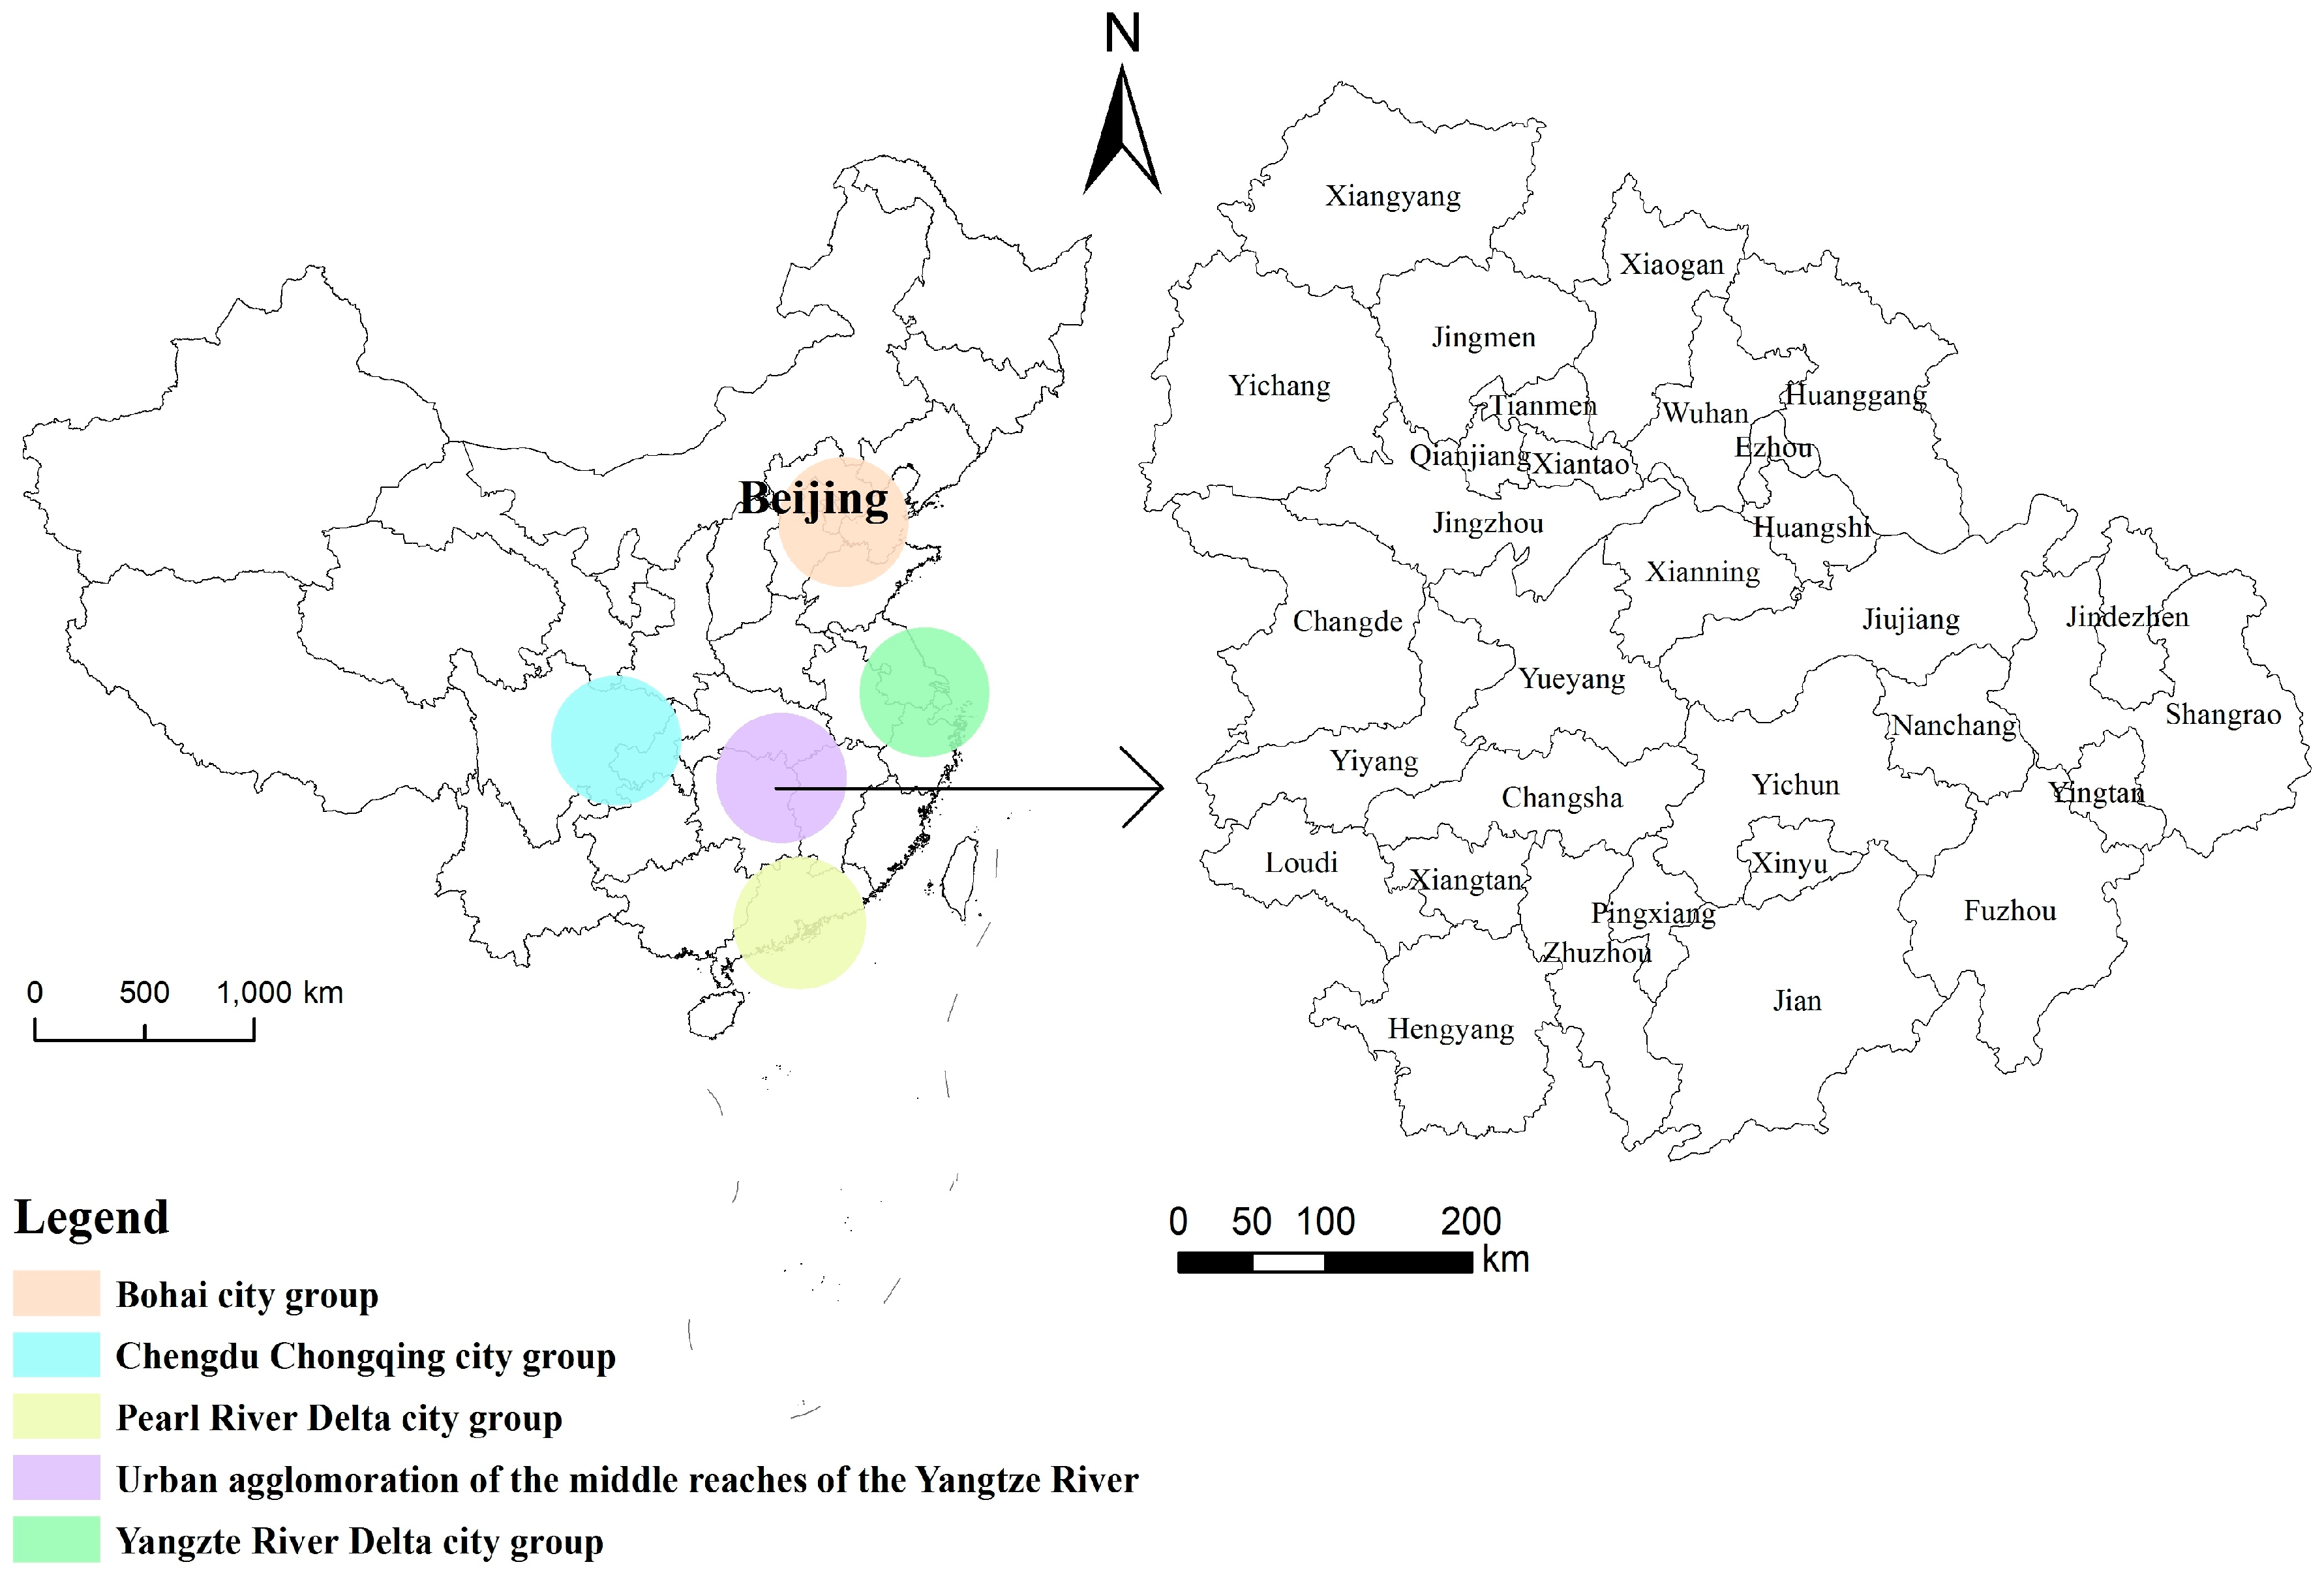
2. Study Area

The UA in the middle reaches of the Yangtze River, also known as the “Triangle of Central China”, centers on the three provincial capital cities of Wuhan, Changsha, and Nanchang and what constitutes the cross-province region by combining the Wuhan Metropolitan Areas, the Ring of Chang-Zhu-Tan City Clusters, and the Poyang Lake Ecological Economic Zone (see Figure 1). The Erguang highway and multiple high-speed railways (Jingguang, Jingjiu, and Hukun railways) are the ties that form a whole. The UA in the middle reaches of the Yangtze River is situated in Central China and is connected to the Central Plains. This UA area is a gateway to China’s north–south and east–west linkages, and is an important part of the Yangtze River Economic Zone. Meanwhile, the UA in the middle reaches of the Yangtze River is the core area of economic and social development; it plays a crucial role in the urbanization of China, is the fourth pole of China’s regional economic development, and is considered one of the most important UAs. The land area of the UA is 317,000 km2, accounting for 3.3% of China’s land area. In 2014, the total population was 1.2 million, and the gross domestic product (GDP) was 6 × 10⁶ million Yuan (RMB), accounting for 8.8% and 3.3% of the nation, respectively.
The area surrounding the middle reaches of Yangtze River has been extensively recognized for its excellent geographic position, convenient transportation system, solid industrial foundation, and abundant science and technology resources [2]. Given its significant role in enhancing economic development in central China and integrating regional coordinated development, the Chinese government implemented several national development strategies in the region, such as the Rise of Central China Plan, the National Resource Conservation and Environment-Friendly Society Construction Comprehensive Reform Pilot Area, the Poyang Lake Ecological Economic Zone, and the development planning of the UA in the middle reaches of the Yangtze River. In recent years, the development of UA has entered a new era with the implementation of the above strategies [31]. With the acceleration of urbanization and industrialization of UA, the coverage of industrial and commercial area expands and the population rises annually.
An increasingly alarming effect of human activity indicates that the ecosystem of the UA will inevitably face profound pressure, which can hinder the healthy, sustainable, and stable development of the ecosystem and consequently threaten regional and national securities. For example, in certain primary bodies of water in city clusters, such as the Poyang and Dongting Lakes, the area decreased, the quality deteriorated because of eutrophication, and the eutrophication levels were further aggravated by the effects of socioeconomic development [32,33]. Atmospheric pollution, particularly PM2.5 pollution, is also serious in the UA. Shortages of quality-induced water and increased soil pollution have also occurred in the region. Cadmium pollution in rice, which occurred in Dongting, has been the focus of significant attention. Transportation pressure, land degradation, and energy shortages have directly affected and threatened the development efficiency of the UA.

3. Indicators Selection and Data Source

3.1. Indicators of UA Ecosystem Health

Based on previous academic achievements and regional characteristics, this study established a comprehensive indexing system for selecting reasonable indicators and scientifically evaluating the ecosystem health of the cities in the UA located in the middle reaches of the Yangtze River [17,18,20,21]. Meanwhile, the choice of index system took into consideration the availability, operability, hierarchy, and completeness of the scientific data.
The index system is composed of three dimensions (natural, economic, and social systems) and five factors (vigor, structure, resilience, service function, and population health). In this study, vigor indicates a city’s metabolic ability, which reflects the productivity and resource consumption of a region. Structure, which refers to configuration diversity in terms of the urban ecosystem, reflects the economic, social, and natural structure or relationship. Resilience indicates the function of an urban ecosystem to keep the structure’s usability and the recovery rate under natural and human disturbance. Service function refers to the function of an urban ecosystem to provide the carrier of human production and life. Population health reflects the health of human physical and mental aspects present in the current environment. These factors were also divided into positive or negative types, depending on their effect on the UA ecosystem health (Table 1).
“Positive” denotes the ecosystem health state improving with indicators’ values increasing; “negative” represents the ecosystem health state deteriorating with indicators’ values increasing. All factors were positive indicators, except for energy consumption per 10,000 Yuan of GDP, water consumption per 10,000 Yuan of GDP, the per capita annual disposable income ratio of urban and rural areas, Engel’s coefficient of urban households, and the urban area’s population density. In this study, the classification of most indicators’ attributes draw on the experience of the previous academic achievements [17,18,20,21], except for the per capita annual disposable income ratio of urban and rural areas and the urban area’s population density. The classification of these two indicators’ attributes is based on the development actuality and the State Environmental Protection Agency’s policy (the proposed regulations on the construction index of eco-county, eco-city, and eco-province). For example, if the urban area’s population density is maintained at a reasonable interval it is better, but if it is out of the interval, it may arouse a threat to the sustainable development of urban ecosystem health. As for the cities of UA, after the year 2010, the urban area’s population density is higher than national eco-city population density standard, which is also referred to as a negative indicator.

3.2. Data Source

The 2014 China City Statistical Yearbook was selected as the main data source. The 2014 Hubei Statistical Yearbook, the 2014 Hunan Statistical Yearbook, the 2014 Jiangxi Statistical Yearbook, the 2013 Water Resources Communiqué of Hubei, the 2013 Water Resources Communiqué of Hunan, the 2013 Water Resources Communiqué of Jiangxi, and 2013 National Economic and Social Development Statistical Bulletins of Tianmen, Xiantao, and Qianjiang were introduced as complementary data sources [34,35,36,37,38,39,40,41,42,43].

4. Method

Matter–element extension put forward a new research field to solve contradictory problems by the formalization method, which was proposed by Cai in the 1990s [44]. Its basic theory is as below.

4.1. Definition of Matter–Element

Matter–element is used to describe the characteristics of things. If N represents matter, c represents its characteristics, and v is the values of c. Then, the ordered triad R = (N, c, x) can be described as the basic element for describing things, namely, the one-dimensional matter–element. If N has n characteristics c1, c2, …, cn and the corresponding values are x1, x2, …, xn, then the n-dimensional matter–element can be expressed as Equation (1):
R = [ N c 1 x 1 c 2 x 2 c n x n ]

4.2. Determination of the Classical and Segment Domains

According to extension theory, the classical domain describes the corresponding characteristics of each grade, while the segment domain describes the collectivity quantity value range of the characteristics.
The ordered triad Roj = (N0j, ci, voji) was defined as the classical domain matrix of UA ecosystem health evaluation, where Noj is the jth grade (j = 1, 2, …, n) and ci is the ith character of the jth grade. The interval (aoji, boji) is the quantity value range of the jth grade with respect to ci, which is called the classical domain. The corresponding classical domain complex element matrix can be expressed as follows:
R o j = ( N o j c i v o j i ) = ( N o j c 1 v o j 1 c 2 v o j 2 c n v o j n ) = ( N o j c 1 ( a o j 1 , b o j 1 ) c 2 ( a o j 2 , b o j 2 ) c n ( a o j n , b o j n ) )
The ordered triad Rp = (Np, ci, vpi) was defined as the segment domain matrix. The quantity value range (api, bpi) is the segment domain of the characteristics of the ith index. According to extension theory (aoji, boji) ∈ (api, bpi) the corresponding segment matrix can be expressed as follows:
R p = ( N p c i v p i ) = ( N p c 1 v p 1 c 2 v p 2 c n v p n ) = ( N p c 1 ( a p 1 , b p 1 ) c 2 ( a p 2 , b p 2 ) c n ( a p n , b p n ) )

4.3. Construction of the Correlation Function Value

The correlation degree of each characteristic i (i = 1, 2, …, n) to each grade j (j = 1, 2, …, m) can be calculated as follows:
K j ( v i ) = { ρ ( v i , V o j i ) ρ ( v i , V p i ) ρ ( v i , V o j i ) ,    v i V o j i ρ ( v i , V o j i ) | V j i | , v i V o j i
where | V o j i | = b o j i a o j i ,
ρ ( v i , V o j i ) = | v i a o j i + b o j i 2 | b o j i a o j i 2 , ρ ( v i , V p i ) = | v i a p i + b p i 2 | b p i a p i 2 ,
where vi, Voji, and Vpi represent the value of the matter-element of urban ecosystem health, the value range of the classical domain of urban ecosystem health, and the value range of the segmented domain of urban ecosystem health, respectively. ρ(vi, Voji) is the distance between any points vi and the classical domain Voji = [aoji, boji], while ρ(vi, Vpi) is the distance between any points vi and segment domain Vpi = [api, bpi].

4.4. Information Entropy

Determining the weights of the evaluated indices is one of the important parts in comprehensive evaluation and has a remarkable effect on the diagnosis result. The methods to determine the weight are usually divided into two categories. One category is subjective weighting methods; for instance, the expert meeting method, analytical hierarchy process (AHP), analytic network processes (ANP), and Delphi method. The other is objective weighting methods, which includes information entropy method, principle component analysis, deviation and mean square difference method, etc. Compared with objective weighting, subjective weighting is easily influenced by the experts’ subjective consciousness, which has a certain deviation and cannot correctly reflect the relationship between the indicator data [21].
Information entropy is a measure of uncertainty, which represents the disorder degree of a system state. In this study, information entropy was employed with the advantage of relatively objective options, which minimizes randomness and ensures that the result will be more objective and reasonable. After the establishment of the standardized matrix I, the jth index entropy value Hj can be acquired by using the following formula:
I = ( I i j ) m × n = [ I 11 I 1 n I m 1 I m n ]
where Iij represent the original value of the jth (j = 1, …, n) indicator of the ith object (I = 1, …, m). The sample range normalization approach was utilized to process the evaluation indicator.
x i j = { ( I i j min ( I i ) ) ( max ( I i ) min ( I i ) )    the positive indicator ( max ( I i ) I i j ) ( max ( I i ) min ( I i ) )    the negative indicator
where max(Ii) is the maximum value of Ii and min(Ii) is the minimum value of Ii. After normalization, Iij will be standardized into xij.
H j = k i = 1 n y i j I n y i j
where y i j = x i j / i = 1 m x i j and k = 1 / I n i .
When y i j = 0 and y i j I n y i j = 0 , the jth index entropy weight wj can be acquired by using the following formula:
w j = 1 H j j = 1 n ( 1 H j )
where 0 w j 1 and i = 1 n w j = 1 .
By the above four main steps, the weights of 22 indicators were calculated (see Table 1).

4.5. Construction of the Comprehensive Correlation Degrees

The comprehensive correlation degree Kj (Nj) of the evaluated samples Nj with respect to the jth grade can be obtained as follows:
K j ( s j ) = i = 1 n w i K j ( v i )
The grade and attributive degree of the evaluated object tend to convert to adjacent levels that can be derived from K0(S0) as follows:
K 0 ( S 0 ) = max j ( 1 , 2 , , n ) K j ( s j )
The larger the K0(S0) value was the more stable the evaluation object (evaluation index) in the corresponding grade. The smaller the K0(S0) value was the more the attributive degree of evaluation object (evaluation index) and tended to convert to adjacent levels. When the Kj(Sj) value in each grade was closer, the trend of transformation was more evident. If all Kj(Sj) values were negative, then the quality of the evaluation object (evaluation index) was outside the standard level and was transformed to the maximum K(S) value in all ranks.

5. Assessment and Analysis of UEH in the UA in the Middle Reaches of the Yangtze River

5.1. Determination of the Classical and Segment Domains of the UA

According to the specific conditions of the urban ecosystem, the societal characteristics of economic development in the UA located in the middle reaches of the Yangtze River, and the State Environmental Protection Agency’s policy for UEH, the UEH standards are usually classified into five grades: morbid (grade I), unhealthy (grade II), sub-healthy (grade III), healthy (grade IV), and excellent healthy (grade V). Given that a common standard on the evaluation index value range of UEH in each grade is currently unavailable, the criterion will be established as classical domain in the process of calculation (Table 2). These standards are combined with the State Environmental Protection Agency’s policy (the proposed regulations on the construction index of eco-county, eco-city, and eco-province), the average level of the six provincial capital cities (Wuhan, Changsha, Nanchang, Taiyuan, Hefei, and Zhengzhou), and previous academic achievements [17,23,45,46,47,48,49]. At the same time, this study adopted the questionnaire survey and an expert evaluation method to ensure that the standards on the value range of the UEH evaluation index are scientific and reasonable. According to extension theory, both the minimum value and maximum value of classical domain are respectively the value of left and right of segment domains interval. Table 2 shows the five grades as ranges of the classical domain, which is the basis for calculating correlation function value and comprehensive correlation degrees.

5.2. Result and Analysis of the UA Ecosystem Health

Based on the criterion in Table 2 (initial value of each indicator see Appendix A), Equations (4) and (5), we calculated the correlation degree of the evaluation index of the UA ecosystem health. Given the large number of cities in the UA located in the middle reaches of the Yangtze River, this study uses the city of Wuhan as an example and analyzes the parameters of the computation process. The value of energy consumption per 10,000 Yuan of GDP in Wuhan was 0.760. Using Equations (5) and (10), the index’s correlation degree was calculated as follows: k1(v1) = −0.493, k2(v1) = −0.240, k3(v1) = 0.200, k4(v1) = −0.073, and k5(v1) = −0.321. The energy consumption per 10,000 Yuan of GDP in Wuhan was classified as grade III. The health grades and attributive degrees of other indicators in Wuhan and other cities can be similarly diagnosed, as shown in Table 3.
By using Equations (2)–(11), the comprehensive correlation degree of ecosystem health in Wuhan was obtained as follows: k1(S) = −0.575, k2(S) = −0.530, k3(S) = −0.447, k4(S) = −0.291, and k5(S) = 0.055. Thus, the ecosystem health in Wuhan was classified as grade V. The health grades and attributive degrees of ecosystem health in other cities can be similarly diagnosed. The final results of the ecosystem health assessment for each city in the UA are presented in Table 4.
The weight, health grade, and attributive degree of each indicator reflect the influence of each index in the ecosystem health status. Per capita gross domestic product (GDP) (I3), the proportion of science and education expenditures to fiscal expenditures (I5), the total investment in city maintenance and construction as percent GDP (I12), the number of public library collections per 100 of the population (I21), and the number of students enrolled in regular institutions of higher education per 10,000 of the population (I22), were the first five influencing factors in the UA ecosystem health status based on the weight of each indicator (Table 1). The five influencing factors were classified under the economic and social subsystems. This implied that the human capital and education, economic development level as well as urban infrastructure have a significant effect on the health states of UA. The limiting factors in different UA cities were based on the correlation degree of the evaluation index of the UA ecosystem health (Table 3). I4, I5, I12, and I17 are the limiting factors of most cities in the Wuhan metropolitan areas. The limiting factors of the index system are scattered in various indicators in the Ring of Chang-Zhu-Tan City Clusters and the Poyang Lake Ecological Economic Zone. For example, I13 is the limiting factor of Changsha, Zhuzhou, and Xiangtan; I17 is the limiting factor of Changde, Yichun, Shangrao, Fuzhou, and Jian; and I4 is the limiting factor of Yingtan. Different limiting factors restrict different urban agglomeration ecosystem health. When I3 and I12 are the limiting factors of the city simultaneously, the health state of the city will be continuously unwell without the influence of a larger weight factor for an extended period of time. Increasing the investment in urban infrastructure and improving the people’s quality of life are important methods of enhancing the health status of the urban ecosystem.
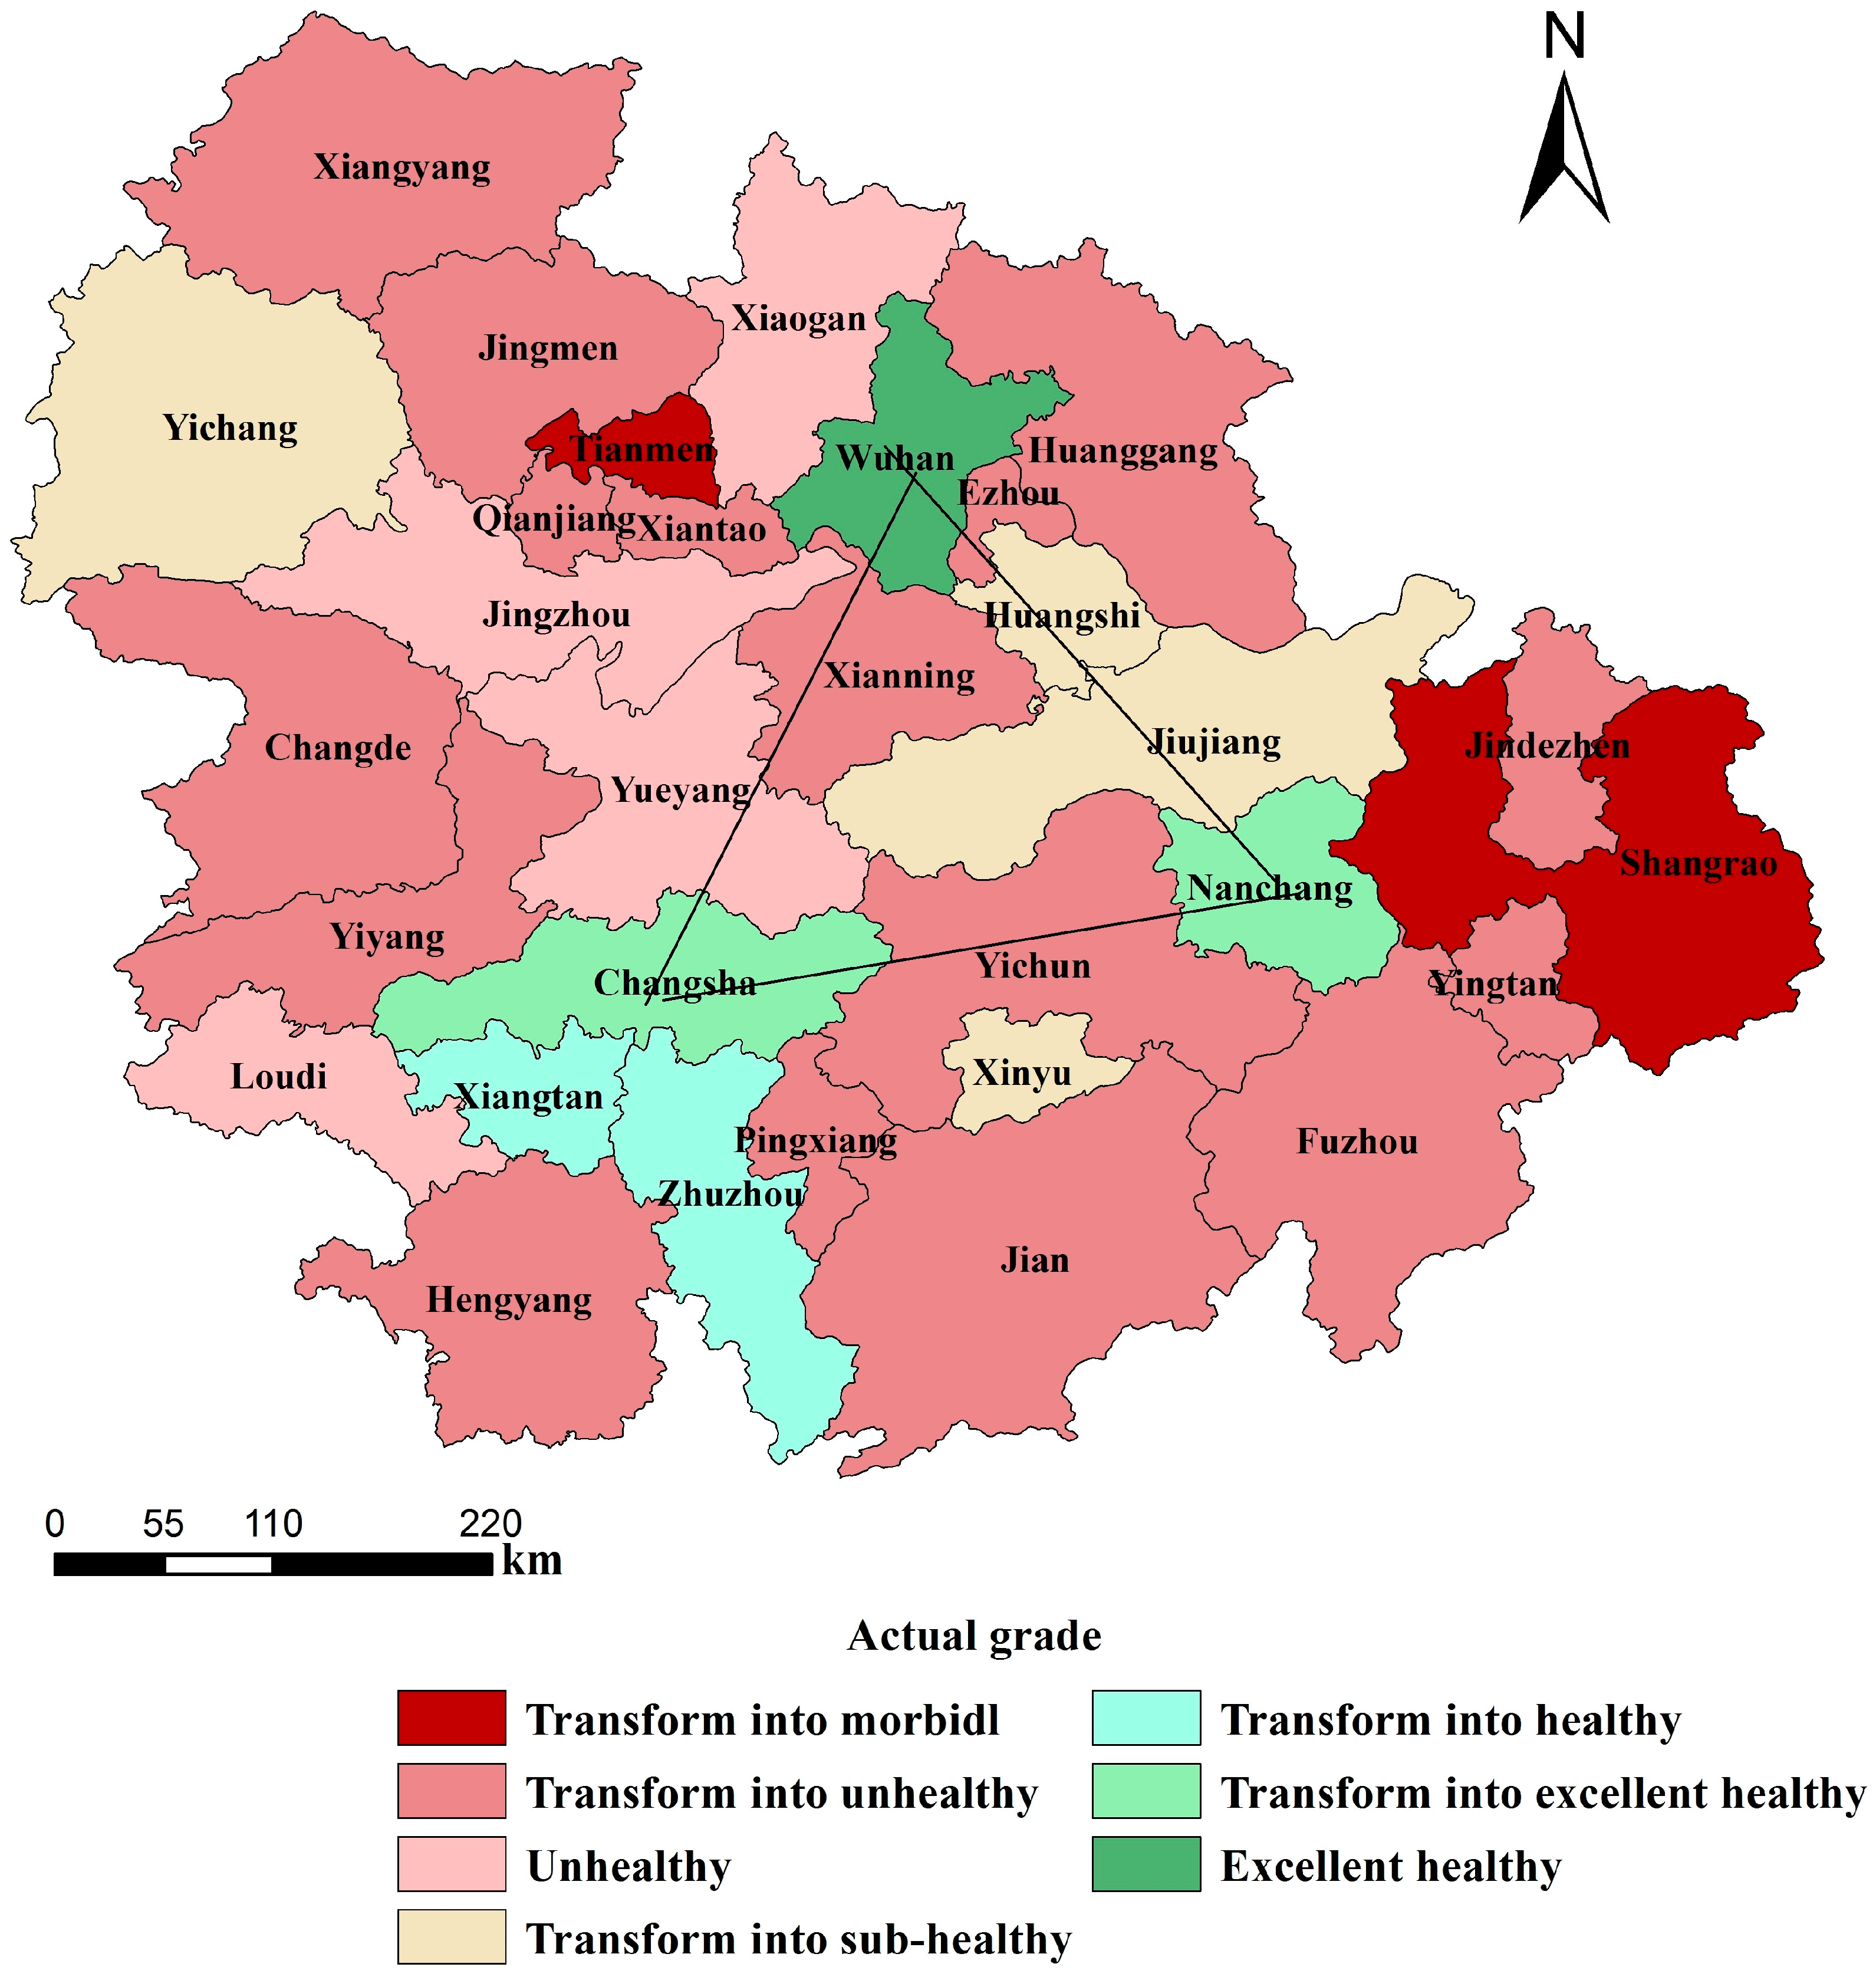
The results shown in Table 4 and Figure 2 reveal the different overall health levels of the 31 UA cities in 2013. Generally speaking, the health status of the UA’s ecosystem was not optimistic. The number of city ecosystems at healthy and excellent healthy levels accounted for only 16.13% of the area. The cities with healthy and excellent healthy levels are scattered throughout the study area in a triangular pattern or, more exactly, like the three vertices of a triangle (see Figure 2). In combination with the special conditions of the cities in the UA, five basic findings have been summarized as follows:
(1)
The ecosystem health grades for Wuhan, Changsha, and Nanchang are excellent or converting to excellent health zones, accounting for 9.68% of the total number of cities in the UA. These cities are provincial capital cities with rapid economic development, relatively free social environments, and an abundance of science and technology resources, particularly in comparison with other cities in the UA. The health states of the three cities are good because of the superior urban infrastructure and excellent environmental protection.
(2)
The ecosystem health grades for Zhuzhou and Xiangtan are healthy or converting to healthy zones, indicating that ecosystem health in Zhuzhou and Xiangtan is improving. Xiangtan and Zhuzhou are two major industrial cities in the country; they are the industrial centers of South China, and are also heavily polluted areas [50,51]. The government has spent a considerable amount of money and material resources on environmental pollution control in the past decade, which has significantly influenced the improvement of the health states of Xiangtan and Zhuzhou.
(3)
The ecosystem health grades for Huangshi, Yichang, Jiujiang, and Xinyu are sub-healthy or converting to sub-healthy zones. Huangshi and Xinyu are resource transformation pilot cities, while Yichang and Jiujiang are tourist cities. All four cities have undergone economic restructuring and upgrading. Natural resource endowments promote economic development and increase environmental pressure.
(4)
The ecosystem health grades for Ezhou, Huanggang, Xiaogan, Xianning, Xiantao, Qianjiang, Xiangyang, Jingzhou, Jingmen, Yueyang, Yiyang, Changde, Hengyang, Loudi, Jindezhen, Yingtan, Yichun, Pingxiang, Fuzhou, and Jian are unhealthy or converting to unhealthy zones, accounting for 64.52% of the total number of cities in the UA. Rapid economic development in these central cities occurred because of the country’s increasing attention and support for the development of the central city. However, the social infrastructure and protection, and the environmental protection measures for small and medium cities have not matched the pace of economic development.
(5)
The ecosystem health grades for Tianmen and Shangrao are morbid or converting to morbid zones. Industrial structure, infrastructure, and cultural education significantly affect the health state of the urban ecosystem. For instance, I4, I12, I17, I20, and I22 are the limiting factors of ecosystem health. If this situation continues, it is bound to negatively affect economic development without reasonable industrial structure and supporting infrastructure.

5.3. Discussion

The UA in the middle reaches of the Yangtze River is located in the basin of the Yangtze River Valley, Dongting Lake Valley and Poyang Lake Valley, where water resources occupy an important position. In order to protect the ecological environment, the orientation of the UA is to create the “China Eco-Green Heart”. However, the case study results show that only five out of 31 cities have a healthy and excellent healthy ecosystem. We can diagnose that the health status of the UA’s ecosystem is not optimistic. One of the most effective methods to improve the level of urban ecosystem health is to overcome major limiting factors. First of all, with the development of science, technology and society, the way of maintaining and improving urban ecosystem health should change from the simple environment protection in the past to deep thinking of the historical pattern of urban development and their future. The UA ought to advance their total amount of economic development while transforming the forms of economic development and upgrading of its industrial structure and seeking for a new development model of circular economy. For example, the UA should adopt policies to enhance future ecosystem health by utilizing clean, regenerated energy as much as possible, improve the rate of energy consumption, and reduce the environmental impact on the region. In the second place, more investments are expected to be made by UA for improving urban infrastructure, especially environmental protection facilities. Last and most important, improving the access to quality education, increasing educational input, setting up a regional talent sharing system, and letting talents flow in the UA according to the need for urban ecosystem health development are important.
The regional differences between the ecosystem health levels in these 31 cities are significant. The reason for this originates from an imbalance in economic development and city development policy guidance. Beijing, Tianjin, Shenyang, Taiyuan and Lanzhou experienced eco-environment treatment after pollution and spent a lot of time and wealth to adjust the relationship between the economy and the environment, which has served as a useful reference for other cities. The developed cities, such as Wuhan, Changsha and Nanchang actively explore an effective balance between economic development and environmental protection, with the overall goal of saving resources and developing an environmentally friendly society. Thus, the health levels of these three cities are the best, benefitting from the advantages of superior urban infrastructure and excellent environmental protection. Underdeveloped cities generally have an urgent need to improve the eco-environment instead of focusing on simple economic growth. However, such cities still pay more attention to the rapid economic increases. Obviously, different purposes eventually lead to a contradiction of strategy within city development. It is difficult to shift away from the “grow first, clean up later” approach towards green growth for underdeveloped cities without the support that comes with policy, economy, or industry. Thus, it is also necessary to break free of each departments’ limitations to establish a regional system, and to speed up the integration process to promote coordinated regional development.

6. Conclusions

Research in UEH assessment is driven by both the rapid pace of urbanization and the increasingly deteriorating urban environment it covers [7]. The extension theory-based methodology was proposed for the evaluation of urban ecosystem health; it circumvents the incompatibility of individual indicators in the evaluation process and avoids the uncertainty of the index weight, thereby generating precise and reasonable the evaluation results.
In the present study, the urban ecosystem health of the UA’s 31 cities in the middle reaches of the Yangtze River were evaluated and compared using the entropy weight extension decision model, in which the health levels of Wuhan, Changsha, and Nanchang were determined superior, whereas majority of the cities were unhealthy or on the verge of being unhealthy, accounting for 64.52% of the total number of cities in the urban agglomeration. Human, economic, and social developments of the UA have a significant effect on health states. However, the power of environmental governance technology is limited. Enhancing the quality of urbanization is an important approach for maintaining a healthy ecosystem and improving urban infrastructure and environmental protection facilities.
Spatial differentiation analysis and dynamic comparisons are important for understanding changes in urban ecosystem health. This study is limited in a time series analysis. Due to the limited data, this work only selected some indexes and data from 2013 for this analysis. Thus, future research will focus on establishing a complete data support system and perfecting environmental monitoring record standards, which will provide more practicable references for urban managers.

Acknowledgments

This study was supported by the National Youth Science Foundation of China (Grant No. 41301586). We earnestly thank the editor and the two anonymous reviewers for their thoughtful comments, which helped to greatly improve the quality of this manuscript. We also thank Kara Graves for her linguistic assistance during the preparation of this manuscript.

Author Contributions

Aiwen Lin and Qian Yang contributed to the study design. Zhenzhen Zhao, Ling Zou, and Cheng Sun contributed to the data collection and analyses. Qian Yang conducted the data analyses and wrote the manuscript. All authors participated in reading and finalizing the manuscript.

Conflicts of Interest

The authors declare no conflicts of interest.

Abbreviations

The following abbreviations are used in this manuscript:
UEHUrban ecosystem health
UAUrban agglomeration
GDPGross domestic product
AHPAnalytical hierarchy process
ANPAnalytic network processes

Appendix A

Table A1. Initial value of each indicator (2013).
RegionVigor StructureResilienceService FunctionPopulation Health
I1I2I3I4I5I6I7I8I9I10I11I12I13I14I15I16I17I18I19I20I21I22
Wuhan0.843.711.047.715.02.3967.938.995.092.5100.02.443.821.816.314.820.56.330.871.0148.91175.6
Huangshi1.4132.04.430.415.52.5572.331.894.390.4100.00.887.910.122.713.111.811.839.050.448.4139.8
Ezhou1.3140.95.728.116.42.0688.034.490.288.7100.02.280.015.79.85.17.34.641.340.235.4119.5
Huanggang0.9218.11.834.121.72.6429.727.992.356.958.80.282.21.522.53.72.810.034.034.922.364.3
Xiaogan1.1256.52.331.818.12.2591.927.369.391.0100.01.091.93.57.55.04.45.140.427.516.471.5
Xianning1.0182.22.932.817.72.2299.737.056.291.0100.00.194.511.98.34.84.710.335.834.228.2129.6
Xiantao0.8191.03.230.815.21.8615.136.7100.080.0100.00.385.89.19.07.26.18.532.621.19.949.3
Qianjiang1.1131.94.727.816.11.9517.936.9100.081.065.40.387.115.78.97.26.14.133.136.612.531.8
Tianmen0.7260.42.227.615.71.8624.941.672.084.0100.00.282.78.26.55.24.45.337.129.612.44.3
Xiangyang1.0125.14.729.016.92.0301.731.798.190.398.90.186.07.67.65.17.70.739.443.826.4108.6
Yichang1.359.37.028.015.32.3189.841.147.991.091.61.085.213.713.98.112.12.240.854.556.8149.4
Jingzhou0.8267.52.031.415.61.9468.838.934.667.546.40.368.53.88.06.84.93.240.835.517.4171.7
Jingmen1.0179.34.030.015.11.9242.539.792.284.9100.00.285.26.011.77.46.04.339.144.335.870.6
Changsha0.653.610.840.719.81.7560.934.485.796.3100.00.954.014.510.013.915.34.728.879.2153.5865.2
Zhuzhou0.9118.84.932.015.92.2354.841.488.971.1100.02.459.013.119.312.28.06.832.050.233.5185.2
Xiangtan1.1137.45.032.616.52.0578.940.596.687.8100.02.053.410.015.58.111.00.731.844.644.8421.6
Yueyang0.9132.64.333.918.52.1376.942.293.089.0100.00.773.28.110.59.56.07.335.231.616.371.8
Yiyang0.7195.62.335.818.51.9389.638.288.992.093.01.690.05.26.25.84.26.035.330.522.561.4
Changde0.6161.43.737.016.62.2334.043.498.085.8100.01.074.25.510.14.54.05.934.637.823.865.1
Hengyang0.8156.62.836.516.51.9513.632.582.072.0100.00.094.56.024.210.66.67.835.234.922.9129.1
Loudi1.6151.72.531.420.02.6540.339.998.580.3100.01.289.93.79.04.27.26.237.228.920.864.3
Nanchang0.497.86.539.818.82.4689.142.397.894.289.40.260.819.615.315.411.58.831.246.496.81019.7
Jiujiang0.7163.83.235.820.42.6266.352.047.487.8100.01.593.79.822.96.56.713.237.534.038.5156.7
Jindezhen0.5121.64.134.015.42.4316.151.397.571.3100.00.899.723.417.28.48.26.635.440.546.9139.3
Yingtan0.4142.44.429.416.02.2350.340.592.386.1100.01.1100.09.612.86.86.25.638.934.931.440.7
Xinyu1.199.87.036.116.12.2382.350.792.496.8100.02.8100.030.312.25.98.59.934.936.350.7239.9
Yichun0.6325.12.429.421.22.3309.743.199.093.2100.02.899.74.67.13.14.56.140.932.122.376.1
Pingxiang1.1104.84.133.617.62.1505.440.495.580.698.01.498.610.27.84.57.66.734.745.745.553.5
Shangrao0.4229.61.834.924.02.8333.347.618.490.3100.00.099.22.722.76.33.87.441.626.917.130.0
Fuzhou0.4269.92.230.621.92.3223.248.889.091.3100.00.998.66.08.92.64.810.742.623.134.259.4
Jian0.4305.72.231.723.62.8201.456.997.372.063.51.7100.04.412.85.14.39.638.833.257.734.8

References

  1. Liu, H. Comprehensive carrying capacity of the urban agglomeration in the Yangtze River Delta, China. Habitat Int. 2012, 36, 462–470. [Google Scholar] [CrossRef]
  2. Sun, Q.; Tang, F.H.; Tang, Y. An economic tie network-structure analysis of urban agglomeration in the middle reaches of Changjiang River based on SNA. J. Geogr. Sci. 2015, 25, 739–755. [Google Scholar] [CrossRef]
  3. Su, M.; Zhang, Y.; Liu, G.; Xu, L.; Zhang, L.; Yang, Z. Urban ecosystem health assessment: Perspectives and Chinese practice. Int. J. Environ. Res. Public Health 2013, 10, 5874–5885. [Google Scholar] [CrossRef] [PubMed]
  4. Li, Y.F.; Sun, X.; Zhu, X.D.; Cao, H.H. An early warning method of landscape ecological security in rapid urbanizing coastal areas and its application in Xiamen, China. Ecol. Model 2010, 221, 2251–2260. [Google Scholar] [CrossRef]
  5. Tzoulas, K.; Korpela, K.; Venn, S.; Yli-Pelkonen, V.; Kaźmierczak, A.; Niemela, J.; James, P. Promoting ecosystem and human health in urban areas using Green Infrastructure: A literature review. Landsc. Urban Plan. 2007, 81, 167–178. [Google Scholar] [CrossRef]
  6. Vitousek, P.M.; Mooney, H.A.; Lubchenco, J.; Melillo, J.M. Human domination of earth’s ecosystems. Science 1997, 277, 494–499. [Google Scholar] [CrossRef]
  7. Su, M.R.; Fath, B.D.; Yang, Z.F. Urban ecosystem health assessment: A review. Sci. Total Environ. 2010, 408, 2425–2434. [Google Scholar] [CrossRef] [PubMed]
  8. Costanza, R.; Norton, B.G.; Haskell, B.D. Ecosystem Health: New Goals for Environmental Management; Island Press: Washington, DC, USA, 1992; pp. 18–24. [Google Scholar]
  9. Rapport, D.J.; Costanza, R.; McMichael, A.J. Assessing ecosystem health. Trends Ecol. Evol. 1998, 13, 397–402. [Google Scholar] [CrossRef]
  10. Woodwell, G.M. Effects of pollution on the structure and physiology of ecosystems. Science 1970, 168, 429–433. [Google Scholar] [CrossRef] [PubMed]
  11. Steedman, R.J. Ecosystem health as a management goal. J. N. Am. Benthol. Soc. 1994, 13, 605–610. [Google Scholar] [CrossRef]
  12. Odum, E.P.; Barrett, G.W.; Brewer, R. Fundamentals of Ecology; Brooks/Cole: San Francisco, CA, USA, 2004; pp. 17–77. [Google Scholar]
  13. Odum, E.P. Ecology and Our Endangered Life Support Systems; Sinauer Associates Inc.: Sunderland, MA, USA, 1989; pp. 26–48. [Google Scholar]
  14. Rapport, D.J.; Regier, H.A.; Hutchinson, T.C. Ecosystem behavior under stress. Am. Nat. 1982, 125, 617–640. [Google Scholar] [CrossRef]
  15. Costanza, R. Ecosystem health and ecological engineering. Ecol. Eng. 2012, 45, 24–29. [Google Scholar] [CrossRef]
  16. Hancock, T. Healthy communities must also be sustainable communities. Public Health Rep. 2000, 115, 151–156. [Google Scholar] [CrossRef] [PubMed]
  17. Guo, X.R.; Yang, J.R.; Mao, X.Q. Primary studies on urban ecosystem health assessment. China Environ. Sci. 2002, 22, 525–529. [Google Scholar]
  18. Su, M.R.; Yang, Z.F.; Chen, B. Set pair analysis for urban ecosystem health assessment. Commun. Nonlinear Sci. 2009, 14, 1773–1780. [Google Scholar] [CrossRef]
  19. Su, M.R.; Fath, B.D. Spatial distribution of urban ecosystem health in Guangzhou, China. Ecol. Indic. 2012, 15, 122–130. [Google Scholar] [CrossRef]
  20. Shi, X.Q.; Yang, J.X. A material flow-based approach for diagnosing urban ecosystem health. J. Clean Prod. 2014, 64, 437–446. [Google Scholar] [CrossRef]
  21. Li, Y.F.; Li, D. Assessment and forecast of Beijing and Shanghai’s urban ecosystem health. Sci. Total Environ. 2014, 487, 154–163. [Google Scholar] [CrossRef] [PubMed]
  22. Harpham, T. Urban health in developing countries: What do we know and where do we go? Health Place 2009, 15, 107–116. [Google Scholar] [CrossRef] [PubMed]
  23. Liu, G.Y.; Yang, Z.F.; Chen, B.; Zhang, Y.; Zhang, L.X.; Zhao, Y.W.; Jiang, M.M. Emergy-based urban ecosystem health assessment: A case study of Baotou, China. Commun. Nonlinear Sci. 2009, 14, 972–981. [Google Scholar] [CrossRef]
  24. Lu, Y.; Zhu, X.D.; Li, Y.F.; Sun, X. An improved method and its application for urban ecosystem health assessment. Environ. Prot. Sci. 2008, 7, 46–48. [Google Scholar]
  25. Yan, W.T. Research on urban ecosystem health attribute synthetic assessment model and application. Syst. Eng. Theory Pract. 2007, 27, 137–145. [Google Scholar]
  26. Wei, T.; Zhu, X.D.; Li, Y.F. Ecosystem health assessment of Xiamen City: The catastrophe progression method. Acta Ecol. Sin. 2008, 28, 6312–6320. [Google Scholar]
  27. Jin, J.; Qian, H.; Chen, Y.F.; Xi, W.J. Assessment of Groundwater Quality Based on Matter Element Extension Model. J. Chem. 2013, 2013, 715647. [Google Scholar]
  28. Wu, Y.N.; Yang, Y.S.; Feng, T.T.; Kong, L.N.; Liu, W.; Fu, L.J. Macro-site selection of wind/solar hybrid power station based on Ideal Matter-Element Model. Int. J. Electr. Power Energy Syst. 2013, 50, 76–84. [Google Scholar]
  29. Liu, Y. Assessment of City Environmental Quality in Western China Based on Matter Element Extension—A Case Study Of Chongqing. Energy Procedia 2011, 5, 619–623. [Google Scholar]
  30. He, Y.X.; Dai, A.Y.; Zhu, J.; He, H.Y.; Li, F.Y. Risk assessment of urban network planning in China based on the matter-element model and extension analysis. Int. J. Electr. Power Energy Syst. 2011, 33, 775–782. [Google Scholar] [CrossRef]
  31. Zhou, K.H.; Liu, Y.F.; Tan, R.H. Spatio-temporal differentiation of comprehensive development level of middle reaches of Yangtze River. Resour. Environ. Yangtze Basin 2014, 23, 1510–1518. [Google Scholar]
  32. Huang, D.Z.; Wan, Q.; Li, L.Q.; Wang, T.; Lu, S.Y.; Ou, F.P.; Tian, Q. Changes of water quality and eutrophic state in recent 20 years of Dongting. Res. Environ. Sci. 2013, 26, 27–33. [Google Scholar]
  33. Li, R.F.; Zhang, Y. Analysis of spatial and temporal variation of water quality and its influencing factors in Poyang Lake. Water Resour. Prot. 2011, 27, 9–13. [Google Scholar]
  34. National Bureau of Statistics of the People’s Republic of China. The 2014 China City Statistical Yearbook; China Statistics Press: Beijing, China, 2014. (In Chinese)
  35. National Bureau of Statistics of the People’s Republic of China. The 2014 Hubei Statistical Yearbook; China Statistics Press: Beijing, China, 2014. (In Chinese)
  36. National Bureau of Statistics of the People’s Republic of China. The 2014 Hunan Statistical Yearbook; China Statistics Press: Beijing, China, 2014. (In Chinese)
  37. National Bureau of Statistics of the People’s Republic of China. The 2014 Jiangxi Statistical Yearbook; China Statistics Press: Beijing, China, 2014. (In Chinese)
  38. Water Conservancy Bureau of Hubei Province. The 2013 Water Resources Communiqué of Hubei; Water Conservancy Bureau of Hubei Province: Wuhan, China, 2014. (In Chinese)
  39. Water Conservancy Bureau of Hunan Province. The 2013 Water Resources Communiqué of Hunan; Water Conservancy Bureau of Hunan Province: Changsha, China, 2014. (In Chinese)
  40. Water Conservancy Bureau of Jiangxi Province. The 2013 Water Resources Communiqué of Jiangxi; Water Conservancy Bureau of Jiangxi Province: Nanchang, China, 2014. (In Chinese)
  41. Tianmen Statistics Bureau. The 2013 National Economic and Social Development Statistical Bulletins of Tianmen; Tianmen Statistics Bureau: Tianmen, China, 2014. (In Chinese)
  42. Xiantao Statistics Bureau. The 2013 National Economic and Social Development Statistical Bulletins of Xiantao; Xiantao Statistics Bureau: Xiantao, China, 2014. (In Chinese)
  43. Qianjiang Statistics Bureau. The 2013 National Economic and Social Development Statistical Bulletins of Qianjiang; Qianjiang Statistics Bureau: Qianjiang, China, 2014. (In Chinese)
  44. Cai, W. Extension Theory and its application. Chin. Sci. Bull. 1999, 44, 1538–1548. [Google Scholar] [CrossRef]
  45. Yan, J.; Feng, C.; Li, L. Sustainability assessment of machining process based on extension theory and entropy weight approach. Int. J. Adv. Manuf. Technol. 2014, 71, 1419–1431. [Google Scholar] [CrossRef]
  46. Zhao, S.; Chai, L. A new assessment approach for urban ecosystem health basing on maximum information entropy method. Stoch. Env. Res. Risk A 2015, 29, 1601–1613. [Google Scholar] [CrossRef]
  47. Su, M.; Chen, B.; Yang, Z.F. Implication of ecosystem health assessment for urban management. Procedia Environ. Sci. 2010, 2, 674–680. [Google Scholar] [CrossRef]
  48. Harpham, T. Urban health inthe Gambia: A review. Health Place 1996, 2, 45–49. [Google Scholar] [CrossRef]
  49. WHO Regional Office for Western Pacific Region. Regional Guidelines for Developing a Healthy Cities Project; Western Pacific Region Office: Manila, The Philippines, 2000. [Google Scholar]
  50. Long, Y.Z.; Dai, T.G.; Zou, H.Y. The status quo and evaluation of heavy metal pollution of soils in the Changsha, Zhuzhou and Xiangtan areas. Earth Environ. 2008, 36, 231–236. [Google Scholar]
  51. Zhang, K.; Yang, X.; Wu, Y.J.; Wu, B.J.; Kuang, X.L. Pollution characteristics and ecological risk assessment of heavy metals in surface sediments in Changsha-Zhuzhou-Xiangtan Reach, Xiang Jiang River, China. J. Agric. Resour. Environ. 2015, 32, 60–65. [Google Scholar]
Figure 1. Location of study area.
Sustainability 08 00869 g001
Figure 2. Spatial distribution of ecosystem health grades for the UA in the middle reaches of the Yangtze River.
Sustainability 08 00869 g002
Table 1. The indicators of an urban ecosystem and the indicator weight value.
SymbolIndicatorsComponentsWeight
Five FactorsThree Dimensions
I1Energy consumption per 10,000 Yuan of GDP (ton of SCE/10,000 Yuan)Vigor Economic subsystem0.019
I2Water consumption per 10,000 Yuan of GDP (m3/10,000 Yuan)Vigor Economic subsystem0.023
I3Per capita GDP (million Yuan)VigorEconomic subsystem0.074
I4Tertiary industry accounting for the proportion of GDP (%)StructureEconomic subsystem0.057
I5Proportion of science and education expenditures to fiscal expenditure (%)StructureEconomic subsystem0.086
I6Per capita annual disposable income ratio of urban and rural areasStructureEconomic subsystem0.028
I7Population density of the urban area (persons/km2)StructureSocial subsystem0.013
I8Green covered area as of completed area (%)StructureNatural subsystem0.029
I9Common industrial solid wastes comprehensively utilized (%)ResilienceNatural subsystem0.014
I10Urban waste water treatment rate (%)ResilienceNatural subsystem0.014
I11Treatment rate of consumption waste (%)ResilienceNatural subsystem0.013
I12Total investment in city maintenance and construction as a percentage of GDP (%)ResilienceEconomic subsystem0.067
I13Proportion of days of air quality equal to or above grade II in the entire year (%)Service functionNatural subsystem0.019
I14Per capita area of parks and green land (m2)Service functionSocial subsystem0.052
I15Per capita area of paved roads in city (m2)Service functionSocial subsystem0.065
I16Number of public transportation vehicles per 10,000 population in city (unit)Service functionSocial subsystem0.047
I17People with unemployment insurance accounting for the proportion of the total population (%)Service functionSocial subsystem0.054
I18Natural growth rate of the population (%)Population healthSocial subsystem0.028
I19Engel’s coefficient of urban householdsPopulation healthSocial subsystem0.037
I20Number of beds in hospitals and health centers per 10,000 population (bed)Population healthSocial subsystem0.040
I21Number of public library collections per 100 population (books)Population healthSocial subsystem0.087
I22Number of students enrolled in regular institutions of higher education per 10,000 population (people)Population healthSocial subsystem0.132
Table 2. The ranges of the classical domain of UEH.
IndicatorGrade
MorbidUnhealthySub-HealthyHealthyExcellent Healthy
I1(1.5, 2)(1, 1.5)(0.7, 1)(0.4, 0.7)(0, 0.4)
I2(300, 400)(200, 300)(150, 200)(100, 150)(0, 100)
I3(0, 2)(2, 3.5)(3.5, 5)(5, 10)(10, 15)
I4(0, 30)(30, 35)(35, 40)(40, 45)(45, 50)
I5(0, 16)(16, 18)(18, 20)(20, 22)(22, 30)
I6(2.6, 3)(2.2, 2.6)(1.8, 2.2)(1.4, 1.8)(1, 1.4)
I7(900, 1500)(700, 900)(500, 700)(300, 500)(100, 300)
I8(0, 30)(30, 35)(35, 40)(40, 50)(50, 60)
I9(0, 60)(60, 70)(70, 80)(80, 90)(90, 100)
I10(0, 60)(60, 70)(70, 80)(80, 90)(90, 100)
I11(40, 50)(50, 60)(60, 75)(75, 90)(90, 100)
I12(0, 0.5)(0.5, 1)(1, 1.5)(1.5, 2.5)(2.5, 5)
I13(40, 60)(60, 80)(80, 90)(90, 95)(95, 100)
I14(0, 2)(2, 5)(5, 11)(11, 20)(20, 35)
I15(5, 7)(7, 12)(12, 16)(16, 22)(22, 30)
I16(0, 4)(4, 8)(8, 12)(12, 15)(15, 20)
I17(0, 5)(5, 10)(10, 15)(15, 20)(20, 25)
I18(11, 14)(8, 11)(5, 8)(2, 5)(0, 2)
I19(60, 100)(50, 60)(40, 50)(30, 40)(20, 30)
I20(0, 30)(30, 40)(40, 50)(50, 60)(60, 80)
I21(0, 10)(10, 20)(20, 30)(30, 50)(50, 200)
I22(0, 50)(50, 150)(150, 300)(300, 800)(800, 1500)
Table 3. Ecosystem health grade of each indicator in 31 cities in the middle reaches of the Yangtze River (2013).
RegionEcosystem Health Grade of Each Index
I1I2I3I4I5I6I7I8I9I10I11I12I13I14I15I16I17I18I19I20I21I22
WuhanIIIVVVIIIIIIIVVVIVIVIVIVVIIIIVVVV
HuangshiIIIVIIIIIIIIIIIIIVVVIIIIIIIIVIVIIIIIVIVIVII
EzhouIIIVIVIIIIIIIIIIIVIVVIVIIIIVIIIIIIIVIIIIIIIVII
HuanggangIIIIIIIIIVIIVIVIIIIIIIIVIIIIIVIIIIIII
XiaoganIIIIIIIIIIIIIIIIIIIIVVIIIIVIIIIIIIIIIIIIIIIII
XianningIIIIIIIIIIIIIIVIIIIVVIIVIVIIIIIIIIVIIIIIII
XiantaoIIIIIIIIIIIIIIIIIIIIVIVVIIIIIIIIIIIIIIIIVIII
QianjiangIIIVIIIIIIIIIIIIIIIVIVIIIIIIIIVIIIIIIIVIVIIIII
TianmenIIIIIIIIIIVIIIIVIIIIVVIIIIIIIIIIIIIIIVIIII
XiangyangIIIVIIIIIIIIIIVIIVVVIIIIIIIIIIIIIVIVIIIIIIII
YichangIIVIVIIIIVIVIVVIIIIIIVIIIIIIIIIIVIIIIVVII
JingzhouIIIIIIIIIIIIIIVIIIIIIIIIIIIIIIIIIVIIIIIIIIII
JingmenIIIIIIIIIIIIIVIIIVIVVIIIIIIIIIIIIIIVIVIIIIVII
ChangshaIVVVIVIIIIVIIIIIIVVVIIIIVIIIVIVIVVVVV
ZhuzhouIIIIVIIIIIIIIIVIVIVIIIVIVIIVIVIVIIIIIIVIVIVIII
XiangtanIIIVIIIIIIIIIIIIIIVVIVVIVIIIIIIIIIIIIIVIVIIIIVIV
YueyangIIIIVIIIIIIIIIIIIVIVVIVVIIIIIIIIIIIIIIIIIIVIIIIII
YiyangIIIIIIIIIIIIIIIIIIVIIIIVVVIVIVIIIIIIIIIIIVIIIIIII
ChangdeIVIIIIIIIIIIIIIIIVIVVIVVIIIIIIIIIIIIIIIIIVIIIIIII
HengyangIIIIIIIIIIIIIIIIIIIIIIVIIIVIIVIIIVIIIIIIIIIVIIIIIII
LoudiIIIIIIIIIIIIIIIIIIVIVVIIIIIIIIIIIIIIIIIIVIIIIII
NanchangVVIVIIIIIIIIIIIIVVVIVIIIIVIIIVIIIIIIVIIIVV
JiujiangIVIIIIIIIIIVIIVVIIVVIIIIVIIIVIIIIIIVIIIVIII
JindezhenIVIVIIIIIIIIIVVVIIIVIIVVIVIIIIIIIIIVIIIIVII
YingtanIVIVIIIIIIIIIVIVVIVVIIIVIIIIIIIIIIIIIIVIIIVI
XinyuIIVIVIIIIIIIIVVVVVVVVIIIIIIIIIIVIIVIII
YichunIVIIIIIVIIIVIVVVVVVIIIIIIIIIIIIIIIIIII
PingxiangIIIVIIIIIIIIIIIIIIVVIVVIIIVIIIIIIIIIIIIIVIIIIVII
ShangraoIVIIIIIVIIVIVIVVIVIIVIIIIIIIIIIIII
FuzhouIVIIIIIIIVIIVIVIVVVIIVIIIIIIIIIIIIIIVII
JianVIIIIIVIVVVIIIIIIIVVIIIIIIIIIIIVIIVI
I, refers to morbid grade; II, unhealthy grade; III, sub-healthy grade; IV, healthy grade; and V, excellent healthy grade.
Table 4. Comparison of the ecosystem health level of 31 cities in the middle reaches of the Yangtze River (2013).
RegionComprehensive Correlation DegreeActual Grade
IIIIIIIVV
Wuhan−0.5750−0.5297−0.4465−0.29050.0552V level
Huangshi−0.3498−0.1462−0.1149−0.2146−0.4003Transform into III level
Ezhou−0.3314−0.0254−0.1684−0.1720−0.4382Transform into II level
Huanggang−0.1440−0.1393−0.3457−0.4249−0.5602Transform into II level
Xiaogan−0.22790.0844−0.2594−0.4481−0.5987II level
Xianning−0.2580−0.0124−0.2093−0.3592−0.5483Transform into II level
Xiantao−0.1687−0.0562−0.2665−0.4568−0.5896Transform into II level
Qianjiang−0.1666−0.1024−0.2692−0.3457−0.5496Transform into II level
Tianmen−0.0928−0.2143−0.3613−0.4832−0.6266Transform into I level
Xiangyang−0.3070−0.0644−0.1576−0.3710−0.5101Transform into II level
Yichang−0.3697−0.1947−0.0927−0.1610−0.3613Transform into III level
Jingzhou−0.18720.0267−0.2011−0.4113−0.6032II level
Jingmen−0.2624−0.1223−0.1497−0.3097−0.5096Transform into II level
Changsha−0.5342−0.3829−0.3323−0.1731−0.1423Transform into V level
Zhuzhou−0.3809−0.1914−0.0791−0.0677−0.3784Transform into IV level
Xiangtan−0.3913−0.2228−0.1010−0.0407−0.3244Transform into IV level
Yueyang−0.32080.0251−0.0894−0.3193−0.5248II level
Yiyang−0.2446−0.1023−0.1672−0.3400−0.5392Transform into II level
Changde−0.3041−0.0410−0.1167−0.3343−0.5364Transform into II level
Hengyang−0.3315−0.0728−0.1491−0.3275−0.4812Transform into II level
Loudi−0.27180.0238−0.2022−0.4031−0.5694II level
Nanchang−0.4195−0.3581−0.2265−0.1825−0.1672Transform into V level
Jiujiang−0.3810−0.1677−0.1557−0.1802−0.4109Transform into III level
Jindezhen−0.3916−0.1305−0.1422−0.2144−0.3698Transform into II level
Yingtan−0.2767−0.1402−0.1514−0.2922−0.4851Transform into II level
Xinyu−0.4291−0.2094−0.1731−0.2078−0.2935Transform into III level
Yichun−0.2708−0.1074−0.3037−0.3874−0.5018Transform into II level
Pingxiang−0.3186−0.0905−0.1536−0.2790−0.4572Transform into II level
Shangrao−0.1749−0.2671−0.4503−0.5012−0.5169Transform into I level
Fuzhou−0.2616−0.1030−0.3314−0.4012−0.5255Transform into II level
Jian−0.2414−0.1794−0.3635−0.4299−0.4338Transform into II level
I, refers to morbid grade; II, unhealthy grade; III, sub-healthy grade; IV, healthy grade; and V, excellent healthy grade.

