
Spatial Determinants of Urban Land Expansion in Globalizing Nanjing, China


Abstract
:1. Introduction
2. Study Area and Methodology
2.1. The Study Area
2.2. Data Collection and Methods
3. Conceptual Framework and Statistical Models
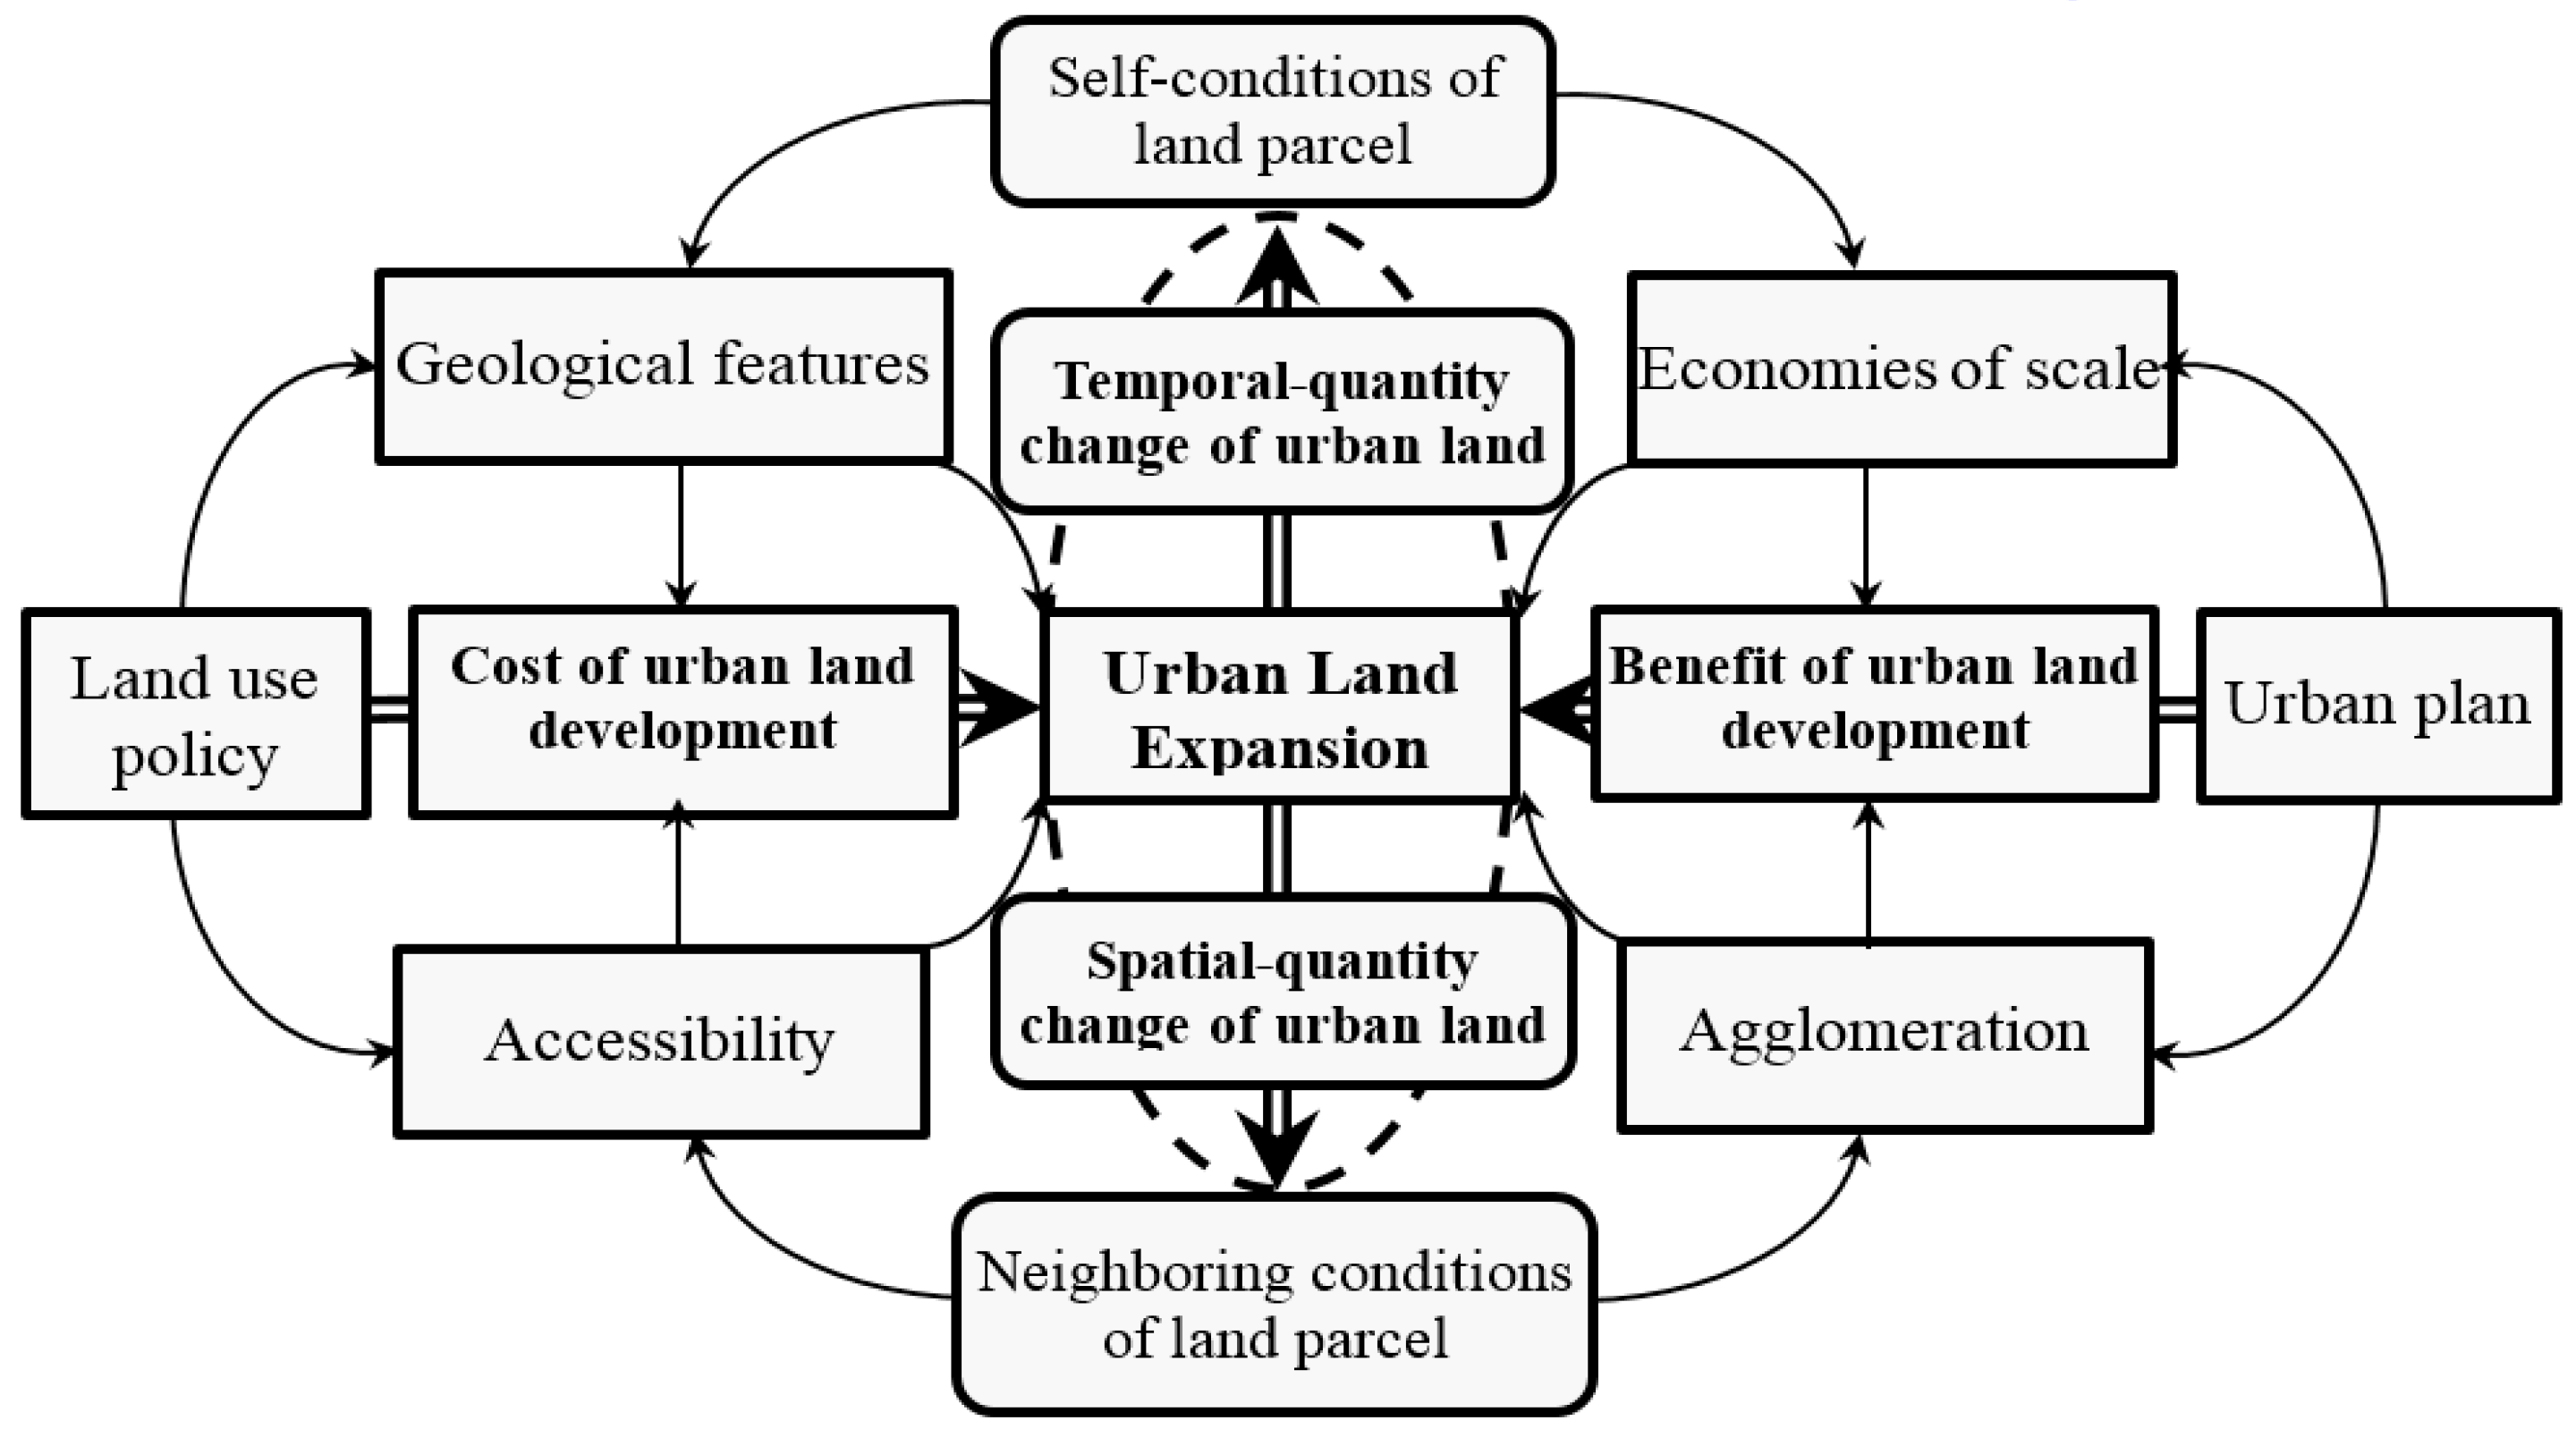
3.1. Conceptual Framework and Determining Factors
3.2. Explanatory Variables and Statistical Models
4. Results
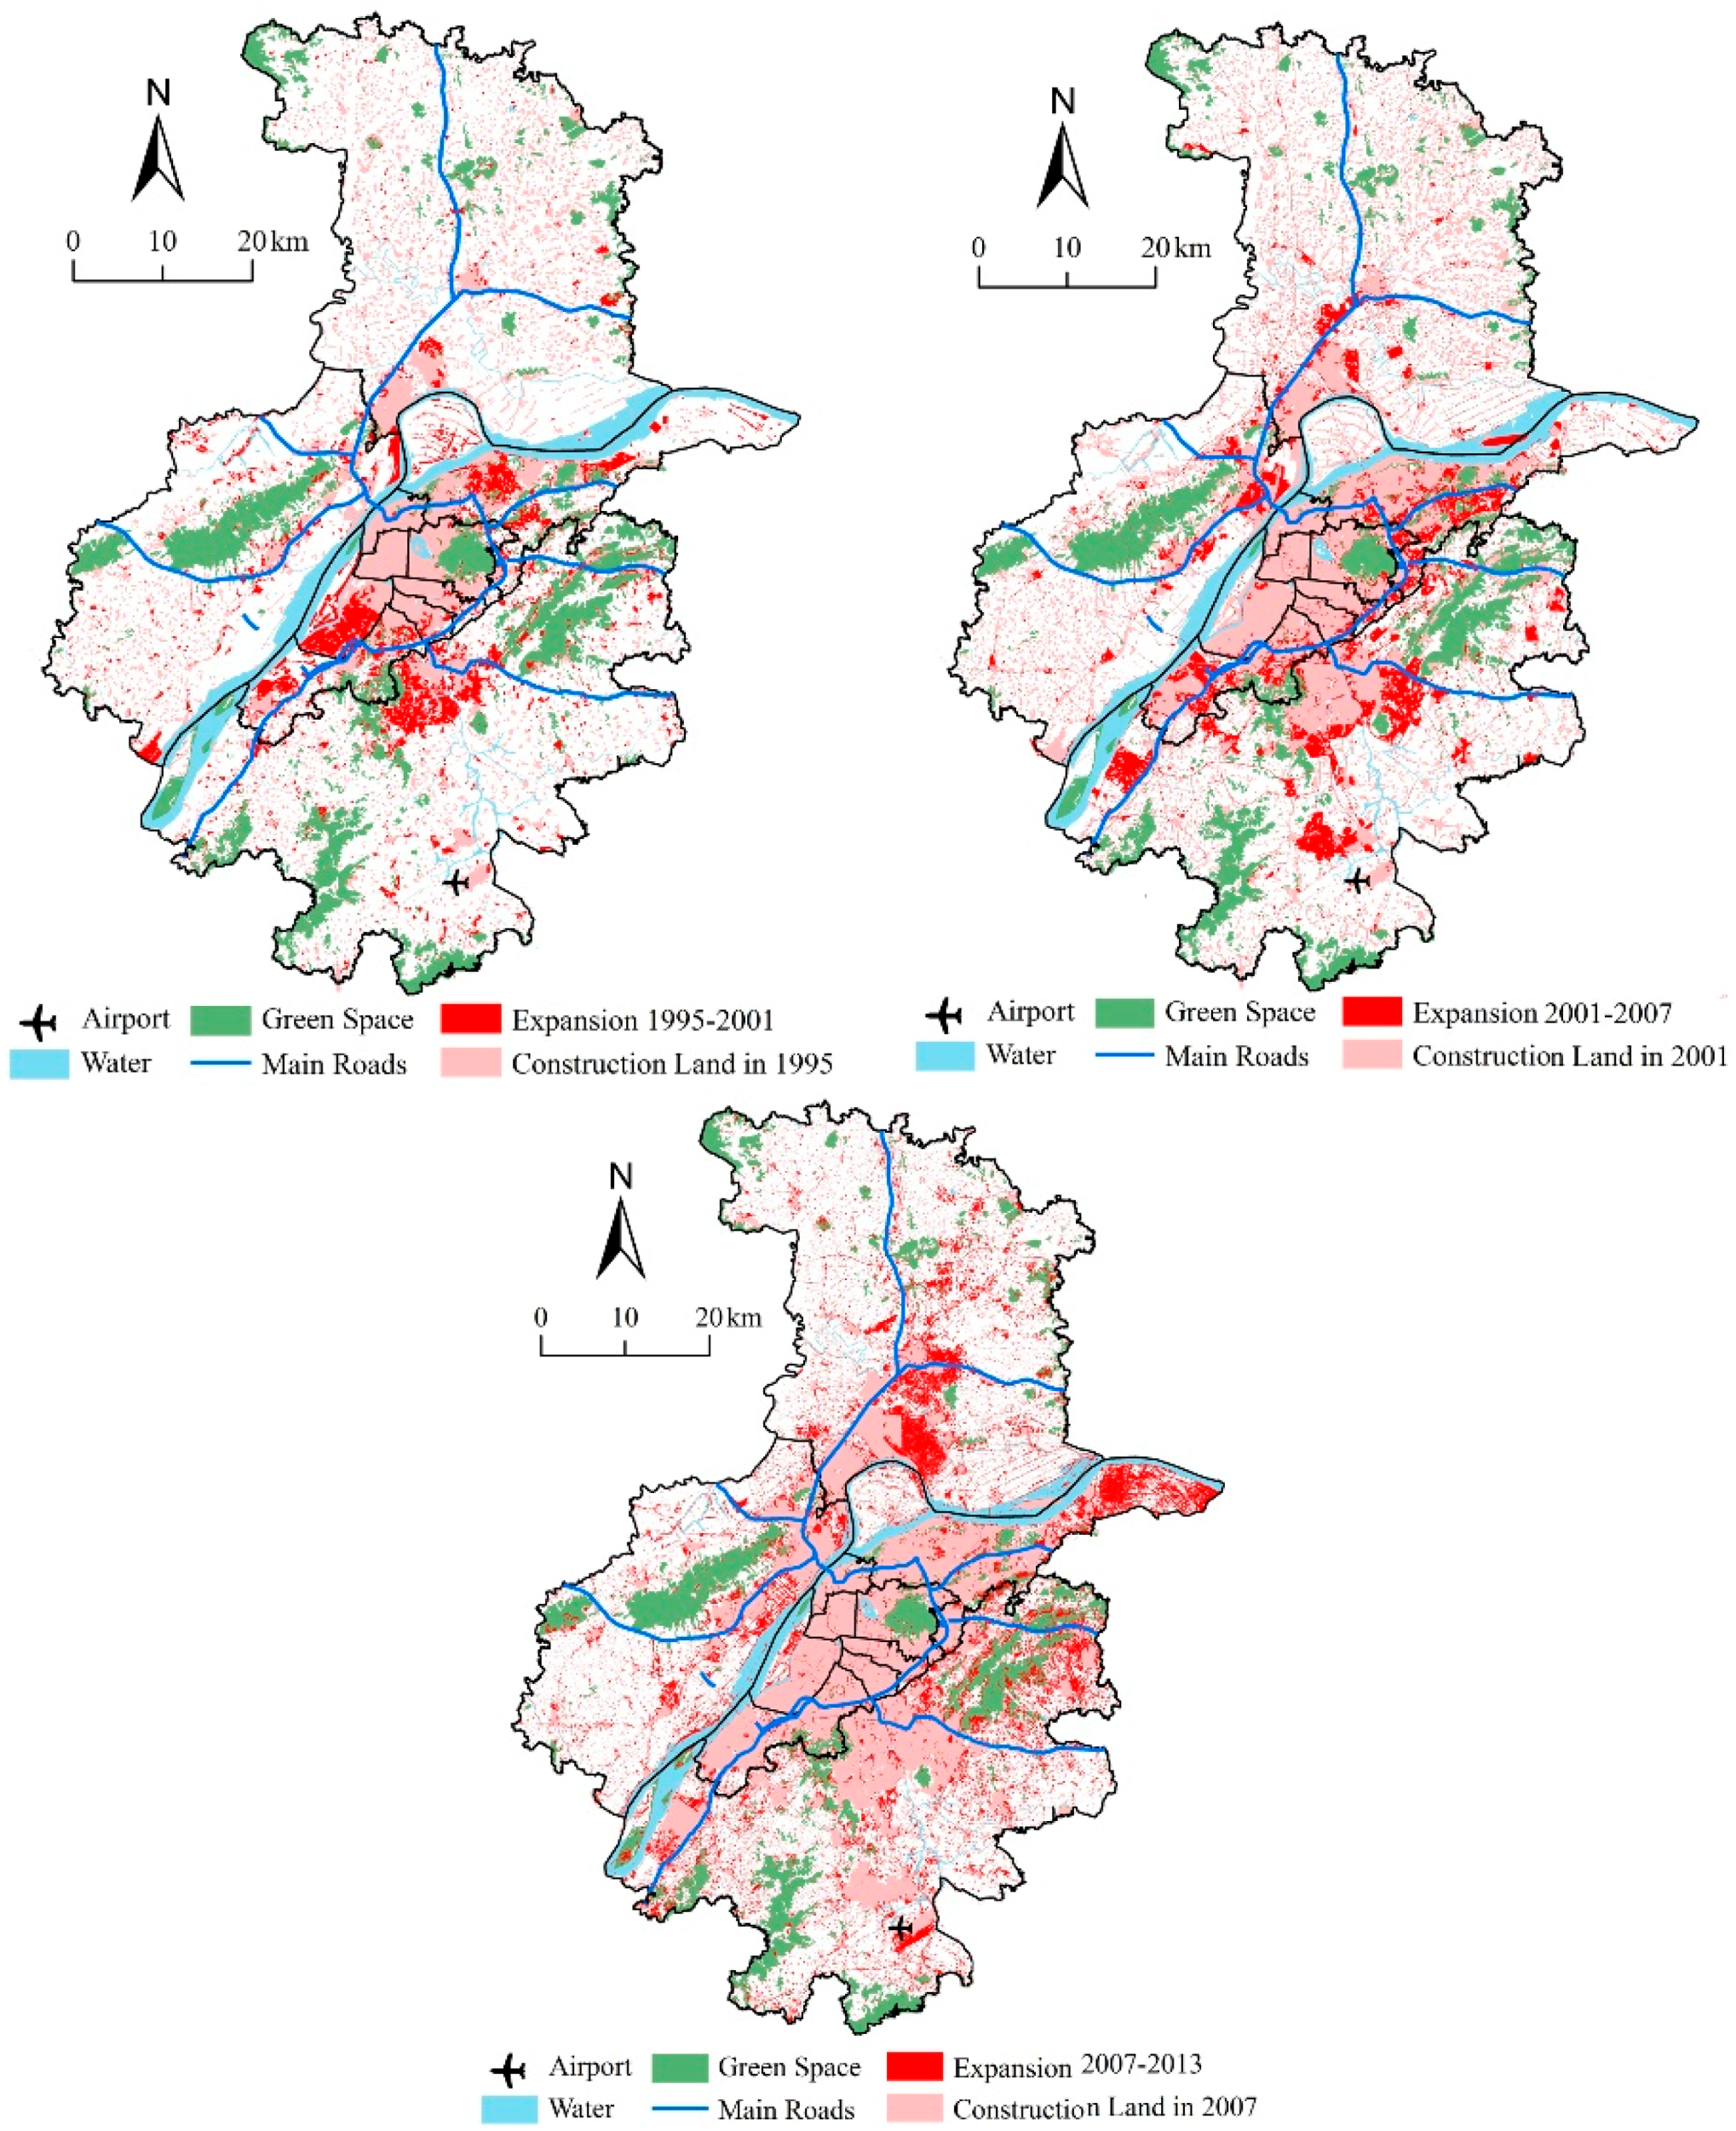
4.1. Mechanism of Urban Land Expansion in Nanjing
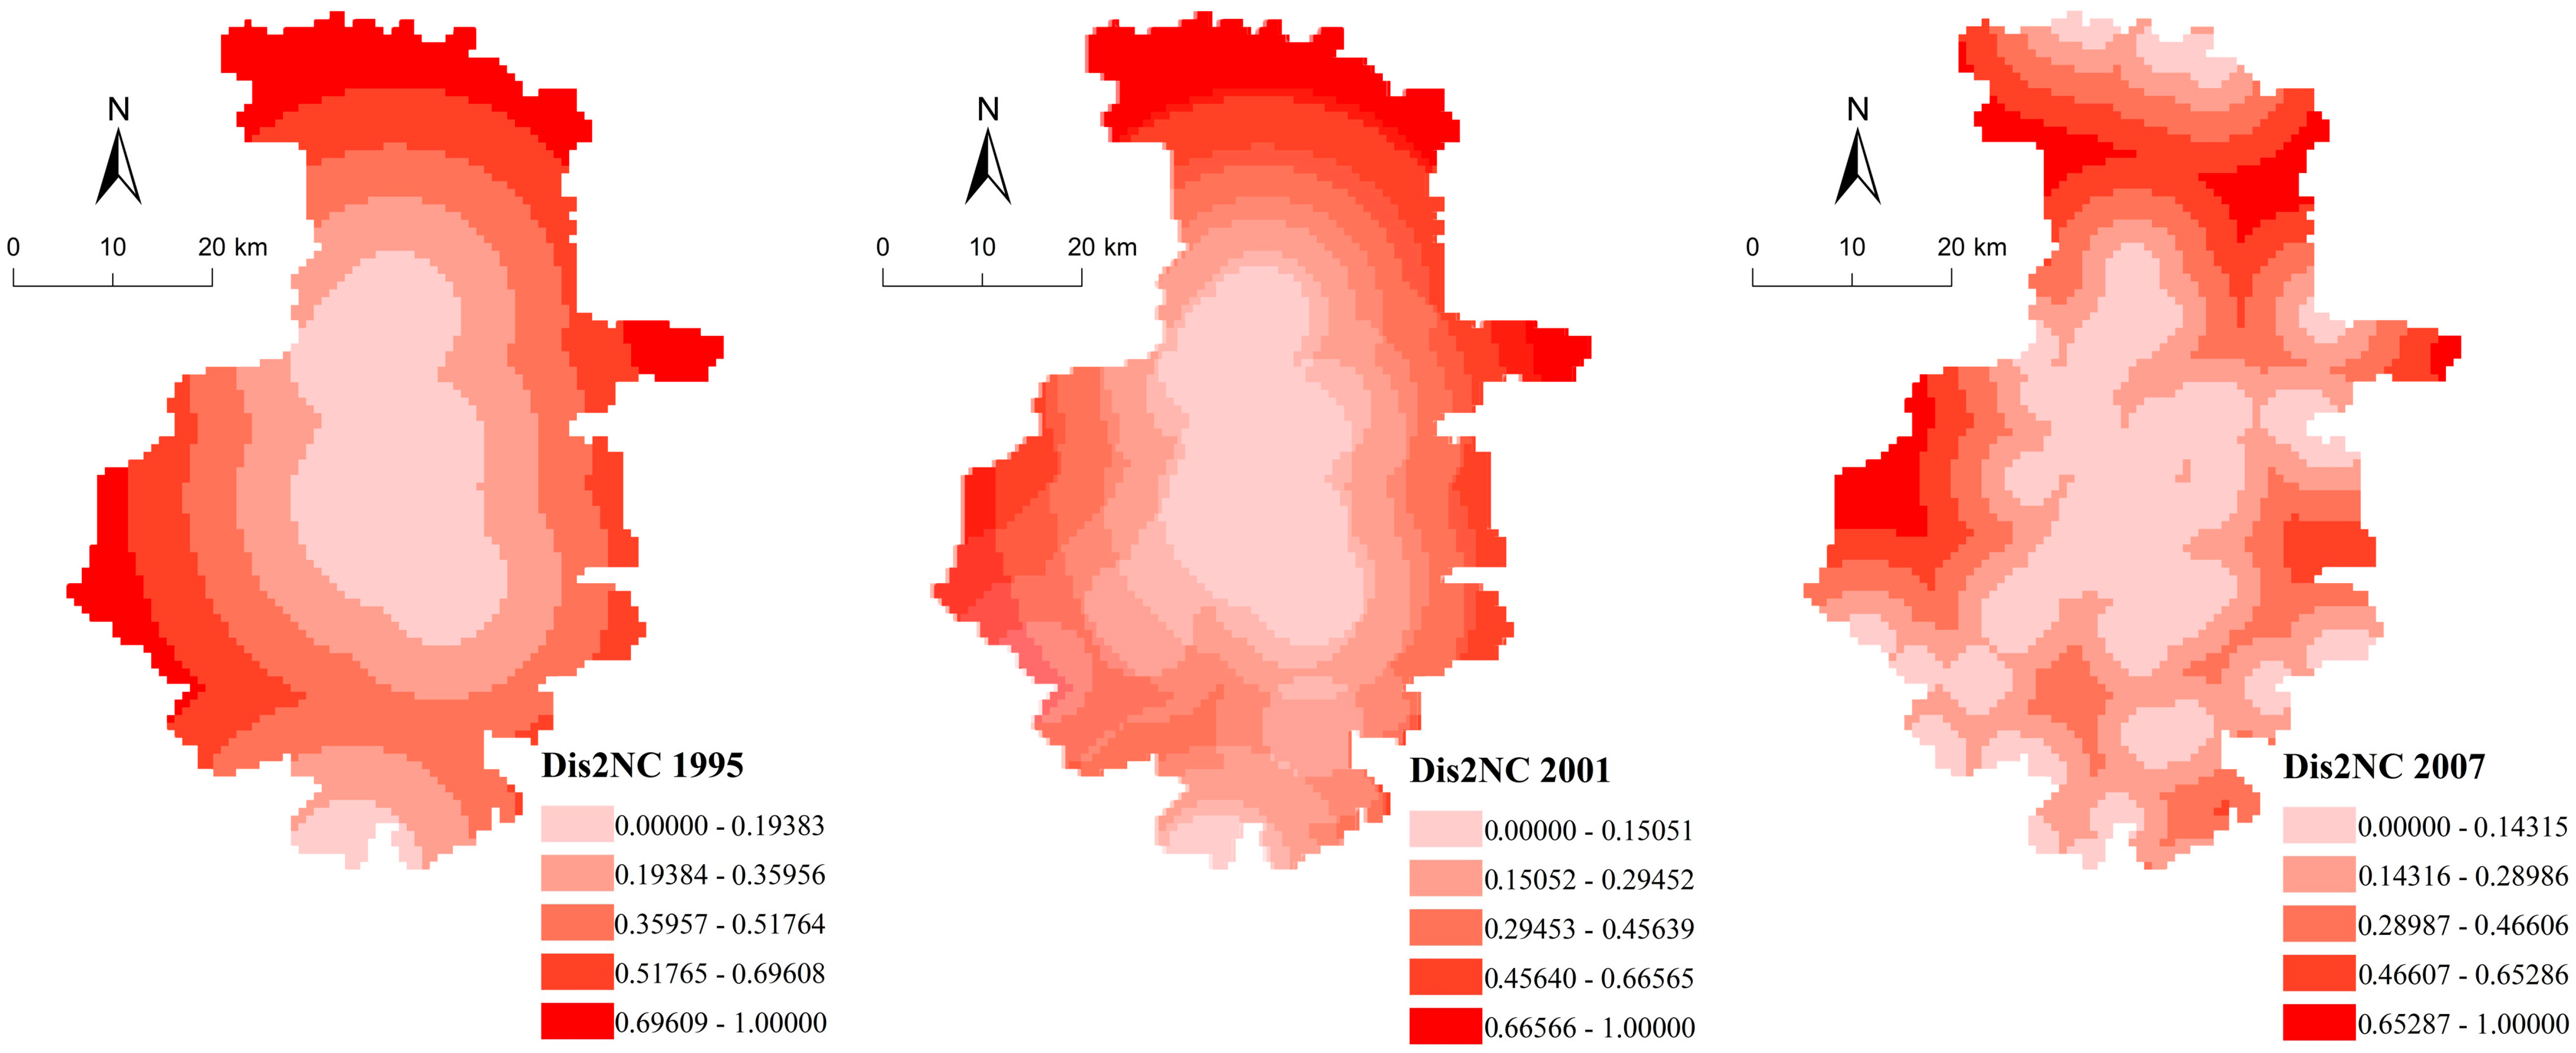
4.2. Characteristics of Accessibility Variables
4.3. Impact of Ecological Protection Areas on Urban Land Expansion
4.4. Relation between Planned Areas and Urban Land Expansion
5. Conclusions
Acknowledgments
Author Contributions
Conflicts of Interest
References
- Ding, C.; Lichtenberg, E. Land and urban economic growth in China. J. Reg. Sci. 2011, 51, 299–317. [Google Scholar] [CrossRef]
- Bai, X.; Shi, P.; Liu, Y. Realizing China’s urban dream. Nature 2014, 509, 158–160. [Google Scholar] [CrossRef] [PubMed]
- Gao, J.; Wei, Y.D.; Chen, W.; Yenneti, K. Urban land expansion and structural change in the Yangtze River Delta, China. Sustainability 2015, 7, 10281–10307. [Google Scholar] [CrossRef]
- Wei, Y.D.; Ye, X. Urbanization, land use, and sustainable development in China. Stoch. Environ. Res. Risk Assess. 2014, 28, 757–765. [Google Scholar] [CrossRef]
- Tan, R.; Beckmann, V.; van den Berg, L.; Qu, F. Governing farmland conversion: Comparing China with the Netherlands and Germany. Land Use Policy 2009, 26, 961–974. [Google Scholar] [CrossRef]
- Li, H.; Wei, Y.D.; Liao, F.H.; Huang, Z. Administrative hierarchy and urban land expansion in transitional China. Appl. Geogr. 2015, 56, 177–186. [Google Scholar] [CrossRef]
- Gao, J.; Wei, Y.D.; Chen, W.; Chen, J. Economic transition and urban land expansion in Provincial China. Habitat Int. 2014, 44, 461–473. [Google Scholar] [CrossRef]
- Wei, Y.D. Restructuring for growth in urban China: Transitional institutions, urban development, and spatial transformation. Habitat Int. 2012, 36, 396–405. [Google Scholar] [CrossRef]
- Chen, J.; Gao, J.; Chen, W. Urban land expansion and the transitional mechanisms in Nanjing, China. Habitat Int. 2016, 53, 274–283. [Google Scholar] [CrossRef]
- Liao, F.H.; Wei, Y.D. Modeling determinants of urban growth in Dongguan, China: A spatial logistic approach. Stoch. Environ. Res. Risk Assess. 2014, 28, 801–816. [Google Scholar] [CrossRef]
- Luo, J.; Wei, Y.D. Modeling spatial variations of urban growth patterns in Chinese cities: The case of Nanjing. Lands. Urban Plan. 2009, 91, 51–64. [Google Scholar] [CrossRef]
- Liu, Y.; Yue, W.; Fan, P. Spatial determinants of urban land conversion in large Chinese cities: A case of Hangzhou. Environ. Plan. B 2011, 38, 706–725. [Google Scholar] [CrossRef]
- Chen, J.; Gao, J.; Yuan, F. Growth Type and Functional Trajectories: An Empirical Study of Urban Expansion in Nanjing, China. PLoS ONE 2016, 11, e0148389. [Google Scholar] [CrossRef] [PubMed]
- Wang, J.; Chen, Y.; Shao, X.; Zhang, Y.; Cao, Y. Land-use changes and policy dimension driving forces in China: Present, trend and future. Land Use Policy 2012, 29, 737–749. [Google Scholar] [CrossRef]
- Qian, Z. Master plan, plan adjustment and urban development reality under China’s market transition: A case study of Nanjing. Cities 2013, 30, 77–88. [Google Scholar] [CrossRef]
- MacLeod, G. Place, politics and ‘scale dependence’ exploring the structuration of Euro-regionalism. Eur. Urban Reg. Stud. 1999, 6, 231–253. [Google Scholar] [CrossRef]
- Hurlbert, A.H.; Jetz, W. Species richness, hotspots, and the scale dependence of range maps in ecology and conservation. Proc. Natl. Acad. Sci. USA 2007, 104, 13384–13389. [Google Scholar] [CrossRef] [PubMed]
- Yuan, F.; Gao, J.; Wu, J. Nanjing—An ancient city rising in transitional China. Cities 2016, 50, 82–92. [Google Scholar] [CrossRef]
- Wei, Y.D. Zone fever, project fever: Economic transition, development policy, and urban expansion in China. Geogr. Rev. 2015, 105, 156–177. [Google Scholar] [CrossRef]
- Sui, D.Z. Tobler’s first law of geography: A big idea for a small world? Ann. Assoc. Am. Geogr. 2004, 94, 269–277. [Google Scholar] [CrossRef]
- Tobler, W. On the first law of geography: A reply. Ann. Assoc. Am. Geogr. 2004, 94, 304–310. [Google Scholar] [CrossRef]
- Tobler, W.R. A computer movie simulating urban growth in the Detroit region. Econ. Geogr. 1970, 46, 234–240. [Google Scholar] [CrossRef]
- Anselin, L.; Getis, A. Spatial statistical analysis and geographic information systems. Ann. Reg. Sci. 1992, 26, 19–33. [Google Scholar] [CrossRef]
- He, C.; Zhou, Y.; Huang, Z. Fiscal decentralization, political centralization, and land urbanization in China. Urban Geogr. 2016, 37, 436–457. [Google Scholar] [CrossRef]
- Anselin, L. Spatial Econometrics: Methods and Models; Kluwer Academic Publishers: Boston, MA, USA, 1988. [Google Scholar]
- Anselin, L.; Syabri, I.; Kho, Y. GeoDa: An introduction to spatial data analysis. Geogr. Anal. 2006, 38, 5–22. [Google Scholar] [CrossRef]
- Muth, R.F. Economic change and rural-urban land conversions. Econ. J. Econ. Soc. 1961, 29, 1–23. [Google Scholar] [CrossRef]
- Harvey, D. The Urbanization of Capital: Studies in the History and Theory of Capitalist Urbanization; Johns Hopkins University Press: Baltimore, MA, USA, 1985. [Google Scholar]
- Harvey, D. The geography of capitalist accumulation: A reconstruction of the Marxian theory. Antipode 1975, 7, 9–21. [Google Scholar] [CrossRef]
- Gao, J.; Li, S. Detecting spatially non-stationary and scale-dependent relationships between urban landscape fragmentation and related factors using geographically weighted regression. Appl. Geogr. 2011, 31, 292–302. [Google Scholar] [CrossRef]
- Li, H.; Wei, Y.D.; Huang, Z. Urban Land Expansion and Spatial Dynamics in Globalizing Shanghai. Sustainability 2014, 6, 8856–8875. [Google Scholar] [CrossRef]
- Braimoh, A.K.; Onishi, T. Spatial determinants of urban land use change in Lagos, Nigeria. Land Use Policy 2007, 24, 502–515. [Google Scholar] [CrossRef]
- Tan, R.; Liu, Y.; Liu, Y.; He, Q.; Ming, L.; Tang, S. Urban growth and its determinants across the Wuhan urban agglomeration, central China. Habitat Int. 2014, 44, 268–281. [Google Scholar] [CrossRef]
- Sharifi, A.; Chiba, Y.; Okamoto, K.; Yokoyama, S.; Murayama, A. Can master planning control and regulate urban growth in Vientiane, Laos? Landsc. Urban Plan. 2014, 131, 1–13. [Google Scholar] [CrossRef]
- Kivell, P. Land and the City: Patterns and Processes of Urban Change; Psychology Press: London, UK, 1993. [Google Scholar]
- Xu, J.; Liao, B.; Shen, Q.; Zhang, F.; Mei, A. Urban Spatial Restructuring in Transitional Economy—Changing Land Use Pattern in Shanghai China. Chin. Geogr. Sci. 2007, 17, 19–27. [Google Scholar] [CrossRef]
- Zhang, Q.; Wallace, J.; Deng, X.; Seto, K.C. Central versus local states: Which matters more in affecting China’s urban growth? Land Use Policy 2014, 38, 487–496. [Google Scholar] [CrossRef]
- Gao, B.; Liu, W.; Michael, D. State land policy, land markets and geographies of manufacturing: The case of Beijing, China. Land Use Policy 2014, 36, 1–12. [Google Scholar]
- Wu, F.; Zhou, L. Beautiful China: The experience of Jiangsu’s rural village improvement program. Front. Plan. Vis. Futures Hum. Settl. 2013, 156–169. [Google Scholar]
- Fang, C.; Ma, H.; Wang, J. A Regional Categorization for “New-Type Urbanization” in China. PLoS ONE 2015, 10, e0134253. [Google Scholar] [CrossRef] [PubMed]
- Liu, Y.; Wang, L.; Long, H. Spatio-temporal analysis of land-use conversion in the eastern coastal China during 1996–2005. J. Geogr. Sci. 2008, 18, 274–282. [Google Scholar] [CrossRef]
- Cohen, P.; Cohen, J.; Aiken, L.S.; West, S.G. The problem of units and the circumstance for POMP. Multivar. Behav. Res. 1999, 34, 315–346. [Google Scholar] [CrossRef]
- Zhang, W.; Wang, W.; Li, X.; Ye, F. Economic development and farmland protection: An assessment of rewarded land conversion quotas trading in Zhejiang, China. Land Use Policy 2014, 38, 467–476. [Google Scholar] [CrossRef]
- Oueslati, W.; Alvanides, S.; Garrod, G. Determinants of urban sprawl in European cities. Urban Stud. 2015, 52, 1594–1614. [Google Scholar] [CrossRef] [PubMed]
- Yue, W.; Liu, Y.; Fan, P. Polycentric urban development: The case of Hangzhou. Environ. Plan. A 2010, 42, 563–577. [Google Scholar] [CrossRef]
- Wu, F. Polycentric urban development and land-use change in a transitional economy: The case of Guangzhou. Environ. Plan. A 1998, 30, 1077–1100. [Google Scholar] [CrossRef]
- Xu, C.; Liu, M.; Zhang, C.; An, S.; Yu, W.; Chen, J.M. The spatiotemporal dynamics of rapid urban growth in the Nanjing metropolitan region of China. Landsc. Ecol. 2007, 22, 925–937. [Google Scholar] [CrossRef]
- Liu, Y.; Fang, F.; Li, Y. Key issues of land use in China and implications for policy making. Land Use Policy 2014, 40, 6–12. [Google Scholar] [CrossRef]
- Liu, H.; Zhou, G.; Wennersten, R.; Frostell, B. Analysis of sustainable urban development approaches in China. Habitat Int. 2014, 41, 24–32. [Google Scholar] [CrossRef]
- Fan, J.; Sun, W.; Zhou, K.; Chen, D. Major function oriented zone: New method of spatial regulation for reshaping regional development pattern in China. Chin. Geogr. Sci. 2012, 22, 196–209. [Google Scholar] [CrossRef]
- Zhu, J. From land use right to land development right: Institutional change in China’s urban development. Urban Stud. 2004, 41, 1249–1267. [Google Scholar] [CrossRef]
- Wang, L.; Shen, J.; Chung, C.K.L. City profile: Suzhou—A Chinese city under transformation. Cities 2015, 44, 60–72. [Google Scholar] [CrossRef]
- Jiang, L.; Deng, X.; Seto, K.C. Multi-level modeling of urban expansion and cultivated land conversion for urban hotspot counties in China. Landsc. Urban Plan. 2012, 108, 131–139. [Google Scholar] [CrossRef]
- Smith, N.R. Beyond top-down/bottom-up: Village transformation on China’s urban edge. Cities 2014, 41, 209–220. [Google Scholar] [CrossRef]
- Huang, B.; Wu, B.; Barry, M. Geographically and temporally weighted regression for modeling spatio-temporal variation in house prices. Int. J. Geogr. Inform. Sci. 2010, 24, 383–401. [Google Scholar] [CrossRef]
- Wang, W.; Yu, J. Estimation of spatial panel data models with time varying spatial weights matrices. Econ. Lett. 2015, 128, 95–99. [Google Scholar] [CrossRef]
- Elhorst, J.P. Specification and estimation of spatial panel data models. Int. Reg. Sci. Rev. 2003, 26, 244–268. [Google Scholar] [CrossRef]


| Categories | Factors | Variables | Definitions | Expected |
|---|---|---|---|---|
| Dependent Variable | Urban expansion | UE | Area of urban land expansion during the study period. | |
| Independent Variables | ||||
| Benefits of urban land expansion | Economy of scale | UL | Area of urban land having been developed at the beginning year. | Negative |
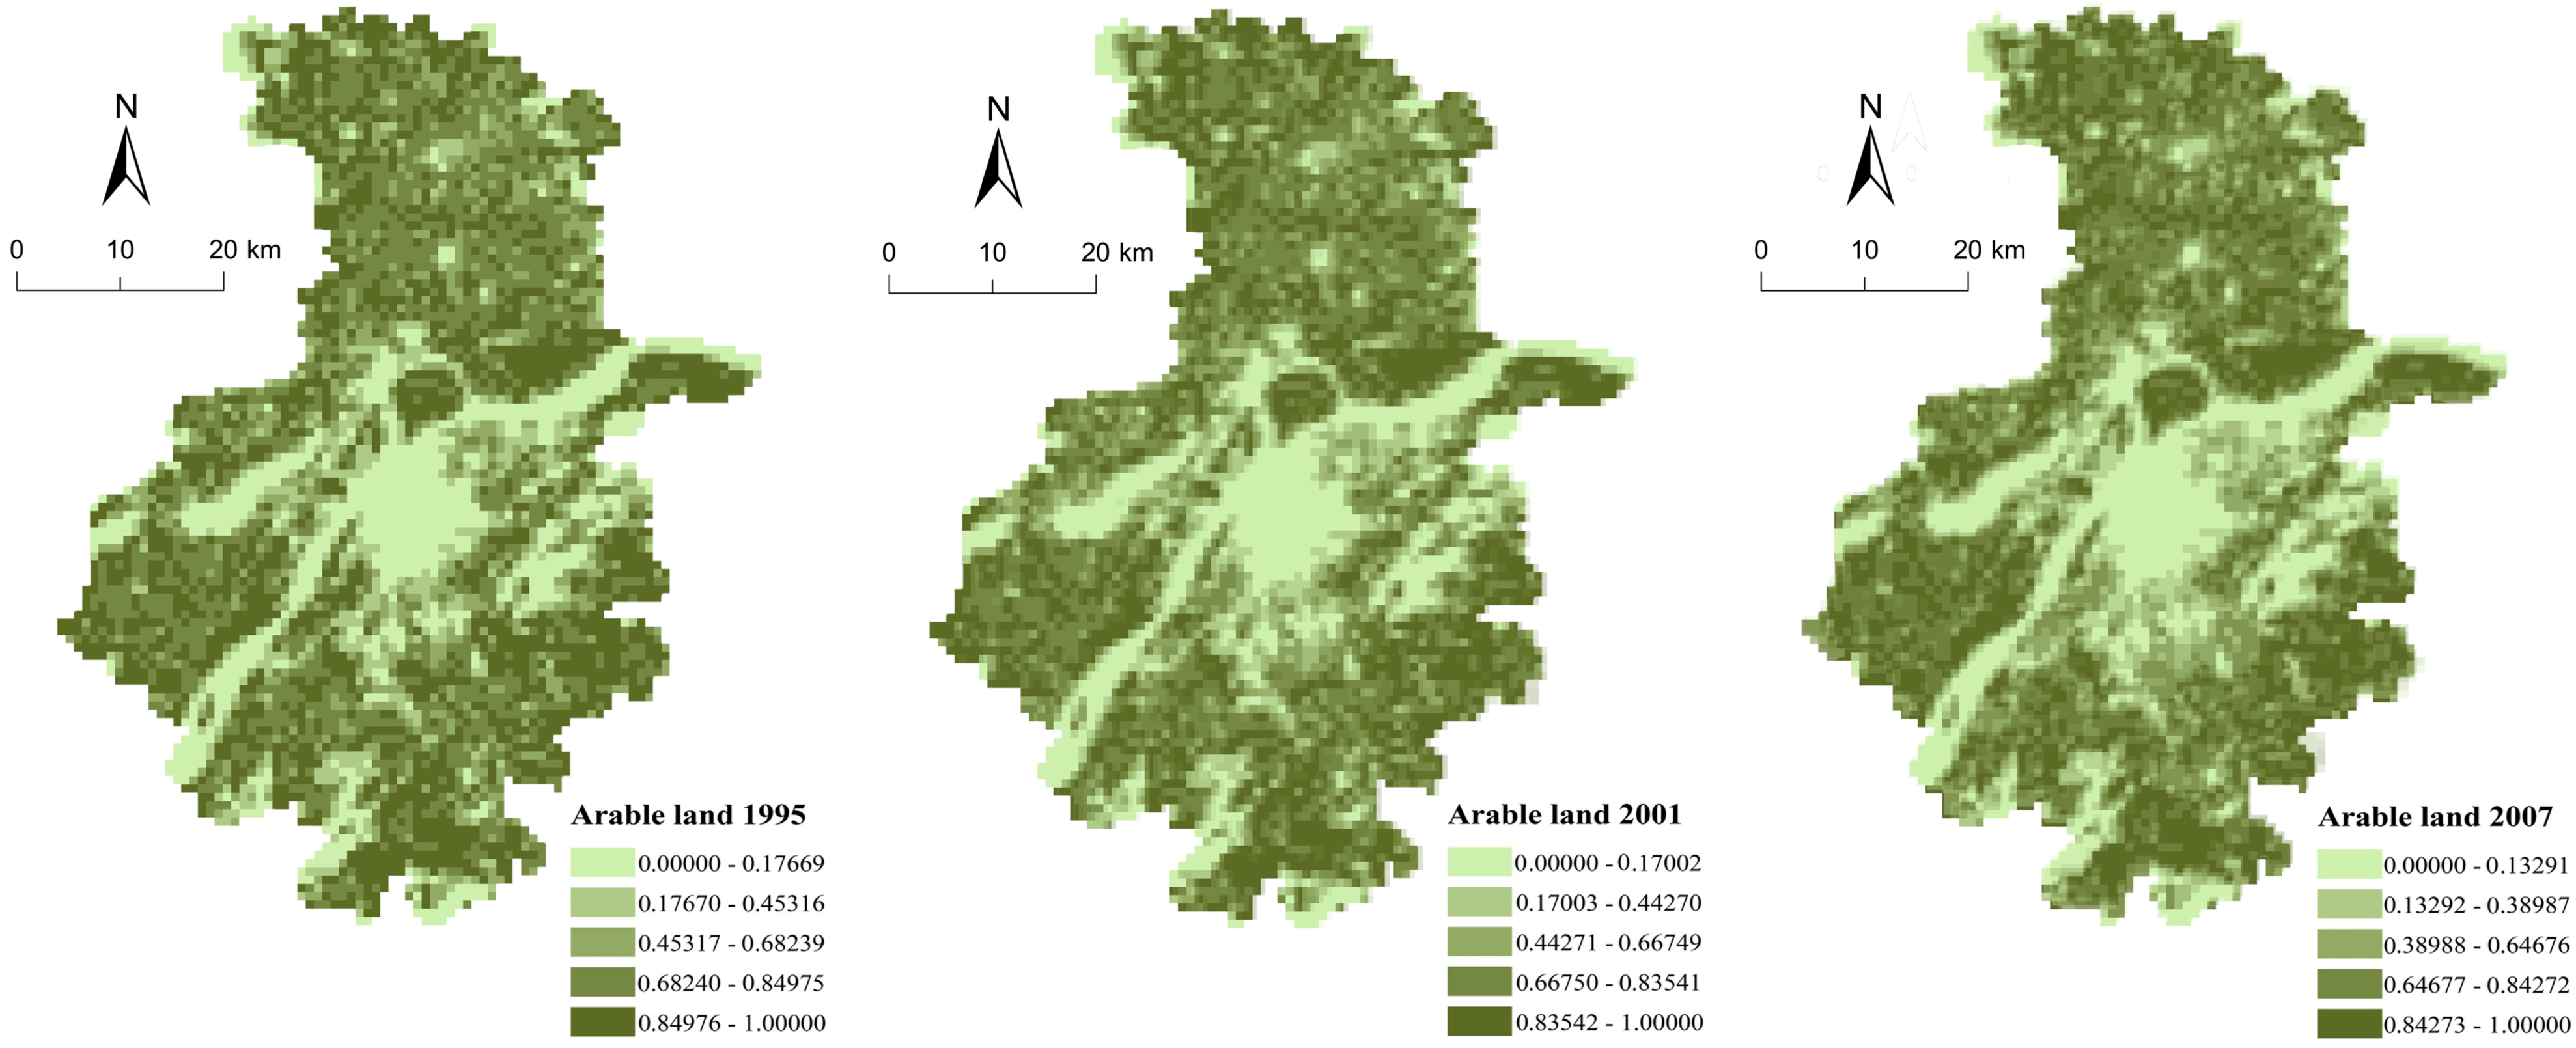
| AL | Area of arable land having not been developed at the beginning year. | Positive | ||
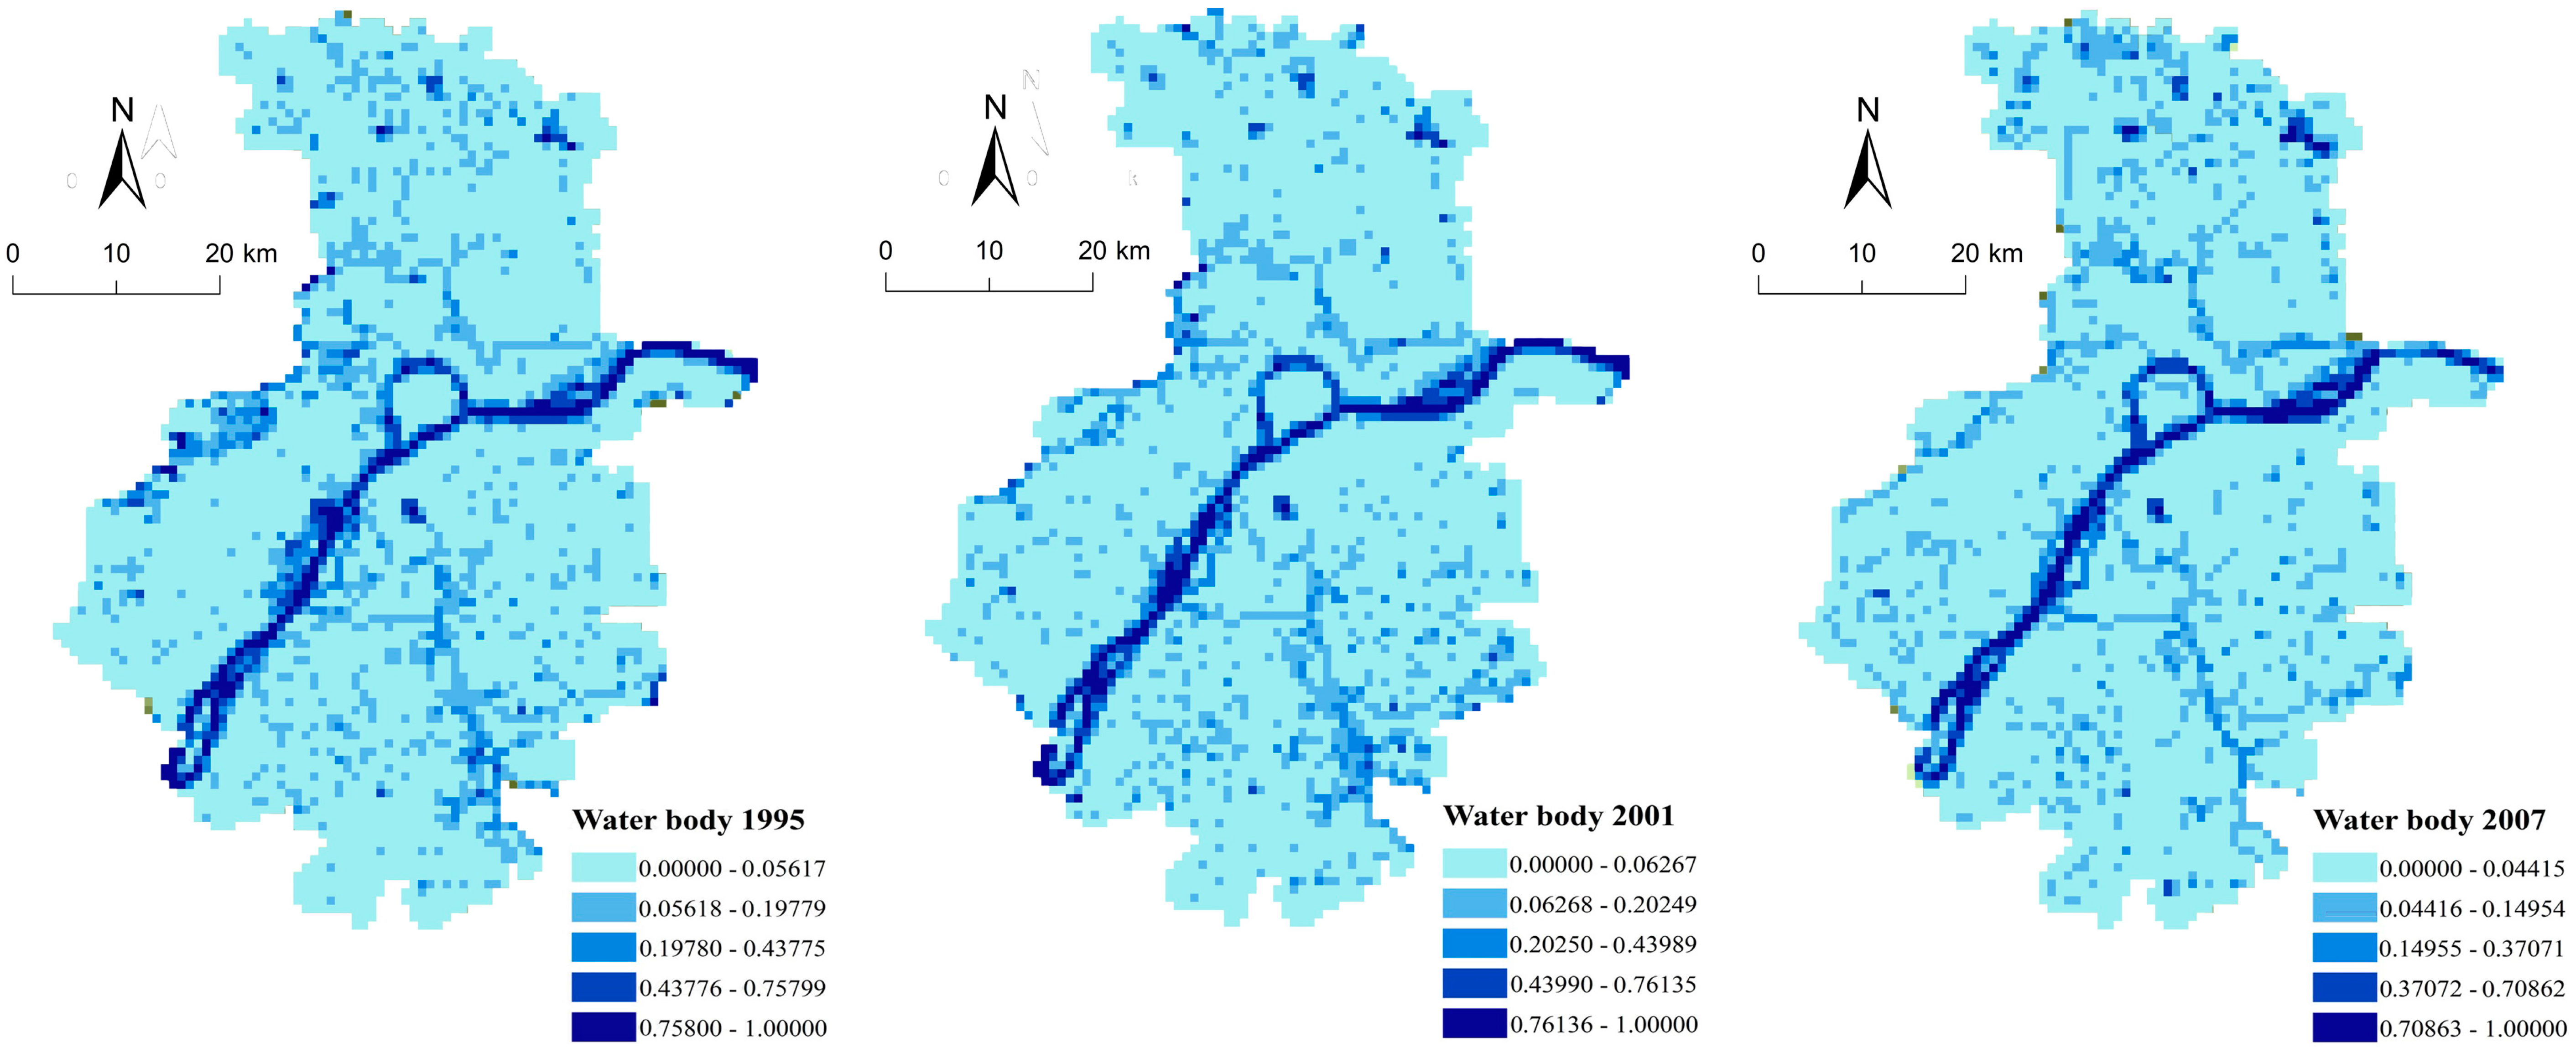
| WB | Area of water body that cannot be developed during the study period. | Negative | ||
| Agglomeration | Dis2NC * | Distance to the nearest construction core at the beginning year. | Negative | |
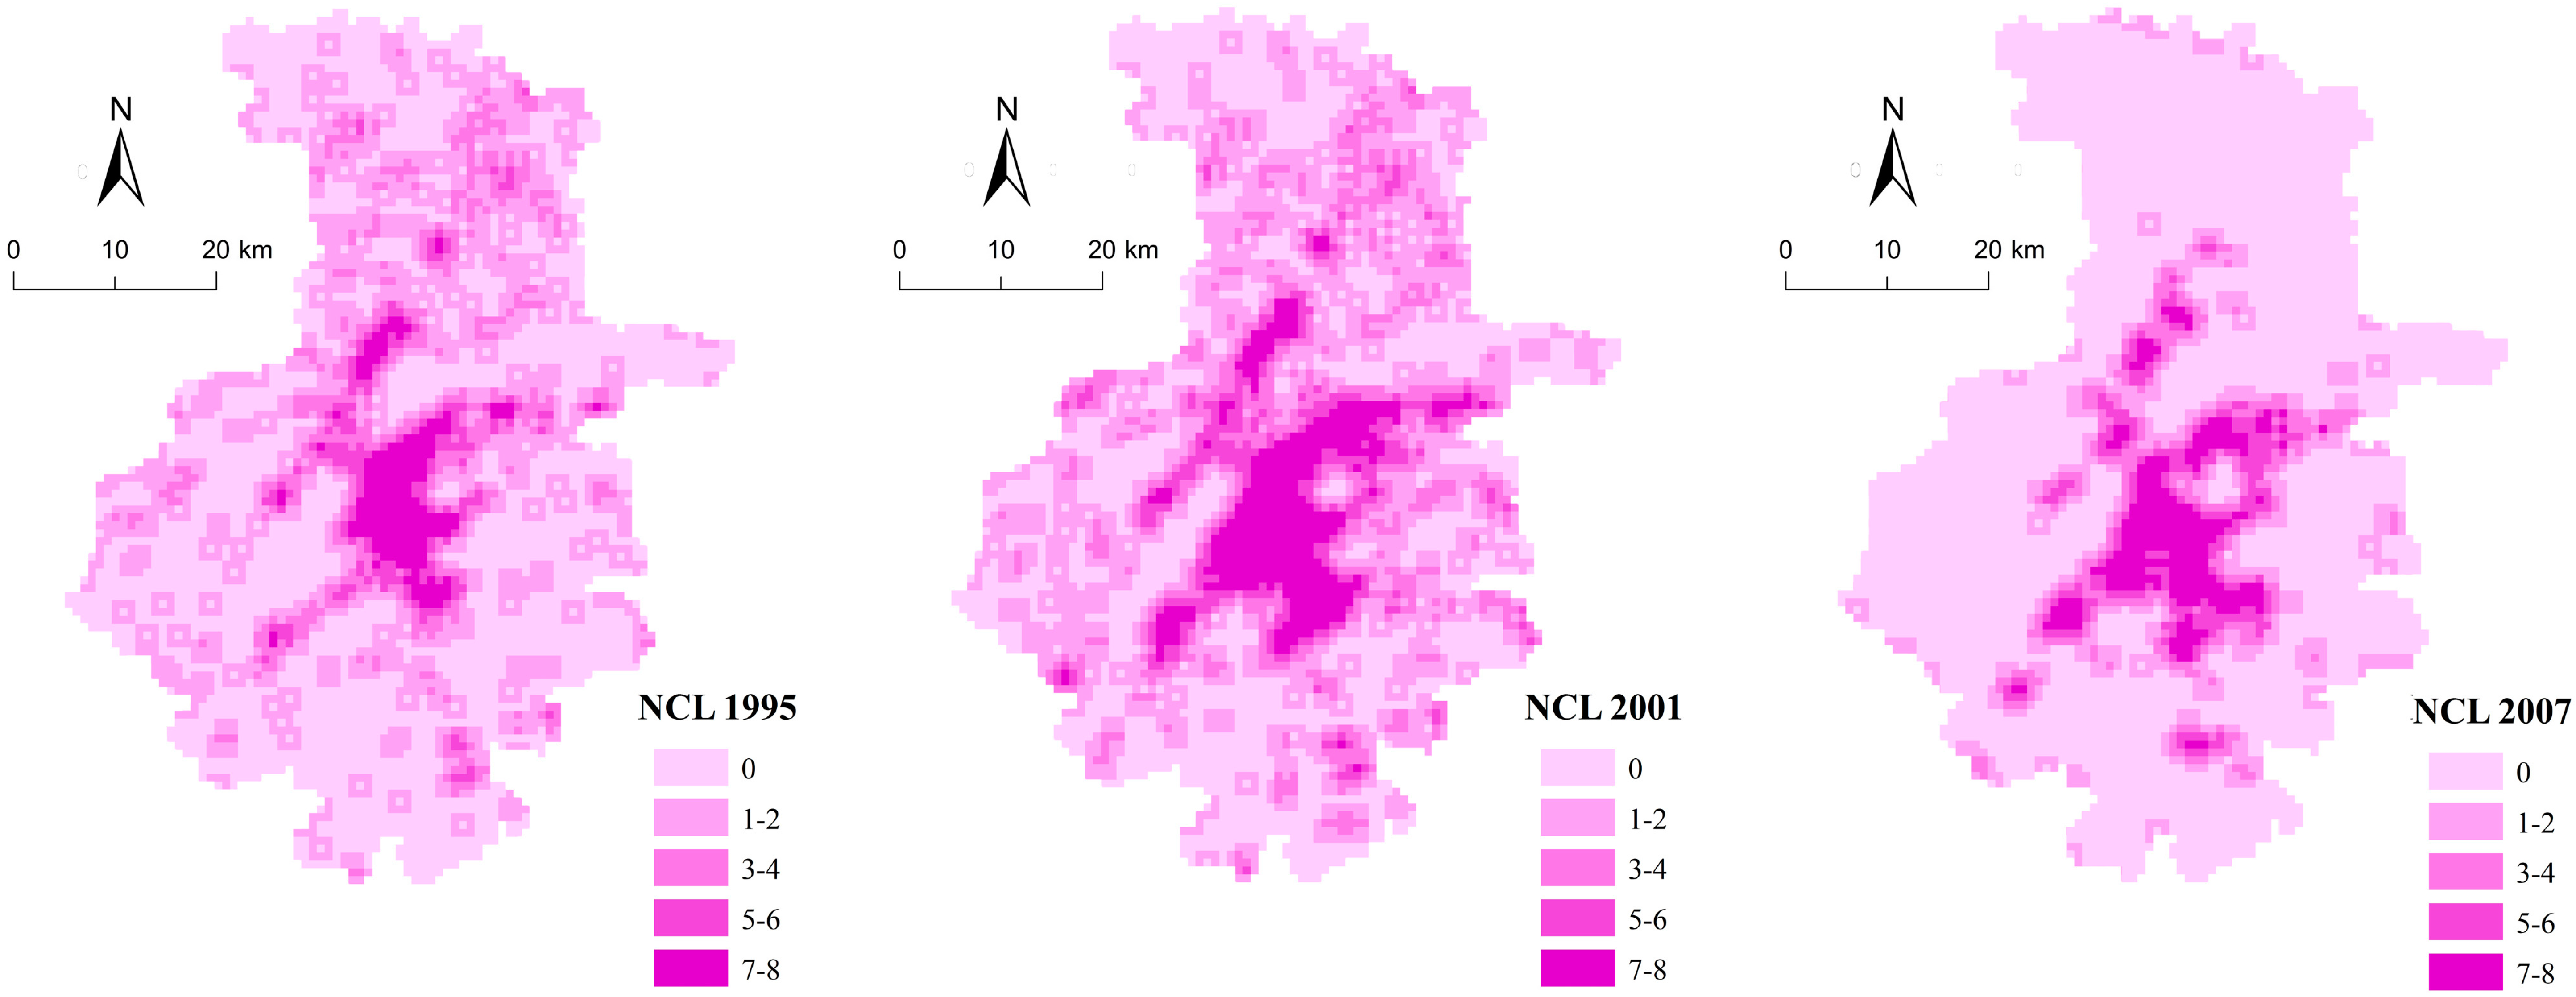
| NCL ** | Number of neighboring grids with the construction land accounting for the most proportion at the beginning year. | Positive | ||
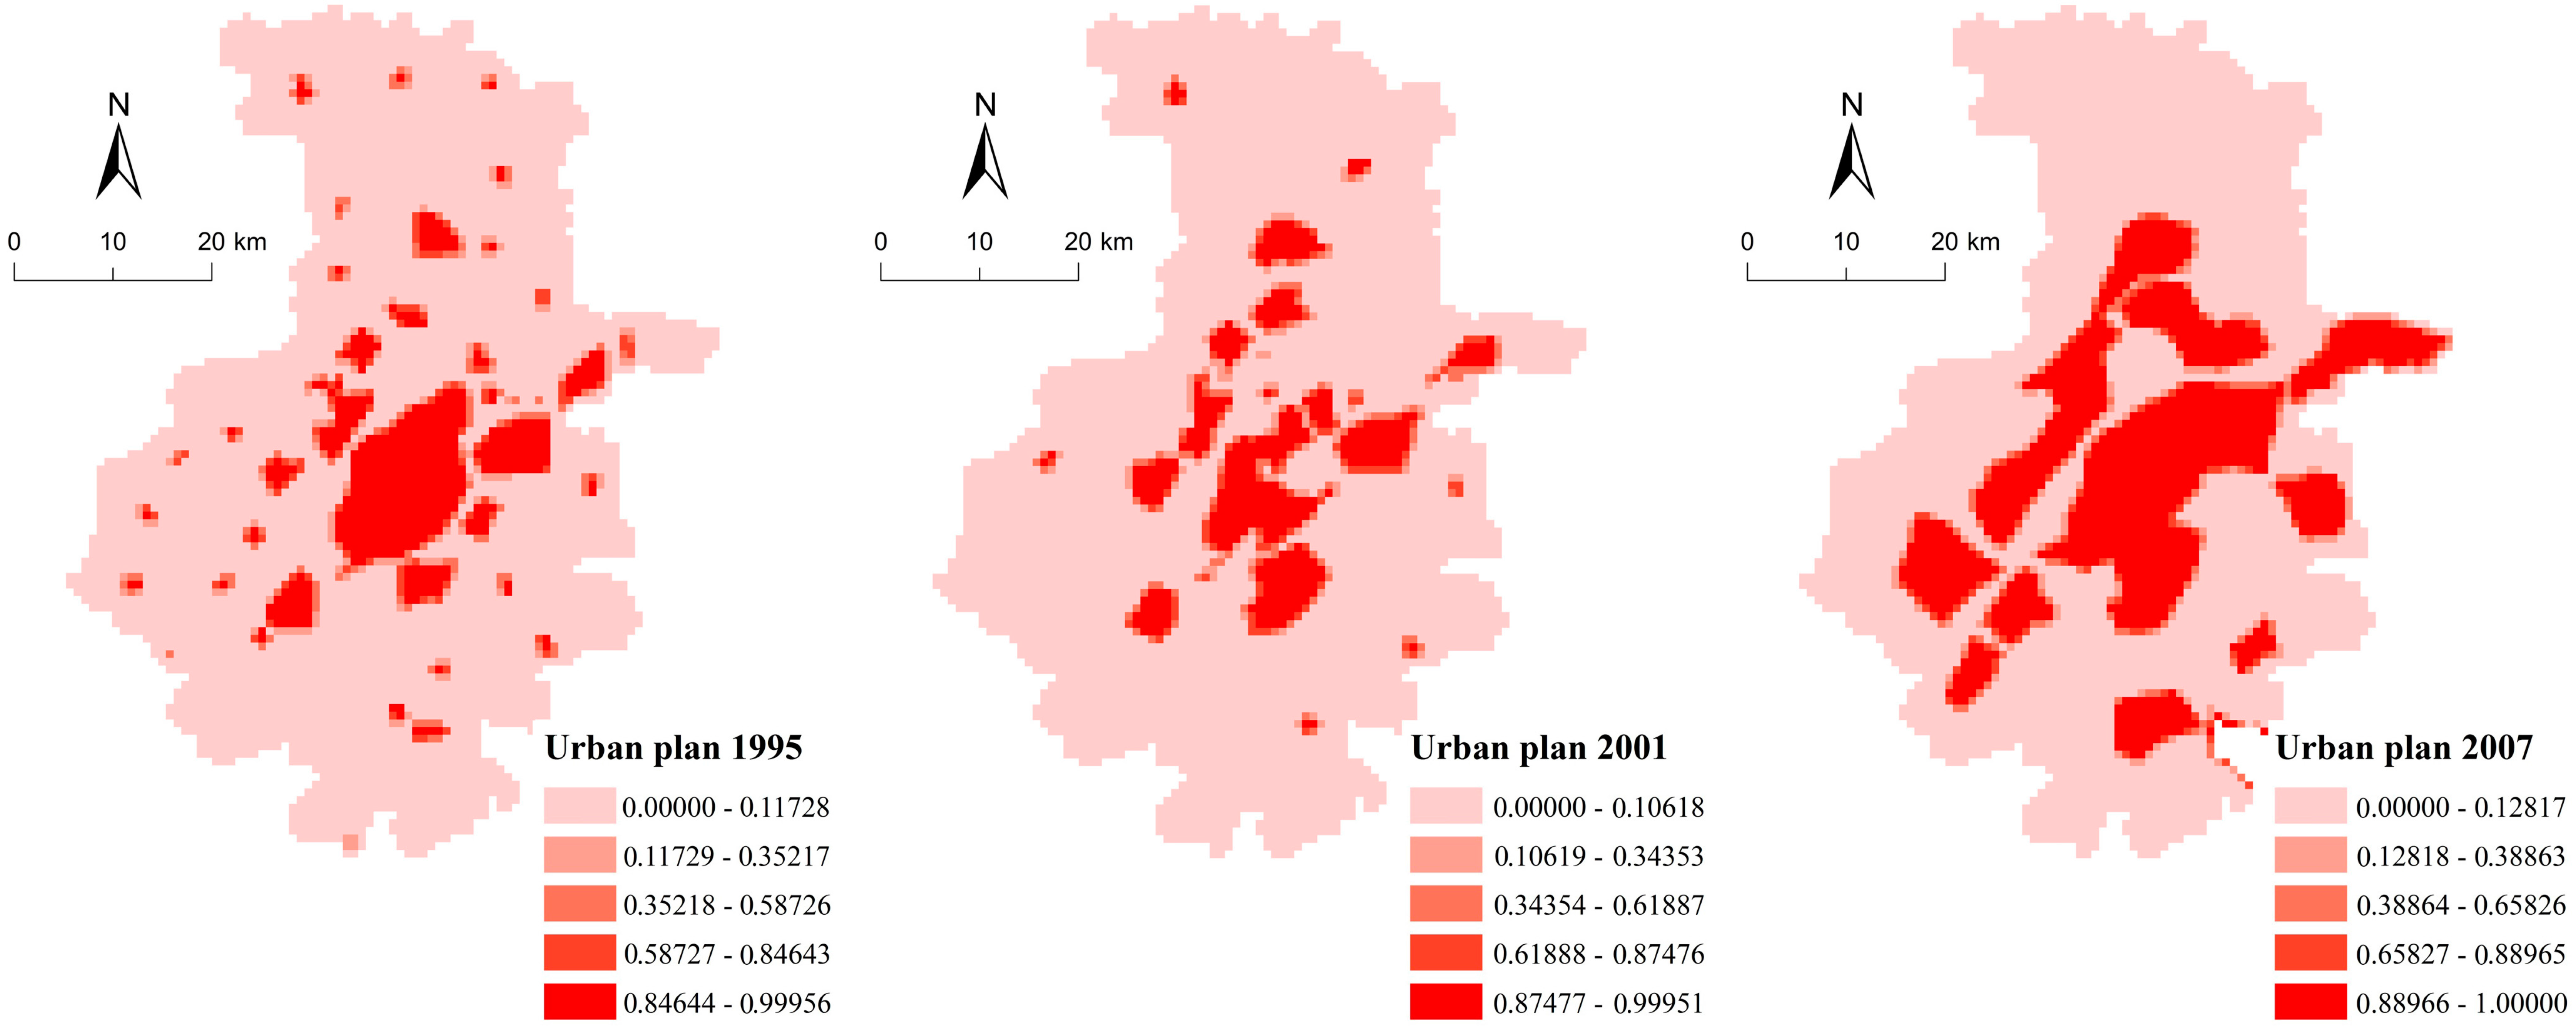
| Urban planning | UP | Area of planed urban land at the beginning year. | Positive | |
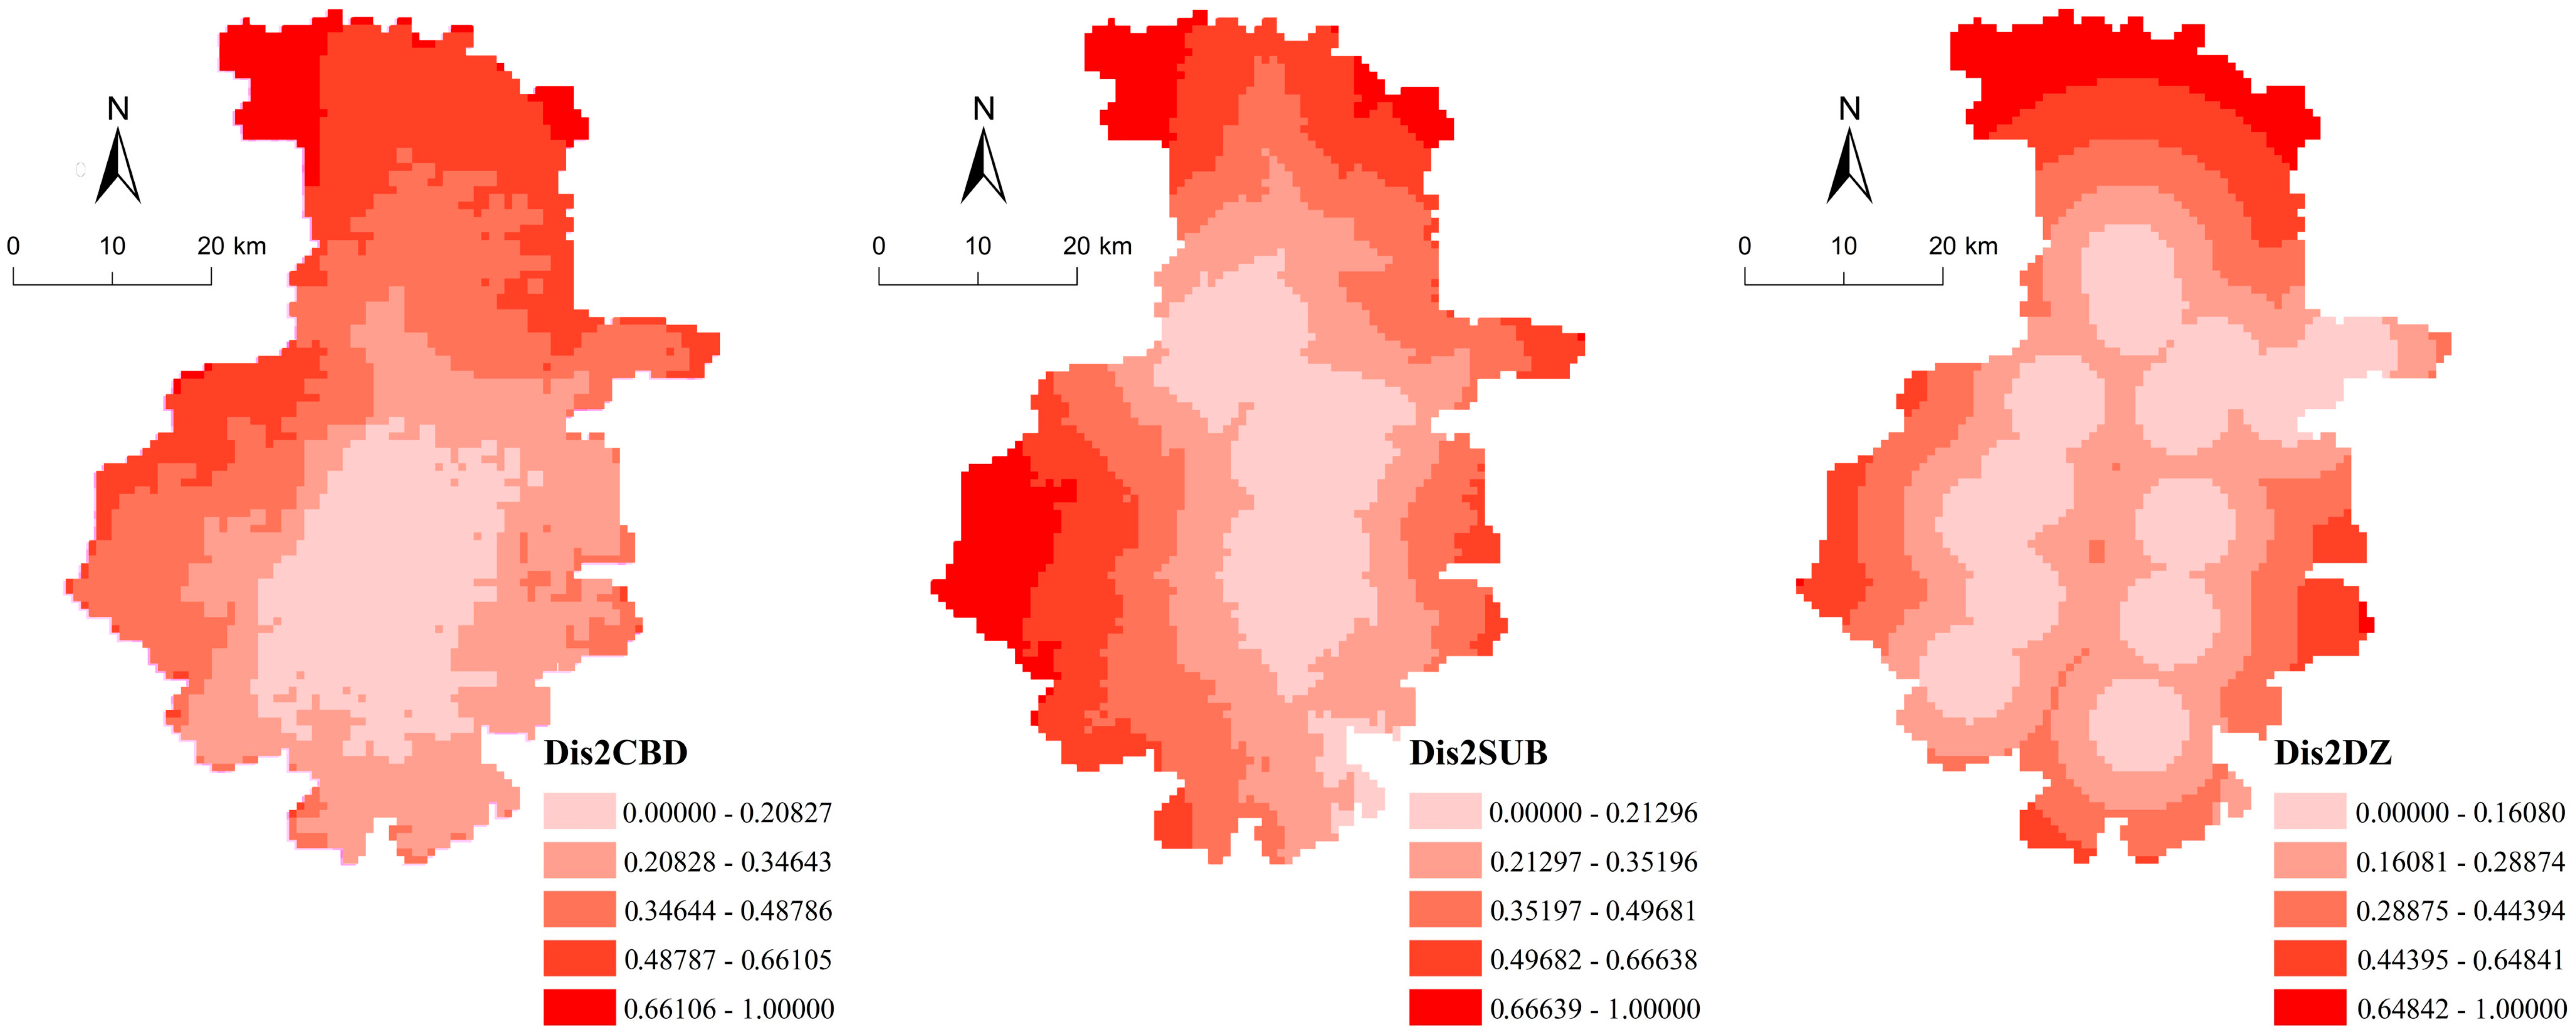
| Costs of urban land expansion | Accessibility | Dis2CBD | Distance to the central business district. | Negative |
| Dis2SUB | Distance to the nearest sub-center. | Negative | ||
| Dis2DZ | Distance to the nearest development zone. | Negative | ||
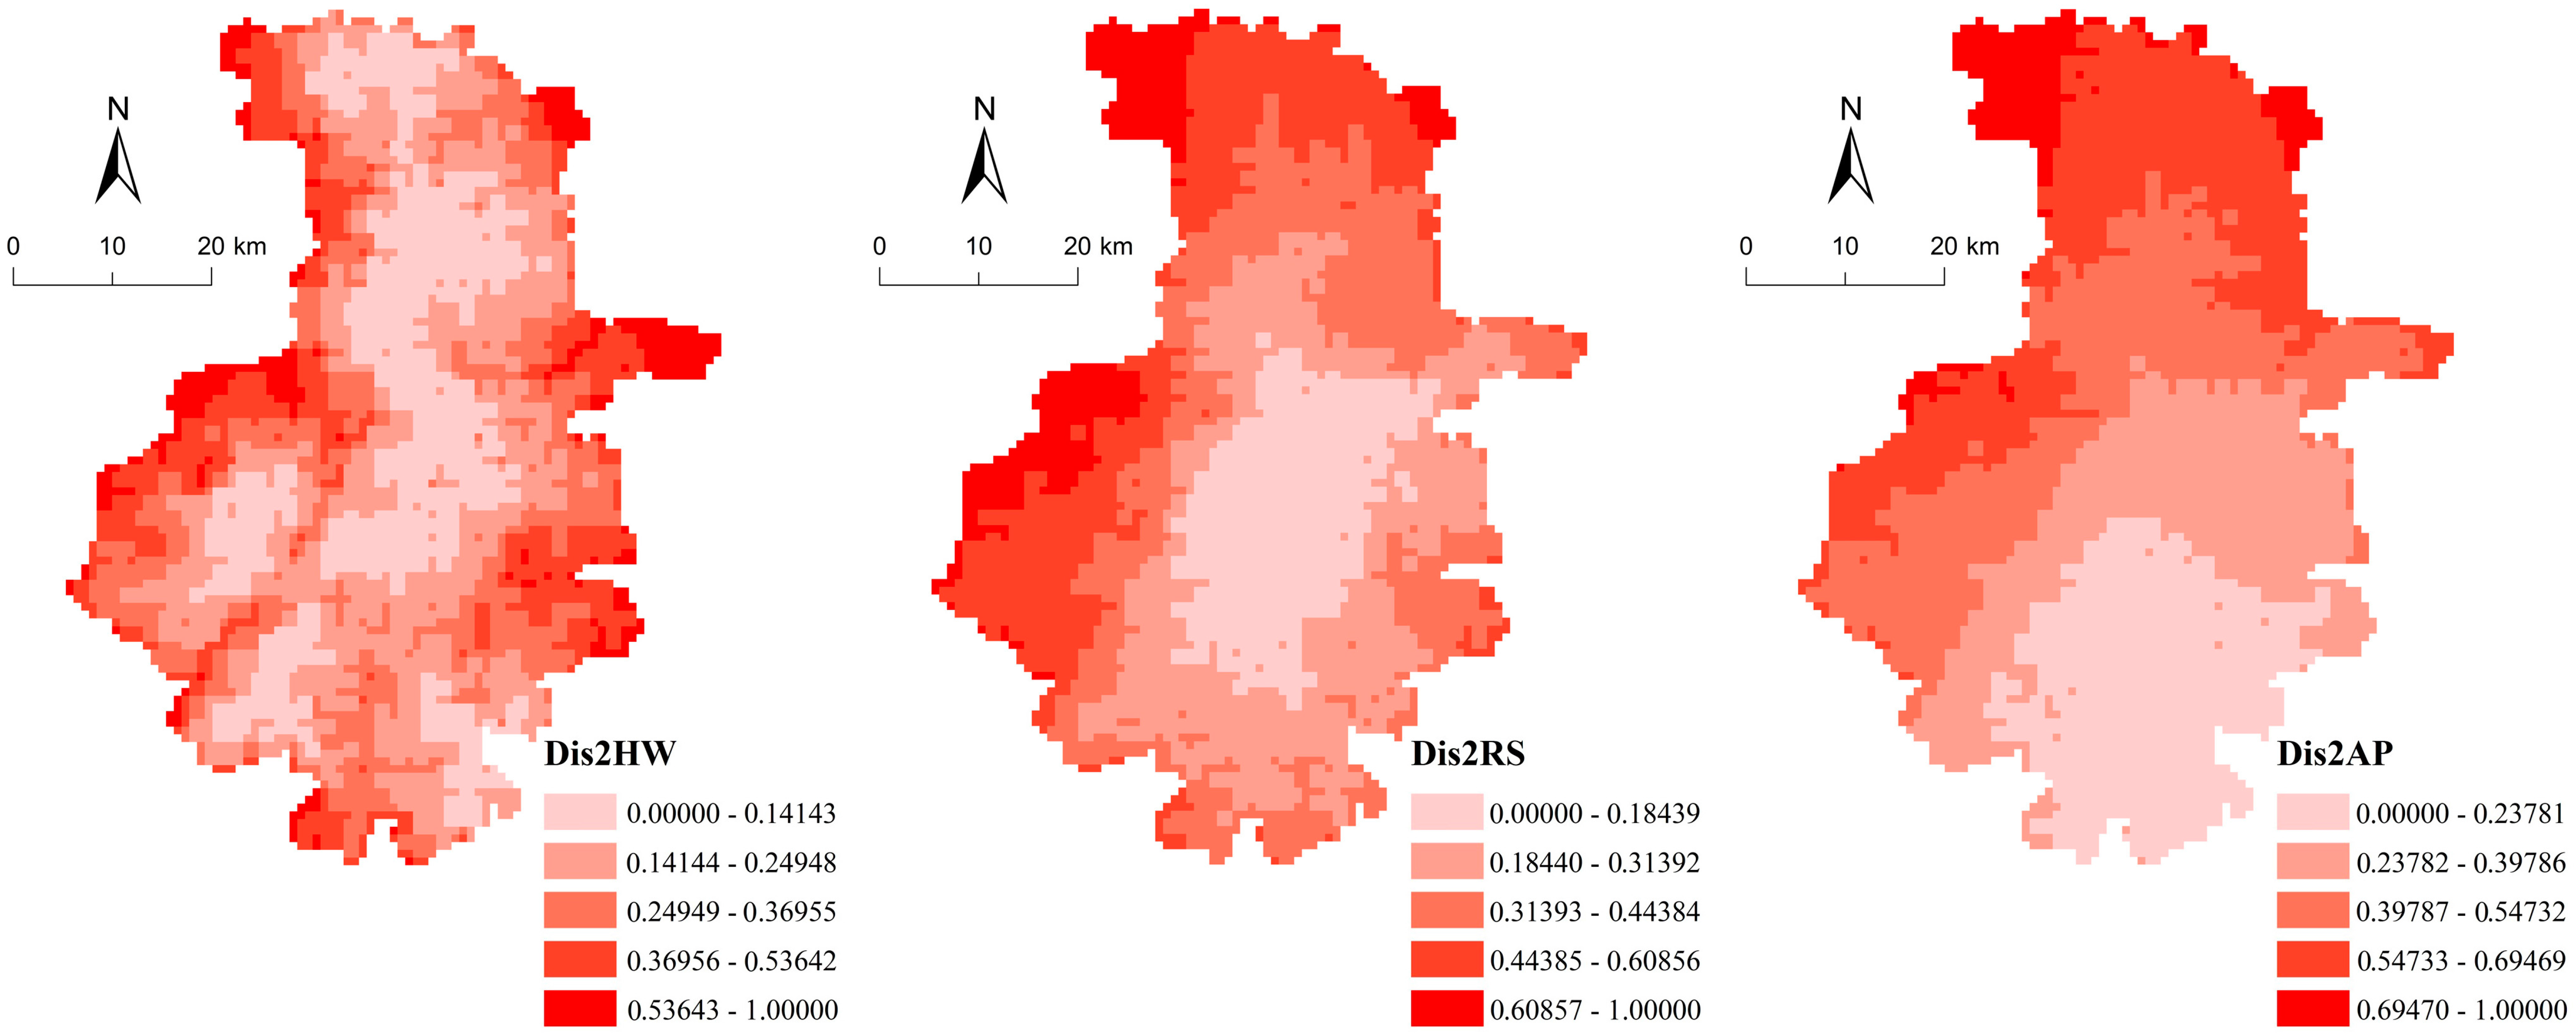
| Dis2HW | Distance to the nearest highway ramp. | Negative | ||
| Dis2RS | Distance to the railway station. | Negative | ||
| Dis2AP | Distance to Lukou International Airport. | Negative | ||
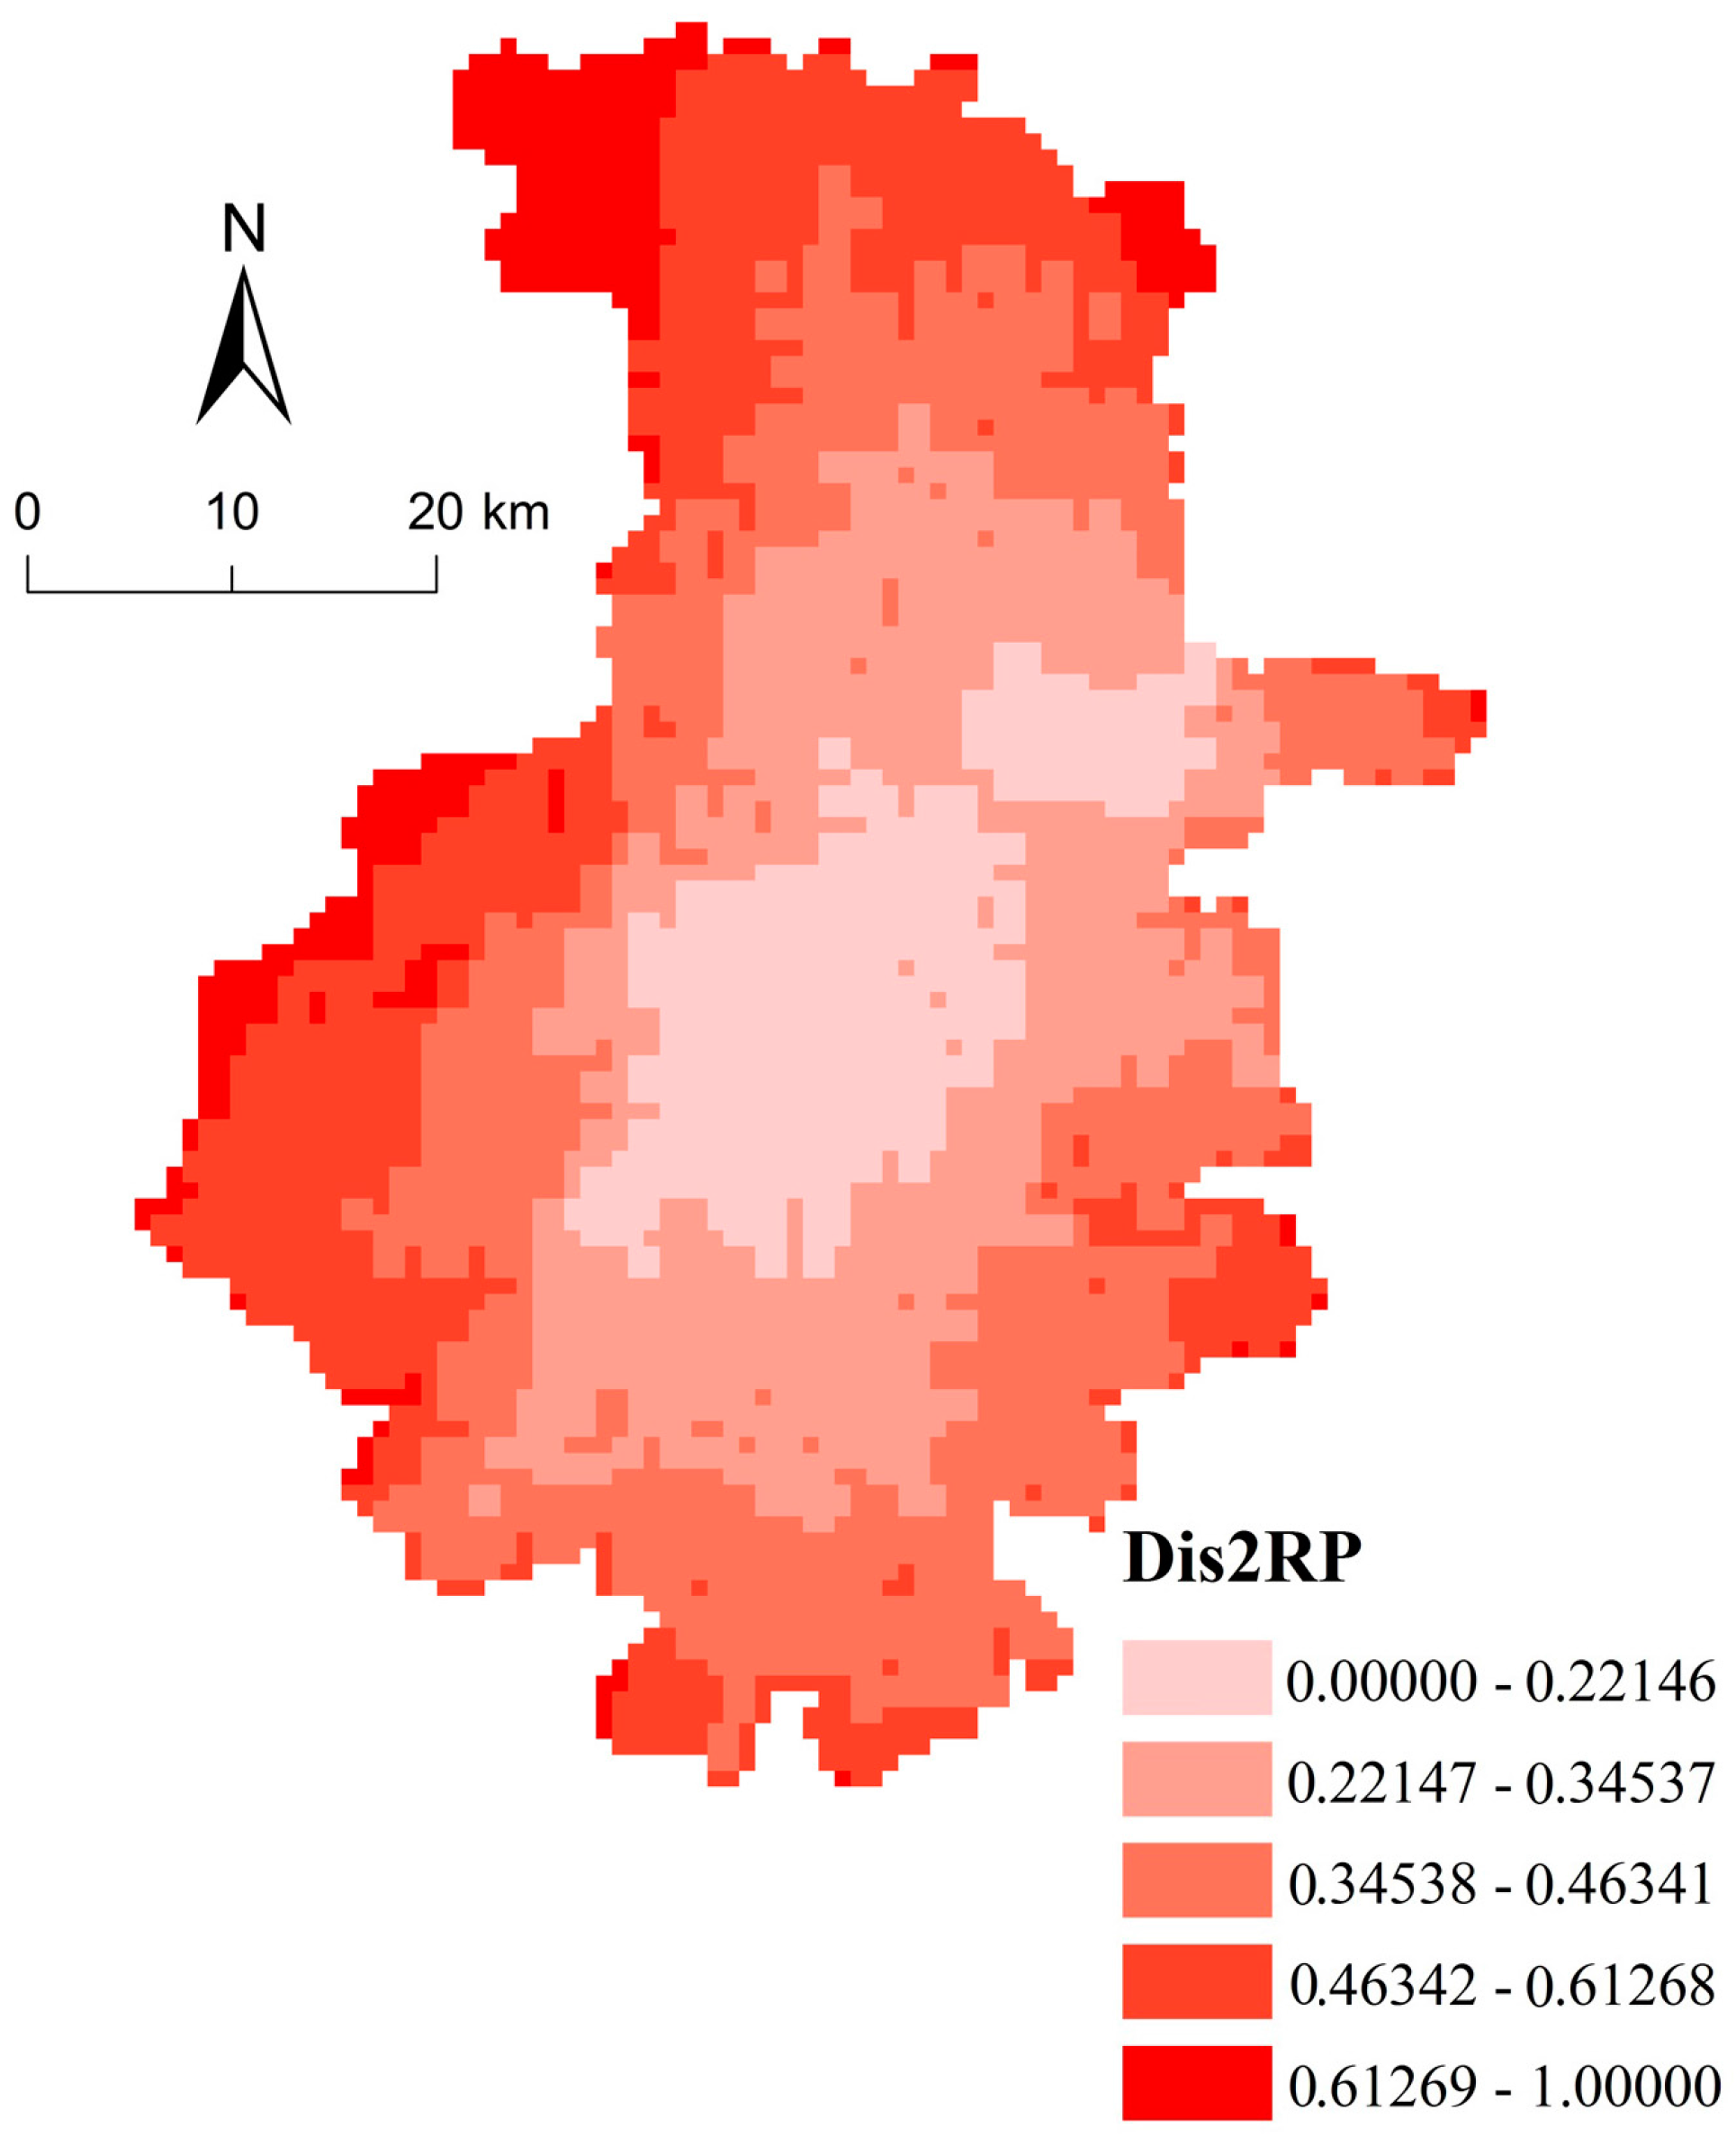
| Dis2RP | Distance to the nearest river port. | Negative | ||
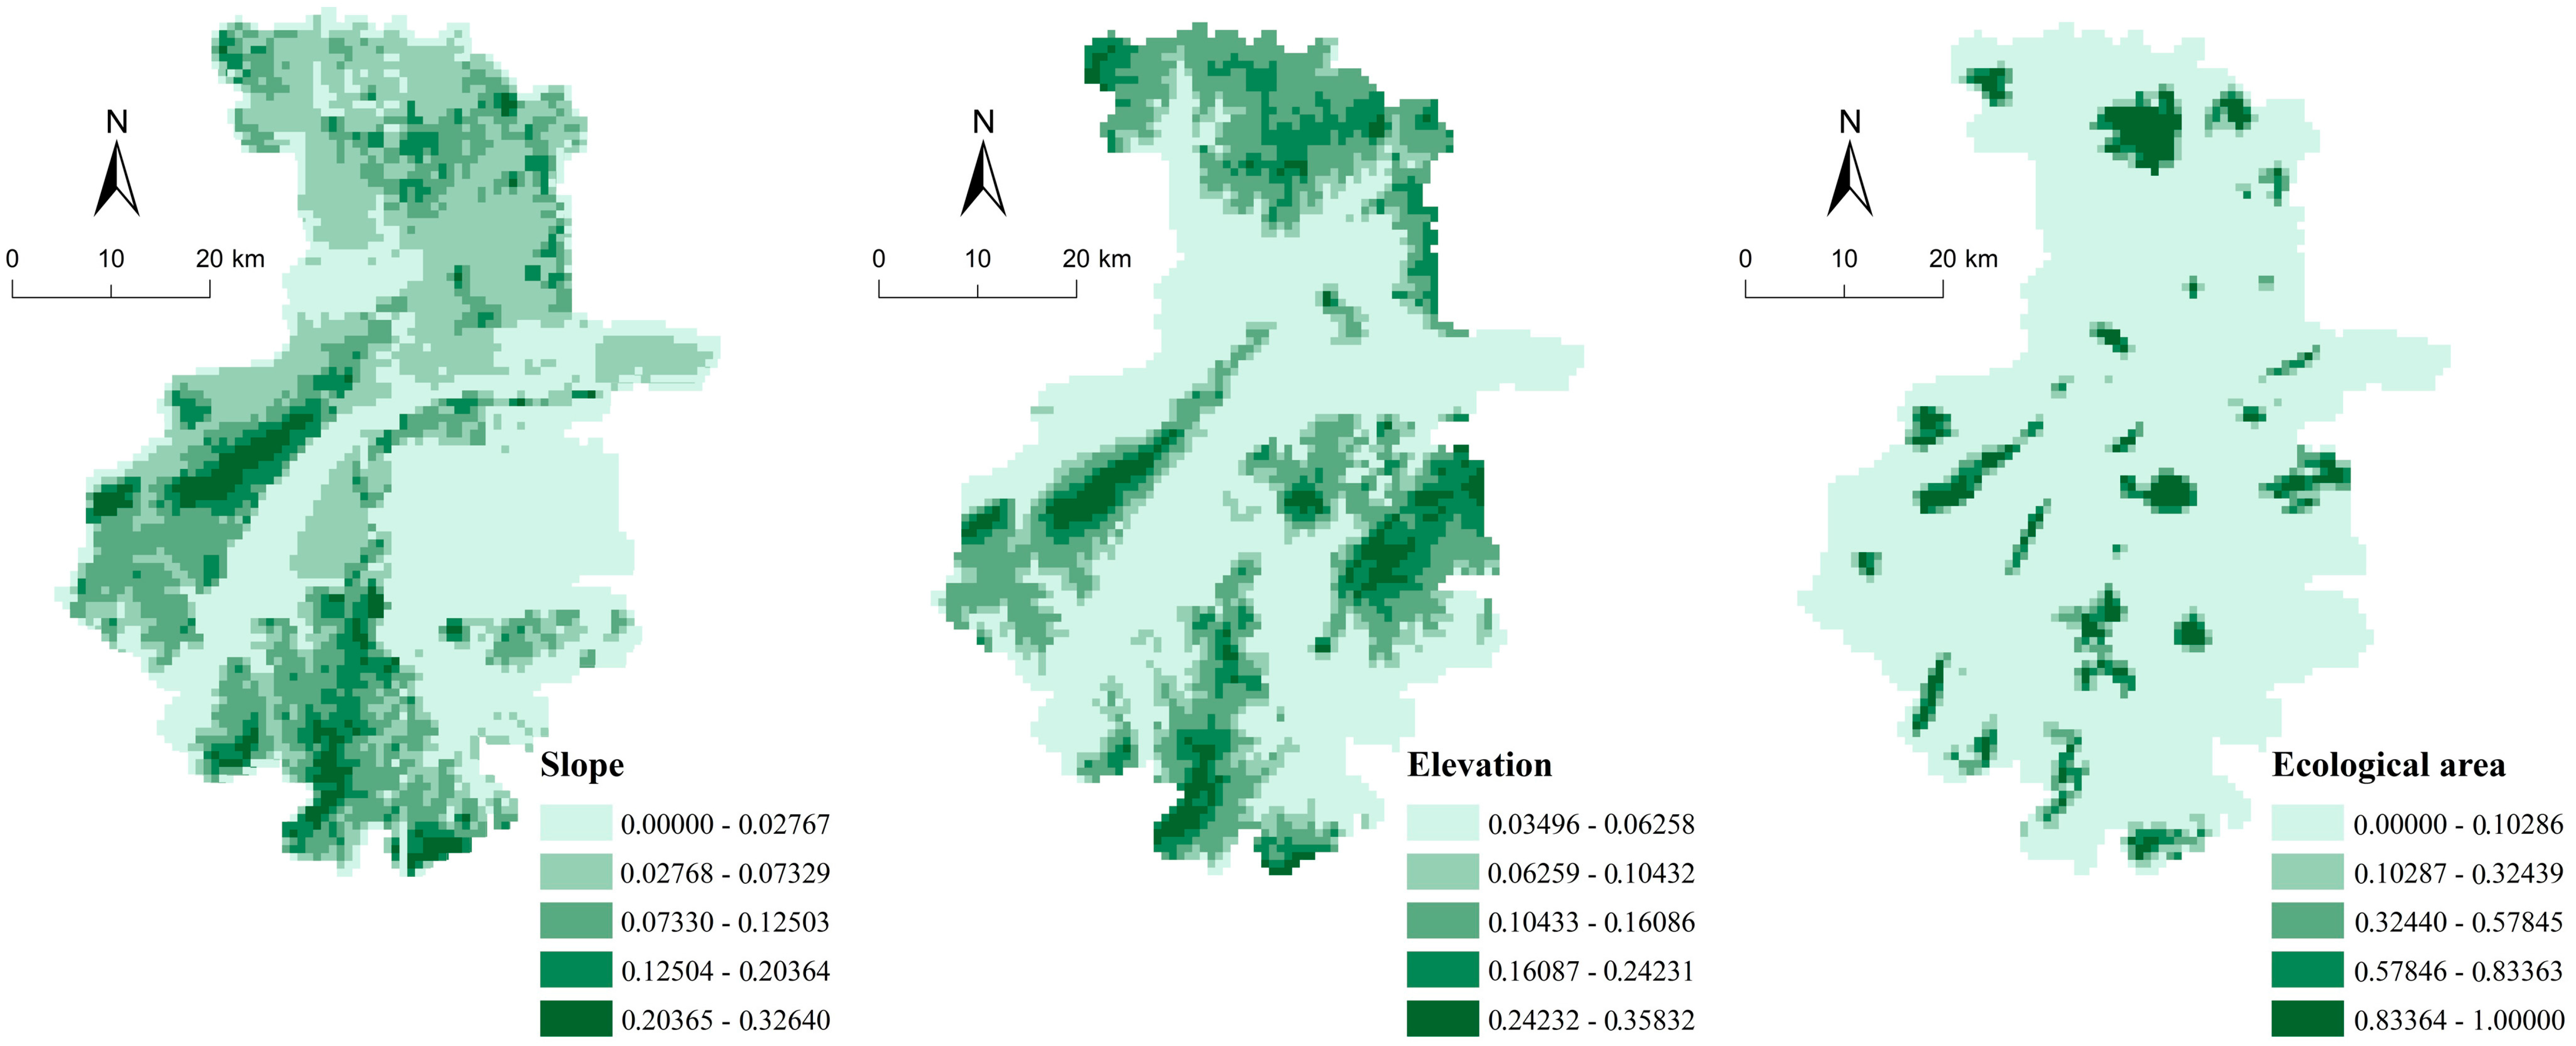
| Geology | EL | Average level of elevation. | Negative | |
| SL | Average level of slope. | Negative | ||
| Land use policy | ECO | Area of ecological protected areas at the beginning year. | Negative | |
| Test | 1995–2001 | 2001–2007 | 2007–2013 | ||||||
|---|---|---|---|---|---|---|---|---|---|
| Model 1 | Model 2 | Model 3 | Model 4 | Model 5 | Model 6 | Model 7 | Model 8 | Model 9 | |
| Moran’s I (error) | 77.78 | 77.07 | 78.37 | 71.83 | 72.02 | 71.98 | 32.82 | 32.45 | 32.57 |
| Lagrange Multiplier (lag) | 6011.62 | 5866.48 | 6093.48 | 3138.72 | 3160.13 | 5156.73 | 1059.47 | 1031.61 | 1040.13 |
| Robust LM (lag) | 112.04 | 94.19 | 115.07 | 35.45 | 37.63 | 139.92 | 15.25 | 14.14 | 14.79 |
| Lagrange Multiplier (error) | 5930.40 | 5812.12 | 6011.42 | 5054.09 | 5072.38 | 5066.17 | 1044.40 | 1018.05 | 1025.92 |
| Robust LM (error) | 30.82 | 39.83 | 33.01 | 150.81 | 149.88 | 49.36 | 0.18 * | 0.57 * | 0.58 * |
| LM (SARMA) | 6042.44 | 5906.31 | 6126.48 | 5189.53 | 5210.01 | 5206.09 | 1059.65 | 1032.19 | 1040.71 |
| Model Selected | SLM | SLM | SLM | SEM | SEM | SLM | SLM | SLM | SLM |
| Factors | Variables | 1995–2001 | 2001–2007 | 2007–2013 | ||||||
|---|---|---|---|---|---|---|---|---|---|---|
| Model 1 | Model 2 | Model 3 | Model 4 | Model 5 | Model 6 | Model 7 | Model 8 | Model 9 | ||
| Constant | 0.023 *** | 0.019 *** | −0.088 *** | 0.226 *** | 0.221 *** | 0.004 | 0.071 *** | 0.071 *** | 0.074 *** | |
| Economies of scale | UL | −0.088 *** | −0.087 *** | −0.088 *** | −0.124 *** | −0.125 *** | −0.121 *** | −0.002 | −0.003 | –0.003 |
| AL | 0.013 ** | 0.015 *** | 0.013 ** | 0.061 *** | 0.061 *** | 0.039 *** | 0.001 | 0.002 | 0.001 | |
| WB | −0.039 *** | −0.041 *** | −0.039 *** | −0.052 *** | −0.052 *** | −0.030 *** | −0.053 *** | −0.049 *** | –0.050 *** | |
| Agglomeration | Dis2NC | 0.007 | −0.005 | −0.007 | 0.119 | 0.093 | −0.001 | 0.011 | 0.009 | 0.009 |
| NCL | 0.053 *** | 0.052 *** | 0.053 *** | 0.026 * | 0.025 * | 0.107 *** | −0.023 | −0.025 * | –0.025 | |
| Urban plan | UP | 0.018 *** | 0.014 *** | 0.018 *** | 0.008 | 0.008 | 0.016 ** | 0.024 *** | 0.022 *** | 0.023 *** |
| Accessibility | Dis2CBD | −0.040 *** | - | - | −0.097 ** | - | - | −0.008 * | - | - |
| Dis2SUB | 0.002 | 0.013 | 0.024 | −0.325 *** | −0.344 *** | −0.001 | −0.023 ** | −0.012 | –0.020 ** | |
| Dis2DZ | 0.009 | 0.027 ** | 0.012 | −0.157 ** | −0.169 ** | −0.026 * | −0.084 *** | −0.083 *** | –0.080 *** | |
| Dis2HW | −0.024 ** | −0.027 *** | −0.033 *** | 0.054 | 0.015 | 0.011 | 0.034 ** | 0.042 *** | 0.040 *** | |
| Dis2RS | - | −0.084 *** | — | - | 0.029 | - | - | 0.007 | - | |
| Dis2AP | - | −0.028 *** | −0.023 *** | - | −0.031 | −0.007 | - | 0.019 | 0.014 | |
| Dis2RP | - | - | −0.033 *** | - | - | −0.026 | - | - | –0.020 | |
| Physical condition | EL | −0.008 | −0.006 | −0.010 | −0.053 | −0.049 | 0.024 | −0.008 | −0.013 | –0.010 |
| SL | 0.001 | 0.007 | 0.004 | 0.023 | 0.021 | 0.002 | −0.011 | −0.001 | –0.006 | |
| Land use policy | ECO | −0.015 ** | −0.015 ** | −0.014 ** | −0.014 | −0.013 | −0.002 | −0.015 *** | −0.015 *** | –0.015 *** |
| Weight_UE | 0.843 *** | 0.839 *** | 0.031 *** | 0.848 *** | 0.843 *** | 0.837 *** | 0.523 *** | 0.520 *** | 0.521 *** | |
| Akaike info criterion | −10,577 | −10,588 | −10,572 | −8722 | −8718 | −8694 | −6437 | −6437 | −6437 | |
| Number of Observations | 5106 | 5106 | 5106 | 5106 | 5106 | 5106 | 5106 | 5106 | 5106 | |
| Number of Variables | 13 | 14 | 14 | 13 | 14 | 14 | 13 | 14 | 14 | |
© 2016 by the authors; licensee MDPI, Basel, Switzerland. This article is an open access article distributed under the terms and conditions of the Creative Commons Attribution (CC-BY) license (http://creativecommons.org/licenses/by/4.0/).
Share and Cite
Chen, J.; Gao, J.; Yuan, F.; Wei, Y.D. Spatial Determinants of Urban Land Expansion in Globalizing Nanjing, China. Sustainability 2016, 8, 868. https://doi.org/10.3390/su8090868
Chen J, Gao J, Yuan F, Wei YD. Spatial Determinants of Urban Land Expansion in Globalizing Nanjing, China. Sustainability. 2016; 8(9):868. https://doi.org/10.3390/su8090868
Chicago/Turabian StyleChen, Jianglong, Jinlong Gao, Feng Yuan, and Yehua Dennis Wei. 2016. "Spatial Determinants of Urban Land Expansion in Globalizing Nanjing, China" Sustainability 8, no. 9: 868. https://doi.org/10.3390/su8090868