3.1. Evolution of CO2 Emissions
CO
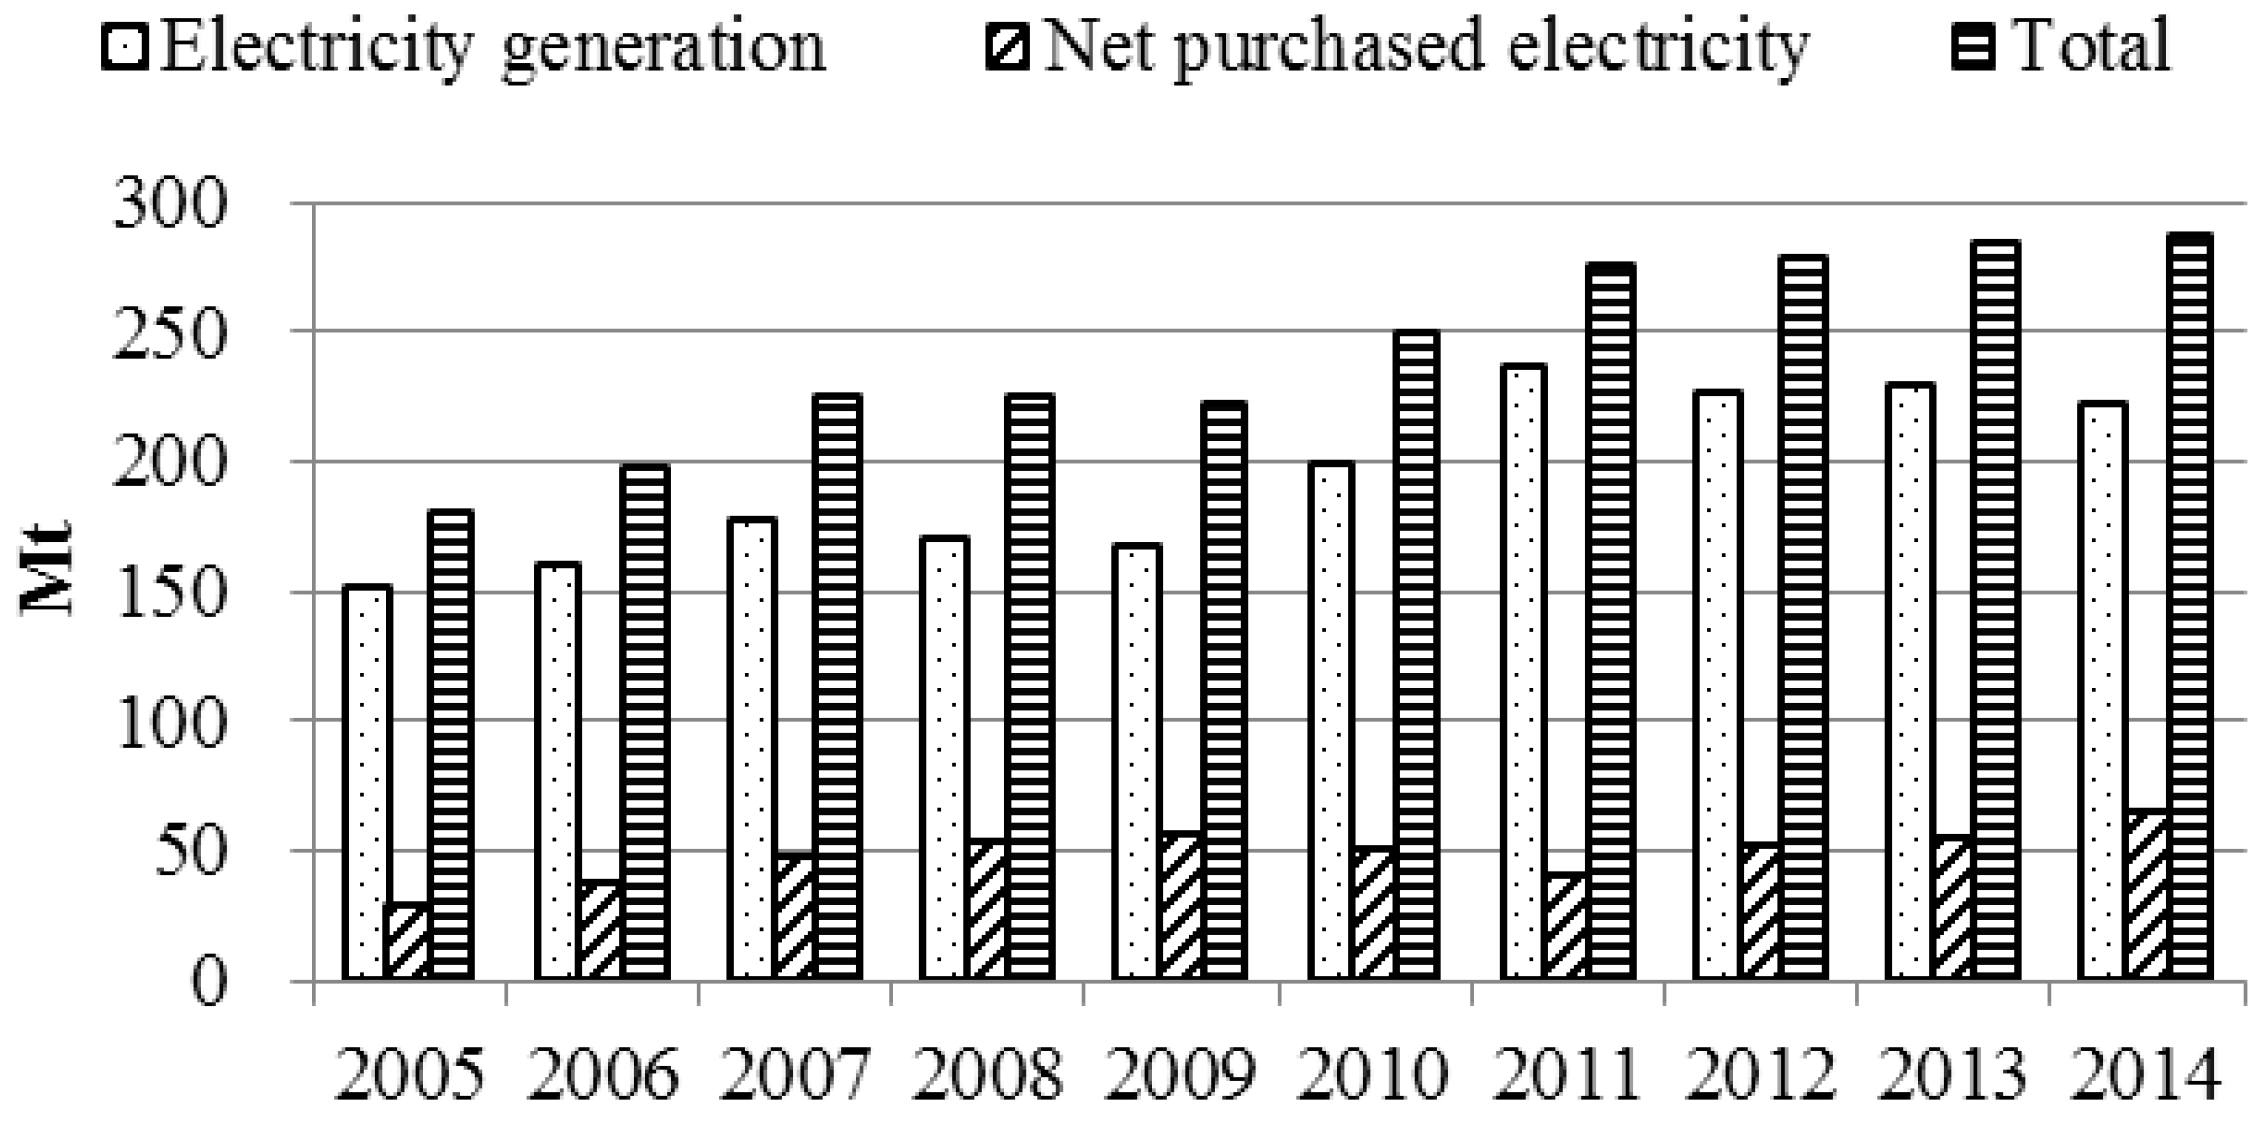
2 emissions resulting from the electricity consumption of GD province increased from 180.3 Mt in 2005 to 286.6 Mt in 2014, with an annual growth rate of 5.3%. As shown in
Figure 1, the CO
2 emissions’ growth rate widely fluctuated between 2005 and 2014. CO
2 emissions increased by 9.3%, 13.9%, 12.3%, and 10.5% in 2006, 2007, 2010, and 2011, respectively, while the growth rates were only 0.6%, 2.3%, and 0.9% in 2012, 2013, and 2014, respectively. CO
2 emissions decreased to 0.9% in 2009 and almost leveled those in 2008.
CO2 emissions resulting from electricity generation in the province accounted for 77.6% of the gross CO2 emissions from the electric power sector in 2014, which decreased to 6.8% compared to those from 2005. On the other hand, the net purchased share of electricity increased from 15.6% to 22.4% in the same period.
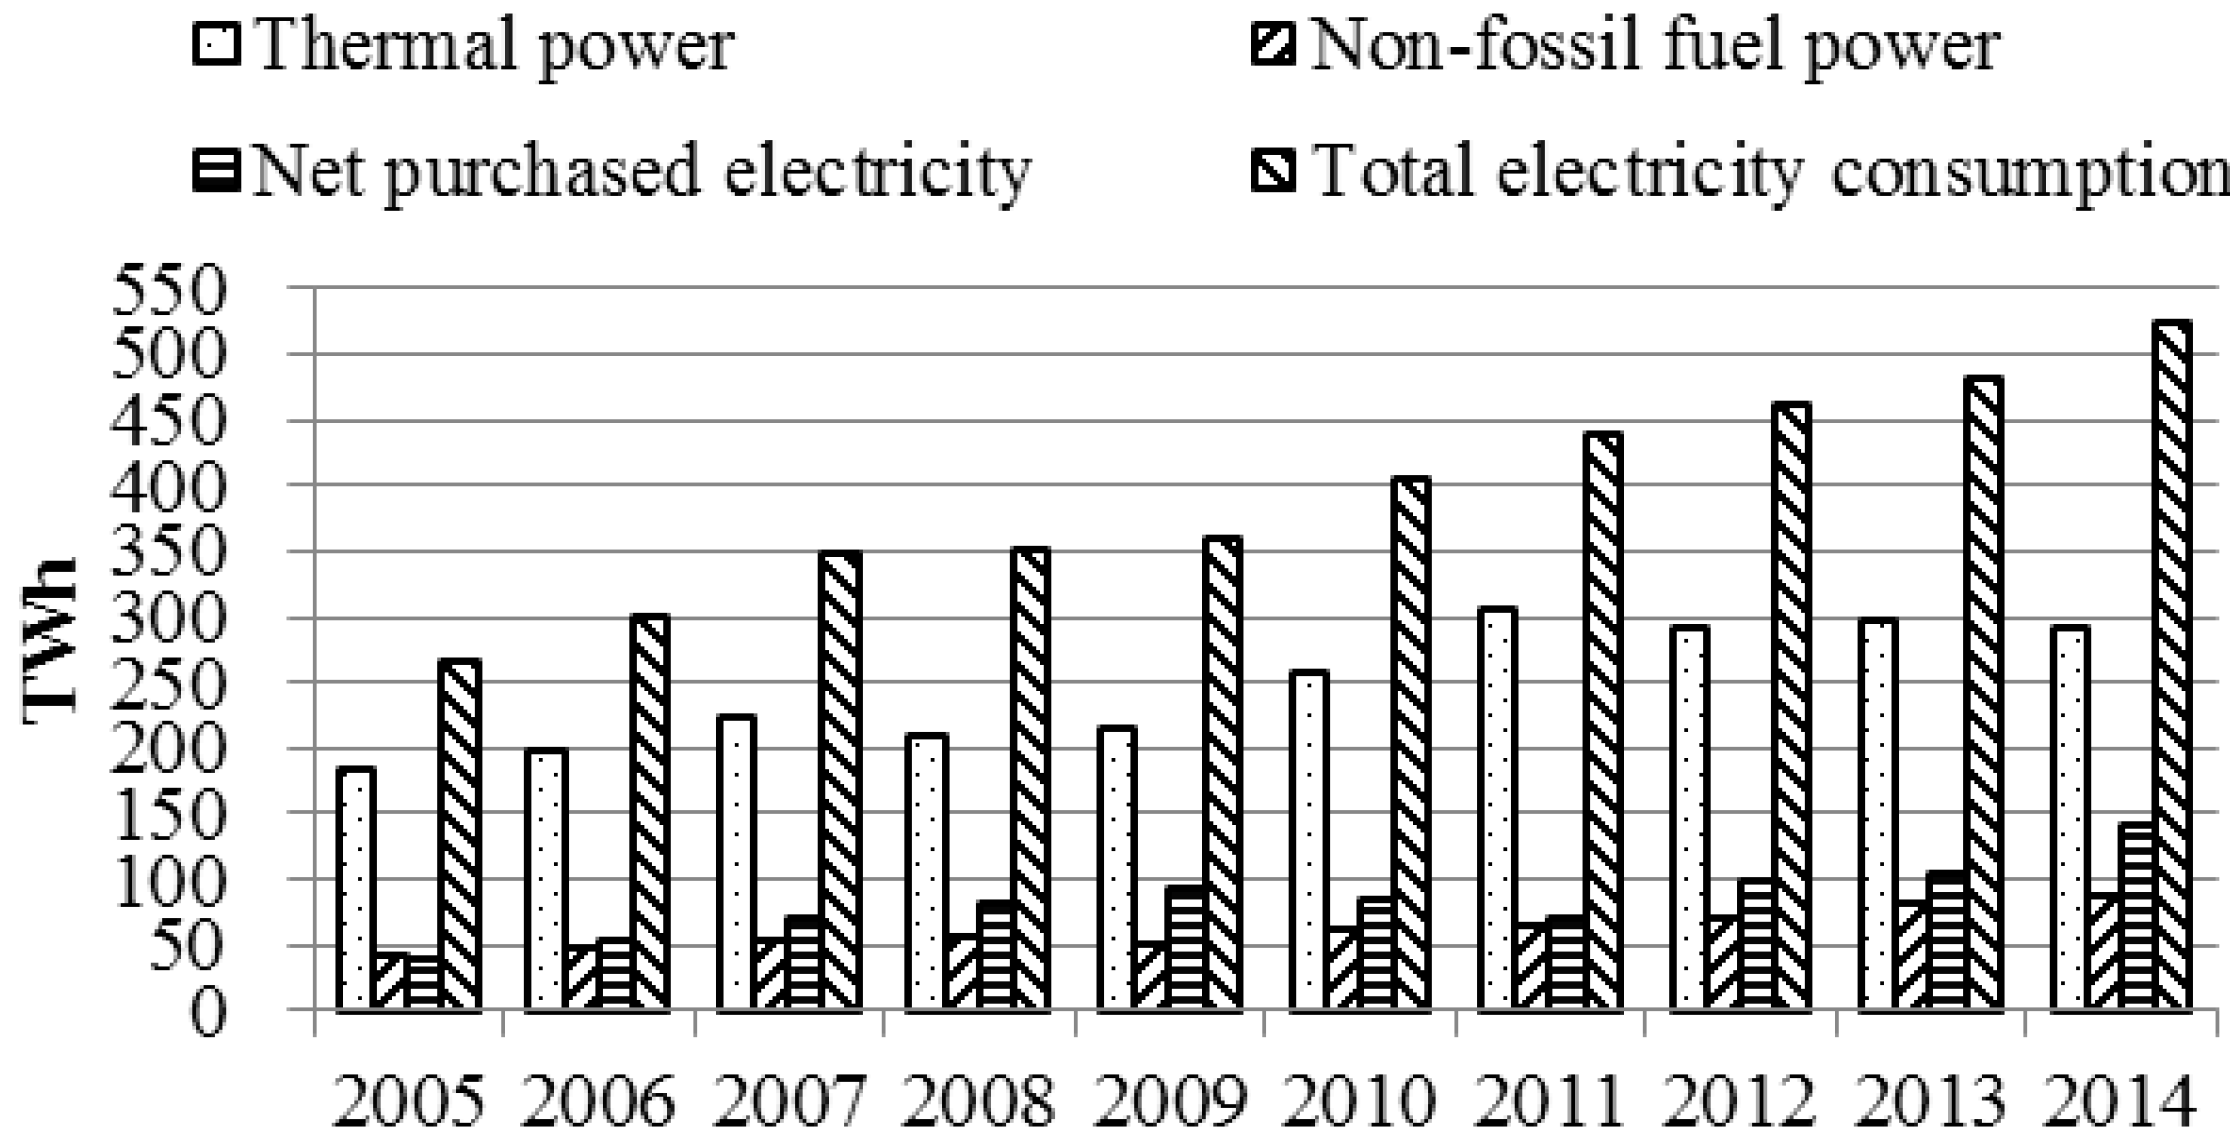
Figure 2 shows the supply mix of electricity consumed in GD between 2005 and 2014. The net purchased electricity was 142.9 TWh in 2014, which increased by 261% from 2005. In 2014, the non-fossil fuel power generation was 87.35 TWh, which has almost doubled in the past nine years. The fossil fuel power generation only increased by 59% during the past nine years, reaching 293.28 TWh in 2014. Currently, the west-to-east electricity is sold according to the on-grid benchmark power tariffs for coal-fired power plants, and the rapid increase in the net purchased electricity leads to a decrease in utilization hours of local coal-fired power, which decreases the tax revenue in GD, resulting in disputes about whether to significantly increase the west-to-east electricity between 2016 and 2020. Net purchased electricity plays an important role in the electricity supply of GD and a failure to account for its emissions might lead to erroneous results and wrong decisions [
26].
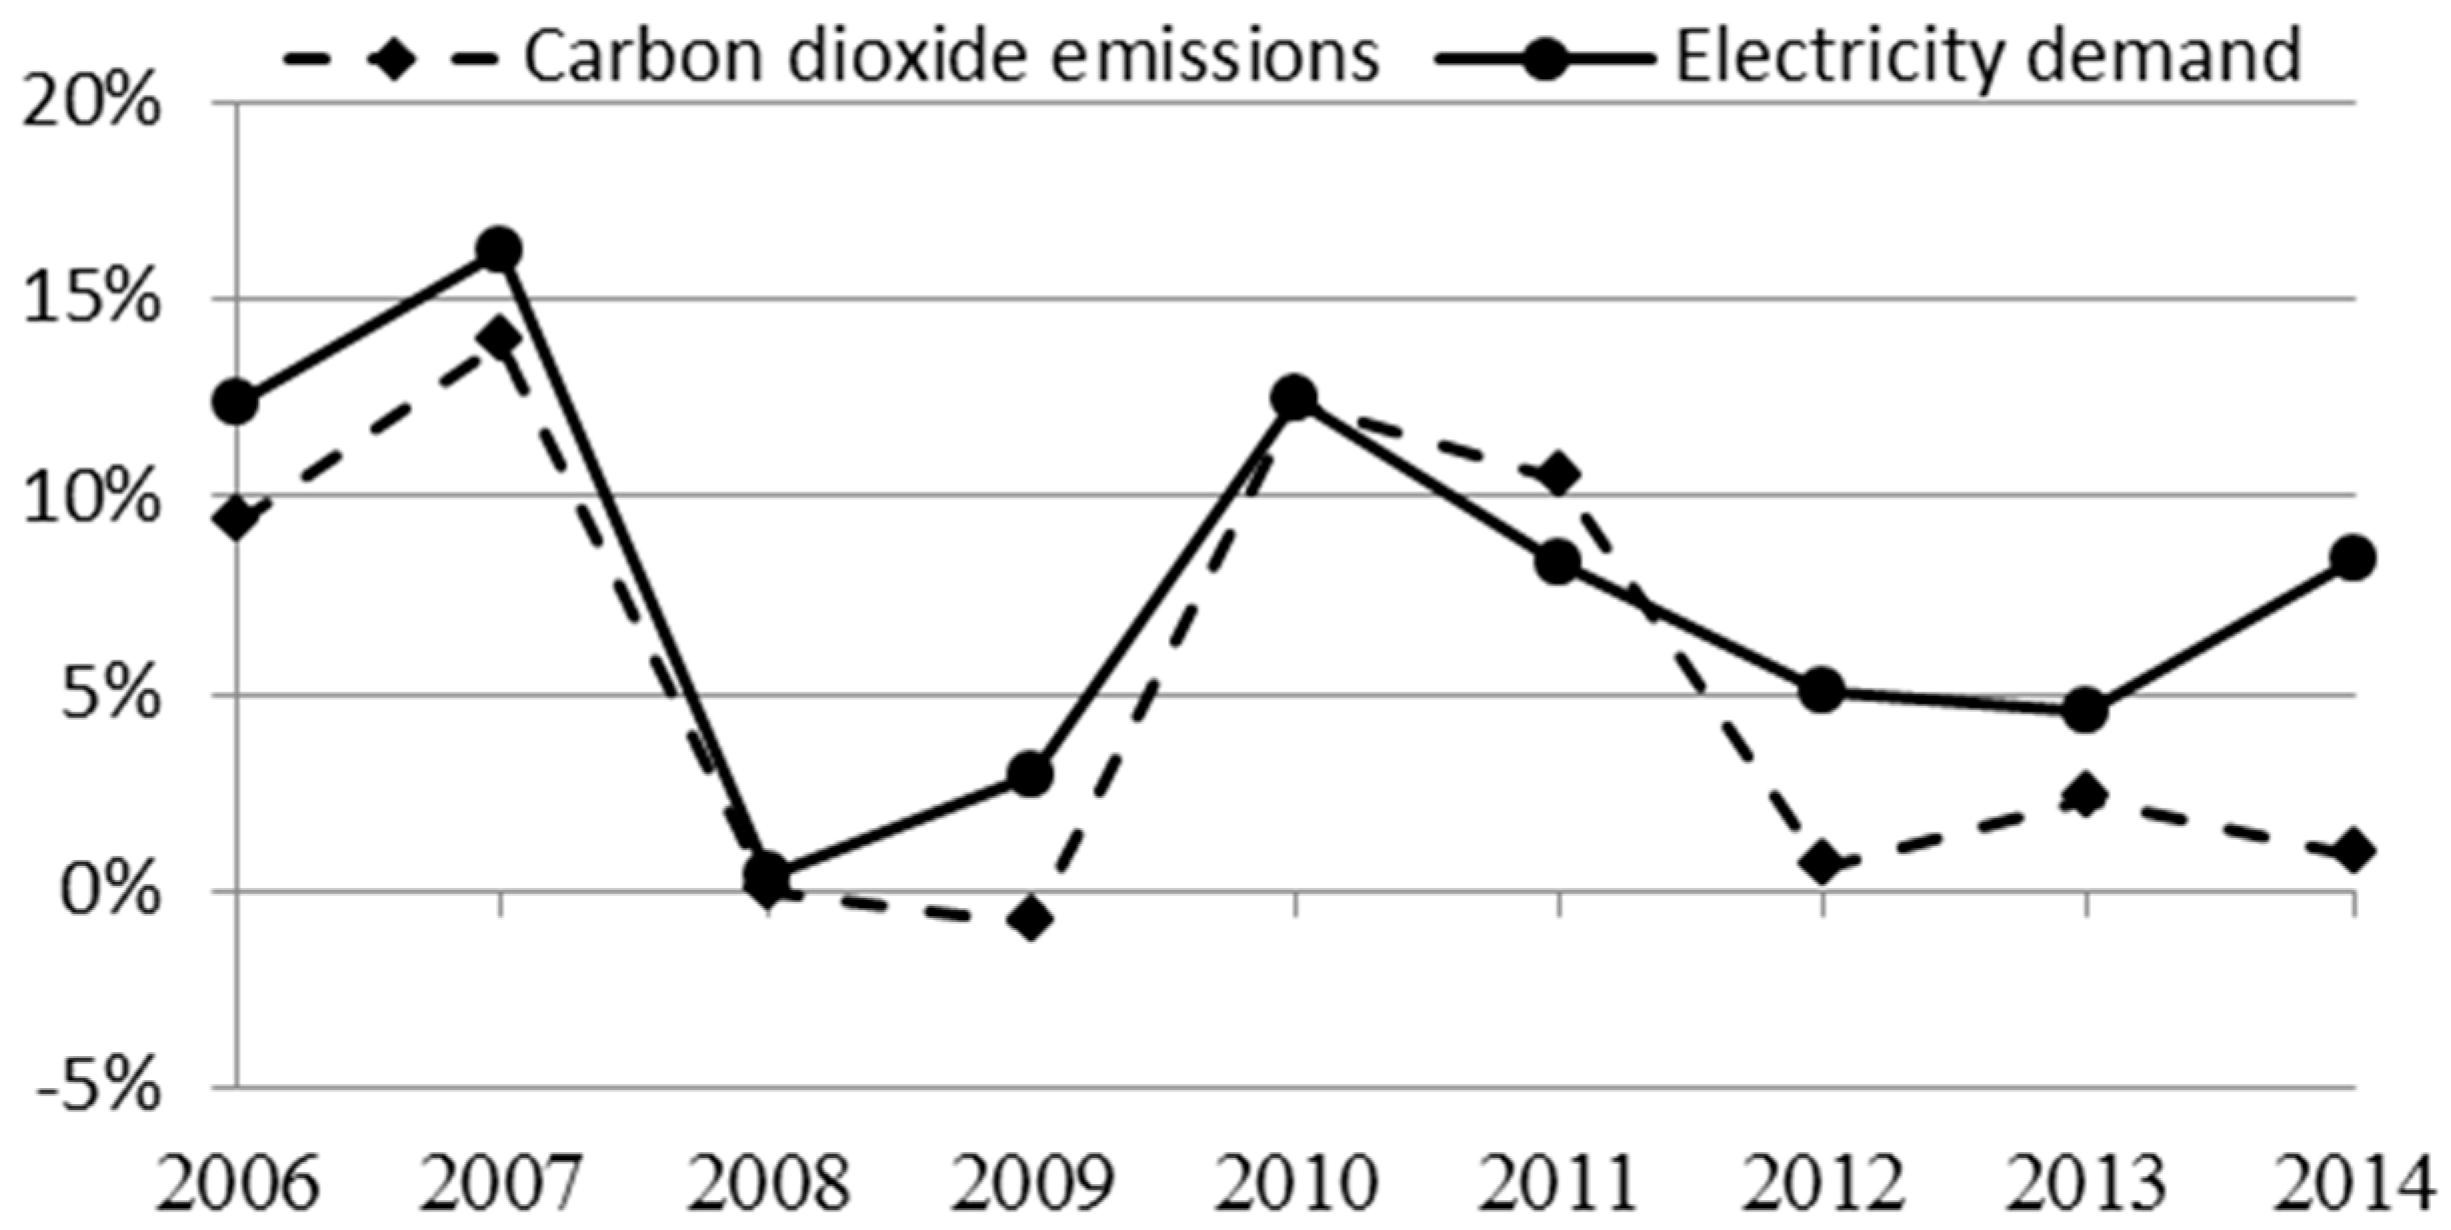
As shown in
Figure 3, a very close relationship and a relatively consistent trend between the rate of change of CO
2 emissions and electricity demand were observed between 2006 and 2014. However, despite the decrease of electricity demand growth rate, the rate of CO
2 emissions increased in 2013. On the other hand, a reverse situation occurred in 2014, and the distinction was more notable. Overall, the growth rate of CO
2 emissions was less than the electricity demand during the study period, revealing a reduction in the CO
2 intensity of electricity consumed in GD.
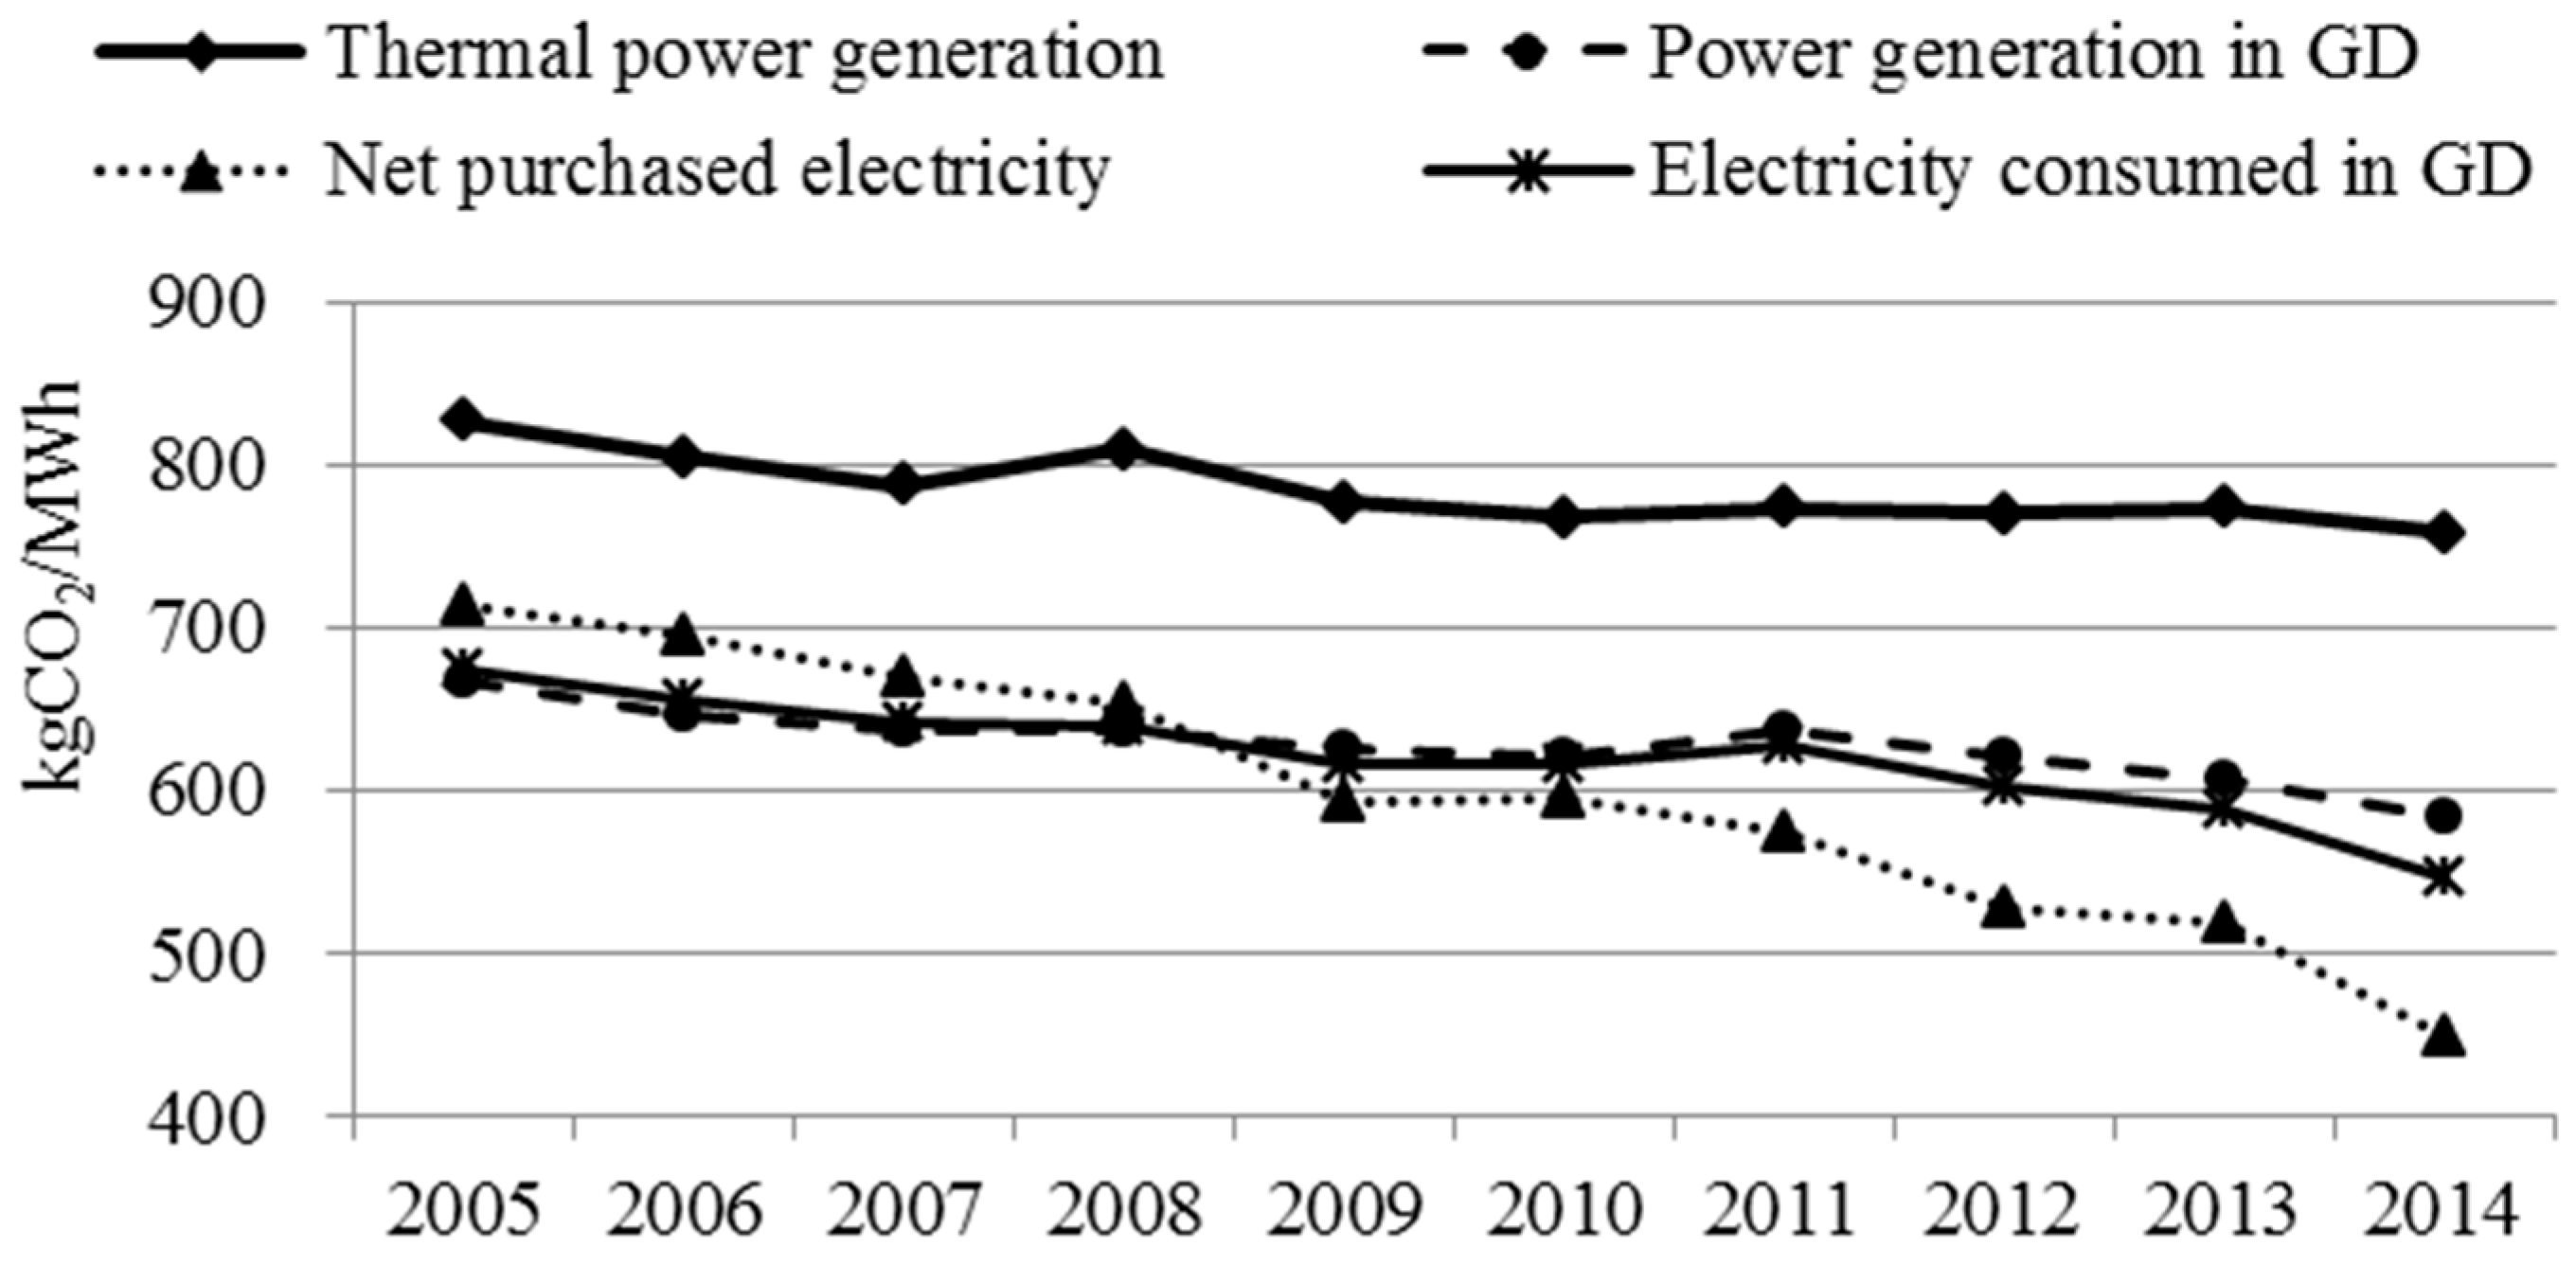
Figure 4 shows the CO
2 emission intensity of the electricity supply of GD. The CO
2 emission intensity of thermal power generation was 758.1 kg/MWh in 2014, which decreased by 8.3% compared to 2005. The CO
2 emission intensity of net purchased electricity was only 449.3 kg/MWh in 2014, which has decreased by 37.1% in the past nine years. Before 2009, the CO
2 emission intensity of net purchased electricity was greater than the electricity generated in GD, while the additional share of the net purchased electricity did not result in the abatement of CO
2 emission intensity of electricity supply in GD. Since 2009, the CO
2 emission intensity of net purchased electricity has declined more rapidly compared to the electricity generated in GD, which accelerated the reduction in CO
2 emission intensity of electricity supply in GD.
3.3. LMDI Decomposition Results
The GDP of GD increased from 2255.7 billion Yuan in 2005 to 5636.25 billion Yuan (calculated at constant prices in 2005) in 2014, with an annual average growth rate of 10.7%. As can be observed from
Table 2, the economy always contributed to the increase in CO
2 emissions during the study period. The accumulated effect resulted to nearly 216.7 Mt of CO
2 emissions in total emissions, which accounted for 204% of the total change in the absolute value.
As one of the results of efforts on energy efficiency made by the GD government, electricity intensity experienced a 21.6% decrease between 2005 and 2014. Nevertheless, electricity intensity still increased in some years, such as in 2007, 2010, and 2014, while the energy intensity of GD experienced a steady decline during the study period. The impact of decreasing electricity intensity on the reduction of total CO2 emissions reached 57.87 Mt, accounting for 54% of the reduction of total CO2 emissions over the whole periods of 2005 and 2014. Notably, the growth of electricity intensity in 2007 and 2010 was accompanied with high economic growth rate, boosted by the strong expansion of energy-intensive industries. On the other hand, the electricity intensity increase in 2014 occurred with a low economic growth.
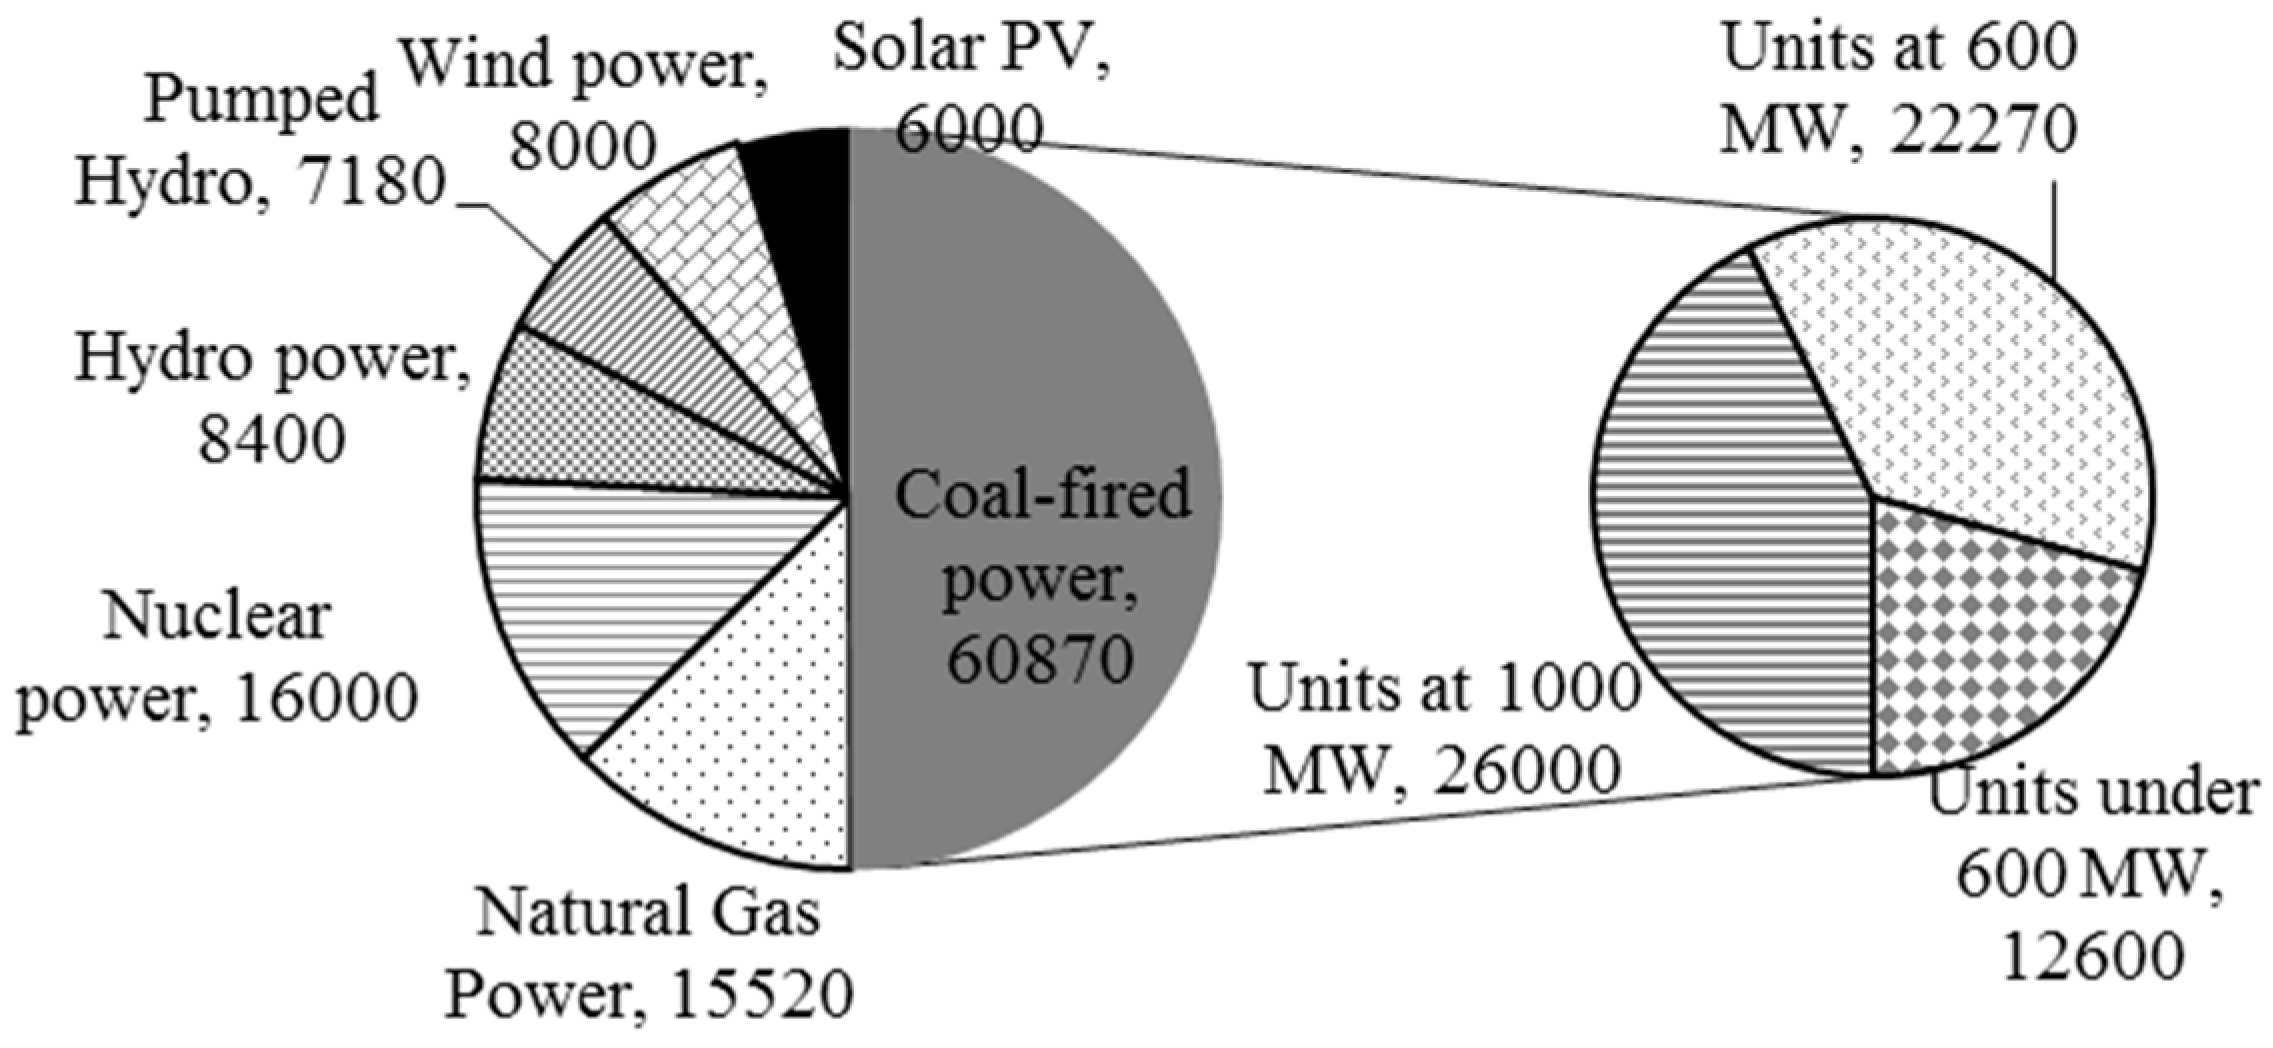
The gross coal consumption rate of thermal power generation declined from 339.2 gce/kWh in 2005 to 310.8 gce/kWh in 2014. Improvements of thermal power efficiency reduced the CO2 emissions in most of the years except in 2008. The impact of the improved gross coal consumption rate of thermal power generation led to the reduction of CO2 emissions by 19.97 Mt, accounting for 19% of the reduction in the total CO2 emissions over the whole periods of 2005 and 2014. The efficiency improvement of thermal power is attributed to a combination of factors, such as the substitution of small-sized inefficient plants with new high-profile high-efficiency generation plants, as well as innovation with efficient technologies. Currently, the 1000 and 600 MW capacities per power facility accounted for 59.8% of the coal-fired installed capacity, while none of them were in operation in 2005. Another factor leading to the thermal efficiency improvement is the use of combined cycle gas turbine (CCGT) plants. In 2014, the capacity of the installed CCGT was 14,266 MW, whereas the 13,450 MW oil-fired power plants in 2005 were completely shut down in 2014.
Although the emission coefficient effect decreased the CO
2 emissions only in 2007, 2009, 2012, and 2014, its effect in absolute value was relatively high (as can be observed in
Table 3). The accumulated effect resulted in the decrease of nearly 18.49 Mt of CO
2 emissions, accounting for 18% of the total change in the absolute value. Despite slight fluctuation in the CO
2 emission coefficient of thermal power fuel during the study period, the CO
2 emission coefficient of net purchased electricity sharply decreased from 2.1 tCO
2/tce in 2005 to 1.45 tCO
2/tce in 2014, mainly due to the increased share of non-fossil fuel electricity of the south power grid (such as large capacity hydropower and nuclear power put into operation).
With the decreased share of thermal power electricity, the supply mix effect played a positive role in the reduction of CO
2 emissions. The growth rate of CO
2 emissions of net purchased electricity was significantly greater than those of thermal power and non-fossil fuel power during the same period.
Figure 3 shows the electricity supply structure of GD. With the rapid growth of electricity demand as well as the dry weather (abatement in hydropower generation), the share of generated thermal power increased in 2010 and 2011, simultaneously increasing the CO
2 emissions. The CO
2 emission intensity from the generated thermal power was greater than that from net purchased electricity, while the non-fossil electricity was constant at zero. Overall, the effect of electricity supply structure accumulated (period-wise) a decrease of 11.24 Mt, accounting for 10.6% of the change in total CO
2 emissions in the absolute value. The electricity supply mix did not always result in the reduction of CO
2 emissions during the study period, implying that the net purchased electricity also did not reduce the CO
2 emissions as presumed.


