1. Introduction
Energy industry is a crucial part of the economy and has a significant strategic position in economic growth. In China, there is an additional urgent problem in terms of how to achieve performance growth for China’s energy industry under the dual pressures of energy security and global warming. To solve this problem, the Chinese government has taken a series of actions including carrying out the Europe–China dialog on energy issues, proposing China’s energy policy, and China’s Go Global policy [
1]. Due to the combined effects of these actions, foreign direct investment (FDI) is attracting more attention and has been an important measure for regional energy integration between China and Europe.
Renewable energy sources, such as wind, solar, geothermal, tide, etc., have the advantages of being carbon-neutral and non-depletable [
2], which is why the utilization of renewable energy is considered a crucial step towards the achievement of sustainable development [
3,
4,
5]. Thus, renewable energy investments have been the subject of intensive studies, and research interest has been growing over years. The recently proposed “One Belt, One Road” (i.e., “New Silk Road Economic Belt” and “21st Century Maritime Silk Road”, an idea and initiative for cooperation development) strategy further promotes renewable energy industry development in China. This new strategy encourages the connectivity and cooperation among countries in terms of renewable energy. FDI in renewable energy takes an active response to this strategy. It improves technological capability and promotes the performance growth of energy industry [
6,
7,
8,
9,
10,
11,
12].
This paper investigates the impacts of FDI renewable energy technology spillover (i.e., the technology spillover effect by introducing FDI in renewable energy industry) on energy industry (mainly includes coal mining and washing industry; petroleum and natural gas extraction industry; petroleum processing, coking, nucleus fuel processing industry; electric power, heat power production and supply industry; gas production and distribution industry; and the water production and distribution industry) performance in China. Three hypotheses are proposed and argue that FDI renewable energy technology spillover has positive impacts on multiple aspects of energy industry performance, including economic, environmental, and innovative performance. A regression model is therefore proposed to describe the relationship between FDI renewable energy technology spillover and energy industry performance in China with respect to economic, environmental, and innovative aspects. Numerical techniques including factor analysis and data envelopment analysis (DEA) are then employed to acquire the values of FDI renewable energy technology spillover and energy industry performance in China, respectively. Moreover, the panel data regression is utilized to evaluate the coefficient factor which is used to illustrate the impacts. Statistic data on the energy industries of 30 different provinces in China are utilized in the regression model.
The key findings of this paper could be summarized as follows: (1) a theoretical model is proposed to quantify the impacts of FDI renewable energy technology spillover on energy industry performance. It can be seen that FDI renewable energy technology spillover has positive impacts on China’s energy industry performance, with the overall quantitative impacts being significant at 1% confidence level; (2) the regions more developed in economy and technology have greater factor scores of FDI technology spillover, which means that their technology spillover effects are more obvious. For successful economic planning, the proposed model provides a useful tool and complementary experiences for policymakers in making reasonable decisions for FDI technology spillover in different areas of China.
The remainder of the paper is organized as follows.
Section 2 provides an overview of previous studies on FDI technology spillover and energy industry performance, followed by
Section 3 in which the study hypotheses and theoretical models are proposed.
Section 4 introduces the methodology and data.
Section 5 presents the numerical results and discussions.
Section 6 concludes with the major findings from the methods and their policy implications.
2. Literature Review
2.1. FDI Technology Spillover
Previous studies on FDI technology spillover have largely focused on its impact on economic growth and total factor productivity. Seck [
13], Ouyang and Fu [
14] and Bai et al. [
15] found that technology spillover is proportional to the regional economic growth. As a critical factor of national economy, the FDI technology spillover in the energy industry has been studied in the literatures. Lin et al. [
16] investigated price and volatility spillover effects on crude oil and natural gas markets. In addition to traditional fossil energy sectors, the relationship between FDI, renewable energy and economic growth are also investigated [
17,
18]. Magnani and Vaona [
19] demonstrated that renewable energy spillover has a positive impact on regional economic growth in Italy. Kathuria et al. [
20] applied panel data techniques to investigate the impact of the policy differences on FDI inflow in wind energy. The results showed that the differences have significant resource potential over a seven-year period based on empirical research in eight Indian states. Lv and Spigarelli [
21] considered FDI as a measure of regional integration of Chinese and European renewable energy sectors. Lee [
22] investigated the contributions of FDI net inflows to renewable energy, carbon emissions and economic growth. The results demonstrated that FDI is critical for economic growth. Hassaballa [
23] studied the interrelation between FDI inflows and emissions in developing countries. Ming et al. [
24] put forward feasible proposals for renewable energy investment and financing issue solutions.
2.2. Technology Spillover Effects
In order to quantify the influences of FDI technology spillover, three influencing factors, foreign capital investment, product import, and brand effect were investigated. Lai et al. [
25] analyzed the impact of human capital investment and degree of openness of the host country on technology spillovers. Ha et al. [
26] proposed an improved model to describe both horizontal and vertical spillover effects by measuring the share of R&D expenditures. Du et al. [
27] explored the effect of industrial policy on FDI spillovers considering subsidized and non-subsidized foreign investment, from the perspective of the magnitude and direction. Foreign capital investment is considered as the main aspect of technology spillover to investigate the technology spillover in Iran [
28]. Ramiro and Enrica estimated technology spillover effect from a view of machinery and equipment (M&E) imports [
29]. Lai et al. [
30] demonstrated the crucial role of technology absorption capacity on technology spillover effects and brand effect was deemed as the major element of technology spillover in their research. By assessing the impacts of product imports on total factor productivity, Lee et al. [
31] found positive impacts of FDI on less developed countries and more prevalent impacts on developed countries. In this paper, we focus on three aspects of FDI renewable energy technology spillover: foreign capital investment, product import and brand effect.
2.3. Energy Industry Performance
Since performance is a critical index in evaluating the development level of the energy industry [
32,
33], it is necessary to study the impact of FDI on the energy industry performance. However, few studies have been conducted in this area. In terms of energy industry performance, Chen et al. [
34] considered the relationship among economic, environmental and innovative performances in green technological innovation auditing. Severo et al. [
35] proposed a hypothesis that environmental sustainability is positively related to organizational performance and verified this hypothesis through empirical study. Zhao et al. considered the economic performance of waste-to-energy industry in China [
36]. Wang and Zhao investigated regional energy-environmental performance for China’s non-ferrous metals industry based DEA model [
37]. Chen et al. analyzed how external technology sources influenced the innovative performance of Chinese firms [
38]. By introducing the three elements (i.e., economic performance, environmental performance and innovative performance) into energy industry performance, this paper aims to fill the current knowledge gap and investigate the impacts of FDI renewable energy technology spillover on performance in China.
FDI technology spillover and renewable energy have been the subjects of intensive studies, and interests in these topics have been growing over recent years. These previous studies make an important contribution to our study. On the basis of a literature review, it can be found that the study on FDI renewable energy technology spillover is very necessary and there is large research space for this study. Therefore, building on previous studies, this paper investigates the impact of FDI renewable energy technology spillover on China’s energy industry performance.
3. Hypotheses and Theoretical Model
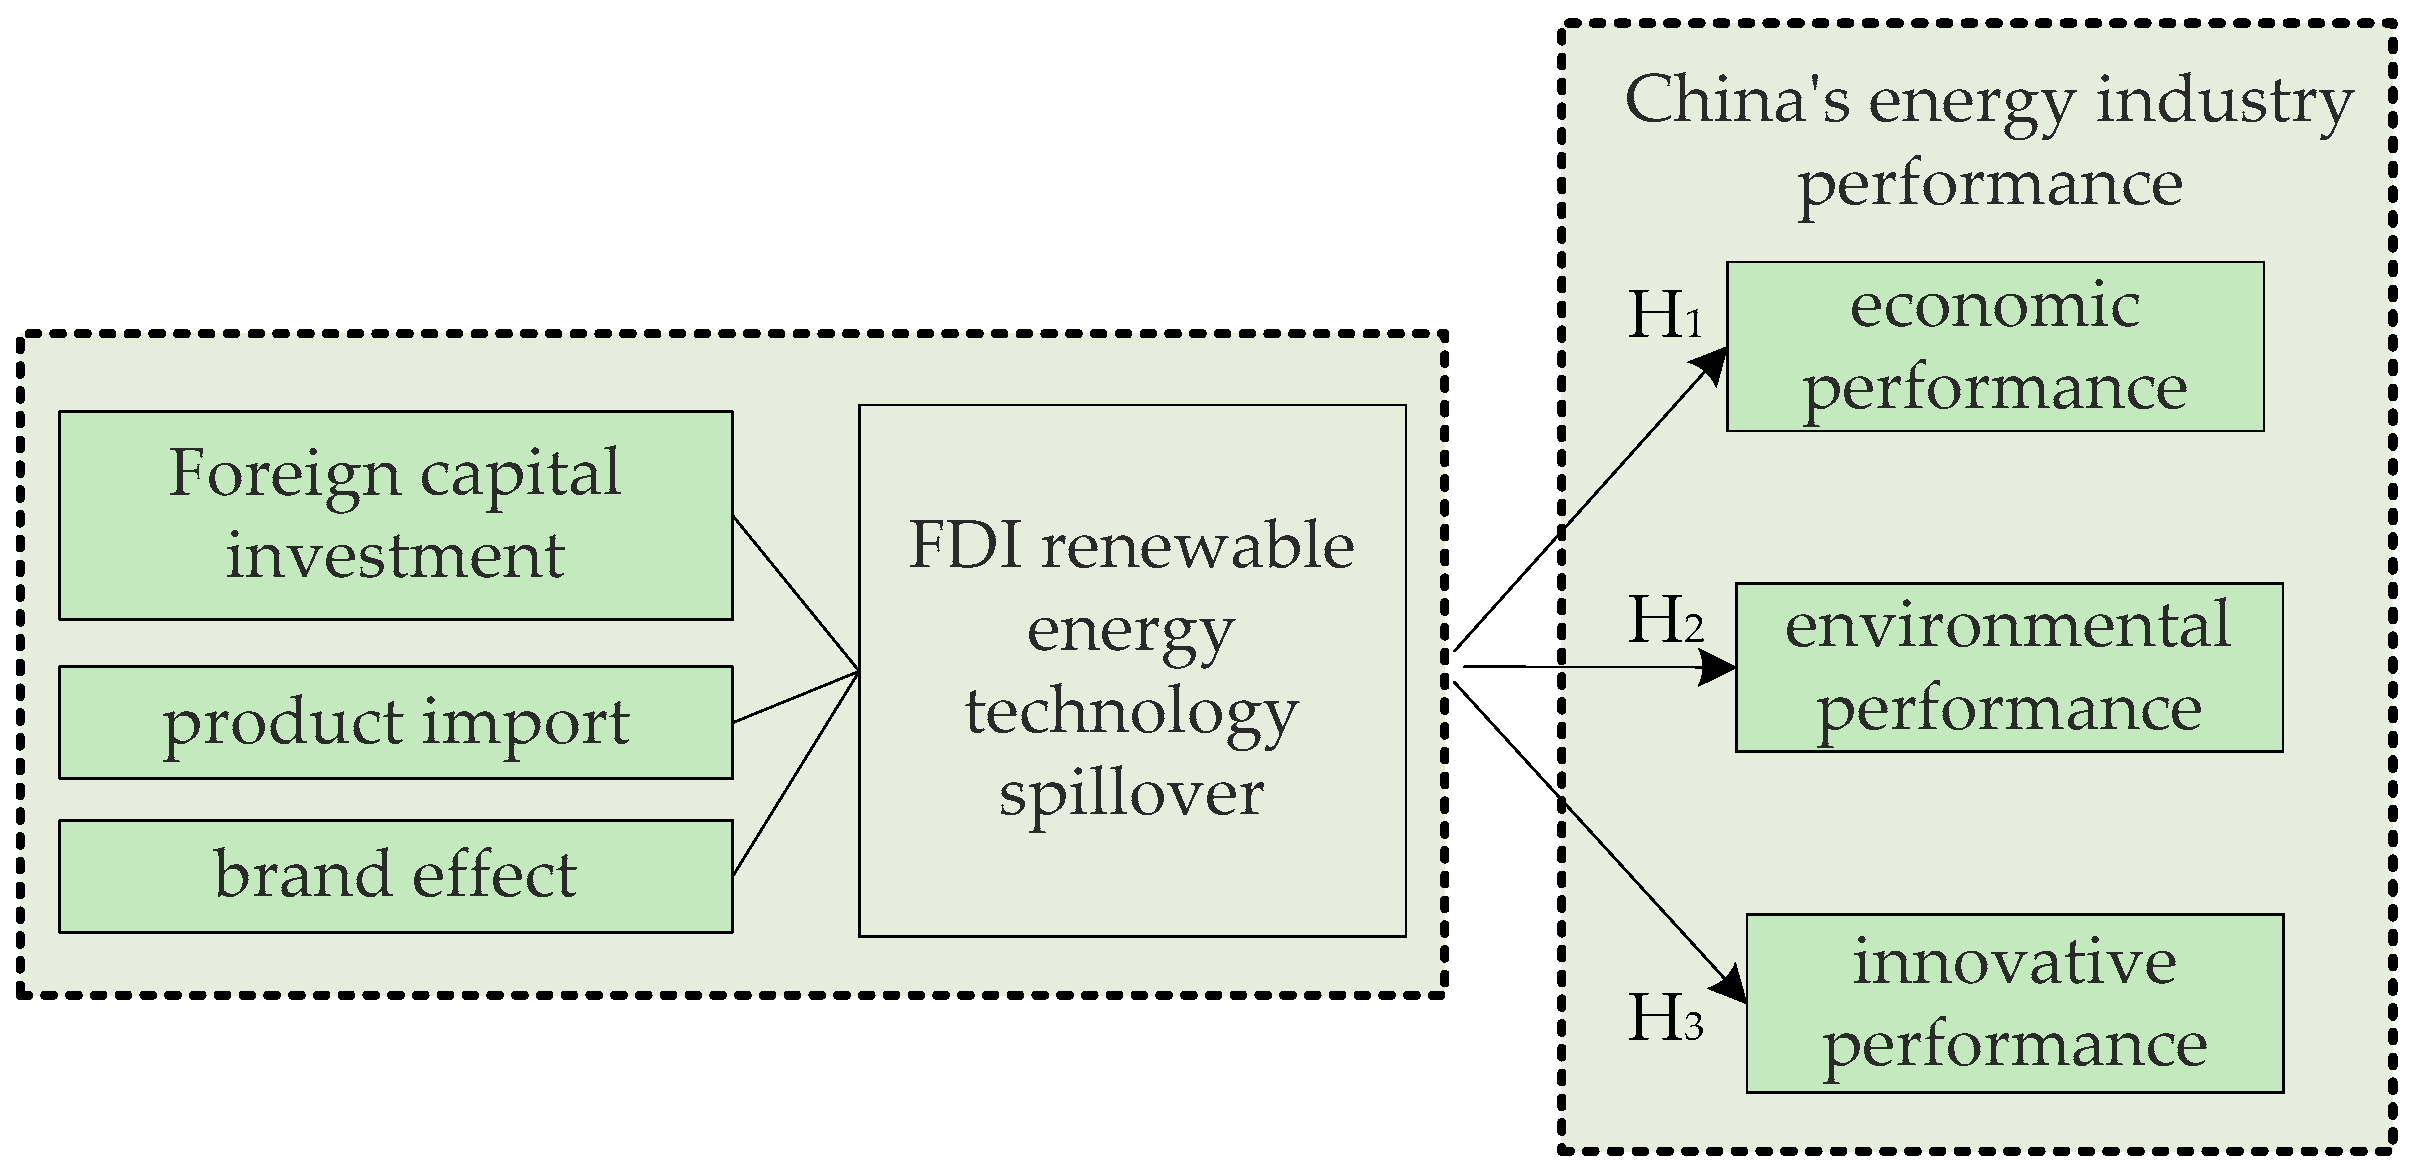
Based on a review of existing studies, the influencing factors of technology spillover are identified, i.e., foreign capital investment, product import and brand effect. Meanwhile, energy industry performance in China is characterized into economic performance, environmental performance and innovative performance. This section investigates how FDI renewable energy technology spillover influences energy industry performance in China.
3.1. The Impacts of Technology Spillover on Economic Performance
3.1.1. Foreign Capital Investment
Foreign capital investment helps to increase the capital stock of energy industry in China, provides funds for the expansion of production scale, the improvement of infrastructure as well as the promoting of workforce level. It thereby promotes the progress of productivity and helps to achieve an increase in economic performance.
3.1.2. Product Import
Chen and Dong [
39] claimed that import trade has a positive significant impact on economic development. Chen et al. [
40] found a significantly positive correlation between product import and economic growth by analyzing the panel data of China. China’s energy industry benefits from energy product import and successfully acquires advanced overseas energy production materials and end products. The utilization of foreign renewable energy products decreases the cost of production, increases the rate of finished products and production efficiency, and thereby improves the economic performance.
3.1.3. Brand Effect
The expansion of brand effect (i.e., the increase of company registration from overseas renewable energy enterprises) is likely to capture the market shares of energy companies in China. In such a situation, the domestic energy companies are forced to seek technical breakthroughs to face market competition. Meanwhile, the landing of global energy companies initiates cooperation and communication with local energy enterprises, which will expand technology spillover channel and promote economic growth of energy industry in China.
According to the aforementioned analysis, this study proposes Hypothesis 1:
H1: FDI renewable energy technology spillover has a positive impact on economic performance of energy industry in China.
3.2. The Impacts of Technology Spillover on Environmental Performance
3.2.1. Foreign Capital Investment
Foreign capital investment used for renewable energy technology will increase the investment of environmental protection, such as the new equipment installation of waste water and solid and the development of production process for low energy consumption and emission. Huang et al. confirmed that FDI from Hong Kong, Macau and Taiwan has a significantly promoting role on environmental outcomes [
41]. Researchers also evaluated the environment performance and concluded that FDI, especially the technology-seeking investment, has a positive impact on China’s environment [
42]. In conclusion, foreign capital investment for renewable energy technology will effectively increase the environmental performance of China’s energy industry.
3.2.2. Product Import
On the one hand, renewable energy products promote the sustainable development of China’s energy industry and product import further enhances the positive situation. On the other hand, the importing of advanced overseas renewable energy may indirectly improve the learning ability of local energy companies, accelerate the R&D of energy products, and also directly promote the utilization of advanced devices and equipment for renewable energy production. Both of these are promising to reduce CO2 emission, sewerage drainage, and energy consumption, and are further improving the environmental performance of China’s energy industry.
3.2.3. Brand Effect
The registration of overseas companies will expand technology spillover channels of renewable energy through correlation effect, cooperation and competition. It also helps China’s energy industry to master the advanced production technology and management methods, and hereby improves environmental performance of energy industry in China via production process and management system.
According to the aforementioned analysis, this study proposes Hypothesis 2:
H2: FDI renewable energy technology spillover has a positive impact on environmental performance of energy industry in China.
3.3. The Impacts of Technology Spillover on Innovative Performance
3.3.1. Foreign Capital Investment
The level of technological innovation is positively affected by the amount, type and mode of FDI. More specifically, foreign capital investment provides extra funds for sustainable R&D of new product and process, therefore increases R&D technological funds and personnel, so as to promote innovative development of energy industry. Meanwhile, the improvement of science and technology also enhances the technology absorption capacity of China’s energy industry and further attracts more special investment from overseas focusing on renewable energy technology innovation. This would form a virtuous circle and continuously improve the innovative performance.
3.3.2. Product Import
Product import provides chances for the energy industry of China to approach advanced raw materials, production devices and end products of renewable energy. Through imitation learning and financial support from the innovation funds, the innovative ability of China’s energy industry will be significantly improved [
43]. Renewable energy product and production technology adopted to China could be developed by acquiring the latest technology and combining China’s local situation, and therefore promote innovative performance.
3.3.3. Brand Effect
The entry of overseas renewable energy enterprises will improve market concentration and intensify market competition. It also urges China’s energy industry to actively develop new products and process, and improve production efficiency in order to achieve fast development of productivity. Meanwhile, transnational energy enterprises bring potential cooperation opportunities with Chinese companies. Through technical communication and project cooperation, Chinese energy enterprises gain new knowledge and technology so as to update current knowledge system and improve technology level. In the process of cooperating and competing with overseas energy companies, the innovative capability of China’s energy industry will be improved continuously.
According to the aforementioned analysis, this study proposes Hypothesis 3:
H3: FDI renewable energy technology spillover has a positive impact on innovative performance of energy industry in China.
On the basis of previous studies, theoretical analysis and hypotheses, a theoretical model is proposed, as shown in
Figure 1.
4. Methodology
4.1. Mathematical Model
Factor scores are estimated values in factor analysis. The scores are used to examine the behavior of observations and in other analyses such as regression or MANOVA. DEA is a nonparametric approach in operation research and economics for production frontiers estimation. It is utilized to empirically assess productive efficiency of decision making units and also acts as a classical and common tool to measure performance [
44,
45,
46,
47]. This paper first applies the factor analysis method to calculate the factor scores of FDI renewable energy technology spillover, and adopts DEA method to obtain energy industry performance in China. The influence coefficients between FDI renewable energy technology spillover and three performances of energy industry are then acquired utilizing the panel data regression analysis method, where a fixed effect variable intercept model is established to analyze the effects of FDI renewable energy technology spillover on energy industry performance in China. Specific models are shown as Equations (1)–(3).
Model 1: Impact model of FDI renewable energy technology spillover on economic performance of energy industry in China,
Model 2: Impact model of FDI renewable energy technology spillover on environmental performance of energy industry in China,
Model 3: Impact model of FDI renewable energy technology spillover on innovative performance of energy industry in China,
where
i and
t denote region and year respectively. Besides,
is intercept and
is regression coefficient.
is the error term of regression equation,
is a fixed effect factor which doesn’t change all along the time.
TSit denotes FDI renewable energy technology spillover,
ECit,
ENit and
INit denote economic, environmental and innovative performance of energy industry in China respectively.
4.2. Data Sources and Index Selection
In this study, the panel data of 30 different provinces of China from 2005 to 2011 are included. There are 31 provinces in the mainland of China. Since the energy data in Tibet during that period are missing, they are excluded and only 30 provinces are available and considered in the paper. According to available electricity consumption data, Tibet only accounts for 0.05% of total national electricity consumption. Therefore, the exclusion of Tibet will not undermine the representativeness of this study. In addition, the statistical calibers are not completely uniform before 2005; therefore, this paper uses the data of yearbook since 2005. The sample data (2005–2011) is obtained from China New Energy and Renewable Energy Yearbook, China Statistical Yearbook, China Energy Statistical Yearbook, China Statistical Yearbook on Environment and China Statistical Yearbook on Science and Technology).
According to literature review and the analysis in
Section 3, FDI renewable energy technology spillover is investigated from foreign capital investment, product import and brand effect; energy industry performance is divided into economic, environmental and innovation performance. Combined with previous studies and data acquisition range from yearbook, capital stock, human resource storage and industry output are combined and used to calculate economic performance; energy consumption, CO
2 emissions, solid waste quantity and wastewater quantity are used to calculate environmental performance; and R&D fund, R&D personnel and new product output are used to calculate innovative performance, as shown in
Table 1 and
Table 2, in which the explanation, calculation basis and sources of all measurement indexes are presented.
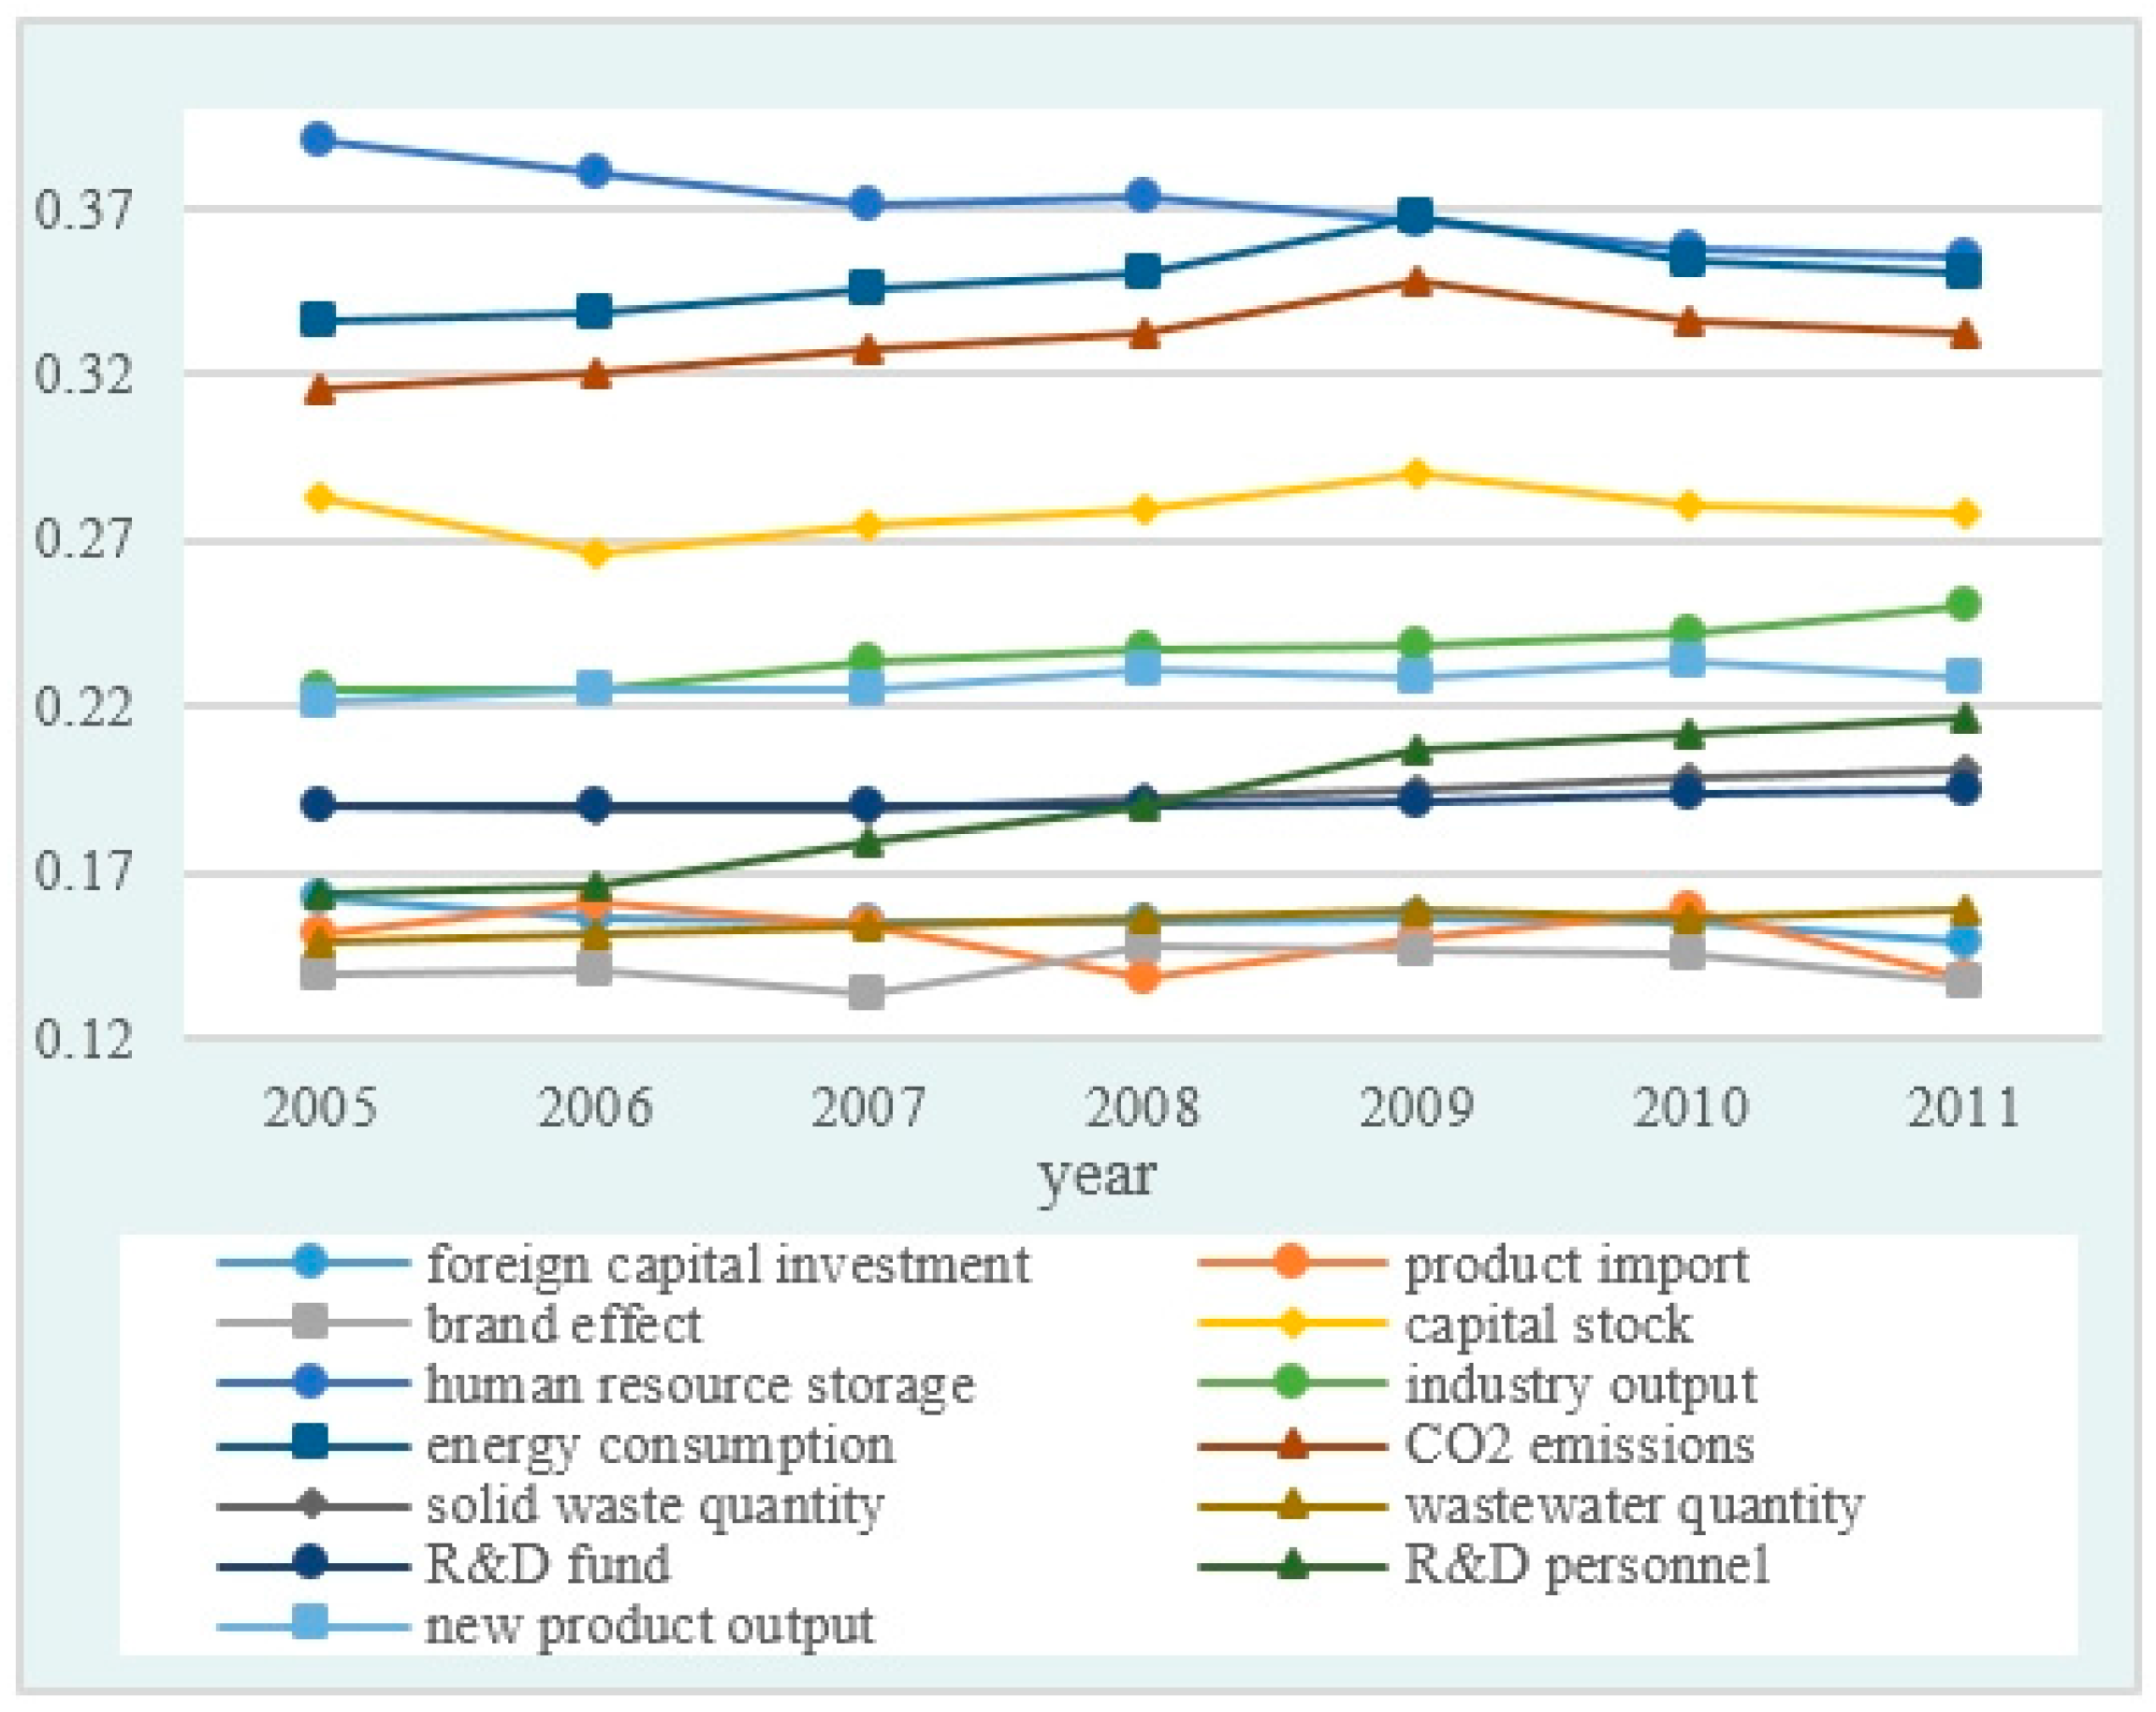
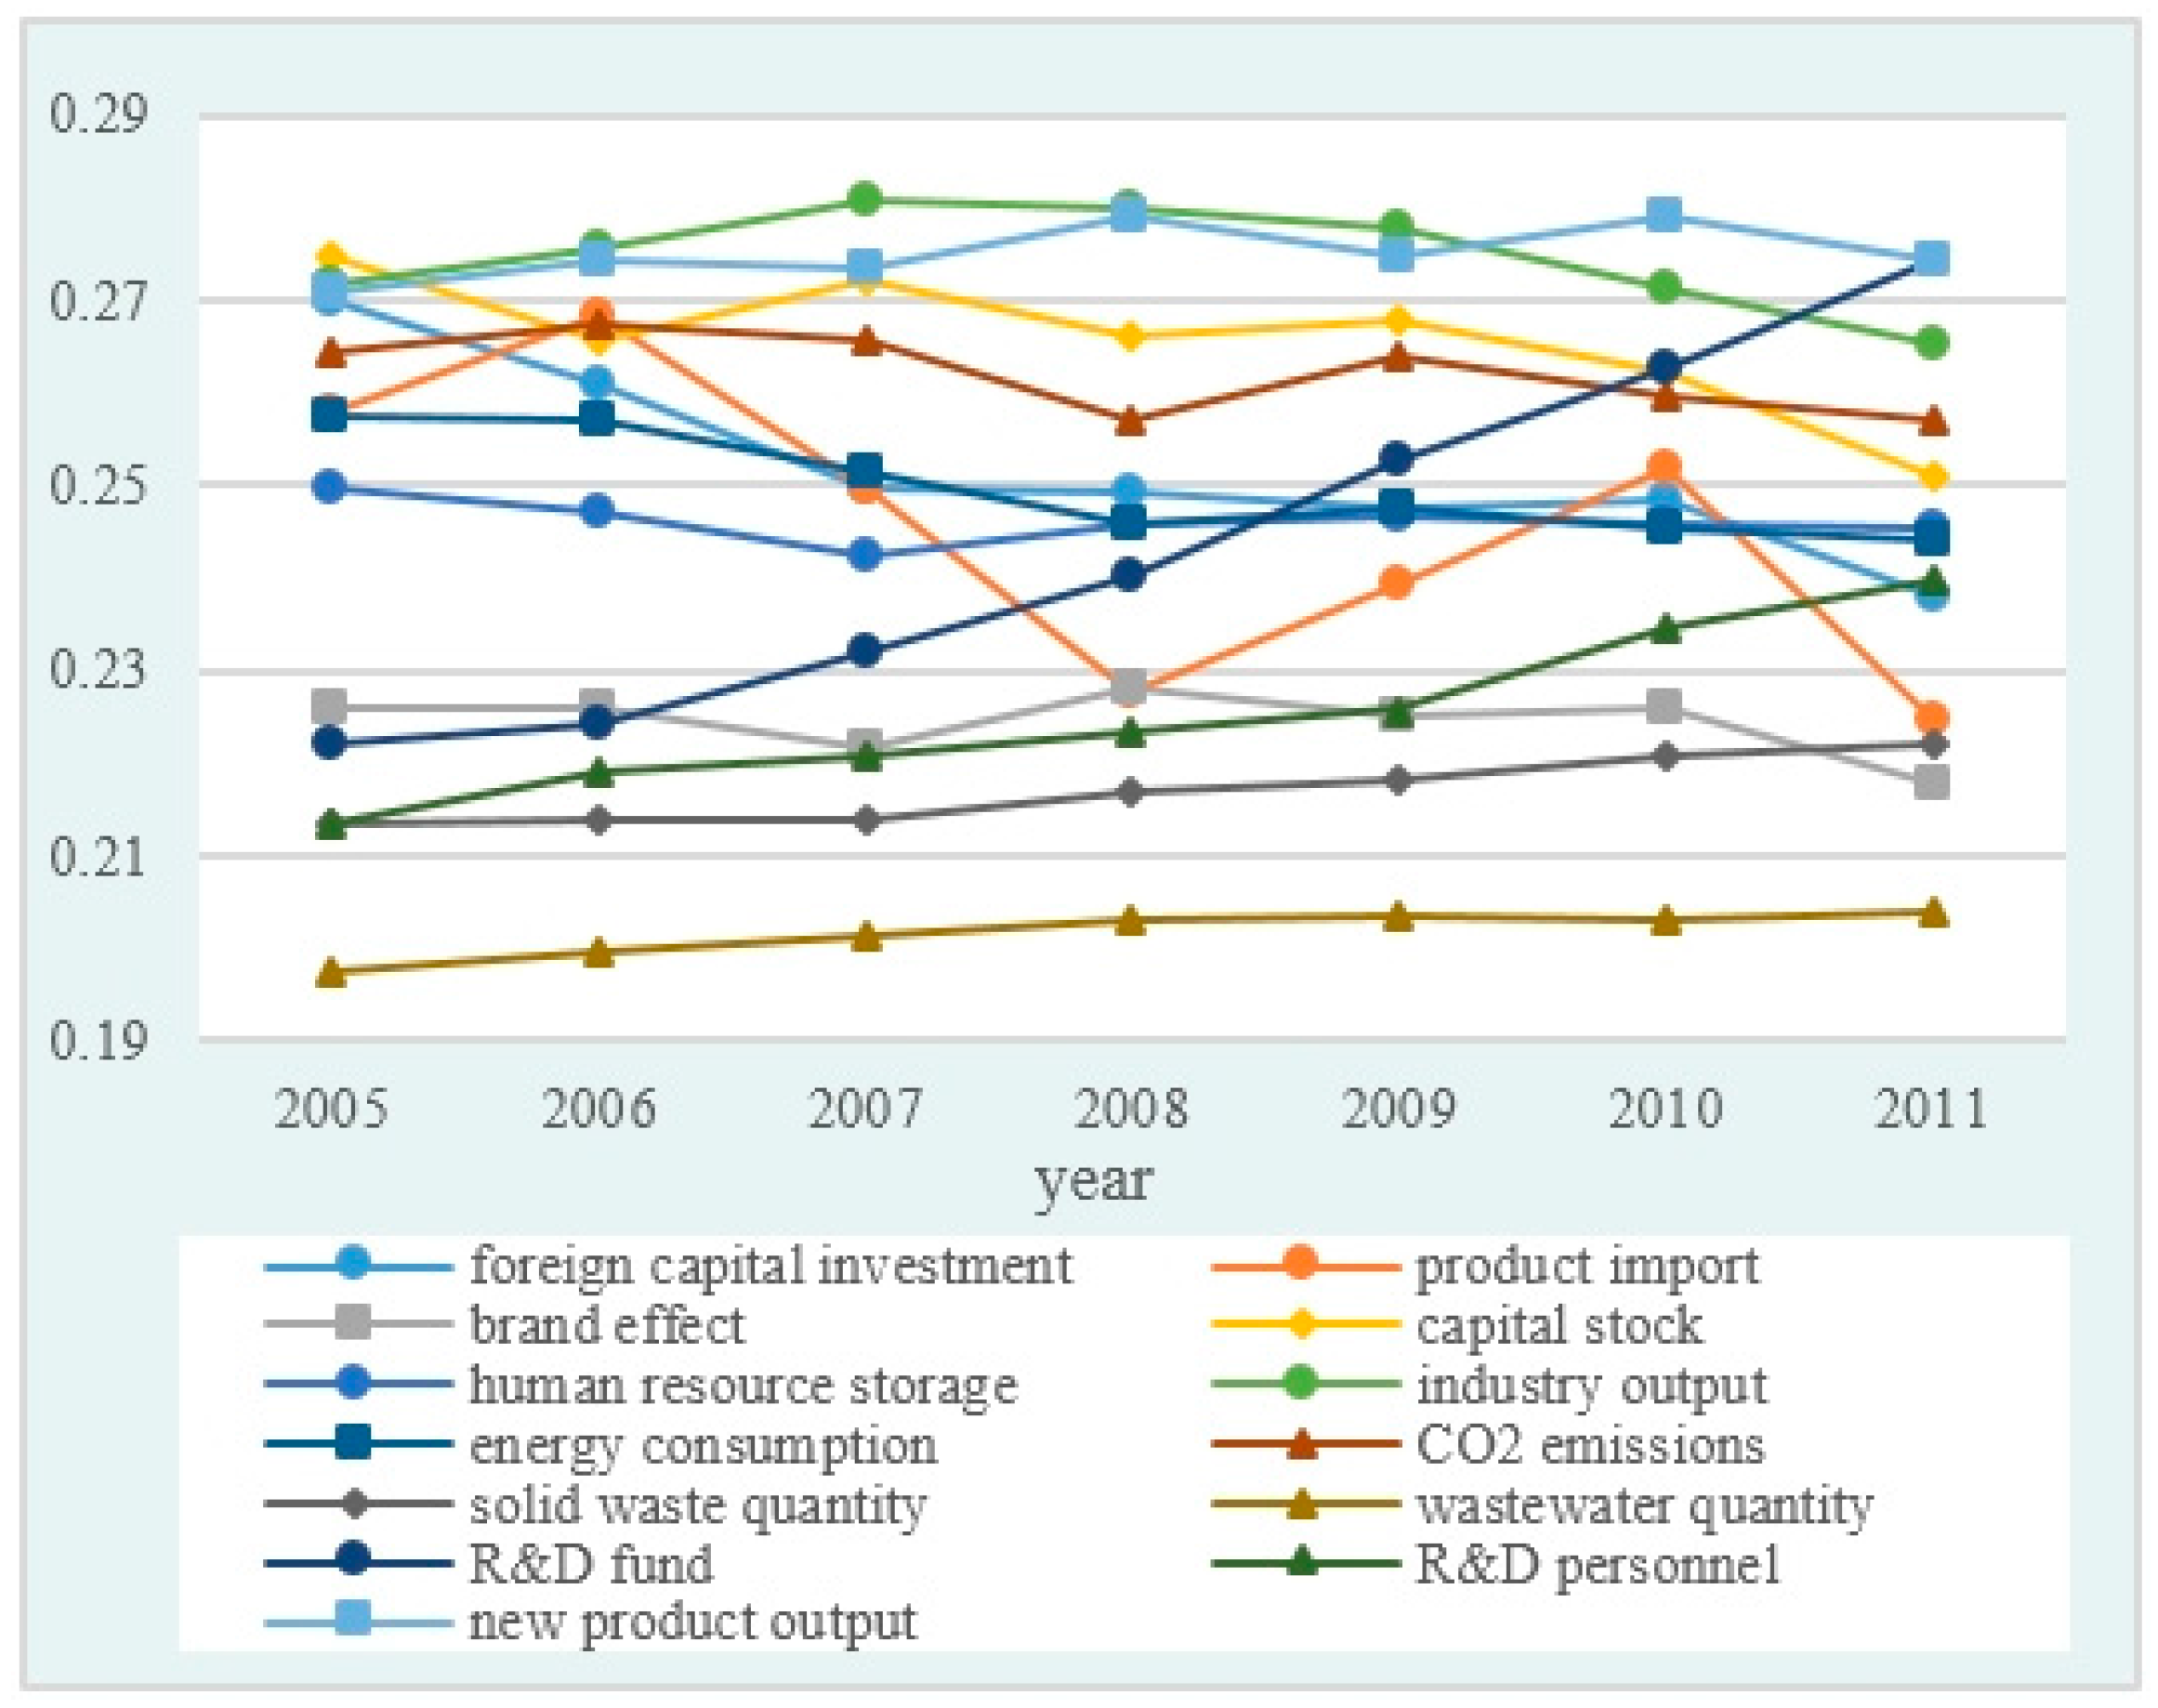
Moreover, in order to observe the changes over time, a descriptive statistical analysis of the measurement indexes is complemented (Due to the dimensions of the indexes are different, all the indexes have been standardized).
Figure 2 and
Figure 3 display the averages and standard deviations of 13 measurement indexes for 30 provinces from 2005 to 2011. It can be seen from the two graphs that these indexes present an ascending trend as a whole along with the time process.
5. Empirical Results and Discussion
5.1. FDI Renewable Energy Technology Spillover
This study adopted factor analysis method and used statistic software SPSS 17.0 (IBM, Armonk, NY, USA) to calculate FDI renewable energy technology spillover in 30 different provinces of China from 2005 to 2011. Firstly, we normalized the data, and then put the processed data into factor analysis model using software SPSS 17.0. KMO reaches 0.748, the approximate chi square value in the Bartlett ball test is 1078.833 (df-3), significance level
p = 0.000 < 0.05, cumulative variance contribution rate of factors reaches 96.672%. Finally, we used the numerical regression method and obtained the factor score function of technology spillover, as shown in Equation (4). After putting the values of foreign capital investment, product import and brand effect into Equation (4), we can obtain comprehensive factor scores for FDI renewable energy technology spillover, as shown in
Table 3.
where
F represents the factor score of technology spillover,
X1 represents foreign capital investment,
X2 represents product import, and
X3 represents brand effect.
From
Table 3, it can be found that economic and technological developed regions, such as Beijing, Tianjin, Shanghai, Shandong, Guangdong and other eastern coast areas have higher factor scores for technology spillover than other regions, all above 4.8 in 2011. One of the probable reasons is that these provinces are located close to the port and international airport, and always pay abundant attention to foreign investment. Moreover, their economic and technological development levels are comparatively higher in China. Accordingly, these provinces have more opportunities for technology spillover than other provinces. Central and northeastern regions including Jiangxi, Hubei, Hunan, Henan, Heilongjiang, Jilin and Liaoning form the second ranking group. Their factor scores of technology spillover are between 3.9 and 4.5 in 2011. This is because their technology spillover is determined and also limited by their geographic location and the development level of technology and economy to a certain extent. Unsurprisingly, western regions such as Gansu, Xinjiang and Shaanxi etc. have the lower factor scores, only between 3.1 and 4.2 in 2011. The conceivable reason is that they are located inland and have fewer chances to attract foreign trade. Also, western areas of China attach more importance to exploit natural resources in their own provinces’ for a long time which leads to relatively lower dependence on the foreign trade.
5.2. Energy Industry Performance in China
This study employs data processing software DEAP 2.1 to calculate energy industry performance in 30 different provinces of China from 2005 to 2011, and obtains economic performance, environmental performance and innovative performance. Economic performance situation of energy industry is shown in
Table 4. Environmental performance and innovative performance situations are similar to economic performance. Due to space limitation, environmental performance and innovative performance situations are not detailed in this paper.
The results in
Table 4 show that energy industry performance in China is able to maintain the overall level higher than 1.000 every year. This suggests that energy industry performance in China is rising steadily. In addition, it also can be found that energy industry performances of 30 different provinces of China in 2009 are less than 1, which suggests that China’s energy industry performance is not very efficient in 2009. The probable reason is that the development of energy industry is negatively affected by global financial crisis in the according year.
5.3. Regression Results
First, this paper implemented stationarity test of panel data, specifically including LLC and PP-Fisher test, and then carried out a Hausman test, and the test results are shown in
Table 5 and
Table 6. Finally, this paper employs econometric software Eviews 6.0 (IHS, Irvine, CA, USA) to carry out mathematical regression analysis using the panel data shown in
Section 5.1 and
Section 5.2. The regression results of FDI renewable energy technology spillover impacting energy industry performance in 30 different provinces of China are shown in
Table 7.
According to the regression results of panel data model, corresponding equations of economic performance, environmental performance and innovative performance are shown as Equations (5)–(7).
where
TSit denotes FDI renewable energy technology spillover,
ECit,
ENit and
INit denote economic, environmental and innovative performance of energy industry in China respectively.
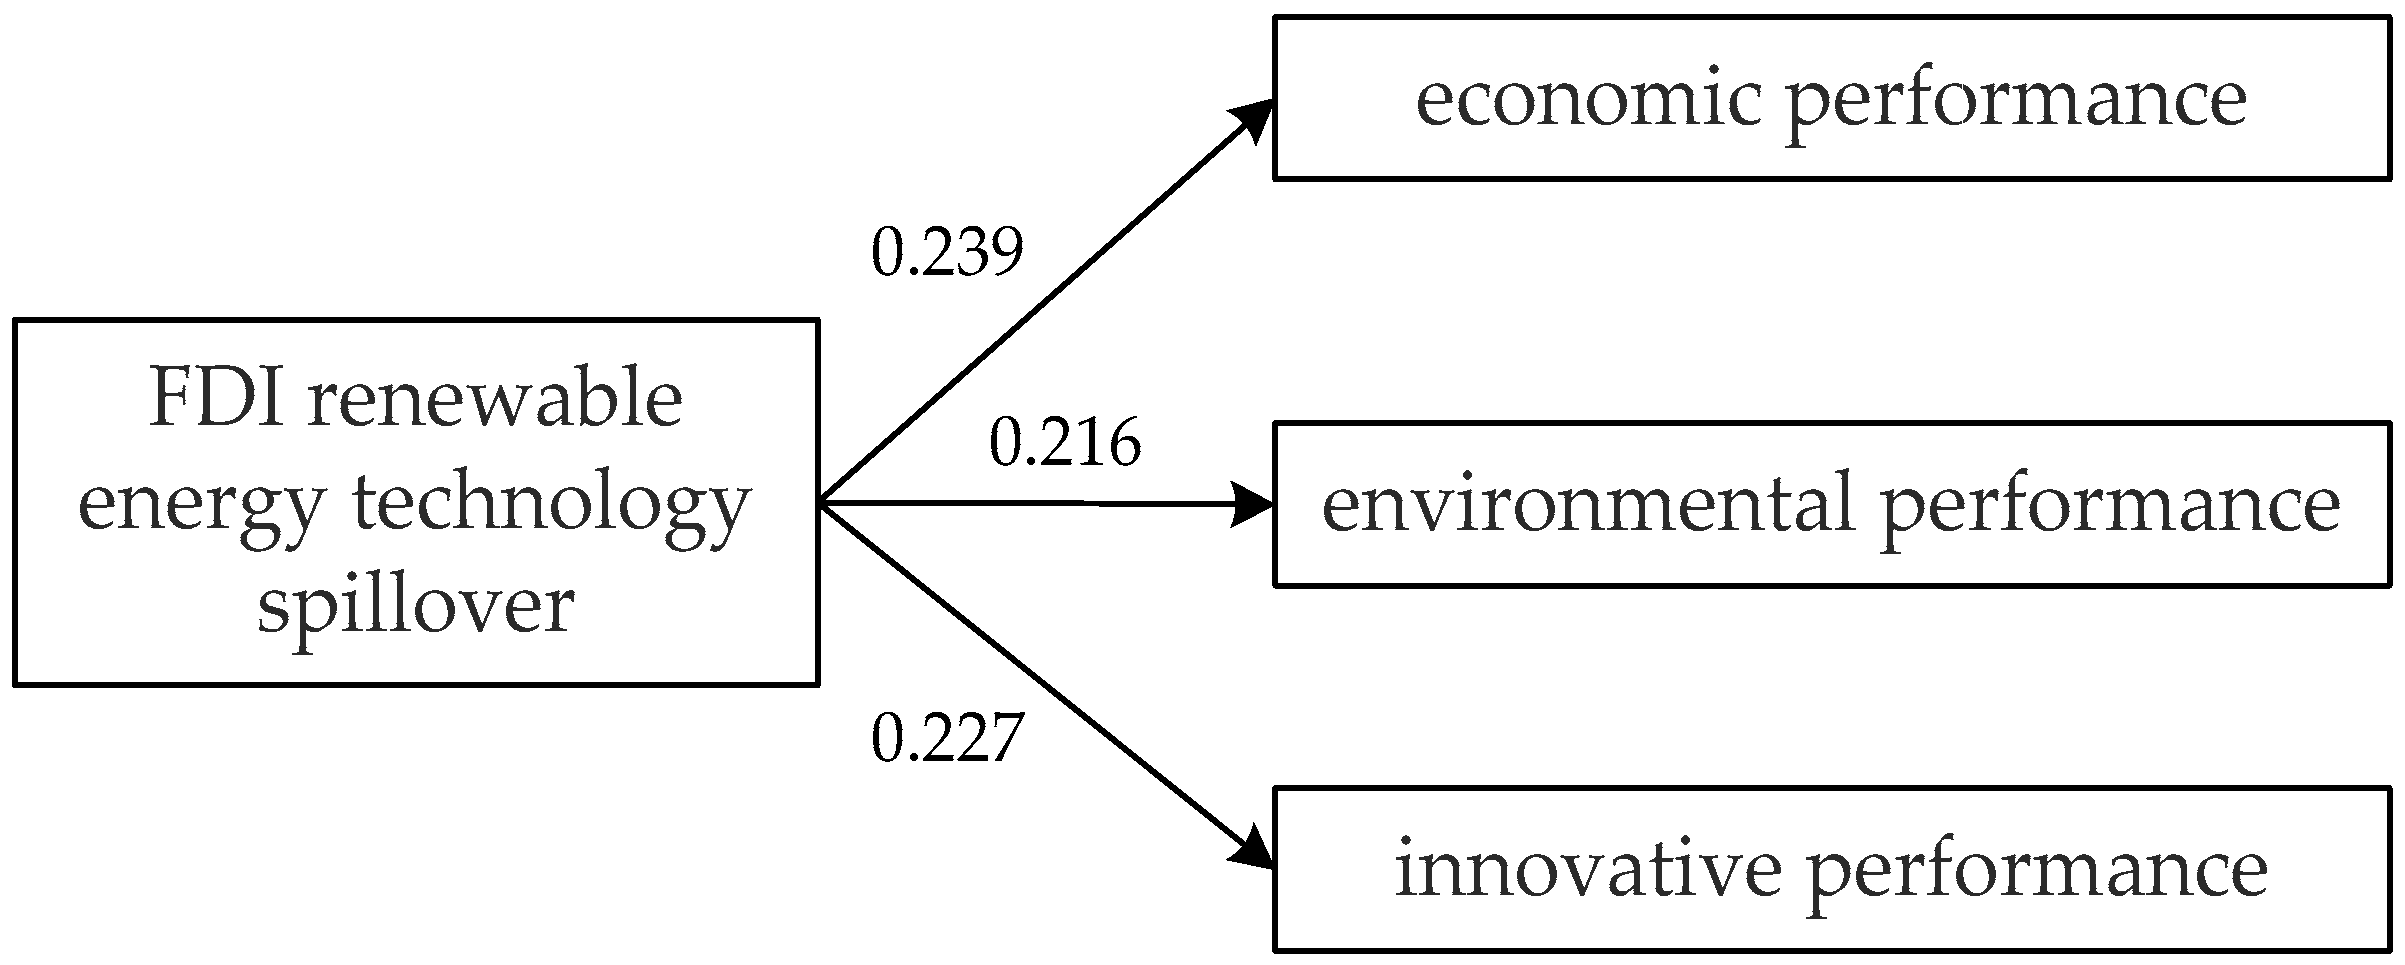
As can be clearly seen from the regression results in
Figure 4, the regression coefficients of FDI renewable energy technology spillover and three performances are all positive. Meanwhile, the results are significant. It can be concluded that FDI renewable energy technology spillover has positive impacts on Chinese energy industry performance. Accordingly, the hypotheses
H1,
H2 and
H3 can be confirmed. Furthermore, the effects of FDI renewable energy technology spillover on the individual indicators of economic, environment and innovative performance are examined, and the results are significant, as shown in
Table 8.
The results show that FDI renewable energy technology spillover has the largest impact on economic performance, and the regression coefficient is 0.239. This means that when FDI renewable energy technology spillover increases 1%, the economic performance of China’s energy industry will increase 0.239% accordingly. Meanwhile, the regression coefficients of FDI renewable energy technology spillover with environmental performance and innovative performance are 0.216 and 0.227 respectively. That is to say when FDI renewable energy technology spillover increases 1%, environmental performance and innovative performance will increase 0.216% and 0.227% respectively. Among the indicators of economic, environmental and innovative performance, FDI renewable energy technology spillover has the largest impact on new product output and the least impact on wastewater quantity.
The reason why the impact of FDI renewable energy technology spillover on economic performance is larger than environmental and innovative performance is that three influencing factors of technology spillover have the most direct and effective impacts on economic performance promotion. More specifically, foreign capital investment provides funds for energy industry and enterprise to enlarge reproduction, which has direct impacts on infrastructure construction and labor instruments improvement. Product import and brand effect, to a certain extent, promote market competitiveness of renewable energy products compared with traditional energy products in China. Accordingly, the total outputs can be promoted. Therefore, product import and brand effect affect economic performance of energy industry eventually. Moreover, compared with economic performance, the impacts of FDI renewable energy technology spillover on environmental performance and innovative performance are also meaningful and thus cannot be neglected. Capital investment for expanding innovation and environmental protection, imitation learning from foreign advanced renewable energy products and the demonstration effect of foreign enterprises will have positive effects on environment performance and innovative performance of China’s energy industry.
6. Conclusions and Policy Implications
This paper investigated the impacts of FDI renewable energy technology spillover on energy industry performance in China. Based on three hypotheses, a theoretical model is proposed to quantify the impacts. Furthermore, an empirical test was carried out using the panel data regression model to measure the impacts from 2005 to 2011. It is shown that FDI renewable energy technology spillover has positive impacts on China’s energy industry performance. Out of the three performances, FDI renewable energy technology spillover has the largest impact on economic performance. It was also found that economic and technological developed regions have higher factor scores for technology spillover, which means more obvious technology spillover effects are shown in these regions. The factor scores of technology spillover in economically and technologically less developed areas are lower. The results demonstrate that China’s energy industry performance can be enhanced by promoting FDI renewable energy technology spillover.
According to the key findings of this paper, some policy implications are proposed as references for decision-making by policy makers in different areas of China.
(1) In order to vitalize China’s energy industry, governments and enterprises can take measures to promote the development of FDI renewable energy technology spillover, such as enhancing the supervision strength of FDI process, improving the investment climate, completing the market economic system, and encouraging the imports of renewable energy products.
(2) To speed up renewable energy technology spillover in the western region of China, the Chinese government is expected to encourage renewable energy technology exchange and cooperation between the eastern and western areas of China, such as promoting the collaborative construction of industrial parks and depending on the existing development zones and high-tech parks. By encouraging foreign trade in the western region of China, FDI renewable energy technology spillover can be enhanced, which will also improve energy industry performance in China.
(3) It is significant for China to adopt differentiated foreign trade policy and technical preferential policy in order to encourage the transformation and diffusion of FDI renewable energy technology towards inland border areas.
(4) The processing trade industry of eastern coastal regions should be encouraged to move to inland border areas. These policies will promote the development and execution of China’s “One Belt, One Road” initiative as well.


