Article

Perception of Cabin Air Quality among Drivers and Passengers

Teacher Training Department, Politehnica University Timisoara, Piata Victoriei nr 2, Timisoara 300003, Romania
*
Author to whom correspondence should be addressed.
Sustainability 2016, 8(9), 852; https://doi.org/10.3390/su8090852
Submission received: 28 May 2016 / Revised: 22 August 2016 / Accepted: 23 August 2016 / Published: 29 August 2016
(This article belongs to the Special Issue Air Pollution Monitoring and Sustainable Development)

Abstract

:
Air analysis inside vehicles is a problem that can be interpreted from several perspectives. This research is oriented towards the perception of air quality within a car, regarding a situation of cars in stationary traffic. Carbon dioxide measurements were made using a Trotec Data Logger Air Quality CO2 BZ30 machine inside different standing vehicles with up to five occupants, with and without circulating air. The perception of the air quality was measured on a Likert-type scale with seven levels on a sample group of 60 students. The results highlight, on the one hand, the conditions under which the CO2 in the cabin air can reach concentrations which are, according to new data, considered to influence the cognitive capacity of occupants in the car, and on the other hand, they present a global assessment of the air quality in the vehicle when critical values of CO2 have been reached. If the air exchange rates inside a car are low, this degrades the air quality in such a way that it affects the concentration and reactions necessary for safe driving without perceiving any discomfort that would put the drivers or the passengers on alert.

1. Introduction

From the perspective of sustainable development in the automotive field, comfort is no longer solely derived from architecture, engineering, social sciences, or the humanities. Increasingly, the quality of the ambient environment is influencing the comfort of the vehicle occupants. Thus, the relationship between pollutant concentrations and comfort may also affect the safety of individuals and the public at large. Sustainable transportation policies are closely related to the potential contribution of this sector in order to decrease in CO2 emissions [1,2,3]. Air quality and carbon dioxide emissions, especially in urban transportation and air transportation, is one of the major points of interest of researchers [4]. The concern of car manufacturers of air quality inside and outside the vehicle should combine and satisfy both the problematic aspects related to comfort and those related to traffic safety, without neglecting any aspects of reducing energy consumption. Watertight modern passenger vehicles greatly reduce heat loss and noise from the car and from outside of it, but prevent natural air renewal inside the vehicle. Also, the very good performances of the new engines reduce the loss of energy, but this energy was usable during the winter to heat the passenger compartment.
In this context of constraints regarding comfort, risk, cost and power consumption, we intend to conduct a study on the air quality in a vehicle, and more specifically, we want to study the perception of the air quality in terms of whether the concentration of carbon dioxide can reach values that can influence the attention and decision capacity of the driver. This influence has been the subject of debate for many researchers in recent years [5,6,7,8,9,10,11,12,13]. To this end we will review research that highlights the effects of carbon dioxide on health and cognitive performance that can be identified in the case of vehicle drivers.
Carbon dioxide is a component of the air, naturally emitted by living beings through breathing. Also called carbonic gas, CO2 is one of the air pollutants. The presence of CO2 in a given air sample is commonly expressed as parts per million (ppm). Studies show that the concentration of CO2 in the air inside inhabited environments usually varies between 350 ppm and 2500 ppm [14,15,16,17,18], but can also reach values of 3000 ppm or 4000 ppm [19,20] depending on the number of people present and the ventilation of the air. At a global and European level there are regulations regarding the ventilation of inhabited environments without presenting scientific arguments regarding the setting of these explicit thresholds of CO2 levels for residential and non-residential buildings [21]. The French rules indicate a level of 1000 ppm of CO2 under the normal occupancy of non-residential buildings, with a tolerance margin for places where smoking is prohibited, where values up to 1300 ppm are allowed. In 2004 a value of 5000 ppm was regulated for occupational exposure.
The same limit is set in 19 other European countries, also establishing short-term exposures between 10,000 and 30,000 ppm [21,22].
Table 1 lists several values regulated or recommended for the CO2 level in residences, classrooms and conference rooms.
In what concerns the CO2 standards for vehicles, we only found the standards of the Taiwan Environmental Protection Administration established at 1000 ppm for 8 h-CO2 for buses and the air quality guideline of the Hong Kong Environmental Protection Department (1 h-CO2: 2500 ppm for Level 1 for buses) (see Table 2) [5].
Level 1 represents good air quality at which there is no health concern identified.
Level 2 represents the air quality at which there is no health concern identified.
Williams presents several clarifications from the National Institute of Occupational Safety and Health (NIOSH), indicating the potential effects, limitation and exposure limits in the case of a very high work rate and while at rest (see Table 3) [10].
Carbon dioxide (CO2) was selected as a proxy indicator of air quality because its concentration within an indoor environment indicates the effectiveness of the ventilation system and the adequacy of the ventilation [25].
There are important physical and physiological responses to CO2 exposure throughout the body. CO2 is a potent stimulus of cerebral vasodilation and blood flow [10,27]. Early symptoms include a sense of “air hunger” or dyspnea and increased respiration and headaches. A higher CO2 concentration produces heart palpitations, confusion, severe dyspnea, vomiting, disorientation and hypertension [10,28]. CO2 is also considered a potent stimulus of pulmonary minute ventilation [27]. Due to a low pH in the blood (which means a high level of acid), the respiratory center in the brain stimulates the respiratory muscles that increase ventilation [8]. CO2 can also alter the intracellular pH, thus having effects on the metabolism [10].
Existing studies have tried to establish a link between carbon dioxide concentration and its effects on both health and performances and also on the perception of the state of comfort [13].

1.1. CO2 Effects on Health

The studies conducted in order to identify the effects of carbon dioxide on health have revealed symptoms related to unhealthy building syndrome (sick building syndrome) [29], respiratory symptoms [16] related to asthma [19] and other effects such as respiratory and otorhinolaryngology infections, rash [30] or general symptoms such as fatigue and headache [17].
Cardiovascular effects have also been highlighted. For example, at a concentration higher than 5% (50,000 ppm), effects such as the increase of blood pressure and heart rate [31], the occurrence of extra systoles during effort [32] or the increase of blood supply to the kidneys and brain have been identified [33]. Also, at levels higher than 50,000 ppm, the effects on the central nervous system were highlighted, such as headache symptoms, dizziness and physical arousal [34], and even visual disturbances [32] at concentrations above 100,000 ppm. Starting from 1% (or 10,000 ppm), an exposure of 30 min may lead to early respiratory acidosis effects [33]; inhalation of air with concentrations higher than 50,000 ppm for one hour leads to lung inflammation [19,35], and exposure to levels above 200,000 ppm can cause coma and/or death [32].

1.2. CO2 Effects on Cognitive Performances and Productivity

Regarding the effects of carbon dioxide on cognitive performances and productivity, recent studies conducted in offices and schools show that increased ventilation above the normal recommendations indicates an increase of productivity by 5%–10% [36]. The recommended fresh air supply rate for school classrooms in the UK is 3 L per second per pupil (L/s.p) with the capacity to supply 8 L/s.p. [37].
Although there are few studies conducted on vehicles regarding carbon dioxide [5,6,7], the laboratory studies and those conducted in schools or in spacecrafts highlight alterations of the attention capacities and decision-making and academic performances [8,9,11,12,13,27].
Chiu, Chen and Chang showed in a recent study (2015) that high-capacity tour bus cabins with the air conditioning system operating in the recirculation mode severely lack in air exchange rate, which may negatively impact transportation safety. They found that both the driver zones and the passenger zones of the tour buses reached more than 3000 ppm of carbon dioxide concentration, and maximum daily average concentrations of 2510.6 and 2646.9 ppm [5].
The study led by Allen and Spengler confirms the findings of Satish, who found the statistical influence of CO2 on decision-making performance when the carbon dioxide level increases from 600 to 1000 and 2500 ppm, respectively [9,38].
At 2500 ppm, large and statistically significant reductions occurred across seven scales of decision-making performance [38]. The Allen and Spengler study also shows that cognitive scores were 61% higher on the Green building day and 101% higher on the two Green+ building days than on the Conventional building day (p < 0.0001) [9,38].
Kajtár, Herczeg and Láng conducted four experimental studies with the following CO2 concentrations: 600, 1500, 3000, 4000 ppm. Their results revealed that the capacity to focus declines when the CO2 concentration in the air increases up to 3000 ppm [12]. Two other experimental studies carried out by Kajtar, Herczeg, Lang, Hrustinszky and Banhidi showed that a CO2 concentration over 3000 ppm makes the well-being and the focus of the subjects’ decline [11].
Wargocki shows that performance (in addition and correction tests) significantly increases when carbon dioxide levels decrease [14]. The same author highlighted in 2007 the link between the speed of students solving tests and the increased ventilation of classrooms.
Twardella highlights both the significant correlations between the increase in ventilation and the decrease in the number of recorded errors, as well as non-significant correlations between the speed of executing tasks and focusing [39]. Two other experimental studies highlight the significant correlations between the increase in carbon dioxide levels and the decrease in performance (percent of identified errors) in a reading test [12] and a computer test [38].
There are also a few studies which do not always highlight the significant effects of CO2’s influence on cognitive skills [31].
A recent review by National Aeronautics and Space Administration NASA examined 76 studies and reported that it is difficult to draw firm conclusions about the impact of carbon dioxide on sleep, cognition and psychomotor performance, but it is necessary to understand and clarify the risk of adverse cognition and performance effects of carbon dioxide, especially in human spaceflights [13].

1.3. CO2 Effects on the Perception of Comfort

The third aspect regarding the effects of carbon dioxide studied is its relationship with the perception of the state of comfort, especially with the perception of air quality. Wargocki finds that acceptability of air quality, its freshness and reduced odor perception increase significantly with the level of ventilation (and therefore with lower CO2 levels), but these differences are perceived only when entering the room [14]. In the 2004 study, none of these variables is reported as significant. Other researchers obtained significant results between CO2 reduction and the perception of air quality, specifically in connection with the freshness of the air, the perception of lower temperatures, increased perception of air movement and decreased perception of odors [14,40,41,42,43].
Recirculated air in the cabin can have benefits for the drivers who opt to put it into operation: it is considered the most effective option in terms of thermal management of the car and help to reduce fuel consumption [44]. The use of the air recirculation position leads to protection from different pollutants existing in the environment or helps reduce particles in the car [44]. The argument of effective thermal management is taken into account in the case of electric cars in order to increase the vehicle’s autonomy movement.
The buses with air conditioning operating in the recirculation mode are severely lacking in terms of the air exchange rate and consequently elevate the risk of traffic accidents because bus drivers use the air conditioning system in the recirculation mode most of the time [5].
We chose to study the air quality in cars with and without using the air recirculation setting, because we supposed that the air recirculation setting can rapidly lead to significant increases in CO2.
The hypothesis considered for the study, in a stationary car, is an atypical situation, but is frequently encountered in the following circumstances:
-
when using the "drive-in" service where customers park their vehicles to enjoy an on-board service. As an example we can list drive-in restaurants, but also drive-in cinemas where people spend several hours in the car;
-
in the daily traffic jams but also in occasional traffic jams, for example in cases of traffic accidents during blockages encountered when leaving or returning from vacations or when waiting at border crossing points, etc., when we are obliged to spend several hours in a stationary car.
The present research aims to study the air in vehicles from the perspective of carbon dioxide levels and the perception of air quality in cars in terms of the presence of different amounts of CO2 in the breathing air.

2. Materials and Methods

2.1. Participants

All the participants in our study were students of a technical college, 19 students from the third year and 41 students from the fourth year. A total of 60 students, young drivers and passengers (34 men, 26 women; M = 22.9 years) participated in the assessment of the air quality during the measurement of CO2 (first evaluation). Twenty out of the 60 subjects participated in another evaluation of the air before and after the measurement of CO2. The perception of the air quality was measured on a Likert-type scale with seven levels (1—very poor; 7—very good quality of the air).
All participants signed an Informed Consent before participating in the research where they were informed about the purpose of the study, the procedure to be undergone, and the potential risks and benefits of their participation. Their participation was voluntary and they agreed to participate without remuneration.

2.2. Vehicle Instrumentation

Carbon dioxide measurements were made using a Trotec Data logger Air Quality CO2 BZ30 machine with the following technical data: CO2 sensor—NDIR (non-dispersive infrared); carbon dioxide measuring range: 0 to 9999 ppm CO2; resolution (precision) CO2: 1 ppm (±75 ppm or ±5% of measured value); measuring range: 2 s; readings memory: 50,000 measured values. A zero calibration was applied prior to every use.

2.3. Design and Conduct of the Study

The air quality assessment was carried out under the following conditions:
-
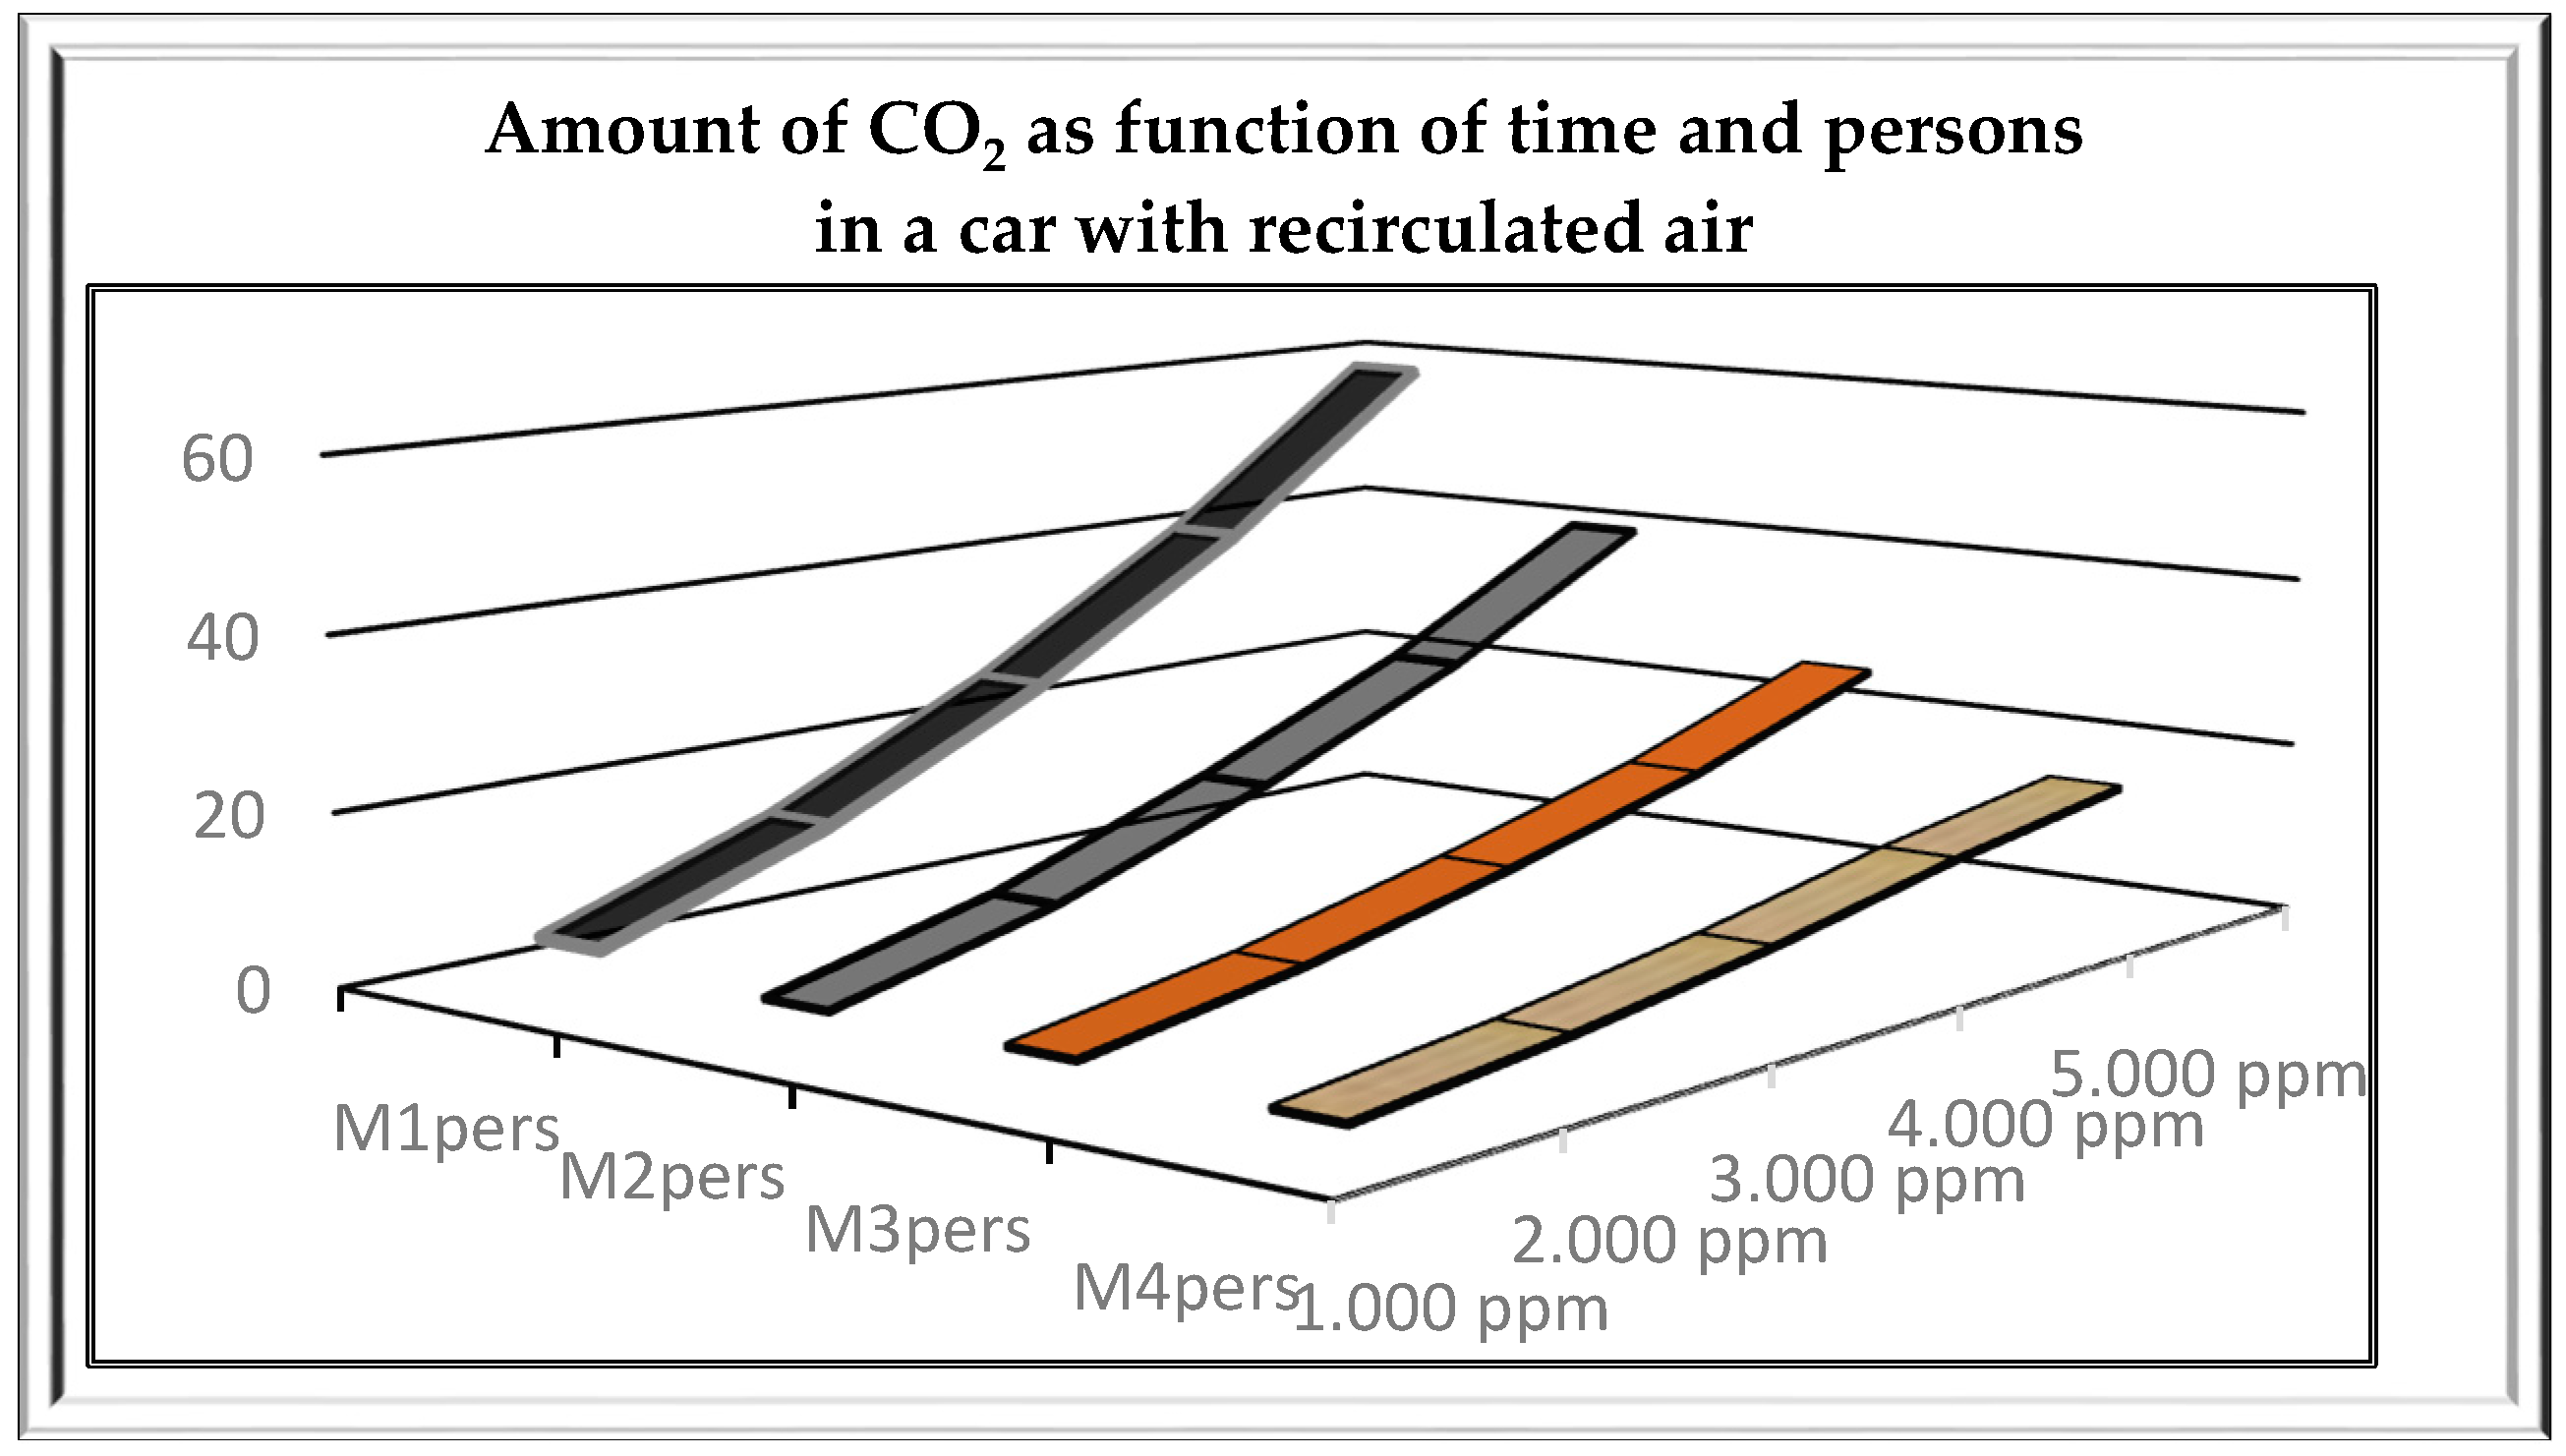
one, two, three and four people in the car;
-
In three vehicles: Dacia Logan, Hyundai and Renault ZE;
-
In two situations: with recirculation and without recirculation of the air.
A different measurement of carbon dioxide at 10,000 ppm was reached with five people in a Dacia Logan cabin.
Our study is based on an experimental design with two groups and repeated measurements, a pre-test Ti and a post-test Tf.
Participants in these measurements and evaluations received an evaluation form and were given the task to evaluate the air quality on a scale from 1 to 7 (1-very poor; 7-very good quality of the air). The air quality was assessed when entering the vehicle (initial Ti pre-test phase) and the participants remained in the vehicle until the air reached 5000 ppm CO2. A final Tf post-test evaluation phase was conducted at 5000 ppm.
Half of the CO2 measurements and of the air quality evaluations have been performed with the recirculation mode on and half with the recirculation mode off. The cars were stationary in all cases.
We continued the experiment with another level of the variable, in which 20 out of the 60 participants assessed the air quality two more times. The first evaluation was made when entering the vehicle (initial phase). After this initial evaluation, they left the vehicle and then re-entered it after the amount of carbon dioxide reached 5000 ppm. At this time they assessed the air quality a second time Tf (final phase). Ten out of these 20 participants assessed the air quality in cars with the recirculation mode activated and 10 in cars without recirculation.
All the cars were stationary and the results should only be interpreted under these conditions. We opted for a stationary machine in order to eliminate the influence of vehicle speed on the CO2 concentration within the cabin.

3. Results

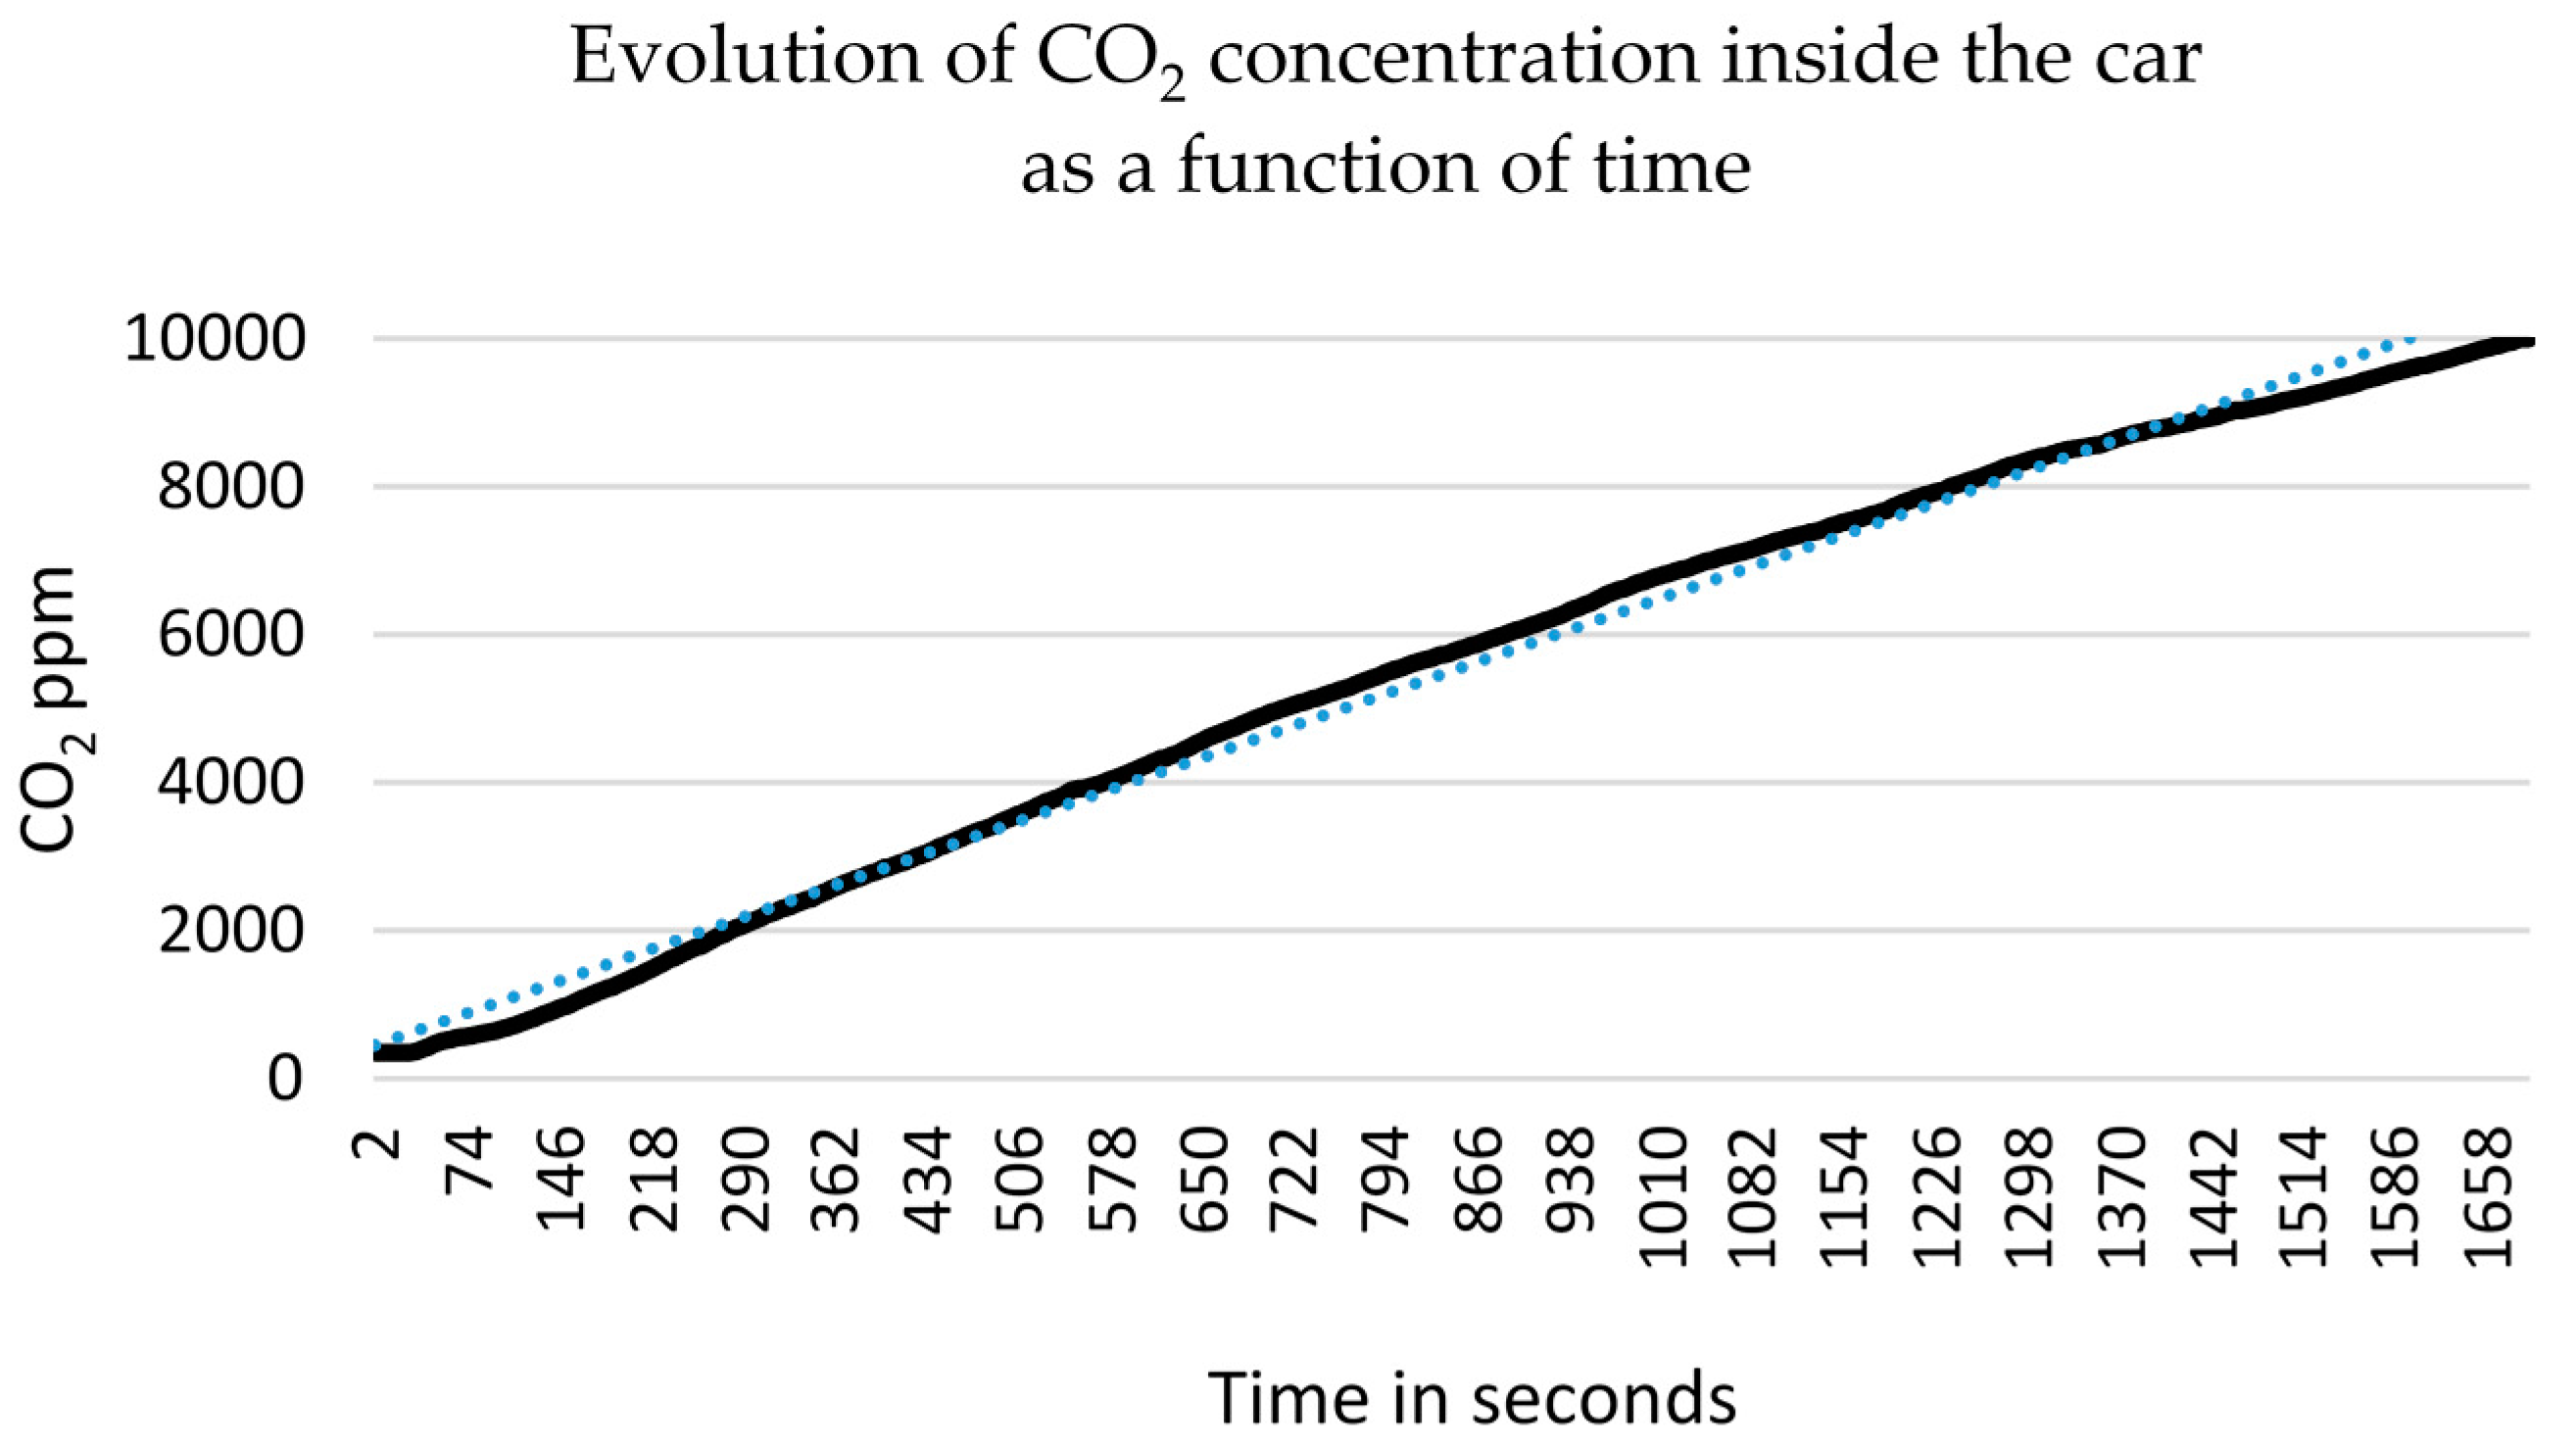
3.1. Measuring and Analyzing Carbon Dioxide in the Cockpit

Analyzing the air quality within the cockpit is one of the aims of this article. To this end we measured how long it took the air inside the passenger compartment to reach a level of carbon dioxide concentration characterized as the CO2 limit in occupational exposure within a maximum of 8 h (5000–5000 parts per million).
Due to the health risks associated with carbon dioxide, the average exposure of a healthy employee during an eight-hour working shift should not exceed 5000 ppm [45].
We chose to study two relevant situations in which carbon dioxide levels easily reach values that can influence the cognitive capacity of the driver and, in extreme circumstances, can endanger the health of the passengers. We refer to the situation in which the vehicle is stationary without the air being recirculated and to a second situation in which the vehicle has the air recirculation option activated (the scenario of a car blocked in a tunnel or stuck in traffic).
Table 4 lists the average (M) and standard deviation (SD) for the measurements conducted for all three types of vehicles, with one, two, three and four persons in the cockpit. It was observed that for a single person it takes 24 min, whereas for four persons it takes 7 min, to reach a level of 3000 ppm CO2, i.e., the concentration at which substantial adverse effects on cognitive performance can lead to transportation risk [38].
Table 5 lists the time necessary for the cockpit air with five people inside to increase from a level of 350 ppm to 10,000 ppm, the limit at which the first signs of respiratory acidosis can occur. The measurement was made in a stationary Dacia Logan. The time needed to reach 10,000 ppm was 28 min.
We include Figure 1 to show the time during which the carbon dioxide increased from 350 to 10,000 ppm (for five persons in a Dacia Logan).
The CO2 curve indicates the amount of carbon dioxide and its evolution over time in a stationary vehicle with the recirculated air mode on, with five passengers. The measurements show that in about 12 min, the carbon dioxide level reached the limit for occupational exposure (5000 ppm). In about 28 min, the amount of carbon dioxide reached the level at which the first signs of respiratory acidosis appear (10,000 ppm). This plot suggests that CO2 does not approach a steady-state concentration, not even at 10,000 ppm. This could be dangerous, calling for an alert, e.g., an alarm system triggered at this concentration.
Table 6 indicates the maximum, minimum and average scores for the three characteristics measured in a stationary Dacia Logan with five people in the cockpit. The sampling frequency was of 2 s, yielding 1581 measurements.
Another situation was the study of the air quality in the cockpit with the air being recirculated. There are usually economic reasons for which some people wish to recycle the air inside the cockpit.
However, increasing carbon dioxide levels can endanger the attention of the driver and even the lives of the passengers.
Table 7 lists the time during which the air breathed by the occupants of the vehicles reached certain values of carbon dioxide, in the case of a stationary vehicle with recycled air. Recirculation was carried out at a flow rate of 105.64 m3/h with ventilation activated at level 2 out of 4.
The flow rate was measured using a TA 300 wire anemometer. The TA 300 Trotec had an accuracy of ±5% of +1 measurement unit and a 0.01 resolution. The values measured in the circulation mode are compatible and fit into the instrument’s accuracy class.
Table 7 and Figure 2 show that the CO2 concentration in the cabin increased from 1000 to 5000 ppm according to the time span and the number of persons in the car, with the air being recirculated. In the case of a single person, 58 min are needed for the air to reach 5000 ppm, while for four people, 15 min are needed to reach the same concentration of carbon dioxide.

3.2. Analysis of the Air Quality Perception

The air quality analysis was based on the perception of the participants toward the study and consisted of a global assessment of the air quality at two different times: at the beginning of the carbon dioxide measurements (Ti), and at the end of the measurements (Tf) at 5000 ppm. The perception of the air quality was measured on a Likert-type scale with seven levels: 1, very poor; 7, very good quality of the air.
Our air quality study is based on an experimental design with two groups and repeated measurements, a Ti pre-test and a Tf post-test. The independent variable has two levels of variation (with recirculation and without recirculation) measured in the initial Ti pre-test phase and in the final Tf post-test phase. Since the data obtained on a Likert scale is ordinal data, we used nonparametric analysis tests.

3.2.1. Comparisons between the Two Groups of Participants (with and without Recirculated Air)

The comparative analysis conducted using the Mann-Whitney test shows that the scores obtained in the Ti pre-test phase with the group of participants who stayed in the car with the air being recirculated do not differ significantly from the scores obtained in the Ti pre-test phase of the evaluation conducted with the group of participants who stayed in the car without the air being recirculated (U = 450; N1 = 30; N2 = 30; p = 1). This result is obvious because both groups had the same relatively low (350 ppm) CO2 concentrations, so they would be expected to have similar scores.
Participant post-test scores showed a divergence between the participants in vehicles with recirculated air versus those in vehicles without air recirculation, as indicated by the statistically significant difference in the Mann-Whitney test results (U = 194, N1 = 30; N2 = 30; p = 0.001).
The results of both comparisons are shown in Table 8.

3.2.2. Comparisons of the Two Groups between the Ti Pre-Test and Tf Post-Test

The comparisons between the Ti pre-test and the Tf post-test phases have been made separately for each group, but also for both groups.
The comparative analysis, performed using the Wilcoxon Test (N = 60, z = 6.73, p = 0.000), shows that there is a significant difference in the air quality assessment between the Ti pre-test and the Tf post-test phases, for all participants.
In the case of the group with the recirculated air, the results of the Wilcoxon Test show that in the Tf post-test phase, the air with a concentration of 5000 ppm was considered to have a poorer quality than the air in the Ti pre-test phase, with 350 ppm CO2 ( N = 30, z = 4.84, p = 0.000).
A significant difference was also found in the case of the group without air recirculation, between perceptions of the air with 350 ppm and perceptions of the air with 5000 ppm (N = 30, z = 4.76, p = 0.000), in this latter situation the air being considered of a lower quality as compared to the initial evaluation.

3.2.3. Comparisons of Three Groups in the Tf Post-Test Phase

We wanted to know whether there are differences between the two groups who participated in measuring the CO2 level and the third group that only participated in the evaluation of the air re-entering in the passenger compartment after the air had reached 5000 ppm.
We have applied the Kruskal-Wallis test in order to identify the difference between the perceptions of the air quality in the Tf post-test phase between all three groups mentioned. The results (chi-square = 29.16; p = 0.001) indicate that there are significant differences between the participants’ assessments of the air quality in the cabin.
The results obtained (average rank for the three groups) show that the best air quality was perceived by those who stayed in the cars with recirculated air (M1 = 56.73) and the poorest air quality was evaluated by those who stayed outside the cockpit during the increase in the amount of CO2 (M3 = 23.83).

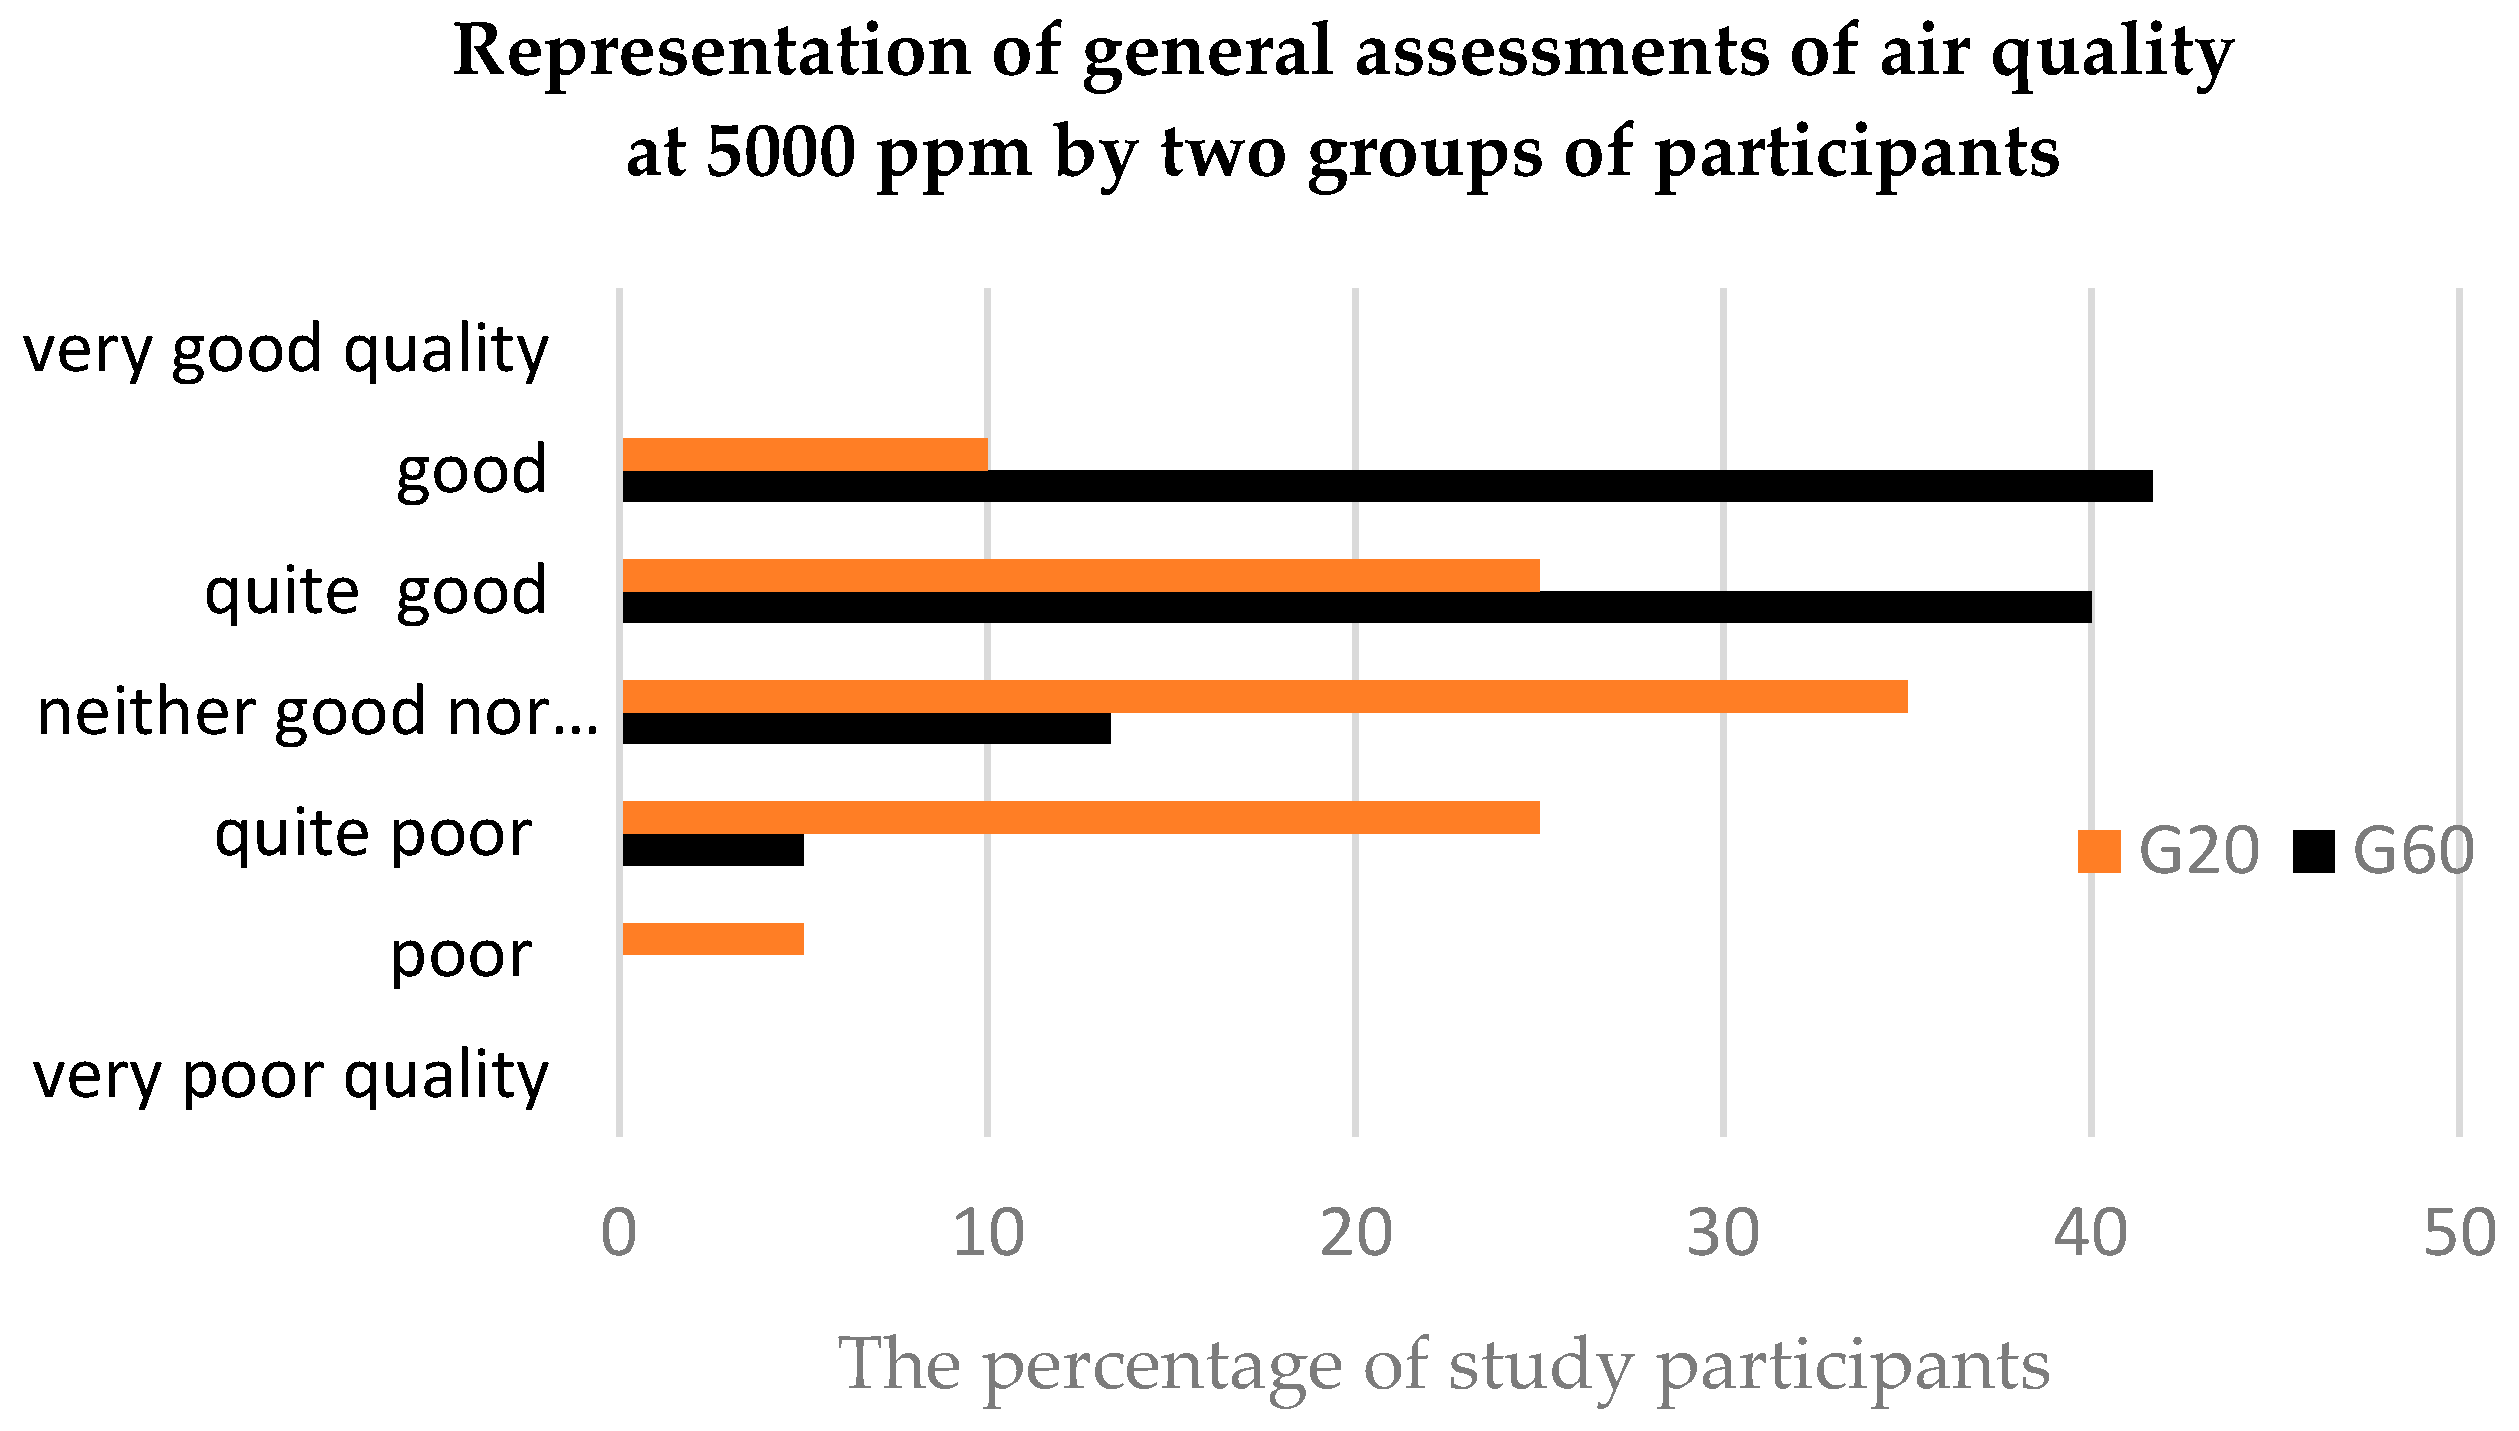
3.2.4. General Assessments of the Air Quality

Although there are significant differences regarding the perception of air quality at 350 ppm and at 5000 ppm, the overall air quality assessment is positive both for the group of 60 participants (G60) who stayed in the car until the CO2 level increased to 5000 ppm, and for the 20 participants (G20) who left the car after the initial evaluation and then re-entered the car for the final evaluation at 5000 ppm.
As seen in Figure 3, a percentage of 81.67% of the G60 participants assessed the air at 5000 ppm as being of a good or quite good quality and 13.33% considered the air to be neither good nor bad.
Although the differences in the perception of air quality differ significantly between the two groups mentioned, G20 does not consider the air quality to be poor. Specifically, 30% of them believed that the air quality is poor or quite poor, while 35% considered that the air is neither good nor bad, and 35% believed the air quality to be good or quite good.
The ranking of the quality of the indoor air, according to the European norm EN 13779, shows that a difference between the indoor and the outdoor air greater than 1000 ppm CO2 is considered a low air quality [21]. In regards to this ranking, our results show that the majority of the study participants assessed the air, which in reality was of a low quality, as being good quality air.
This situation in which stale air is perceived as good air must attract the attention of those responsible for traffic safety. They might require air quality regulation and control devices, because air whose characteristics as what regards the level of CO2 is considered by many researchers to be air that can affect the cognitive abilities and the psychomotor reactions of the drivers.

4. Discussion

From the perspective of sustainable development, the energy efficiency of a vehicle is paramount for the preoccupations regarding comfort within the vehicles, but a concerted dialogue of specialists is required to study air, ambience and car interiors.
The aims of this article are to identify and highlight the conditions under which the air quality in vehicles can reach CO2 concentrations which might influence the attention span and the cognitive abilities of drivers. The study also investigated how the perception of air quality changes with the CO2 concentration.
The participants’ perception of air quality varied considerably. Between the initial Ti and the final Tf phases of the evaluation, the carbon dioxide level in the air inside the vehicle increased from about 350 ppm to 5000 ppm. This difference in air quality was emphasized in the evaluations given by the participants. All of them ascertain that the quality of the air decreased after the CO2 increased.
The participants who stayed in cars with the recirculation mode on perceived, at 5000 ppm, the quality of the air as being better compared to those who stayed in cars without the air being recirculated. This result can be explained by the fact that the existing ventilation, when the air recirculation is started, leads to an increase in the perception of the air quality.
The participants who stayed outside the cockpit perceived the quality of the air (at 5000 ppm) as being lower compared to those who stayed in the cabin while the level of CO2 increased. This result suggests that there is an accommodation with polluted air and it is perceived as being of a higher quality than it actually is.
Although differences were identified, the global assessment of the air quality is not negative, but rather the air quality evaluations conducted by the three groups of participants indicate that at 5000 ppm the air is not perceived as being of a low quality. The respondent underestimated the measured concentration.
Carbon dioxide measurements performed in a stationary vehicle show that reaching the limit of 5000 ppm ranges from 13 min (for four people) to 56 min (for one person). When this limit is exceeded, carbon dioxide can have negative effects on both the driver and the passengers because the research of Fisk and Satish highlights the deterioration of focus and of the decision-making abilities starting at values of 1000 ppm [46].
The cabin of a car is a relatively tightly closed space [44] in which the occupants can spend more or less time. If the inside air is recirculated, the air quality in the cockpit can drop rapidly and the air inside the passenger compartment becomes unhealthy [5].
Air recirculation is recommended in situations such as when one wishes to isolate the driver and the passenger compartment from the outside air which can sometimes be polluted by different air pollutants, such as the air inside tunnels or on dusty roads.
In real life, the recirculation button is used when people want to heat or cool the air from the passenger compartment faster, which due to the air passing through the air conditioning system is increasingly warmer/colder, instead of letting the warm (cool) air in from the outside. There are also environmental and economic reasons why some people wish to recirculate the inside air. In order to reduce fuel consumption used for cooling (during summer), people opt for recirculating the air, thus assuming certain inconveniences such as misting, without being aware of the possible effects of the increase in carbon dioxide. In an electric car in which the energy consumed in order to heat the air is more appreciated than in other cars because it depends on the travel distance, the temptation to save energy and keep the air warm (or cold) is quite big and may underlie some decisions (such as recirculating the air), and this sometimes entails effects on the driving of the car as well as on the health of its occupants.
The results of this study may be useful to any driver who has assumed an ecological conduct and aimed to reduce fuel consumption and CO2 emissions by limiting the use of air conditioning. More recirculation means less energy, but it is important for drivers to be aware of the risks linked to an increased concentration of carbon dioxide. The fractional air recirculation method could be a simple innovative way of improving air quality, in order to maintain a level of CO2 that does not affect the cognitive capacity of the driver and of the passengers, and of contributing to gaining energy.
In conclusion, the increase in the carbon dioxide level above certain limits can be achieved in the everyday traffic conditions and while parking over a short period of time (from 15 min to 1 h). If the air inside a car is not sufficiently ventilated with fresh air, it degrades the air quality in such a way that it affects the focus and reactions necessary for safe driving.
This situation may generate some risks for the occupants without them perceiving any discomfort that would put the drivers or the passengers on alert.
Driving is a very common, highly complex task that requires cognition during every routine task, but also when it comes to higher-level decision tasks [47]. Driving typically involves three classes of task processes: operational processes for stable driving, tactical processes that govern safe interactions with the environment and other vehicles, and strategic processes for higher-level reasoning and planning [48].
Even if, for the moment, CO2 alone is not considered an indicator of the chemical pollution of indoor air, from the point of view of road safety, CO2 measurement is very important for drivers, for whom psychological evaluation targets the cognitive capacities (attention, decision, etc.) which ensure safe driving. Consequently, we consider it useful to have a monitoring system for the CO2 level in the public transportation system, as well as in personal cars, especially because the air with a high content of CO2 is not perceived as stale air.
The CO2 levels in our atmosphere are rapidly increasing. Climatologists and other scientists have warned for more than half a century that the accumulation of CO2 and other greenhouse gases in the atmosphere is leading to global warming and other significant climatic, ecological, and societal changes. In 1900 the ambient atmosphere was below 300 ppm; now the average ambient concentration of CO2 is about 350–400 ppm and the level predicted by the end of the 21st century is around 800–1000 ppm. This increase may have implications on all of society, especially in jobs with critical responsibilities such as surgeons, air traffic controllers or drivers [8]. Lowering CO2 is important from a transportation safety standpoint. A global awareness of this issue may enable a change in practice on CO2 emission activities.

Acknowledgments

The related findings were gained through our work in the national project: Researches based on Knowledge Management Approach Concerning Industry–University Collaboration in the Open Innovation Context (UNIinOI). This work was undertaken through the Partnerships in Priority Domains Programme-PN II, developed with the support of MEN-UEFISCDI, Project No. 337/2014 in Romania. Any findings, results, or conclusions expressed in this article belong to authors and do not necessarily reflect the views of the national authority UEFISCDI.

Author Contributions

The proposed study is part of research carried out by all the authors, within a synergic collaboration, with continuous reciprocal feedbacks during the literature studies, the writing of the text and the measurements made. All authors contributed in all phases of the work.

Conflicts of Interest

The authors declare no conflict of interest.

References

  1. Natalini, D.; Bravo, G. Encouraging Sustainable Transport Choices in American Households: Results from an Empirically Grounded Agent-Based Model. Sustainability 2014, 6, 50–69. [Google Scholar] [CrossRef]
  2. Nicola, D.A.; Rosen, M.A.; Bulucea, C.A.; Brandusa, C. Some Sustainability Aspects of Energy Conversion in Urban Electric Trains. Sustainability 2010, 2, 1389–1407. [Google Scholar] [CrossRef]
  3. Pojani, D.; Stead, D. Sustainable Urban Transport in the Developing World: Beyond Megacities. Sustainability 2015, 7, 7784–7805. [Google Scholar] [CrossRef]
  4. Jou, R.-C.; Chen, T.-Y. Willingness to Pay of Air Passengers for Carbon-Offset. Sustainability 2015, 7, 3071–3085. [Google Scholar] [CrossRef]
  5. Chiu, C.-F.; Chen, M.-H.; Chang, F.-H. Carbon Dioxide Concentrations and Temperatures within Tour Buses under Real-Time Traffic Conditions. PLoS ONE 2015, 10, e0125117. [Google Scholar] [CrossRef] [PubMed]
  6. Čorňák, Š.; Horák, V.; Chládek, Z.; Ulman, J. The evaluation of air quality in military vehicles. Sci. Mil. 2012, 7, 50–54. [Google Scholar]
  7. Čorňák, Š.; Braun, P. The evaluation of interior car’s air quality and safety of traffic. Sci. Mil. 2010, 1, 36–39. [Google Scholar]
  8. Bierwirth, P.N. Carbon Dioxide Toxicity and Climate Change: A Serious Unapprehended Risk for Human Health. Available online: http://grapevine.com.au/~pbierwirth/co2toxicity.pdf (accessed on 2 July 2016).
  9. Allen, J.G.; MacNaughton, P.; Satish, U.; Santanam, S.; Vallarino, J.; Spengler, J.G. Associatios of Cognitive Function Scores with Carbon Dioxide, Ventilation, and Volatite Organic Compound 12 Exposures in Office Workers: A Controlled Exposure Study of Green and Conventional Office Environments. Environ. Health Perspect. 2015. [Google Scholar] [CrossRef] [PubMed]
  10. Williams, W.J. Physiological response to alterations in [O2] and [CO2]: relevance to respiratory protective devices. J. Int. Soc. Respir. Protect. 2010, 27, 27–51. [Google Scholar]
  11. Kajtar, L.; Herczeg, L.; Lang, E.; Hrustinszky, T.; Banhidi, L. Influence of carbon-dioxide pollutant on human well-being and work intensity. In Proceedings of the Healthy Buildings (HB 2006), Lisboa, Portugal, 4–8 June 2006; Volume I, pp. 85–90.
  12. Kajtar, L.; Herczeg, L.; Lang, E. Examination of influence of CO2 concentration by scientific methods in the laboratory. In Proceedings of the 7th International Conference (Healthy Buildings 2003), National University of Singapore, Singapore, 7–11 December 2003; Volume 3, pp. 176–181.
  13. Stankovic, A.; Alexander, D.; Oman, C.M.; Schneiderman, J. A Review of Cognitive and Behavioral Effects of Increased Carbon Dioxide Exposure in Humans. NASA Technical Paper; 2016. Available online: http://ntrs.nasa.gov/archive/nasa/casi.ntrs.nasa.gov/20160003872.pdf (accessed on 24 June 2016). [Google Scholar]
  14. Wargocki, P.; Wyon, D.P.; Sundell, J.; Clausen, G.; Fanger, P.O. The effects of outdoor air supply rate in an office on perceived air quality, Sick Building Syndrome (SBS) symptoms and productivity. Indoor Air 2000, 10, 222–236. [Google Scholar] [CrossRef] [PubMed]
  15. Apte, M.G.; Fisk, W.J.; Daisey, J.M. Associations between indoor (CO2) concentrations and sick building syndrome symptoms in US Office Buildings: an analysis of the 1994–1996 BASE Study Data (LBNL 44385). Indoor Air 2000, 10, 246–257. [Google Scholar] [CrossRef] [PubMed]
  16. Chao, H.J.; Schwartz, J.; Milton, D.K.; Burge, H.A. The work environment and workers’ health in four large office building. Environ. Health Perspect. 2003, 111, 1242–1248. [Google Scholar] [CrossRef] [PubMed]
  17. Tietjen, G.E.; Khubchandani, J.; Ghosh, S.; Bhattacharjee, S.; Kleinfelder, J. Headache symptoms and indoor environmental parameters: Results from the EPA BASE study. Ann. Indian Acad. Neurol. 2012, 15 (Suppl. S1), S95–S99. [Google Scholar] [PubMed]
  18. Mi, Y.-H.; Norbäck, D.; Tao, J.; Mi, Y.-L.; Ferm, M. Current asthma and respiratory symptoms among pupils in Shanghai, China: Influence of building ventilation, nitrogen dioxide, ozone, and formaldehyde in classrooms. Indoor Air 2006, 16, 454–464. [Google Scholar] [CrossRef] [PubMed]
  19. Simoni, M.; Annesi-Maesano, I.; Sigsgaard, T.; Norbäck, D.; Wieslander, G.; Nystad, W.; Canciani, M.; Sestini, P.; Viegi, G. School air quality related to dry cough, rhinitis and nasal patency in children. Eur. Respir. J. 2010, 35, 742–749. [Google Scholar] [CrossRef] [PubMed]
  20. Kim, J.L.; Elfman, L.; Wieslander, G.; Ferm, M.; Torén, K.; Norbäck, D. Respiratory health among Korean pupils in relation to home; school and outdoor environment. J. Korean Med. Sci. 2010, 26, 166–173. [Google Scholar] [CrossRef] [PubMed]
  21. ANSES. Concentrations de CO2 dans L’air Intérieur et Effets sur la Santé—De I’agence Nationale de Sécurité Sanitaire de L’alimentation, de L’environnement et du Travail, Maisons-Alfort. 2013. Available online: https://www.anses.fr/en/system/files/AIR2012sa0093Ra.pdf (accessed on 24 April 2016).
  22. GESTIS. Base de Données sur les Substances Dangereuses pour L’assurance Sociale Allemande des Accidents. France, 2013. Available online: http://www.dguv.de/ifa/en/gestis/stoffdb/index.jsp# (accessed on 4 May 2016).
  23. ASHRAE. Ashrae Habdbook: Heating, Ventilating, and Air-Conditioning Applications. 1999. Available online: http://www.hvac.amickracing.com/Miscellaneous/HVAC_Applications_Handbook-ASHRAE.pdf (accessed on 24 June 2016).
  24. OSHA. Technical Manual, TED 1–0.15A, Section VI, Chapter 2, 1999. Available online: www.osha.gov/dts/osta/otm/otm_vi/otm_vi_2.html#2 (accessed on 24 June 2016).
  25. HKEPD (Environmental Protection Department). Practice Note for Managing Air Quality in Air-Conditioned Public Transport Facilities 2015. Available online: http://www.epd.gov.hk/epd/sites/default/files/epd/english/resources_pub/publications/files/pn15_1.pdf (accessed on 24 June 2016).
  26. HKEPD (Environmental Protection Department). Practice Note for Managing Air Quality in Air-Conditioned Public Transport Facilities 2003. Available online: http://www.epd.gov.hk/epd/sites/default/files/epd/english/resources_pub/publications/files/pn03_1.pdf (accessed on 24 June 2016).
  27. Cooper, E.S.; West, J.W.; Jaffe, M.E.; Goldberg, H.I.; Kawamura, J.; McHenry, L.C., Jr. The relation between cardiac function and cerebral blood flow in stroke patients. 1. Effect of CO2 inhalation. Stroke 1970, 1, 330–347. [Google Scholar] [CrossRef] [PubMed]
  28. Beck, J.G.; Ohtake, P.J.; Shipherd, J.C. Exaggerated anxiety is not unique to CO2 in panic disorder: A comparison of hypercapnic and hypoxic challenges. J. Abnorm. Psychol. 1999, 108, 473–482. [Google Scholar] [CrossRef] [PubMed]
  29. Erdmann, C.A.; Apte, M.G. Mucous membrane and lower respiratory building related symptoms in relation to indoor carbon dioxide concentrations in the 100-building BASE dataset. Indoor Air 2004, 14 (Suppl. S8), 127–134. [Google Scholar] [CrossRef] [PubMed]
  30. Tsai, D.H.; Lin, J.S.; Chan, C.C. Office workers’ sick building syndrome and indoor carbon dioxide concentrations. J. Occup. Environ. Hyg. 2012, 9, 345–351. [Google Scholar] [CrossRef] [PubMed]
  31. Guais, A.; Brand, G.; Jacquot, L.; Karrer, M.; Dukan, S.; Grevillot, G.; Jo Molina, T.; Bonte, J.; Regnier, M.; Schwartz, L. Toxicity of carbon dioxide: A review. Chem. Res. Toxicol. 2011, 24, 2061–2070. [Google Scholar] [CrossRef] [PubMed]
  32. Institut National de Recherche et de Sécurité, Paris (INRS). Dioxyde de Carbone, Fiche Toxicologique FT 238. 2005. Available online: http://www.inrs.fr/accueil/produits/bdd/doc/fichetox.html?refINRS=FT%20238 (accessed on 24 May 2015).
  33. Deutsche Forschungsgemeinschaft [DFG]. Arsen und anorganische Arsenverbindungen. In Gesundheitsschadliche Arbeitsstoffe: Toxicologisch-Arbeitsmedizinische Begrun-Dungen von MAK-Werten, 35, Lieferung; Greim, H., Ed.; Wiley-VCH: Weinheim, Germany, 1999; pp. 1–50. (In German) [Google Scholar]
  34. Marquardt, H.; Schäfer, S.G. Lehrbuch der Toxikologie; BI-Wissenschaftsverlag, Mannheim, 1994. Available online: http://onlinelibrary.wiley.com/doi/10.1002/pauz.19970260416/abstract (accessed on 21 January 2016).
  35. Abolhassani, M.; Guais, A.; Chaumet-Riffaud, P.; Sasco, A.; Schwartz, L. Carbon dioxide inhalation causes pulmonary inflammation. Am. J. Physiol. Lung. Cell. Mol. Physiol. 2009, 296, L657–L665. [Google Scholar] [CrossRef] [PubMed]
  36. Olsen, B.W. Indoor Environment—Health, Comfort and Productivity. In Proceedings of the 8th REHVA World Congress (Clima 2005), Lausanne, Switzerland, 9–12 October 2005; Available online: http://citeseerx.ist.psu.edu/viewdoc/download?doi=10.1.1.524.6423&rep=rep1&type=pdf (accessed on 2 April 2016).
  37. Coley, D.A.; Beisteiner, A. Carbon dioxide levels and ventilation rates in schools. Int. J. Vent. 2002, 1, 45–52. [Google Scholar] [CrossRef]
  38. Satish, U.; Mendell, M.J.; Shekhar, K.; Hotchi, T.; Sullivan, D.; Streufert, S.; Fisk, W.B. Is CO2 an Indoor Pollutant? Direct Effects of Low-to-Moderate CO2 Concentrations on Human Decision-Making Performance. Environ. Health Perspect. 2012, 120, 1671–1677. [Google Scholar] [CrossRef] [PubMed]
  39. Twardella, D.; Matzen, W.; Lahrz, T.; Burghardt, R.; Spegel, H.; Hendrowarsito, L.; Frenzel, A.C.; Fromme, H. Effect of classroom air quality on students’ concentration: Results of a cluster-randomized cross-over experimental study. Indoor Air 2012, 22, 378–387. [Google Scholar] [CrossRef] [PubMed]
  40. Norbäck, D.; Nordström, K. An experimental study on effects of increased ventilation flow on students’ perception of indoor environment in computer classrooms. Indoor Air 2008, 18, 293–300. [Google Scholar] [CrossRef] [PubMed]
  41. Norbäck, D.; Wieslander, G.; Zhang, X.; Zhao, Z. Respiratory symptoms, perceived air quality and physiological signs in elementary school pupils in relation to displacement and mixing ventilation system: An intervention study. Indoor Air 2011, 21, 427–437. [Google Scholar] [CrossRef] [PubMed]
  42. Norbäck, D.; Nordström, K.; Zhao, Z. Carbon dioxide (CO2) demand-controlled ventilation in university computer classrooms and possible effects on headache, fatigue and perceived indoor environment: An intervention study. Int. Arch. Occup. Environ. Health 2013, 86, 199–209. [Google Scholar] [CrossRef] [PubMed]
  43. Smedge, G.; Mattsson, M.; Walinder, R. Comparing mixing and displacement ventilation in classrooms: Pupils’ perception and health. Indoor Air 2011, 21, 454–461. [Google Scholar]
  44. Grady, M.; Jung, H.; Kim, Y.; Park, J. Vehicle Cabin Air Quality with Fractional Air Recirculation, SAE Technical Paper. 2013. Available online: http://www.engr.ucr.edu/~heejung/publications/2013-CO2-exp.pdf (accessed on 29 June 2016).
  45. EIGA (European Industrial Gases Association). Carbon Dioxide Physiological Hazards—Not Just an Asphyxiant. Available online: https://www.eiga.eu/index.php?id=294&tx_abdownloads (accessed on 30 June 2016).
  46. Fisk, W.J.; Satish, U.; Mendell, M.J.; Hotchi, T.; Sullivan, D. Is CO2 an Indoor Pollutant? Higher Levels of CO2 May Diminish Decision Making Performance. ASHRAE J. 2013, 55, 84–85. [Google Scholar]
  47. Groeger, J.A. Understanding Driving: Applying Cognitive Psychology to a Complex Everyday Task; Psychology Press: Philadelphia, PA, USA, 2000. [Google Scholar]
  48. Michon, J.A. A critical view of driver behaviour models: What do we know, what should we do? In Human Behaviour and Traffic Safety; Evans, L., Schwing, R.C., Eds.; Plenum Press: New York, NY, USA, 1985; pp. 485–520. [Google Scholar]
Figure 1. The graph curve of carbon dioxide in time.
Sustainability 08 00852 g001
Figure 2. Amount of CO2 according to time span and number of people in a car with recirculated air.
Sustainability 08 00852 g002
Figure 3. Representation of general assessments of air quality at 5000 ppm (Tf).
Sustainability 08 00852 g003
Table 1. CO2 standards and guidelines for indoor spaces.
CO2 Values Regulated or Recommended
in Residencesin Classrooms
Belgium [21]500 ppm500 ppm
Netherlands [21]1000–1500 ppm1200 ppm
Finland [21]1200 ppm1200 ppm
UK-1500 ppm
US [23] (ASHRAE)1000 ppm1000 ppm
US [24] (OSHA)1000 ppm1000 ppm
ASHRAE—American Society of Heating, Refrigeration and Air Conditioning Engineers; OSHA—Occupational Safety and Health Administration.
Table 2. Numerical values of carbon dioxide for the two-level air quality guidelines established for ferries [25] and buses [26].
ParametersAir Quality Guidelines
Level 1Level 2
Carbon dioxide2500 ppm (4500 mg/m3)3500 ppm (6300 mg/m3)
Table 3. Potential effects, limitations and exposure limits in the case of a very high work rate and at rest [10].
At Rest (65 W·m2)Very, Very High Work Rate (400 W·m2)
ppm CO2Potential Effects and/or LimitationsExposure Limit (Time)Potential Effects and/or LimitationsExposure Limit (Time)
25,000Increase in ventilationunknownIncrease in ventilation2 h
30,000Increase in ventilation
No restrictions within the exposure limit
15 hIncrease in ventilation30 min
50,000Increase in ventilation
No restrictions within the exposure limit
8 hIncrease in ventilation
Collapse/unconsciousness
5 min
70,000Increase in ventilation
Severe limitations on activity
<30 minCollapse/unconsciousnessn/a
100,000Increased heart rate
Collapse/unconsciousness
<2.0 minCollapse/unconsciousnessn/a
Table 4. The averages and standard deviations for the time span necessary for the air within the cockpit to reach certain values of CO2 (stationary vehicle without the recirculation of air).
Stationary Vehicle without Recirculation the Air
Level of CO2 (ppm)Time in min/1 PersonTime in min/2 PersonsTime in min/3 PersonsTime in min/4 Persons
M1persSD1persM2persSD2persM3persSD3persM4persSD4pers
1.000T1 = 4.170.44T1 = 3.220.58T1 = 2.440.58T1 = 1.50.17
2.000T2 = 12.642.44T2 = 8.920.5T2 = 5.670.5T2 = 4.050.35
3.000T3 = 24.413.50T3 = 17.080.76T3 = 10.330.76T3 = 7.50.73
4.000T4 = 38.783.91T4 = 26.721.29T4 = 15.111.29T4 = 9.890.19
5.000T5 = 565.29T5 = 38.191.23T5 = 20.891.23T5 = 13.051.29
Table 5. Time (in seconds or minutes) needed for the air breathed by five persons to reach 10,000 ppm.
Level of CO2Time of MeasurementΔt (min) between 2 Levels of CO2Δt (s) 2 Levels of CO2T (s) CumulativeT (min + s) Cumulative
350 ppm09:46:4900.0000000 min
1000 ppm09:49:232 min 34 s1541542 min 34 s
2000 ppm09:51:292 min 06 s1262804 min 40 s
3000 ppm09:53:552 min 26 s1464267 min 06 s
4000 ppm09:56:212 min 26 s1465729 min 32 s
5000 ppm09:58:412 min 20 s14071211 min 52 s
6000 ppm10:01:372 min 58 s17889014 min 50 s
7000 ppm10:04:172 min 40 s160105017 min 30 s
8000 ppm10:07:253 min 08 s188123820 min 38 s
9000 ppm10:11:023 min 37 s217145524 min 15 s
10,000 ppm10:14:523 min 50 s230168528 min 05 s
min = minute; s = seconds.
Table 6. Minimum, maximum and average CO2, temperature and air humidity during the time in which the carbon dioxide level has risen from 350 to 10,000 ppm.
MaximumMinimumAverage
Carbon dioxide10,000 ppm350 ppm5174.5 ppm
Temperature29.20 °C24.20 °C26.8 °C
Humidity45.5030.3037.9
Table 7. The time during which the air breathed by the occupants of the vehicles reached certain values of carbon dioxide in the case of a stationary vehicle with recycled air.
Stationary Vehicle with Recycled Air
Level of CO2Time in min/1 PersonTime in min/2 PersonsTime in min/3 PersonsTime in min/4 Persons
(ppm)M1persAs1persM2persAs2persM3persAs3persM4persAs4pers
1.000T1 = 4.580.38T1 = 2.750.50T1 = 2.810.50T1 = 1.830.17
2.000T2 = 13.592.15T2 = 8.860.33T2 = 6.670.33T2 = 4.390.54
3.000T3 = 25.673.34T3 = 17.531.25T3 = 11.971.25T3 = 7.831.04
4.000T4 = 40.443.81T4 = 27.692.96T4 = 18.062.96T4 = 12.193.81
5.000T5 = 58.586.14T5 = 40.534.73T5 = 25.924.73T5 = 15.532.61
Table 8. Results of the Mann-Whitney test.
CriterionNMean RankSum of RanksTest Statistics
Mann-Whitney UWilcoxon WZAsymp. Sig. (2-Tailed)
Ti initial (pre-test)R (−)3030.50915.00450.000915.0000.0001.000
R (+)3030.50915.00
Tf final (post-test)R (−)3021.98659.50194.500659.500−4.0700.000
R (+)3039.021170.5
R (+): with recirculation; R (−): without recirculation.

