Article

A Global Perspective on the Sustainable Performance of Urbanization

1
School of Construction Management and Real Estate, Chongqing University, Chongqing 400045, China
2
International Research Center for Sustainable Built Environment, Chongqing University, Chongqing 400045, China
3
Department of Building & Real Estate, The Hong Kong Polytechnic University, Kowloon, Hong Kong, China
*
Author to whom correspondence should be addressed.
Sustainability 2016, 8(8), 783; https://doi.org/10.3390/su8080783
Submission received: 13 March 2016 / Revised: 26 July 2016 / Accepted: 5 August 2016 / Published: 11 August 2016
(This article belongs to the Special Issue Urban Resilience and Urban Sustainability: From Research to Practice)

Abstract

:
Urbanization, particularly in developing countries, is a major strategy for development. However, major concerns accompany it, such as air pollution, habitat destruction, and loss of arable land. In responding to these challenges, governments throughout the world have been implementing various policy mechanisms to guide the practice of urbanization towards sustainable development. It appears that there is little research investigating the outcomes of those efforts in implementing sustainable urbanization strategies. This paper provides a profile of sustainable urbanization from a global perspective. Data used for this research cover 111 countries and are collected from the World Bank database and the United Nation database. A ranking list of sustainable performance of urbanization between these countries is produced and discussed. The study suggests that countries at different stages of urbanization have achieved different levels of sustainable performance. The research results provide significant references for future study in the field of urbanization from a global perspective.

Graphical Abstract

1. Introduction

Urbanization has been identified as one of the most important strategies for development in the 21st century [1]. According to the World Bank [2], the ratio of urban populations at a global level has already exceeded 50% in 2007 and this will continue to rise in the coming decades according to the theory of Northam’s “S” curve [3]. Urbanization has been commonly recognized as producing many benefits, such as job opportunities, health facilities, infrastructure services, income increase, etc. [4,5]. However, it has been widely reported that the unprecedented rate of urbanization over the last few decades throughout the world has posed various drawbacks such as climate change, flood, loss of arable land, and pollution of natural resources [6,7,8,9,10]. For example, the research by Shen et al. [11] pointed out that during the recent urbanization process in China, more than 2 million farmers per year lost their farmland. There are still other problems brought about by improper urbanization. Schultz [12] and Swan [13] opined that the rapid urbanization process has induced serious flooding problems, especially in emerging countries. Dewan & Yamaguchi [14] investigated the relationship between rapid urban growth and flood disasters in Bangladesh, and concluded that urbanization has a significant association with flooding. Furthermore, Dewan et al. [15,16,17] developed a flood hazard map to reduce potential flood damage, and presented general flood hazard management strategies such as planning low development densities and strength drainage facilities, etc.
Urgent action is required to develop sustainable urbanization practices in order to address these challenges [18,19]. In line with this development, governments and various non-governmental organizations (NGOs) throughout the world have been increasingly introducing measures to guide the practices of urbanization towards better sustainability. Typical programs introduced for engaging sustainable practice during urbanization programs include the Urban Management Program of UN-Habitat [20], the UN’s Millennium Declaration [21], the Istanbul Declaration of the North Atlantic Treaty Organization (NATO) [22], the Hong Kong Planning Department’s HK2030 Study [23], Melbourne City Council’s City plan 2010 [24], the government of Singapore’s Green Plan [25], the government of Mexico City’s Plan Verde [26], and Iskandar Development Region’s Comprehensive Development Plan approved by the government of Malaysia [27]. The promotion of sustainable urbanization in previous years has led to many positive experiences, and it is considered that sharing and learning best practice between different countries can make significant contributions to the global mission of sustainable urbanization [28]. In order to share experiences of sustainable urbanization, there is a need for properly evaluating the performance of the implemented urbanization practices and identifying best practice. Other studies have also appreciated the importance of the evaluation of sustainability performance in order to identify weaknesses and problems in the practice of urbanization so that proper correction can be made [29].
In recent years, there has been significant development of methods, techniques, and tools for assessing sustainable performance during the urbanization process. Zhang [30] proposed a bi-dimensional matrix model to analyze the performance of environmental, social, and economic dimensions at different stages of urbanization. Shen et al. [31] established an elasticity coefficient model for capturing the dynamic nature of the urbanization process by employing two parameters, namely urbanization velocity (VµR) and sustainable urbanization velocity (VµS). Mori and Yamashita [32] presented a framework of City Sustainability Index (CSI) for assessing the sustainability performance of urbanization, where the indicators are selected across environmental, economic, and social dimensions to assess the performance of sustainable urbanization. Dewan and Corner [33] presented a way of using of remote sensing technology for estimating urban sprawl, growth, and urban structures. Xu and Coors [34] employed the techniques of Geographic Information System (GIS) and 3D visualization to assess the performance of urban development. Among these typical methods, it appears that the indicator-based approach is most commonly adopted to assess the performance of urbanization against goals and targets [35]. A report by the United Nations [36] suggests that indicator-based methods can help provide early warnings and effective information to prevent setbacks by taking measures in advance. The study by Ramos and Caeiro [37] opined that indicator-based methods can increase the accuracy of evaluation of the sustainable performance of urbanization. In agreement with this, Hiremath et al. [28] suggested that indicator-based methods can help demonstrate how well urbanization is implemented towards sustainable practice. Based on the above discussion, the indicator-based evaluation method is therefore adopted in this study to assess the sustainable urbanization performance from a global perspective.
There are various domains in examining sustainable urbanization; these apply different sets of indicators. For instance, Shen et al. [38] assessed the utility efficiency of metro infrastructure projects (MIP) in China from the perspective of sustainability performance by using five key indicator:, Population of city (POP), length of Metro systems (LEN), annual ridership of Metro systems (RID), ticket price (FAR), and gross domestic product (GDP). Weber and Puissant [39] examined the performance of sustainable development of Tunis Metropolitan Area by incorporating the land cover indicators. Dewan et al. [40] assessed the effect of urban expansion in Greater Dhaka on the promotion of sustainable urbanization. Weiland et al. [41] presented an indicator system for assessing the performance of sustainable land use in the process of urbanization in Santiago, Chile. Zhang et al. [42] established a quantitative model composed of 19 indicators for evaluating the efficiency of the urban infrastructure from the perspective of sustainable development.
Existing studies have also addressed ways of assessing sustainable performance of urbanization at national, regional, and local levels. For example, Shen and Zhou [1] examined the effectiveness of nine indicator-based systems introduced by the Chinese government, and revealed that the existing indicator systems have limitations when guiding sustainable urbanization in China. Hernández-Moreno and Hoyos-Martínez [43] assessed the sustainable performance of urbanization in Mexico City. Yigitcanlar et al. [44] introduced a multi-scalar indicator system to evaluate sustainable urbanization performance in Gold Coast, Australia. By using remotely sensed data collected with the assistance of GIS, Dewan et al. [45] analyzed the landscape fragmentation in Bangladesh for the period 1975–2005. Jensen [46] demonstrated the sustainability profiles between the districts in Copenhagen city by using a model composed of 20 main indicators across environmental, social, and environmental dimensions. Reddy and Balachandra [47] investigated the sustainable performance of urbanization development in India by using an indicator-based evaluation approach. Byomkesh et al. [48] evaluated the performance of urban green space in Bangladesh by employing a set of indicators.
The above suggests that while many studies have assessed the sustainable performance of urbanization at the national, regional, and local level, there is no study examining it from a global perspective. It is therefore the aim of this study to assess the sustainable performance of urbanization at a global level. In pursuing this research aim, focus is given to the sustainability performance of urbanization at a national level rather than an urban level, as performance at the urban level is unable to reflect the sustainable urbanization performance of a whole country. This study evaluates the sustainable performance of urbanization in 111 countries for which the relevant data for analysis are available from the World Bank and United Nations, etc. The reminder of the paper is organized as follows. Section 2 introduces methods of indicator selection, weighting establishment, and sustainable urbanization evaluation. Section 3 establishes the comprehensive and international indicator system, which can assess sustainable urbanization performance at the global level. Section 4 presents the evaluation results and a ranking list of sustainable urbanization performance across 111 countries. Section 5 discusses the evaluation results of sustainable urbanization performance from the performance ranking and global perspective, and further investigates the relationship between the urbanization process and sustainable urbanization performance. Finally, Section 6 summarizes the main findings of this research.

2. Research Methods

The research starts with understanding the principles of an effective indicator system for assessing the sustainable performance of urbanization. The design for effective indicators complies with the following primary principles [36,49,50]:
  • Maturity: The indicator system should be able to guide the practice of sustainable urbanization. Selected indicators in this study are from international practices and authoritative studies.
  • Measurability: The difficulty of collecting and quantifying the indicator data should be as low as possible to allow the effective use of the indicator. Data for all the indicators in use in this study can be collected through the UN Database or World Bank Database.
  • Independence: Indicators should be independent of each other, and overlap and autocorrelation between indicators should be avoided. Correlation analysis is therefore adopted to identify and remove those strongly correlated indicators.
  • Operability: The indicator system can be used for supporting calculation analysis of the sustainable performance of urbanization.

2.1. Correlation Analysis

The independence of indicators is the most important criteria in formulating an effective indicator system [40]. Correlation analysis is therefore conducted to check the independence of indicators. For this purpose, the Spearman correlation method is adopted. The effectiveness of the Spearman method is well appreciated for analyzing indicator independence [51,52,53]. Two variables are considered highly correlated if the value of their coefficient | r | > 0.8. In this case, one of them can be omitted [51].

2.2. Establishing Weighting Values between Indicators

Weighting values between indicators are important for conducting performance evaluation. There are a number of approaches for determining indicator weighting values, such as weighting assumption [54], the Analytic Hierarchy Process (AHP) [55], Delphi [56], and the Entropy method [57]. Among these methods, the Entropy method has been found effective in setting up weightings between a group of indicators. In particular, this method has been commonly appreciated for its advantage of determining the weighting values with no subjective influence, and is therefore used in this study, which engages four procedures [57].
(a)
Normalization for All Indicators
Assume that there are n independent indicators, and the period involved for evaluation is m years. As different indicators assume different dimensions and magnitudes, there is a need for normalization for all indicators.
For those positive indicators, a larger value indicates a better result, such as GDP per capita. Let P i j denotes the value of the indicator j in year i after normalization, v i j represents the original value of the indicator j in the year i, max ( v i j ) and min ( v i j ) are the maximum value and minimum value, respectively, for the indictor j for the surveyed period of m years. Then, the normalized value P i j can be calculated as follows:
P i j = v i j min ( v j ) max ( v j ) min ( v j )
For negative indicators, such as CO2 emissions, a smaller value indicates a better result. The normalized value in this case can be calculated as follows:
P i j = max ( v i ) v i j max ( v j ) min ( v j )
(b)
Standardization of Indicator Value
Let f i j stand for the standardized value of the indicator j in year i after normalization, which can be calculated as follows:
f i j = p i j i = 1 m p i j .
(c)
Entropy Value for Indicators
In applying the Entropy theory, an entropy value for each indicator needs to be obtained in order to establish the weighting value for individual indicators. In a circumstance where there are n indicators for assessment for a period of m years, the entropy value H j for indicator j is defined as follows:
H j = k i = 1 m f i j · ln f i j   i = 1 , 2 , 3 , n ,
where k = 1 ln m
(d)
Establishment of Weighting Values for All Indicators
The weight for the indicator j is defined as:
W j = 1 H j i = 1 m ( 1 H j ) .
Considering that W j may be given different values under different circumstances or in different countries, a general weight W j for indicator j is introduced for application under all circumstances in the countries concerned. For establishing the value of W j , the weighting value of the indicator j for a sample of u countries will be used. The value of W j is obtained as follows:
W j = x = 1 u W x j u ,
where Wxj denotes the weighting value of indicator j with reference to country x.

2.3. Evaluation of Sustainable Performance of Urbanization

Based on the established indicators and their weighting values, the next step of this study is to conduct an evaluation of sustainable urbanization performance between the 111 selected countries based on the following model [37]:
S U = S U E n + S U E c + S U S o ,
where S U denotes sustainable urbanization performance and S U E n , S U E c , and S U S o represent three dimensions of sustainability performance, namely environmental sustainability, economic sustainability, and social sustainability.
The index of each sustainability dimension is defined as follows:
S U E n = j ( E n ) = 1 n E n W j ( E n ) · P i j ( E n ) j ( E n ) = 1 , 2 , 3 n E n
S U E c = j ( E c ) = 1 n E c W j ( E c ) · P i j ( E c ) j ( E c ) = 1 , 2 , 3 n E c
S U S o = j ( S o ) = 1 n S o W j ( S o ) · P i j ( S o ) j ( S o ) = 1 , 2 , 3 n S o .
P i j ( E n ) , P i j ( E c ) , and P i j ( S o ) represent the normalization value of the indicator j in year i in view of the three perspectives (environmental, economic, and social development), where n E n , n E c , and n S o are the number of indicators measuring the performance in environmental, economic, and social sustainability, respectively; j(En), j(Ec) and j(So) are the indicators measuring environmental, economic, and social sustainability performance, respectively; and W j ( E n ) , W j ( E c ) , and W j ( S o ) denote the general weighting value of the indicator j in view of the three perspectives, respectively.
In this study, 111 countries are selected including developed and developing countries distributed across five continents, namely Africa, America, Asia, Europe, and Oceania. The surveyed period is 2000 to 2010.

3. Indicators for Measuring Sustainable Urbanization Performance

3.1. Candidate Indicators

There are a number of existing studies that present various indicator systems for examining urban development and sustainable urbanization. These typical indicator systems that function at an international level can be retrieved from the following sources.
  • Sample 1(S1): Urban indicator database [58]. The Urban Indicators Program of the United Nations Human Settlements Program (UN-Habitat) was established in 1988. The database helps individual countries design, collect, and apply policy-oriented urban indicators.
  • Sample 2(S2): United Nations Millennium Development Goals of Indicators [59]. In order to develop a more equal, healthy, sustainable world, leaders from 189 nations issued Millennium Development Goals (MDG); 60 indicators are defined in order to achieve these goals.
  • Sample 3(S3): Indicators of Sustainable Development [36]. The United Nations issued the indicators of Sustainable Development for guiding nations to better sustainable development.
  • Sample 4(S4): Shen et al. [60] developed a set of 115 indicators for examining the variations between different sustainable urbanization practices at an international level.
  • Sample 5(S5): The World Bank issued the World Development Indicators in 2012 [61]. These indicators are grouped under six themes: worldview, people, the environment, the economy, states and markets, and global links.
The differences can be appreciated between the above five sample indicator systems, both in numbers of indicators and classifications. Some indicators are labeled with the same name but classified in different dimensions in different indicator systems. For example, the indicator “population growth (annual %)” is classified under the environmental dimension in S4 and S1, while it is under the demographics dimension in S3 and S5.
With reference to the five sample indicator systems above, indicators for measuring sustainable performance of urbanization are selected if they appear in three or more sample indicator systems. As a result, 22 candidate indicators are selected under environmental, economic, and social categories, as shown in Supplementary Table S1.
Considering that different countries are at different development stages, it is debatable whether total emissions can be applied as an indicator for all countries. Therefore, the indicators “CO2 emissions” and “Consumption of ozone-depleting CFCs in ODP metric tons” in the environmental category are scaled per capita. Furthermore, population density is added as an additional indictor for measuring environmental performance. Consequently, a list of 23 candidate indicators is confirmed, as shown in Table 1.
Sustainable urbanization can be defined as “urbanization practice that complies with sustainable development principles that combines environmental, social, and economic sustainability” [4,62]. Although the candidate indicators in this study (as shown in Table 1 above) are selected with the frequency principle among the five indicator systems, our approach is considered consistent with the principle of sustainable urbanization. For example, Zhou et al. [19] agreed that urbanization is closely associated with environmental, economic, and social sustainability in a city, which are the key variables for assessing the performance of sustainable urbanization. For the environmental dimension, high environmental sustainability during the urbanization process is considered as being when population growth and human activity exert the least pressure on air, land, resources, and biodiversity [63,64]. As shown in Table 1, Shen et al. [60] and Scipioni et al. [65,66] selected the indicators carbon emissions and consumption (En1) of ozone-depleting (En2) to evaluate air quality. The performance of indicator forest area (En3) is used to assess the land protection [19,50], marine-protected areas (En4) are employed to monitor the biodiversity protection level, and the indicators Electric power consumption (En5), population growth (En6), and population density (En7) measure the pressure on resources [61,67]. For the economic dimension, good economic sustainability during urbanization is characterized by a high GDP level, strong economic development potential, strong labor markets, stable economic conditions, and modern technology [44,60]. As shown in Table 1, the GDP level can be measured as GDP per capita (Ec1). In addition, the research by Mason [68] opined that savings would contribute to economic growth, which in turn indicates that the indicators gross savings (Ec2) and adjusted net savings (Ec3) are applicable in monitoring the economic development potential. Nickell [69] revealed that the employment rate (Ec4) is an important variable that reflects the quality of labor markets. As Pradhan et al. [70] pointed out, the inflation rate (Ec5) can reflect the stability of economic development. Furthermore, the indicators Internet users (Ec6), fixed telephone lines (Ec7), and mobile cellular telephone subscribers (Ec8) are usually applied to evaluate modern technology [11,61]. For the social dimension, a sustainable society is characterized by equal education, comprehensive medical treatment, social safety, and modern infrastructure [1,19]. Sharma [71] used the indicators of school enrollment (So1) and ratio of female to male primary enrollment (So2) to monitor equal access to education and gender discrimination. The values of life expectancy at birth (So3), incidence of tuberculosis (So4), and mortality rate (So5) can reflect the comprehensive medical treatment level [60]. The research by Semyonov et al. [72] adopted the intentional homicide rate (So6) to represent the crime rate, which can be used to assess social safety. The indicators improved water source (So7) and improved sanitation facilities (So8) are included in the World Bank indicator system to evaluate the modern infrastructure level. Therefore, in this study, the confirmed candidate indicators shown in Table 1 are validated, enabling us to measure these sustainable urbanization requirements.

3.2. Selection of Indicators

A Spearman correlation analysis is conducted to select indicators from the 23 candidates for further analysis. As mentioned before, correlation analysis ensures the independence of the selected indicators. The correlation analysis is conducted for three dimensions of indicators separately, using the statistics package SPSS 20.
The data used for the correlation analysis give the performance of all the candidate indicators listed in Table 2 for the period 2000 to 2010 in 111 selected countries. The sources for these performance data are two worldwide databases, the United Nation Database [73] and the World Bank Database [2]. By using the data collected, the Spearman correlation analysis is conducted and the correlation results are shown in Supplementary Table S2–S4.
As shown in Supplementary Table S2, all the indicators in the environmental dimension are independent according to the rule of judgment ( | r | < 0.8), as addressed before. The data in Supplementary Table S3 demonstrate that there are strong correlations between economic indicators Ec1 & Ec6, Ec1 & Ec7, and Ec2 & Ec4. Therefore, the indicators Ec4, Ec6, and Ec7 are omitted. The remaining five economic indicators will be applied for further analysis. Furthermore, the data in Supplementary Table S4 suggest that there are strong correlations between So3 & So4, So3 & So5, and So7 & So8. Therefore, the indicators So4, So5, and So7 are omitted from the list. As a result, 17 independent indicators are selected for further analysis, as shown in Table 2.

4. Analysis Results of Sustainable Urbanization Performance among the Selected Countries

By using the 17 indicators confirmed in Table 2 in the analytical models defined in the methodology section, the performance of sustainable urbanization in various countries can be calculated.
The weighting values between the 17 indicators need to be established firstly. As discussed in the methodology section in referring to Model (6), a general weighing value for individual indicators will be established for application to all selected countries. The computation for the general weight is through the Entropy method, which involves a complicated process of applying Models (1)–(6). The final results of the weighting values for the 17 indicators are shown in Table 3.
By applying Equations (7)–(10), further calculations are conducted for each selected country to determine the performance of sustainable urbanization, environmental sustainability, economic sustainability, and social sustainability, respectively. The analysis results are shown in Supplementary Table S5.

5. Discussion

The discussion is conducted in three parts, including the performance ranking, a global perspective on the sustainable performance of urbanization, and the relationship between sustainable performance and the urbanization rate.

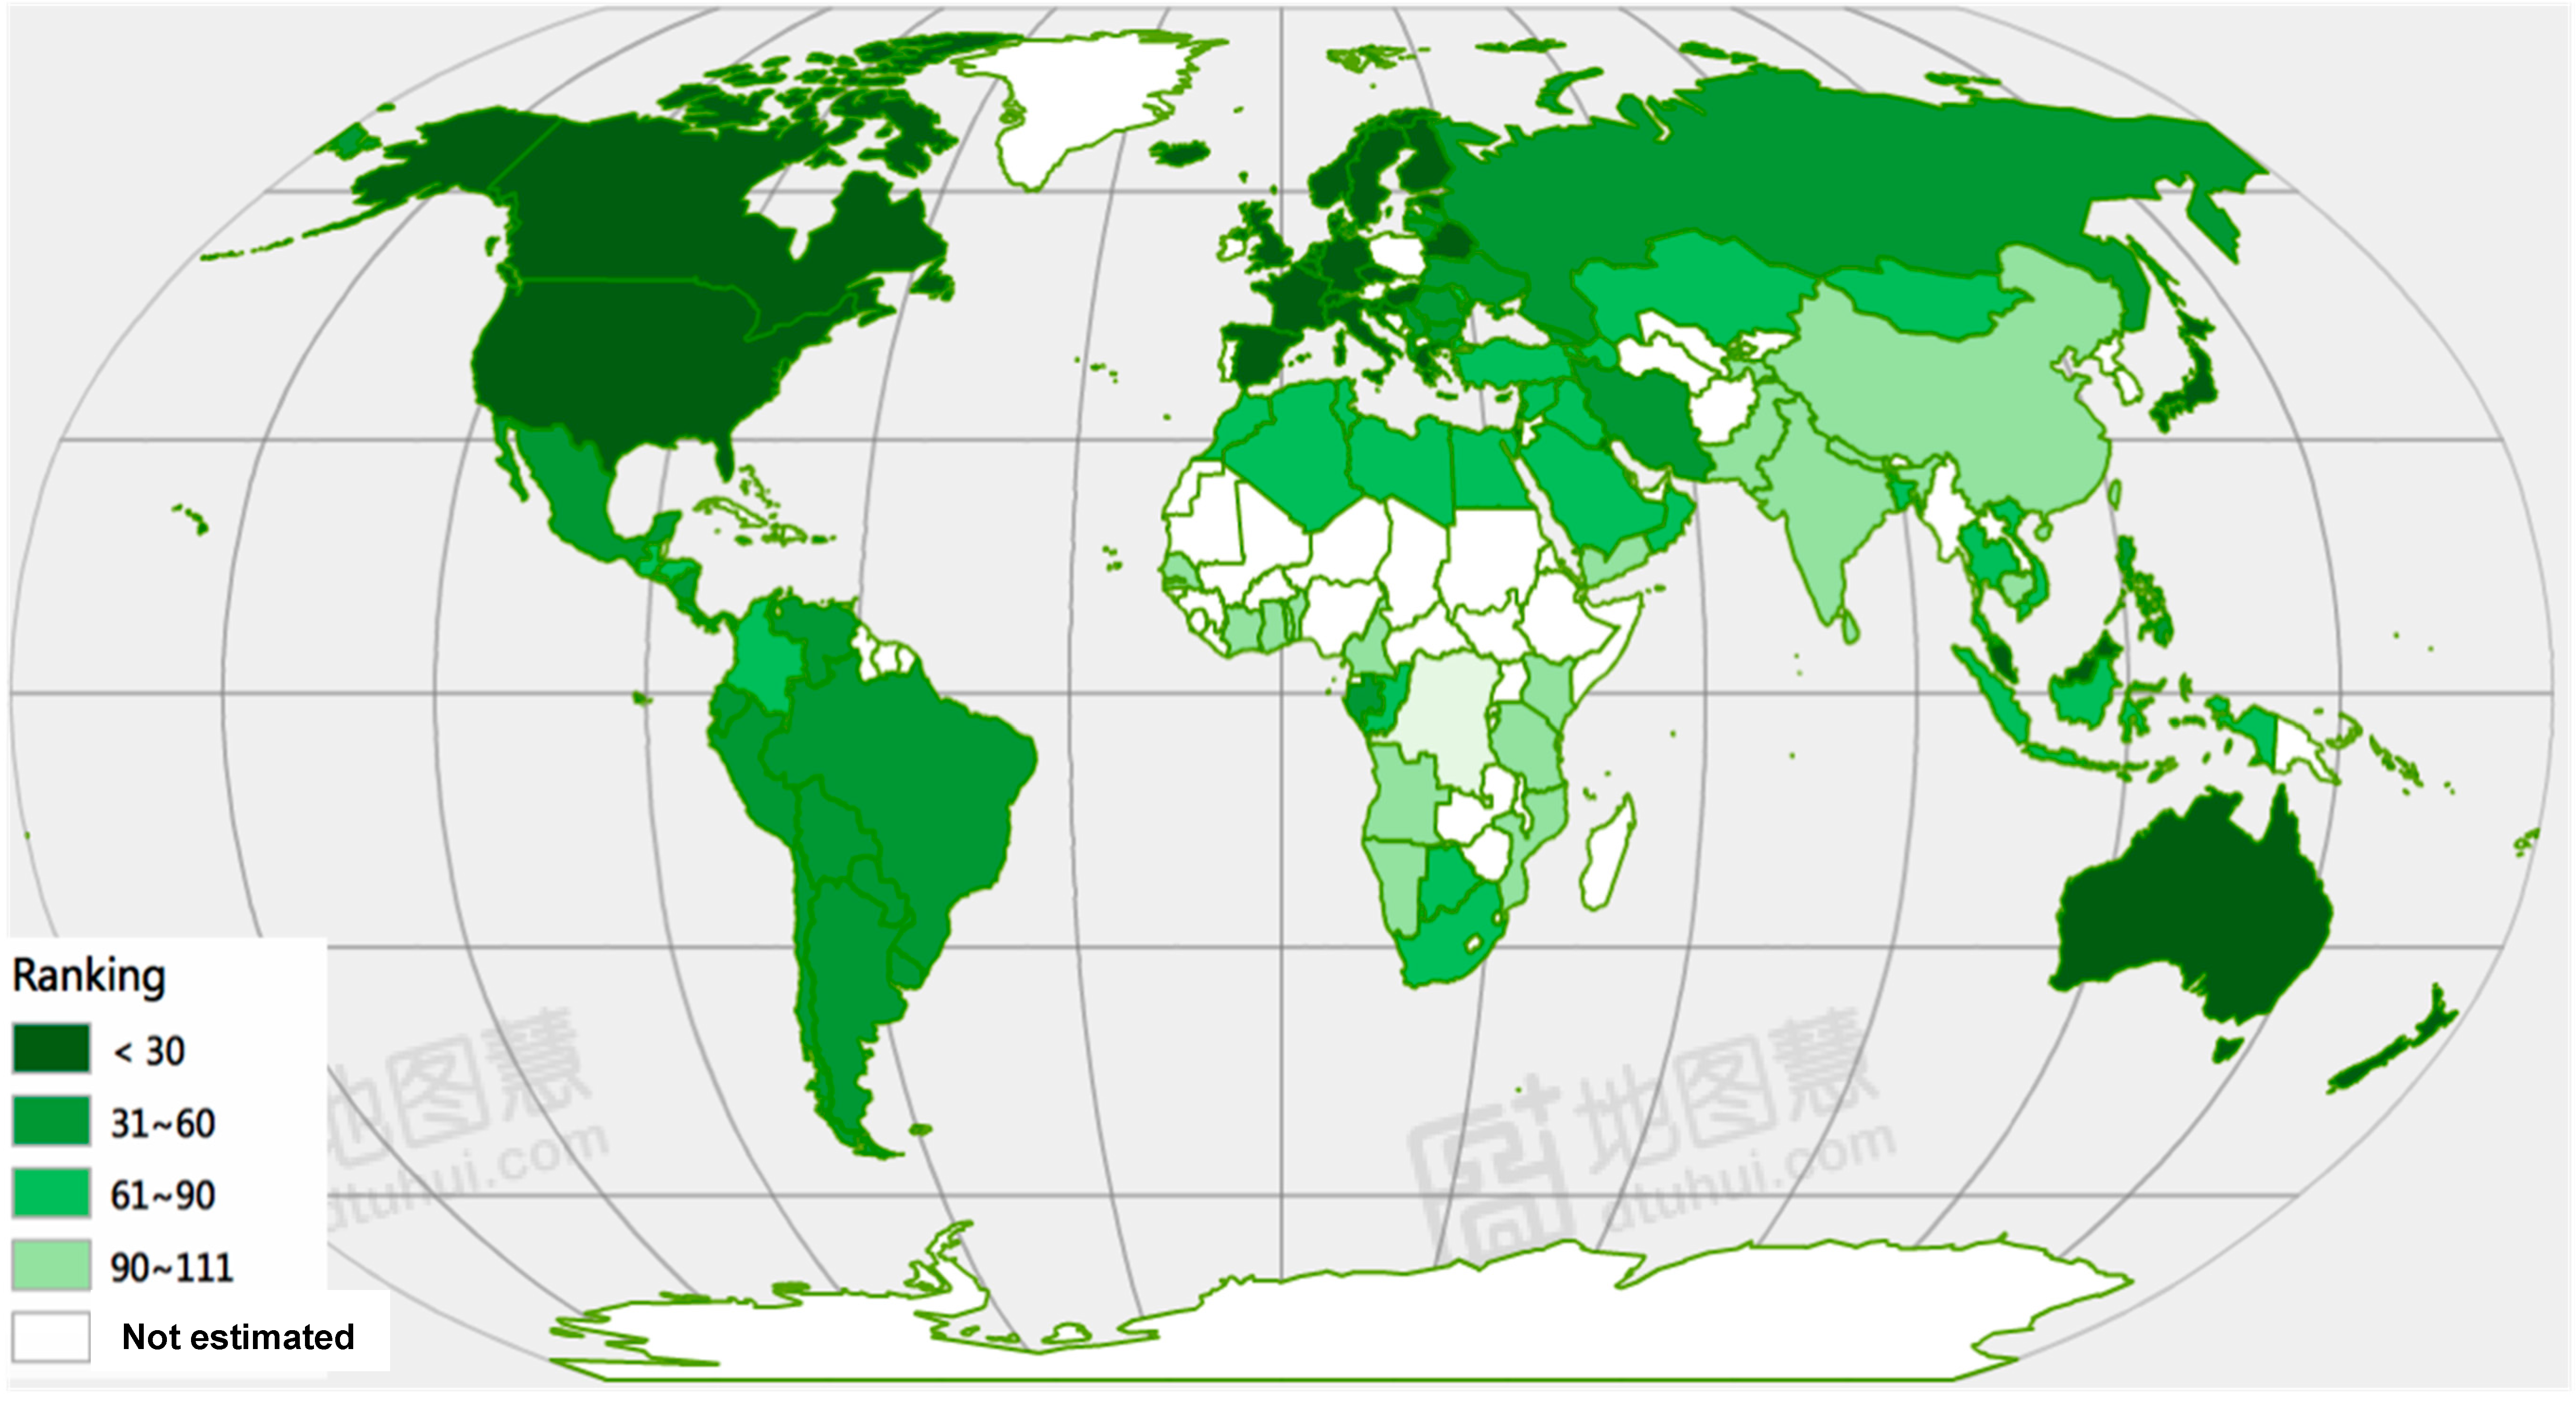
5.1. The Ranking on Sustainable Urbanization Performance

In referring to the column SU (rank) in Supplementary Table S5, the selected countries are ranked according to their overall performance in implementing sustainable urbanization, with the top five performers being Sweden, Norway, Germany, the Netherlands, and Demark, and the five worst countries being Mozambique, Nigeria, Togo, Yemen, and the Democratic Republic of the Congo. However, this ranking will be different if consideration is given to the three sustainability dimensions separately. For example, in the environmental dimension, the top five performers are Norway, Sweden, Romania, Denmark, and Germany, and the worst five are Nigeria, Tajikistan, Saudi Arabia, India, and Syria. It is interesting to note that Romania is the only developing country among the five countries with the best environmental sustainability. The study by Constantin [74] explained that the good environmental sustainability performance of Romania is due to a series of environmental protection strategies implemented at the regional level in the long run. For example, Teodorescu [75] explained that in Romania there is a national plan to improve the sustainability of the environment by protecting and creating green spaces in urban areas. Nistoreanu [76] pointed out that the Romanian government has been devoting efforts to the promotion of ecotourism by protecting environmental resources such as fresh air and forests. On the other hand, when the economic dimension is considered, Luxembourg, the Netherlands, Sweden, Switzerland, and Norway are the best five, and the Democratic Republic of the Congo, Mozambique, Yemen Namibia, and Tajikistan are the five poorest. Furthermore, from the perspective of social sustainability, Singapore, Germany, Switzerland, Sweden, and Japan are the best five, while the Democratic Republic of the Congo, Cote d’Ivoire, Angola, Togo, and Mozambique are the worst five.
The analysis results demonstrate that better sustainability performance is gained from good coordination between economic, social, and environmental dimensions during the urbanization process. There are countries that appear in the lower ranks because they focus on one dimension without giving proper attention to the interaction of all three. For example, Romania is ranked as one of the best in environmental sustainability but is positioned 38th in overall sustainable urbanization performance. On the contrary, Sweden is not a frontrunner in any one dimension of performance, but its overall sustainable performance is the best, indicating that Sweden has been practicing the best balance between the three sustainability dimensions.
The overall worst performing countries are mainly the least developed countries in Africa. They are not only poor in performing the three dimensions individually, but also very poor in coordinating the development between the three dimensions. In any case, they are far behind the developed countries.

5.2. A Global Perspective on the Sustainable Performance of Urbanization

The selected countries in the study can be classified into four groups according to their overall sustainable performance of urbanization: very good countries are ranked between 1 and 30, good are ranked between 31 and 60, poor are ranked between 61 and 90, and very poor are ranked between 91 and 111. Such a classification can be demonstrated in the map of Figure 1.
It can be seen from Figure 1 that most of the countries in the “very good” group are in Europe. In other words, Europe is the best region from the perspective of overall sustainable performance of urbanization. Sustainable development has been effectively implemented in Europe, as echoed by the study of Rotmans et al. [77], which found that sustainable development has been recognized as the basic development principle in Europe, and various projects have been implemented to promote sustainable development. The countries in Asia are in various performing groups, with some “good” and some “poor.” For example, Japan, the most developed country in Asia, is ranked 8th among all the surveyed countries. Thailand, renowned for its tourism, is ranked in the good group. Indonesia, the biggest island country in Asia, is ranked in the poor group. China, the country with the largest population, is ranked in the very poor group. While the countries in the Americas and Oceania are not as good as those in Europe, their sustainable performance of urbanization is generally considered good with the exception of a few poor ones. Most of the African countries are in the “very poor” group from the viewpoint of overall sustainable urbanization performance.

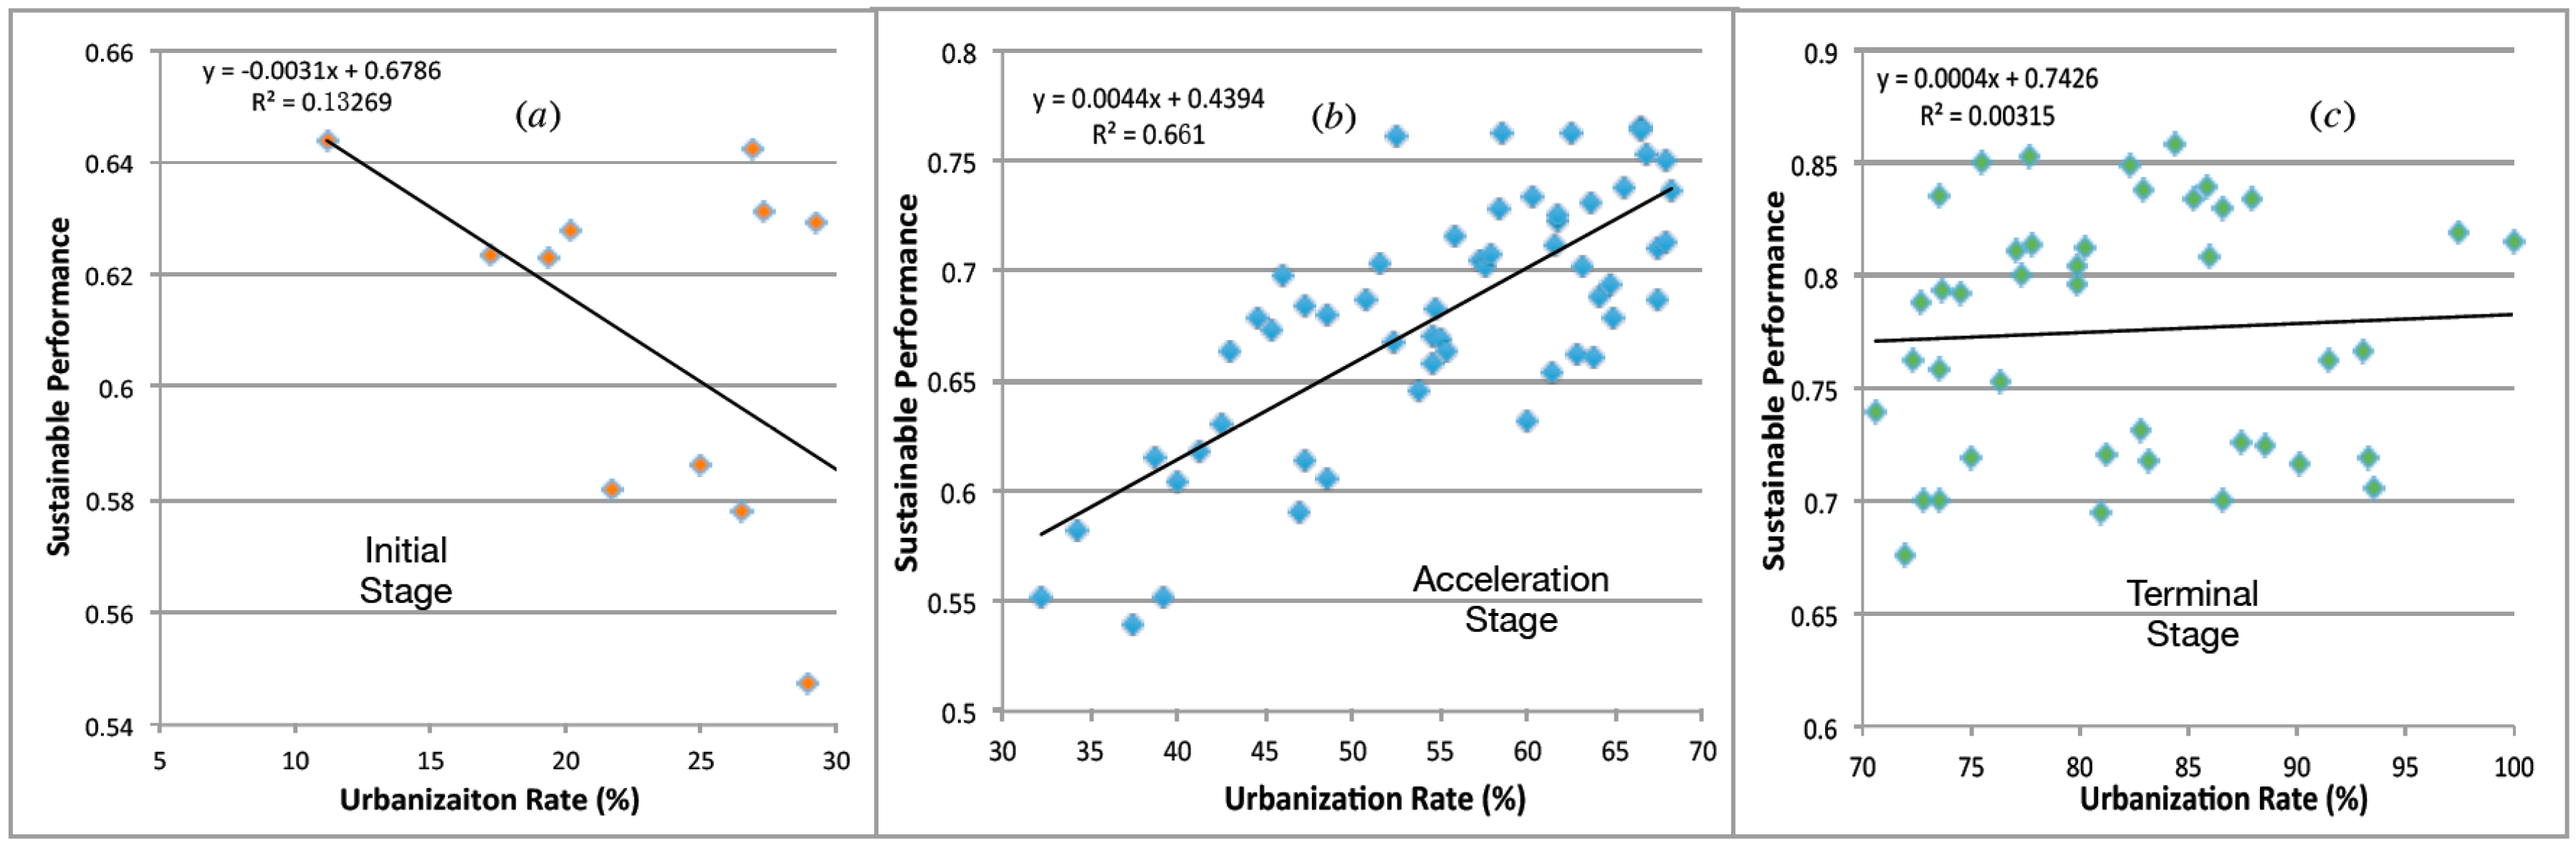
5.3. Relationship between Sustainable Performance and Urbanization Rate

According to Northam’s Theory [3], the urbanization process is depicted as an “S” curve, including an initial stage, an acceleration stage, and a terminal stage. The initial stage has a slow pace until the urbanization rate reaches about 30%. The acceleration stage begins with a pronounced pace. Urbanization reaches the terminal stage when the ratio of the urban population is over 70%. It is considered that sustainable performance will be different when an urbanization process is at a different stage. For supporting this argument, a regression analysis is conducted using the data for sustainable urbanization performance in Supplementary Table S5 and the urbanization rate collected from the World Bank database. Figure 2a–c illustrate the regression analysis results between sustainable performance and urbanization rate.
According to Figure 2a, there is a negative correlation between urbanization rate and sustainable performance when urbanization is at an initial stage, with an R-squared value of 0.292. This is echoed in the study by Henderson [78], who points out that urbanization at an initial stage is economy-driven, with little attention to environmental and social sustainability. Shen et al. [31] also suggested that in the initial urbanization stage, the urbanization rate is low, and therefore the influence of urbanization on economic and social development is limited. This explains why the sustainable urbanization performance is poor in those countries where urbanization is at an initial stage.
Nevertheless, according to Figure 2b, there is a strong positive correlation between the urbanization rate and sustainable performance when urbanization is at the acceleration stage, with an R-squared value of 0.641. At this stage, urbanization can bring better sustainability performance. The social benefits and economic development brought by urbanization in this stage are particularly obvious. As opined by Dyson [79], urbanization at the acceleration stage can provide new opportunities and update the industrial structure to improve social services and promote economic development. This echoes the argument raised before that urbanization, particularly in developing countries, is a major national strategy for promoting social and economic sustainable development. Furthermore, Figure 2c suggests that there is no significant correlation between urbanization rate and sustainable performance when urbanization is at the terminal stage. It is considered that there is limited driving force for further development when an urbanization process is almost complete in a specific place. Under such circumstances, problems may arise such as obsolescent urban infrastructure, unemployment, shortage of resources, damage to the environment, and so on. Some countries at this stage may nevertheless be able to incorporate rehabilitation and redevelopment strategies for enabling sustainable development in urbanized areas.

6. Conclusions

This paper measures the sustainable urbanization performance from a global perspective. The results suggest that the best performers in terms of overall sustainable urbanization during the surveyed period are Sweden, Norway, Germany, the Netherlands, and Denmark. The best performers are mainly developed countries in Europe. Other good performers include Brazil, Romania, and Thailand. Poor performers are mainly distributed in Africa and Asia. The regression analysis in the study suggests that there is a negative correlation between urbanization rate and sustainable performance when urbanization is at the initial stage, and a positive correlation when urbanization is at the acceleration stage. There is no significant correlation between urbanization rate and sustainable performance if the urbanization is completed.
The two major take-home messages of this study can be summarized as follows. Firstly, it is imperative to pursue development that is balanced between economic, environmental, and social dimensions in order to achieve better sustainability performance during the urbanization process. Many countries with poor sustainable performance are found to be interested in only one dimension and not giving sufficient attention to the others. Take China as an example: its urbanization is typically economy-driven, giving less attention to environmental protection. Secondly, it is important to share best practice in sustainable urbanization between various countries. In general, developed countries perform better on sustainable performance than developing countries. Sharing these good experiences particularly among less developed countries will make effective contributions to the global mission of sustainable development. In this context, developed countries can assist poor-performing countries by sharing knowledge and management skills in the process of urbanization. In future studies, this research team will investigate mechanisms for effectively promoting experience-sharing in practicing sustainable urbanization between different countries.

Supplementary Materials

The following are available online at www.mdpi.com/2071-1050/8/8/783/s1, Table S1: Candidate indicators for measuring sustainable performance of urbanization, Table S2: Correlation coefficients between seven environmental indicators for the period 2000–2010, Table S3: Correlation coefficients between eight economic indicators for the period 2000–2010, Table S4: Correlation coefficients between eight social indicators for the period 2000–2010, Table S5: The sustainable performance of urbanization—a global perspective.

Acknowledgments

This work was supported by the Social Science Foundation of China under Grant No. “15BJY038” and “15AZD025”. The authors would like to thank the anonymous reviewers for their valuable comments, which greatly helped us to clarify and improve the contents of the paper.

Author Contributions

All authors contributed equally to the designed research, researched and analyzed the data, and wrote the paper. All authors have read and approved the final manuscript.

Conflicts of Interest

The authors declare no conflict of interest.

References

  1. Shen, L.; Zhou, J. Examining the effectiveness of indicators for guiding sustainable urbanization in China. Habitat Int. 2014, 44, 111–120. [Google Scholar] [CrossRef]
  2. World Bank. Available online: http://data.worldbank.org/indicator/SP.URB.TOTL.IN.ZS/countries/1W?display=graph (accessed on 2 June 2015).
  3. Northam, R.M. Urban Geography; John Wiley & Sons: London, UK, 1979. [Google Scholar]
  4. Zhou, J.; Zhang, X.; Shen, L. Urbanization bubble: Four quadrants measurement model. Cities 2015, 46, 8–15. [Google Scholar] [CrossRef]
  5. Larson, K.L.; White, D.D.; Gober, P.; Wutich, A. Decision-Making under Uncertainty for Water Sustainability and Urban Climate Change Adaptation. Sustainability 2015, 7, 14761–14784. [Google Scholar] [CrossRef]
  6. Childers, D.L.; Cadenasso, M.L.; Grove, J.M.; Marshall, V.; McGrath, B.; Pickett, S.T.A. An ecology for cities: A transformational nexus of design and ecology to advance climate change resilience and urban sustainability. Sustainability 2015, 7, 3774–3791. [Google Scholar] [CrossRef]
  7. Dewan, A.M.; Kabir, M.H.; Nahar, K.; Rahman, M.Z. Urbanisation and environmental degradation in Dhaka Metropolitan Area of Bangladesh. Int. J. Environ. Sustain. Dev. 2012, 11, 118–147. [Google Scholar] [CrossRef]
  8. Squires, G.D. Urban Sprawl: Causes, Consequences, & Policy Responses; The Urban Insitute: Washington, DC, USA, 2002. [Google Scholar]
  9. Johnson, M.P. Environmental impacts of urban sprawl: A survey of the literature and proposed research agenda. Environ. Plan. A 2001, 33, 717–735. [Google Scholar] [CrossRef]
  10. Yigitcanlar, T.; Teriman, S. Rethinking sustainable urban development: towards an integrated planning and development process. Int. J. Environ. Sci. Technol. 2015, 12, 341–352. [Google Scholar] [CrossRef]
  11. Shen, L.; Zhou, J.; Skitmore, M.; Xia, B. Application of a hybrid Entropy–McKinsey Matrix method in evaluating sustainable urbanization: A China case study. Cities 2015, 42, 186–194. [Google Scholar] [CrossRef]
  12. Schultz, B. Flood management under rapid urbanisation and industrialisation in flood-prone areas: A need for serious consideration. Irrig. Drain. 2006, 55. [Google Scholar] [CrossRef]
  13. Swan, A. How increased urbanisation has induced flooding problems in the UK: A lesson for African cities? Phys. Chem. Earth Parts A/B/C 2010, 35, 643–647. [Google Scholar] [CrossRef]
  14. Dewan, A.M.; Yamaguchi, Y. Effect of Land Cover Changes on Flooding: Example from Greater Dhaka of Bangladesh. Int. J. Geoinform. 2008, 4, 11–12. [Google Scholar]
  15. Dewan, A.M.; Islam, M.M.; Kumamoto, T.; Nishigaki, M. Evaluating flood hazard for land-use planning in Greater Dhaka of Bangladesh using remote sensing and GIS techniques. Water Resour. Manag. 2007, 21, 1601–1612. [Google Scholar] [CrossRef]
  16. Dewan, A.M.; Kumamoto, T.; Nishigaki, M. Flood hazard delineation in greater Dhaka, Bangladesh using an integrated GIS and remote sensing approach. Geocarto Int. 2006, 21, 33–38. [Google Scholar] [CrossRef]
  17. Dewan, A.M.; Humayun Kabir, M.; Monirul Islam, M.; Kumamoto, T.; Nishigaki, M. Delineating flood risk areas in Greater Dhaka of Bangladesh using geoinformatics. Georisk 2007, 1, 190–201. [Google Scholar] [CrossRef]
  18. Yigitcanlar, T. Smart cities: an effective urban development and management model? Aust. Plan. 2015, 52, 27–34. [Google Scholar] [CrossRef]
  19. Zhou, J.; Shen, L.; Song, X.; Zhang, X. Selection and modeling sustainable urbanization indicators: A responsibility-based method. Ecol. Indic. 2015, 56, 87–95. [Google Scholar] [CrossRef]
  20. UN-Habitat, Urban Management Programme (UMP). Available online: http://www.unhabitat.org/categories.asp?catid=374 (accessed on 5 October 2012).
  21. United Nations. United Nations Millennium Declaration: Resolution; UN: New York, NY, USA, 2000. [Google Scholar]
  22. North Atlantic Treaty Organization (NATO), 2004 Istanbul Summit. Available online: https://en.wikipedia.org/wiki/2004_Istanbul_summit (accessed on 8 August 2016).
  23. Hong Kong Planning Department, Hong Kong 2030—Planning Vision and Strategy, 2007. Available online: http://www.epd.gov.hk/epd/SEA/eng/file/ExecutiveSummary(Eng).pdf (accessed on 8 August 2016).
  24. Melbourne City Council, City Plan 2010—Towards a Thriving and Sustainable City. Available online: http://www.melbourne.vic.gov.au/rsrc/PDFs/Publications/CityPlan2010_part1.pdf (accessed on 18 July 2015).
  25. Plan, S.G. Beyond Clean and Green towards Environmental Sustainability; Ministry of the Environment and Water Resources: Singapore, 2012.
  26. Mexico City Government, Green Plan “Plan Verde”. Available online: http://www.dac.dk/en/dac-cities/sustainable-cities/all-cases/social-city/mexico-city-successful-environmental-management/ (accessed on 8 August 2016).
  27. Iskandar Regional Development Authority, Comprehensive Development Plan for Iskandar Malaysia. Avaialbe online: https://en.wikipedia.org/wiki/Iskandar_Malaysia#Comprehensive_Development_Plan_.28CDP.29 (accessed on 8 August 2016).
  28. Shen, L.-Y.; Ochoa, J.J.; Zhang, X.; Yi, P. Experience mining for decision making on implementing sustainable urbanization—An innovative approach. Autom. Constr. 2013, 29, 40–49. [Google Scholar] [CrossRef]
  29. Moussiopoulos, N.; Achillas, C.; Vlachokostas, C.; Spyridi, D.; Nikolaou, K. Environmental, social and economic information management for the evaluation of sustainability in urban areas: A system of indicators for Thessaloniki, Greece. Cities 2010, 27, 377–384. [Google Scholar] [CrossRef]
  30. Zhang, X. Sustainable urbanization: A bi-dimensional matrix model. J. Clean. Prod. 2015, 134, 425–433. [Google Scholar] [CrossRef]
  31. Shen, L.; Peng, Y.; Zhang, X.; Wu, Y. An alternative model for evaluating sustainable urbanization. Cities 2012, 29, 32–39. [Google Scholar] [CrossRef]
  32. Mori, K.; Yamashita, T. Methodological framework of sustainability assessment in City Sustainability Index (CSI): A concept of constraint and maximisation indicators. Habitat Int. 2015, 45, 10–14. [Google Scholar] [CrossRef]
  33. Dewan, A.M.; Corner, R.J. Spatiotemporal analysis of urban growth, sprawl and structure. In Dhaka Megacity; Springer: Berlin, Germany, 2014; pp. 99–121. [Google Scholar]
  34. Xu, Z.; Coors, V. Combining system dynamics model, GIS and 3D visualization in sustainability assessment of urban residential development. Build. Environ. 2012, 47, 272–287. [Google Scholar] [CrossRef]
  35. Zhou, J.Y.; Shen, L.Y.; Ren, W.J.; Rong, W. Comparative study on sustainable urban development indicator systems in China. Jian She Guan Li Guo Ji Xue Bao 2013, 1, 29–48. [Google Scholar]
  36. United Nations. Indicators of Sustainable Development: Guidelines and Methodologies; United Nations Publications: New York, NY, USA, 2007. [Google Scholar]
  37. Ramos, T.B.; Caeiro, S. Meta-performance evaluation of sustainability indicators. Ecol. Indic. 2010, 10, 157–166. [Google Scholar] [CrossRef]
  38. Shen, L.; Jiao, L.; He, B.; Li, L. Evaluation on the utility efficiency of metro infrastructure projects in China from sustainable development perspective. Int. J. Proj. Manag. 2015, 33, 528–536. [Google Scholar] [CrossRef]
  39. Weber, C.; Puissant, A. Urbanization pressure and modeling of urban growth: Example of the Tunis Metropolitan Area. Remote Sens. Environ. 2003, 86, 341–352. [Google Scholar] [CrossRef]
  40. Dewan, A.M.; Yamaguchi, Y. Land use and land cover change in Greater Dhaka, Bangladesh: Using remote sensing to promote sustainable urbanization. Appl. Geogr. 2009, 29, 390–401. [Google Scholar] [CrossRef]
  41. Weiland, U.; Kindler, A.; Banzhaf, E.; Ebert, A.; Reyes-Paecke, S. Indicators for sustainable land use management in Santiago de Chile. Ecol. Indic. 2011, 11, 1074–1083. [Google Scholar] [CrossRef]
  42. Zhang, X.; Wu, Y.; Skitmore, M.; Jiang, S. Sustainable infrastructure projects in balancing urban-rural development: Towards the goal of efficiency and equity. J. Clean. Prod. 2014, 107, 445–454. [Google Scholar] [CrossRef]
  43. Hernández-Moreno, S.; De Hoyos-Martínez, J. Indicators of urban sustainability in Mexico. Theor. Empir. Res. Urban Manag. 2010, 7, 46–60. [Google Scholar]
  44. Yigitcanlar, T.; Dur, F.; Dizdaroglu, D. Towards prosperous sustainable cities: A multiscalar urban sustainability assessment approach. Habitat Int. 2015, 45, 36–46. [Google Scholar] [CrossRef]
  45. Dewan, A.M.; Yamaguchi, Y.; Rahman, M.Z. Dynamics of land use/cover changes and the analysis of landscape fragmentation in Dhaka Metropolitan, Bangladesh. GeoJournal 2012, 77, 315–330. [Google Scholar] [CrossRef]
  46. Jensen, J.O. Sustainability profile for urban districts in Copenhagen. In Proceedings of the Sustainable Cities and Regions: Enabling Vision or Empty Talk? Örebro, Sweden, 11–13 March 2009.
  47. Reddy, B.S.; Balachandra, P. Benchmarking Urban Sustainability—A Composite Index for Mumbai and Bangalore; Indira Gandhi Institute of Development Research: Mumbai, India, 2013. [Google Scholar]
  48. Byomkesh, T.; Nakagoshi, N.; Dewan, A.M. Urbanization and green space dynamics in Greater Dhaka, Bangladesh. Landsc. Ecol. Eng. 2012, 8, 45–58. [Google Scholar] [CrossRef]
  49. Haghshenas, H.; Vaziri, M. Urban sustainable transportation indicators for global comparison. Ecol. Indic. 2012, 15, 115–121. [Google Scholar] [CrossRef]
  50. Li, F.; Liu, X.; Hu, D.; Wang, R.; Yang, W.; Li, D.; Zhao, D. Measurement indicators and an evaluation approach for assessing urban sustainable development: A case study for China’s Jining City. Landsc. Urban Plan. 2009, 90, 134–142. [Google Scholar] [CrossRef]
  51. Schwarz, N. Urban form revisited—Selecting indicators for characterising European cities. Landsc. Urban Plan. 2010, 96, 29–47. [Google Scholar] [CrossRef]
  52. Recanatesi, F.; Clemente, M.; Grigoriadis, E.; Ranalli, F.; Zitti, M.; Salvati, L. A Fifty-Year Sustainability Assessment of Italian Agro-Forest Districts. Sustainability 2015, 8, 32. [Google Scholar] [CrossRef]
  53. Lasage, R.; Muis, S.; Sardella, C.S.E.; van Drunen, M.A.; Verburg, P.H.; Aerts, J.C.J.H. A Stepwise, Participatory Approach to Design and Implement Community Based Adaptation to Drought in the Peruvian Andes. Sustainability 2015, 7, 1742–1773. [Google Scholar] [CrossRef]
  54. Cheung, W.W.; Pitcher, T.J.; Pauly, D. A fuzzy logic expert system to estimate intrinsic extinction vulnerabilities of marine fishes to fishing. Biol. Conserv. 2005, 124, 97–111. [Google Scholar] [CrossRef]
  55. Zhao, H.; Li, N. Performance Evaluation for Sustainability of Strong Smart Grid by Using Stochastic AHP and Fuzzy TOPSIS Methods. Sustainability 2016, 8, 129. [Google Scholar] [CrossRef]
  56. Chung, E.-S.; Won, K.; Kim, Y.; Lee, H. Water resource vulnerability characteristics by district’s population size in a changing climate using subjective and objective weights. Sustainability 2014, 6, 6141–6157. [Google Scholar] [CrossRef]
  57. Wang, S.; Fang, C.; Wang, Y.; Huang, Y.; Ma, H. Quantifying the relationship between urban development intensity and carbon dioxide emissions using a panel data analysis. Ecol. Indic. 2015, 49, 121–131. [Google Scholar] [CrossRef]
  58. UN-Habitat, Global Urban Indicators Database. Available online: http://unhabitat.org/books/global-urban-indicators-database (accessed on 11 October 2015).
  59. DESA, UN-DESA. Official list of MDG Indicators; UN Department of Economic and Social Affairs—Statistics Division: New York, NY, USA, 2008. [Google Scholar]
  60. Shen, L.-Y.; Ochoa, J.J.; Shah, M.N.; Zhang, X. The application of urban sustainability indicators—A comparison between various practices. Habitat Int. 2011, 35, 17–29. [Google Scholar] [CrossRef]
  61. World Bank. World Development Indicators 2012; World Bank Publications: New York, NY, USA, 2012. [Google Scholar]
  62. Roy, M. Planning for sustainable urbanisation in fast growing cities: Mitigation and adaptation issues addressed in Dhaka, Bangladesh. Habitat Int. 2009, 33, 276–286. [Google Scholar] [CrossRef]
  63. Dizdaroglu, D.; Yigitcanlar, T.; Dawes, L.A. Sustainable urban futures: An ecological approach to sustainable urban development. In Proceedings of the Second Infrastructure Theme Postgraduate Conference 2009: Rethinking Sustainable Development-Planning, Infrastructure Engineering, Design and Managing Urban Infrastructure, Queensland University of Technology, Brisbane, Queensland, Australia, 9 July 2010; pp. 187–195.
  64. Yigitcanlar, T.; Dizdaroglu, D. Assessing Urban Ecosystem Sustainability: An Indexing Approach. Available online: http://s3.amazonaws.com/academia.edu.documents/30968394/Assessing-urban-ecosystem-sustainability-an-indexing-approach.pdf?AWSAccessKeyId=AKIAJ56TQJRTWSMTNPEA&Expires=1468819753&Signature=dqbGGXjzNGsfUhgrzvlV3FYqR7w%3D&response-content-disposition=inline%3B%20filename%3DAssessing_urban_ecosystem_sustainability.pdf (accessed on 23 May 2014).
  65. Scipioni, A.; Mazzi, A.; Mason, M.; Manzardo, A. The Dashboard of Sustainability to measure the local urban sustainable development: The case study of Padua Municipality. Ecol. Indic. 2009, 9, 364–380. [Google Scholar] [CrossRef]
  66. Shuai, C.; Jiao, L.; Song, X.; Shen, L. Decoupling Analysis on the Relationship between Economic Development and Environment Degradation in China. In Proceedings of the 20th International Symposium on Advancement of Construction Management and Real Estate; Springer: Singapore, Singapore, 2017; pp. 1207–1216. [Google Scholar]
  67. Yigitcanlar, T.; Dur, F. Developing a sustainability assessment model: The sustainable infrastructure, land-use, environment and transport model. Sustainability 2010, 2, 321–340. [Google Scholar] [CrossRef] [Green Version]
  68. Mason, A. Saving, economic growth, and demographic change. Popul. Dev. Rev. 1988, 14, 113–144. [Google Scholar] [CrossRef]
  69. Nickell, S. Unemployment and labor market rigidities: Europe versus North America. J. Econ. Perspect. 1997, 11, 55–74. [Google Scholar] [CrossRef]
  70. Pradhan, R.P.; Arvin, M.B.; Bahmani, S. Causal nexus between economic growth, inflation, and stock market development: The case of OECD countries. Glob. Financ. J. 2015, 27, 98–111. [Google Scholar] [CrossRef]
  71. Sharma, M. Education: A Challange for Women with Special Reference to South Central Asian Countries. Int. J. Sci. Res. 2016, 4, 674–675. [Google Scholar]
  72. Semyonov, M.; Gorodzeisky, A.; Glikman, A. Neighborhood ethnic composition and resident perceptions of safety in European countries. Soc. Probl. 2012, 59, 117–135. [Google Scholar]
  73. United Nation. Databases. Available online: http://data.un.org/ (accessed on 18 July 2016).
  74. Constantin, D. Tourism and environmentally sustainable regional development: The case of Romania. In Proceedings of the 40th Congress of the European Regional Science Association, Vienna, Austria, 29 August–1 September 2000; Volume 29.
  75. Teodorescu, G. Climate change impact on urban ecosystems and sustainable development of cities in Romania. WSEAS Trans. Environ. Dev. 2010, 6, 103–112. [Google Scholar]
  76. Nistoreanu, P. The Ecotourism-Element of the Sustainable Development of the Local Rural Communities in Romania. Amfiteatru Econ. J. 2005, 7, 42–47. [Google Scholar]
  77. Rotmans, J.; van Asselt, M.; Anastasi, C.; Greeuw, S.; Mellors, J.; Peters, S.; Rothman, D.; Rijkens, N. Visions for a sustainable Europe. Futures 2000, 32, 809–831. [Google Scholar] [CrossRef]
  78. Henderson, V. The urbanization process and economic growth: The so-what question. J. Econ. Growth 2003, 8, 47–71. [Google Scholar] [CrossRef]
  79. Dyson, T. The role of the demographic transition in the process of urbanization. Popul. Dev. Rev. 2011, 37, 34–54. [Google Scholar] [CrossRef] [PubMed]
Figure 1. A global perspective on sustainable urbanization performance.
Sustainability 08 00783 g001
Figure 2. Regression analysis between sustainable performance and urbanization rate at different urbanization stages. (a) The initial stage (b) The acceleration stage (c) The terminal stage.
Sustainability 08 00783 g002
Table 1. The confirmed candidate indicators.
DimensionIndicators
Environment (En)En1-CO2 emissions per capita (kt per capita)
En2-Consumption of ozone-depleting CFCs in ODP metric tons per capita
En3-Forest area (% of land area)
En4-Marine protected areas (% of territorial waters)
En5-Electric power consumption (kWh per capita)
En6-Population growth (annual %)
En7-Population Density (%)
Economic (Ec)Ec1-GDP per capita
Ec2-Gross savings (% of GDP)
Ec3-Employment-population ratio (annual %)
Ec4-Adjusted net savings as percentage of gross national income (GNI)
Ec5-Inflation Rate (annual %)
Ec6-Internet users (per 100 population)
Ec7-Fixed telephone lines (per 100 population)
Ec8-Mobile cellular telephone subscribers (per 100 population)
Social (So)So1-School enrollment, primary (% net)
So2-Ratio of female to male primary enrollment (%)
So3-Life expectancy at birth, total (years)
So4-Incidence of tuberculosis (per 100,000 people)
So5-Mortality rate, under-5 (per 1000 live births)
So6-Intertional homicide, number and rate per 100,000 population
So7-Improved water source (% of population with access)
So8-Improved sanitation facilities (% of population with access)
Table 2. The selected indicators for measuring sustainable performance of urbanization.
DimensionIndicatorsData Source
Environment (En)En1-CO2 emissions per capita (kt per capita)World Bank
En2-Consumption of ozone-depleting CFCs in ODP metric tons per capitaUnited Nation
En3-Forest area (% of land area)World Bank
En4-Marine protected areas (% of territorial waters)United Nation
En5-Electric power consumption (kWh per capita)World Bank
En6-Population growth (annual %)World Bank
En7-Density (%)World Bank
Economic (Ec)Ec1-GDP per capitaWorld Bank
Ec2-Gross savings (% of GDP)United Nation
Ec3-Employment-population ratio (annual %)World Bank
Ec4-Inflation Rate (annual %)United Nation
Ec5-Mobile cellular telephone subscribers( per 100 population)World Bank
Social (So)So1-School enrollment, primary (% net)World Bank
So2-Ratio of female to male primary enrollment (%)United Nation
So3-Life expectancy at birth, total (years)World Bank
So4-Intentional homicide, number and rate per 100,000 populationUnited Nation
So5-Improved water source (% of population with access)World Bank
Table 3. Weighting values between the selected indicators.
Indicator (En)Weight (%)Indicator (Ec)Weight (%)Indicator (So)Weight (%)
En-15.043Ec-18.045So-16.684
En-24.914Ec-25.757So-26.542
En-34.986Ec-35.934So-36.341
En-46.756Ec-45.359So-45.635
En-55.732Ec-56.486So-54.179
En-65.362
En-76.245

