1. Introduction
Sustainable building design requires a comprehensive consideration of daylight utilization, which has improvements on view to outdoor [
1], visual and psychological comfort [
2], health [
3], and working efficiency [
4], and thus windows are considered a fundamental element of building facades. To maximize daylight and winter solar gain, contemporary buildings are designed with large windows or glazing curtain walls, which, in turn, can also lead to negative influences on the indoor environmental conditions. For example, too much daylight brings glare problems and daylight with excessive solar heat gains increases cooling energy demand. To have a balance between these aspects, solar shading devices are usually used, which can be designed to prevent overheating, to reduce heating losses and cooling loads, and to control the visual environment (glare, daylight, contrast, view towards and from the exterior).
Fixed shading devices, as a simple solution, are usually employed in the building envelope to address this need. For example, Stazi et al. [
5] reported that different fixed shading devices (aluminum horizontal louvers, aluminum persiana, and traditional wooden persiana) all providing medium daylighting factors higher than the threshold value of 2% (fixed by UNI EN 15193) in a Mediterranean climate. However, there is no improvement in the light uniformity level after using shading devices, with a resulting uniformity ratio of less than 0.12, which is even a little poorer than with the no shading condition. Ahmed [
6] compared three fixed shading devices (vertical fins, diagonal fins and egg crate) in terms of thermal and daylighting performance. The results showed that offices with diagonal fins and egg crate shading devices performed better compared to the office with vertical fins. Research carried out by Cristina et al. [
7] also suggested the use of shading devices as passive control systems in improving indoor thermal conditions. Esquivias et al. [
8] conducted a simulation study on daylight analysis of fixed shading devices (overhangs, side fins, horizontal and vertical louvres) in an open-plan office. Their research showed that excessive obstruction may yield an excessive reduction in a range of illuminance between 500 and 2000 lux, thus increasing lighting energy consumption. Therefore, fixed shading devices are not efficient in controlling dynamic daylight illuminance.
On the other hand, movable shading devices can be adjusted in accordance with the changing outdoor conditions in order to achieve minimal energy consumption for lighting, heating and cooling while at the same time offer a comfortable visual environment. Movable shades can be classified into the manual, motorized and automated type according to the control method. Manual shades are the simplest type as they do not incorporate a motorized device. Motorized ones are operated by motors, indicating that remote or central operation is possible while automated ones are automatically controlled by sensors according to the indoor or outdoor weather conditions to enhance building performance [
9]. Nielsen et al. [
10] simulated the daylighting performance of automated dynamic solar shading in office buildings. Their research emphasized the need for dynamic and integrated simulations early in the design process in order to facilitate informed design decisions about the façade. Myung et al. [
11] developed an automated control strategy for slat-type blind that has an optimum slat angle adjustment, by which glare can be fully removed (a glare occurrence ratio of 0.1%) and at the same time a significant energy improvement can be achieved.
For rooms with many automated blinds, occupants often adjust all of the blinds to the same position in order to keep sunlight’s penetration through windows at an acceptable depth. This may lead to the blockage of useful daylight and view to outdoor. Koo et al. [
12], thus, developed a new blind control strategy to make full use of daylight while preventing glare risks. This strategy can be used to control individual multiple blinds to different shading positions according to occupants’ preference for the daylight distribution.
To reach the abovementioned magnitude of improvement in visual comfort performance for movable shading devices, a complex control system will be required to maintain the frequent changing of shade positions or angles. Thus, it is more expensive than manually controlled shades and the costs are even higher with maintenance. Unfortunately, manually controlled internal solar shades are widely used in office buildings in China [
13]. Moreover, occupants’ shade control is not as efficient as motorized systems since occupants’ behavior is stochastic [
13,
14,
15,
16]. Therefore, the rigorous evaluation of the impact of manual solar shades on indoor visual comfort should account for the stochastic characteristic of occupants’ behavior. This paper continues the previous research and focuses on the visual comfort (the focus of previous studies are on energy [
13] and indoor thermal comfort [
17]) by taking into account the stochastic adjustment of solar shades based on a co-simulation study.
2. Methodology
2.1. Case Study
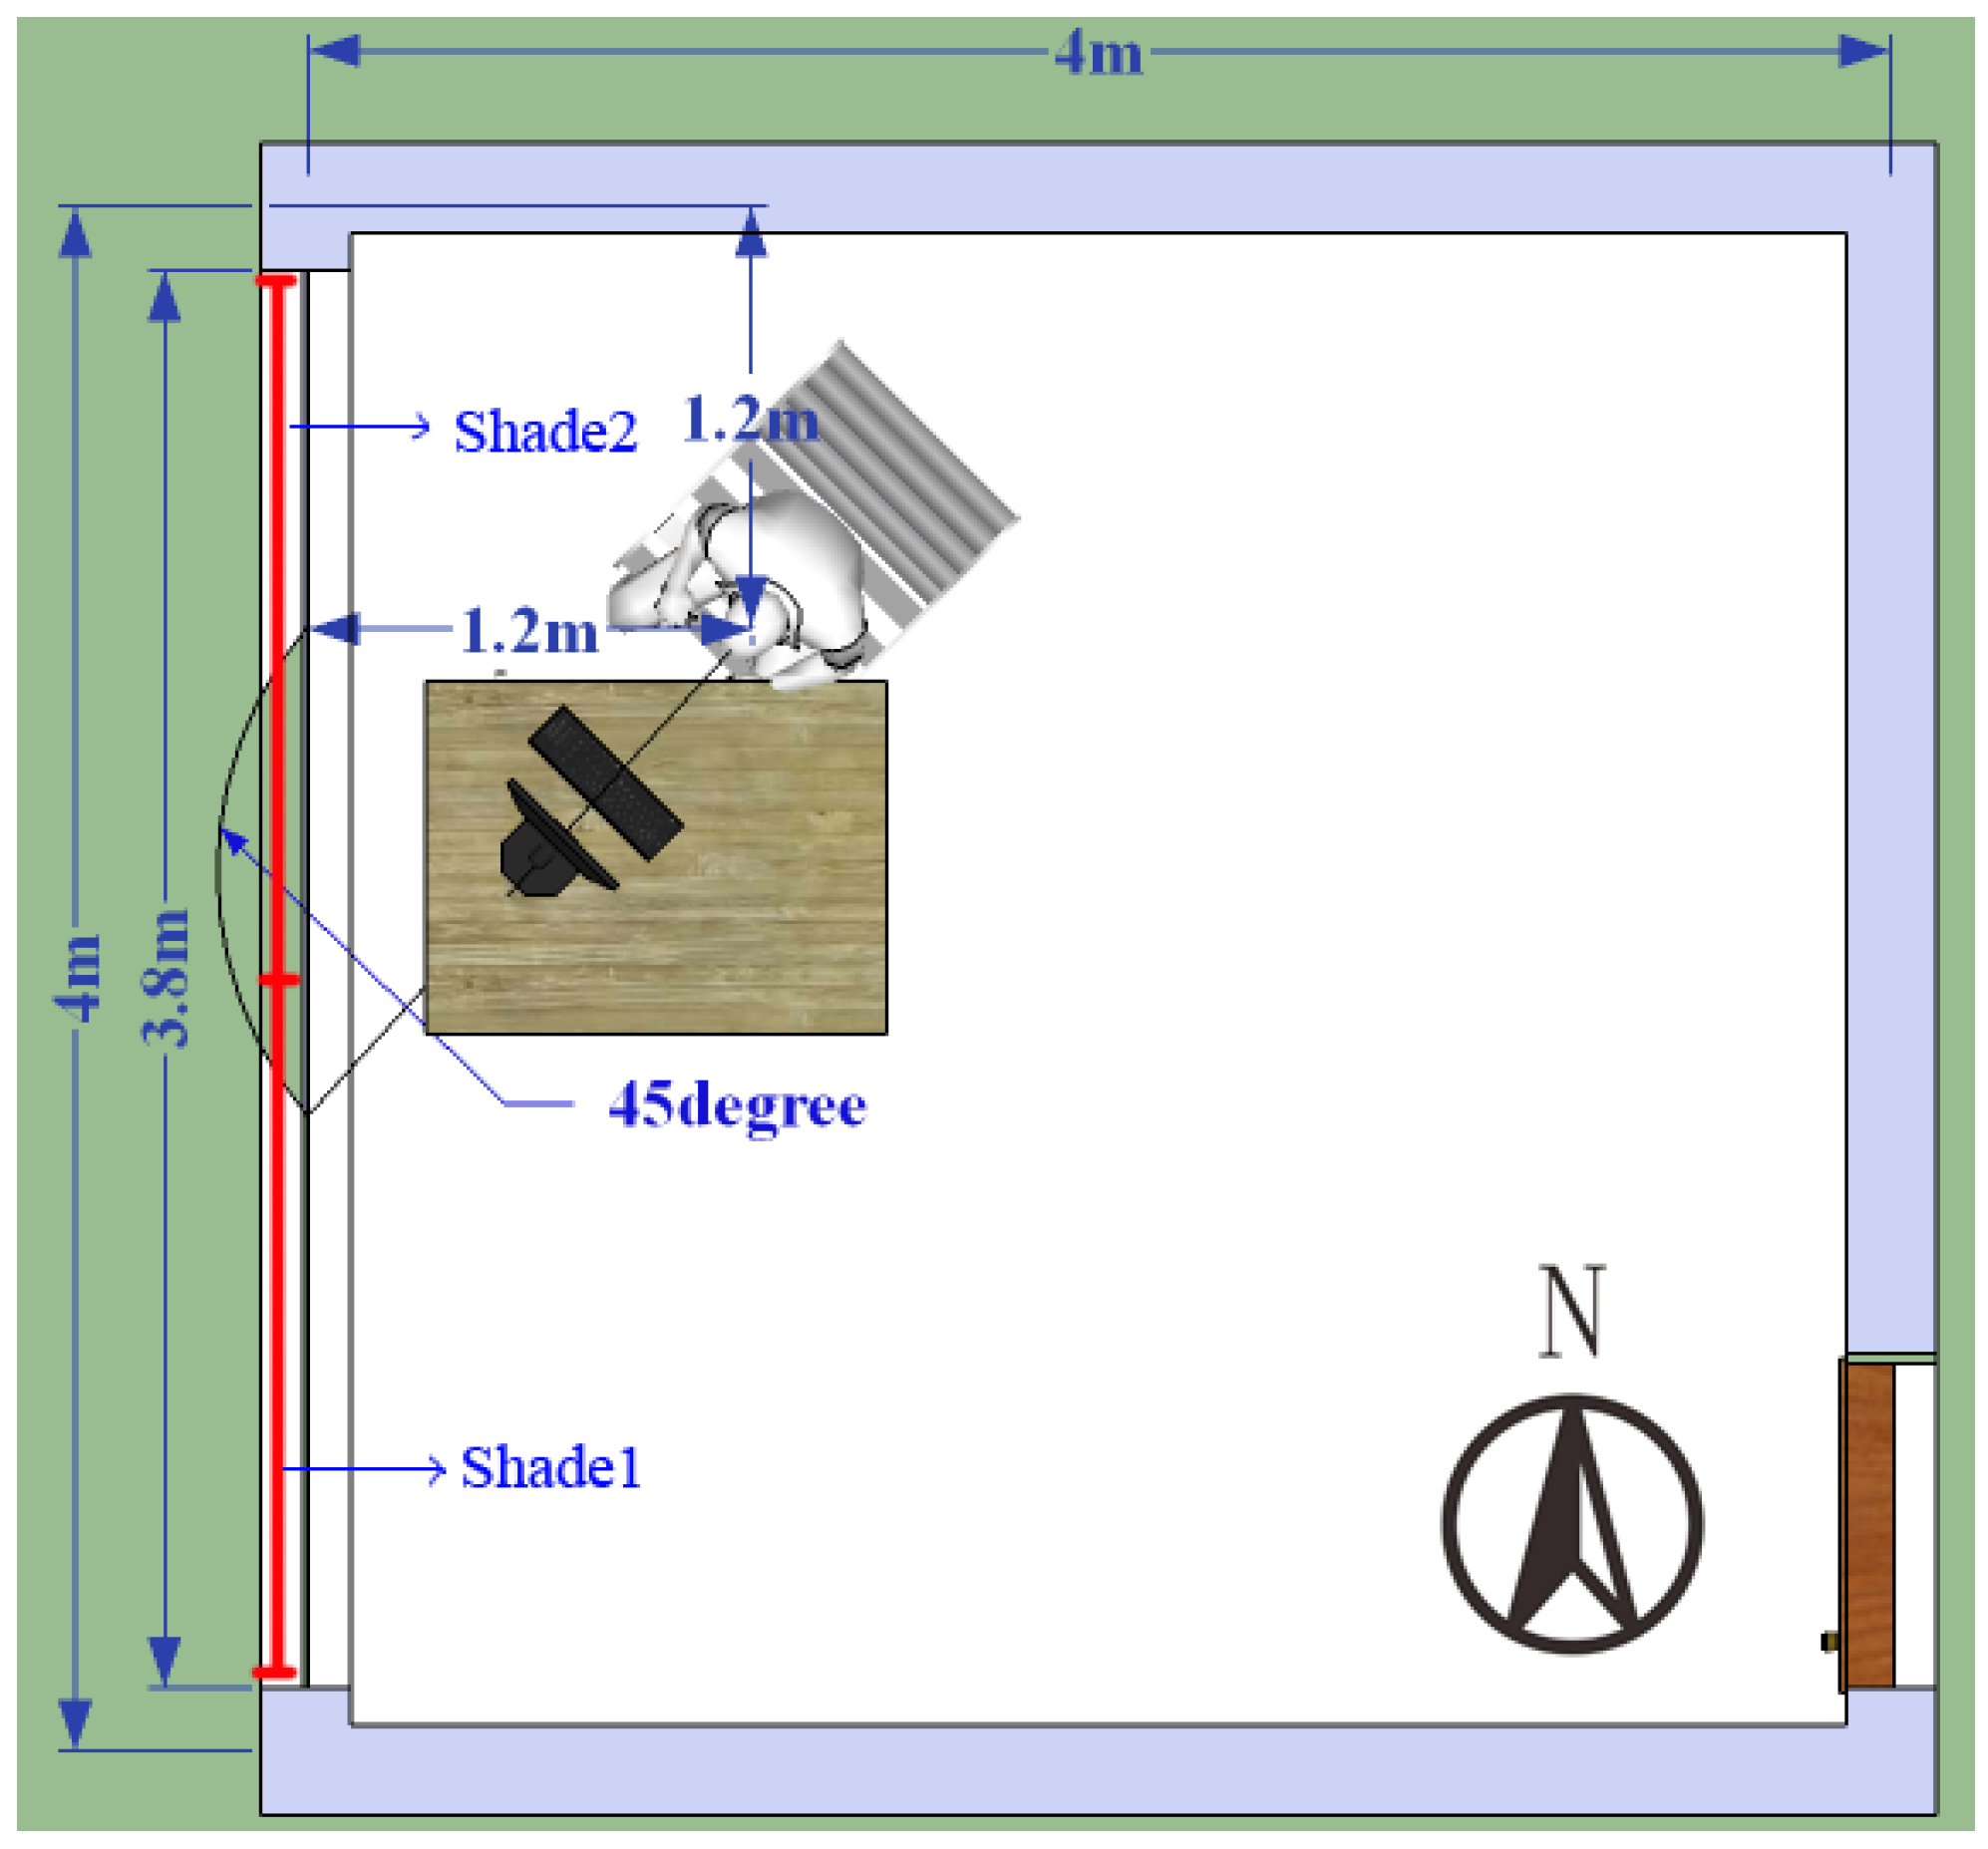
The research was conducted in Ningbo (a typical city in hot summer and cold winter zone of China with 1517 heating degree days (HDD, unit: °C·d) and 89 cooling degree days (CDD, unit: °C·d)) and a typical office room model. Its dimensions are 4 m × 4 m × 3 m with a 3.8 m × 2.8 m window on the west facade. To compare the performance of movable solar shades with bare windows in terms of daylighting and glare protection, four window settings were considered. The first two scenarios (clear double-pane windows and low-e double-pane windows) are the most popular design measures in this climatic region where movable solar shades are not mandatory design measures. The other two scenarios represent interior and exterior movable solar shading devices, respectively. For modeling movable solar shades, two equal solar shades side by side (Shade1 and Shade2, either of which can be placed inside the window (Shadeint) or outside (Shadeext)) were considered and each of them can be controlled independently, as shown in
Figure 1. The characteristics of the office room and the four scenarios are shown in
Table 1. The material property of roller solar shades was collected from a local manufacturer. It should be mentioned that the last two parameters (Computer screen luminance and Sky condition) are only used to calculate the Daylight glare probability index described in
Section 2.3 while other performance was simulated by EnergyPlus by considering all sky conditions for the whole year (8760 h).
2.2. Co-Simulation for Movable Solar Shades
The simulation tool EnergyPlus, which is developed by the U.S. Department of Energy (DOE) [
18], was used to carry out the visual performance simulation for the first two design measures (CL and LOW-E). A software environment for co-simulation named Building Controls Virtual Test Bed (BCVTB) developed by Lawrence Berkeley National Laboratory [
19] was used for co-simulation with EnergyPlus for the other two measures (Shadeint and Shadeext) since the developed stochastic model for movable solar shades cannot be simulated by EnergyPlus alone. Although this paper is a simulation based study, the reliability of the co-simulation conducted has been validated based on field measurement [
13].
To investigate the impact of shade control behavior on visual comfort, the shade control model developed by the author [
13] and the same solar shades were used in this paper. The model was developed based on long term field measurements during three seasons and the cumulative odds logit model was used for calculationin order to identify the main factor in influencing shade control.
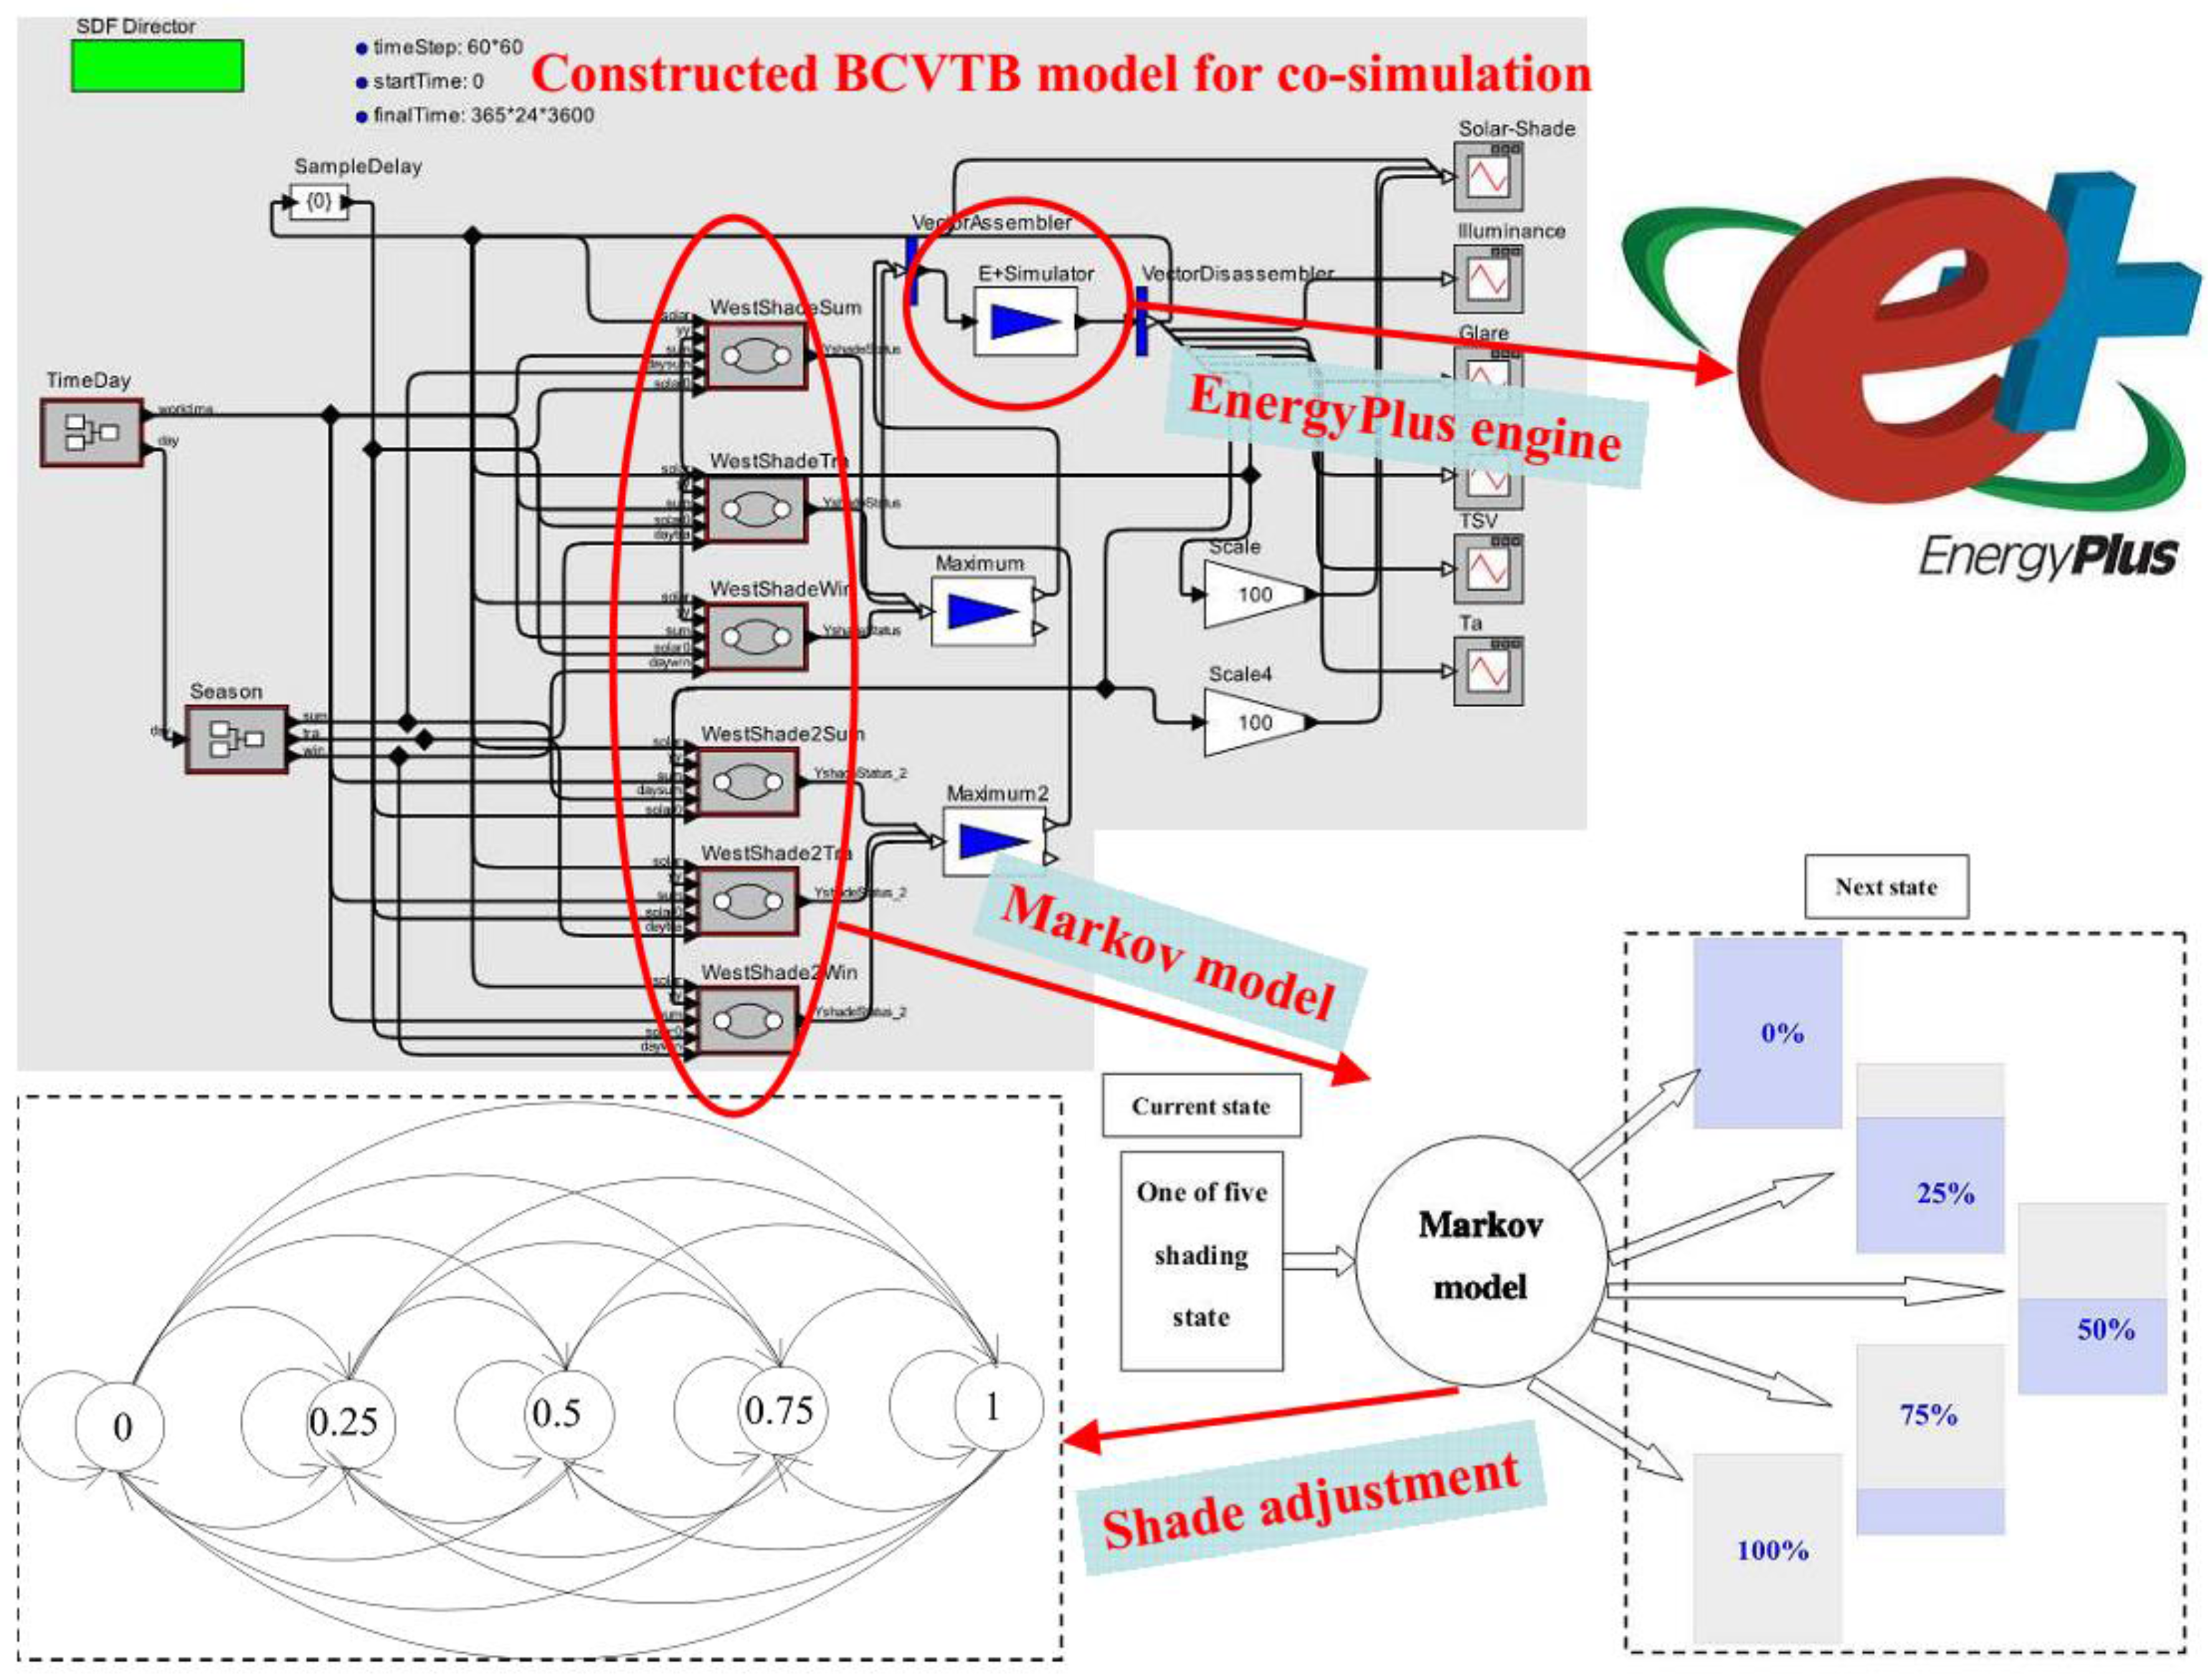
Since using 5shade positions is adequate and reasonable for simulating building performance [
20], shade deployment was divided into 5 positions (cover window area of 0%, 25%, 50%, 75% and 100%, respectively). Then the time-constant Markov chain method was adopted to construct the stochastic model of shade control behavior, and the Markov chain transition matrix for different sky conditions were calculated and classified according to the driving factor.
To reflect occupants’ behavior characteristics under different sky conditions, four transition matrices were constructed based on the threshold of receiving direct solar radiation (the driving factor) for each season as follows: (1) continuously without direct solar radiation; (2) from without direct solar radiation to receiving it; (3) continuously receiving direct solar radiation; and (4) from receiving direct solar radiation to without it. Thus, a total of 12 Markov transition matrices for occupants’ shade control were considered for the three seasons (summer, winter and transition seasons). The values in each matrix were determined by counting the shade changing behavior during the corresponding measurement period, which represent the probabilities of solar shade adjusted from one position to another. For example, the Markov chain transition matrix for west solar shades in summer for the first sky condition (continuously without direct solar radiation) is shown in
Table 2. It can be seen that if a solar shade at a position of 25% at the current time step, then the probability for this shade kept unchanged at the next time step is 77% and it is only 3% for the shade to be adjusted to 0% position, 8% to 50% position, 10% to 75% position and 2% to 100% position. Similarly, the probabilities of shade adjustment at other positions under other conditions (all other Markov chain transition matrices) have been determined and listed in paper [
13].
Then, this Markov model for solar shades was modeled in BCVTB for co-simulation with EnergyPlus. At each time step, BCVTB will check the solar radiation intensity on external windows from EnergyPlus and then randomly generate a shade position according to the probability distribution listed in corresponding Markov chain transition matrix and this shade position will then be applied in EnergyPlus simulation. Beside the position difference, both internal and external solar shades are manually controlled in this paper and thus the same Markov matrices are used for co-simulation.
The developed shade control model is based on long-term field measurement, reflecting the occupants’ real shade control behavior, thus it is relibale. A brief description of how this model is developed and simulated in BCVTB can be seen in
Figure 2. More information about this model can be found in paper [
13].
2.3. Analyze Index
To have a comprehensive evaluation of indoor visual comfort, several indices have been adopted to assess the daylighting and glare protection performance. These indices include useful daylight illuminance (UDI), daylight illuminance fluctuation (DIF), daylight glare index (DGI), and daylight glare probability (DGP).
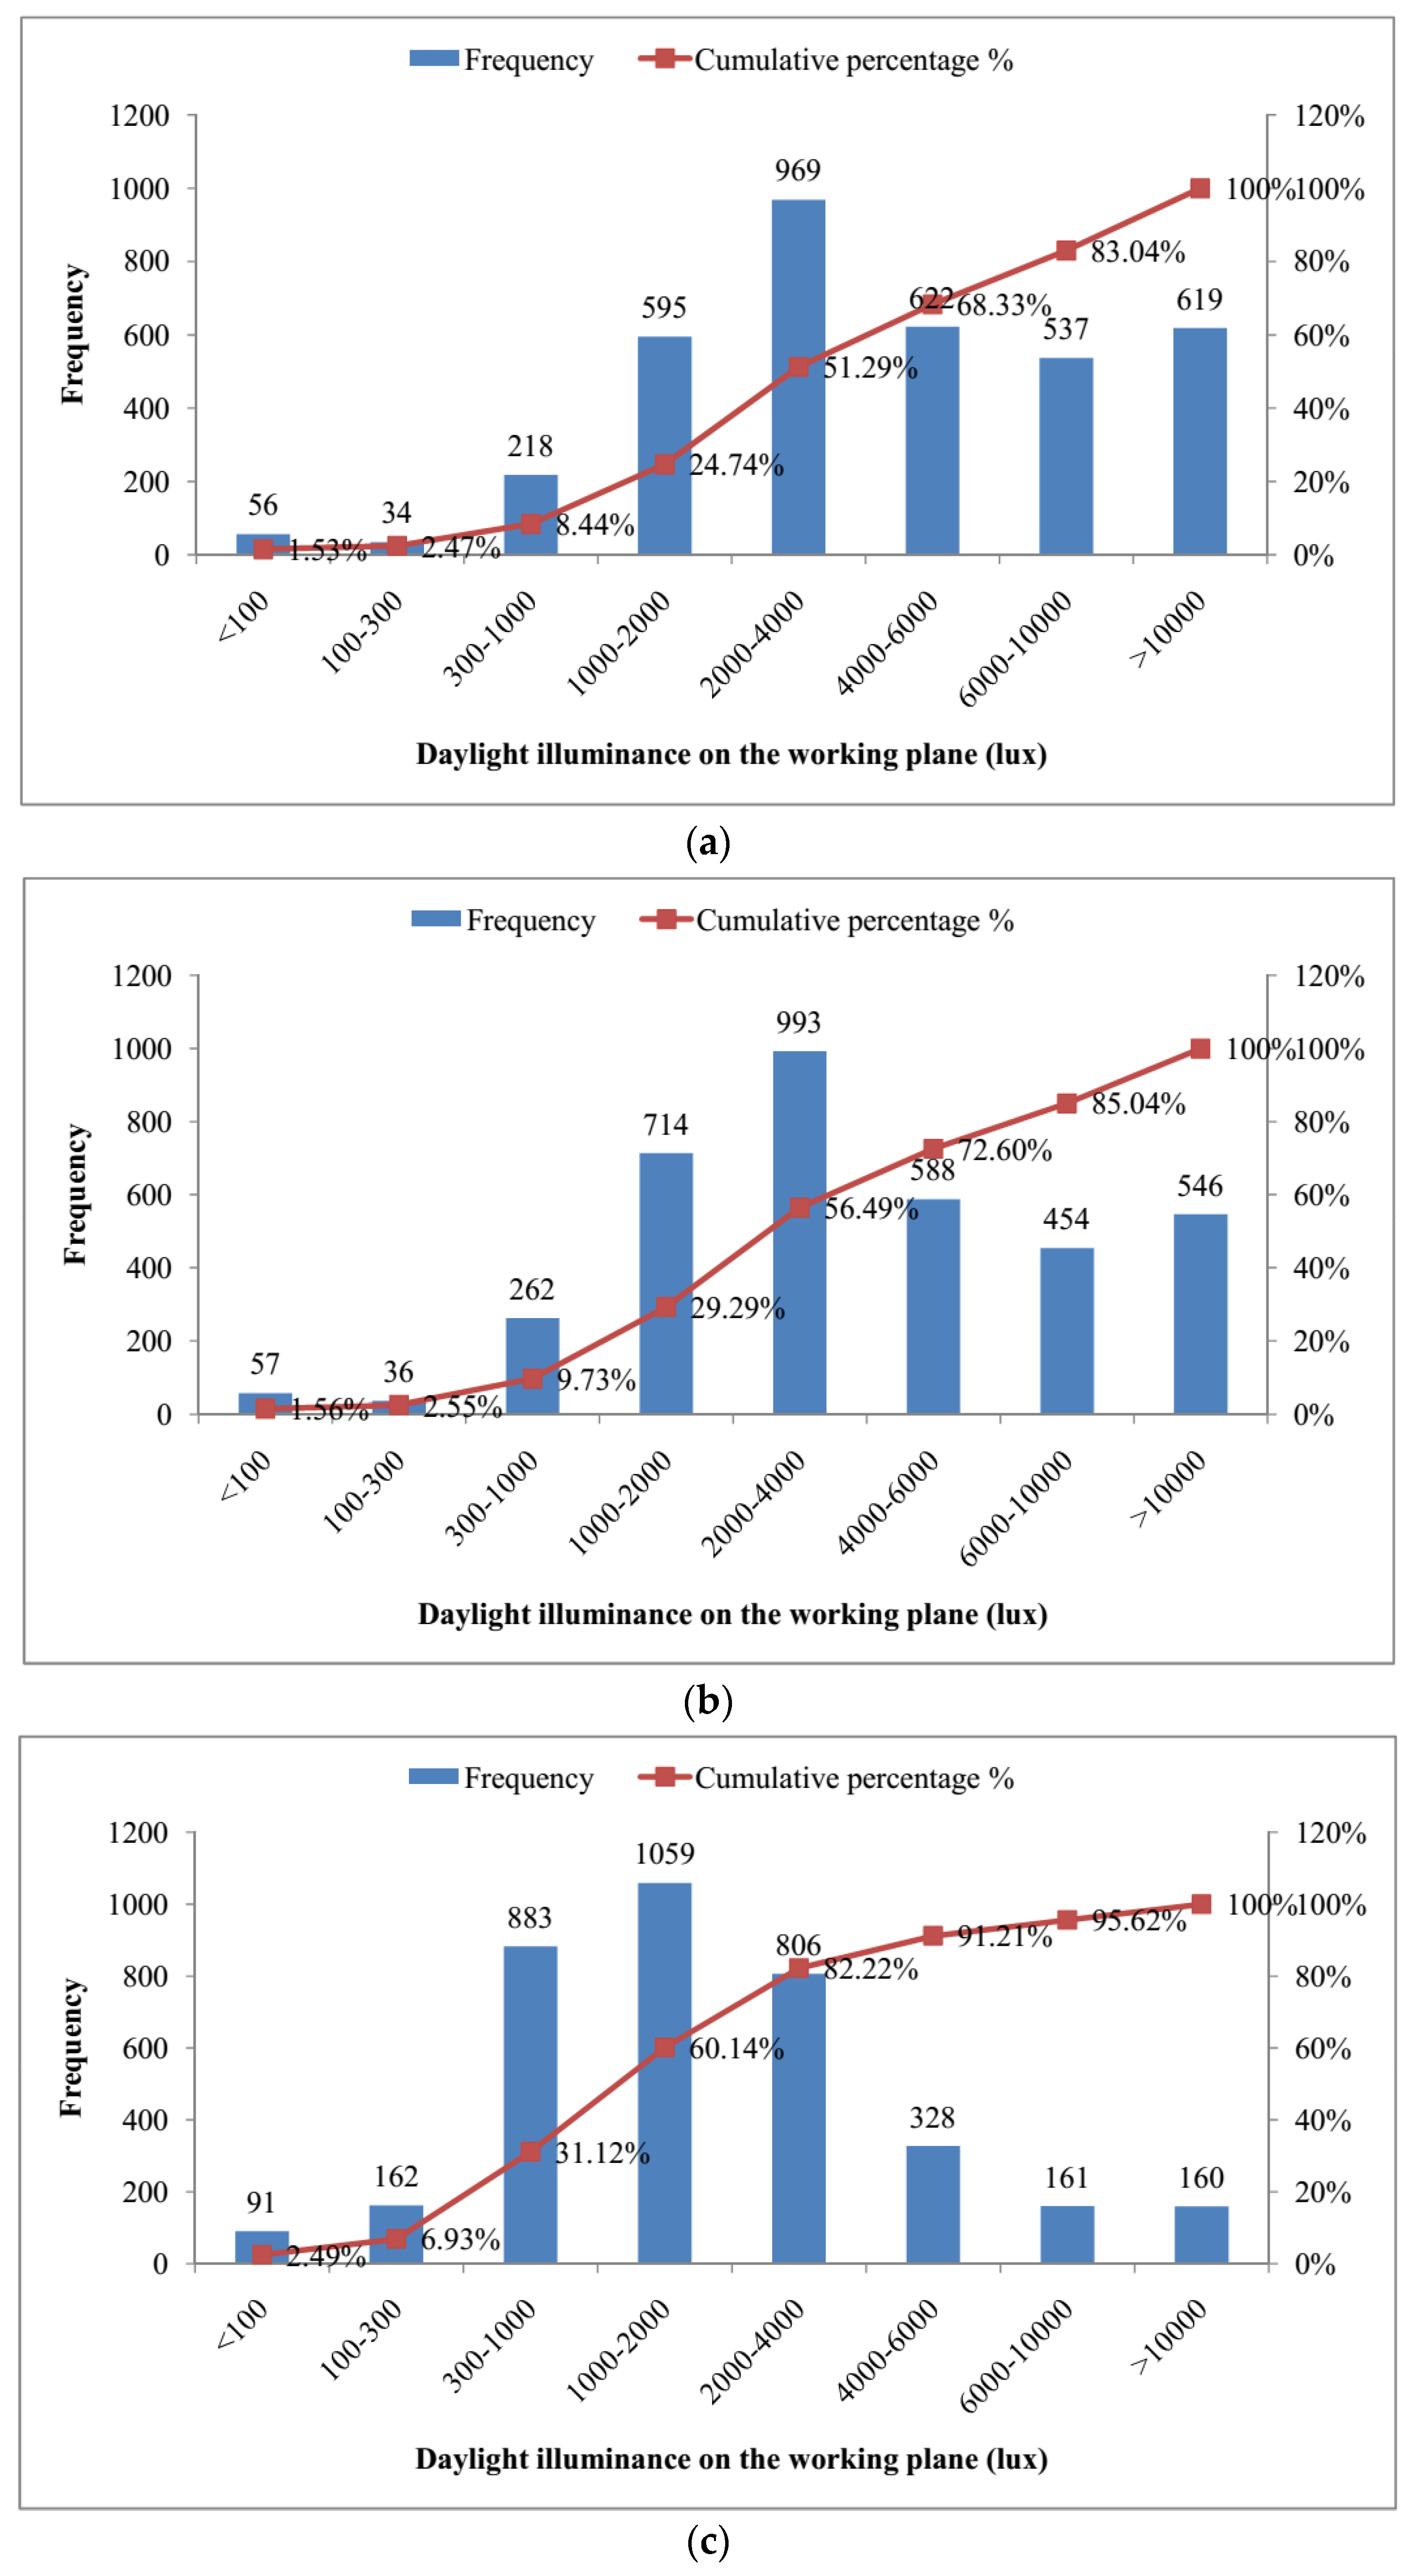
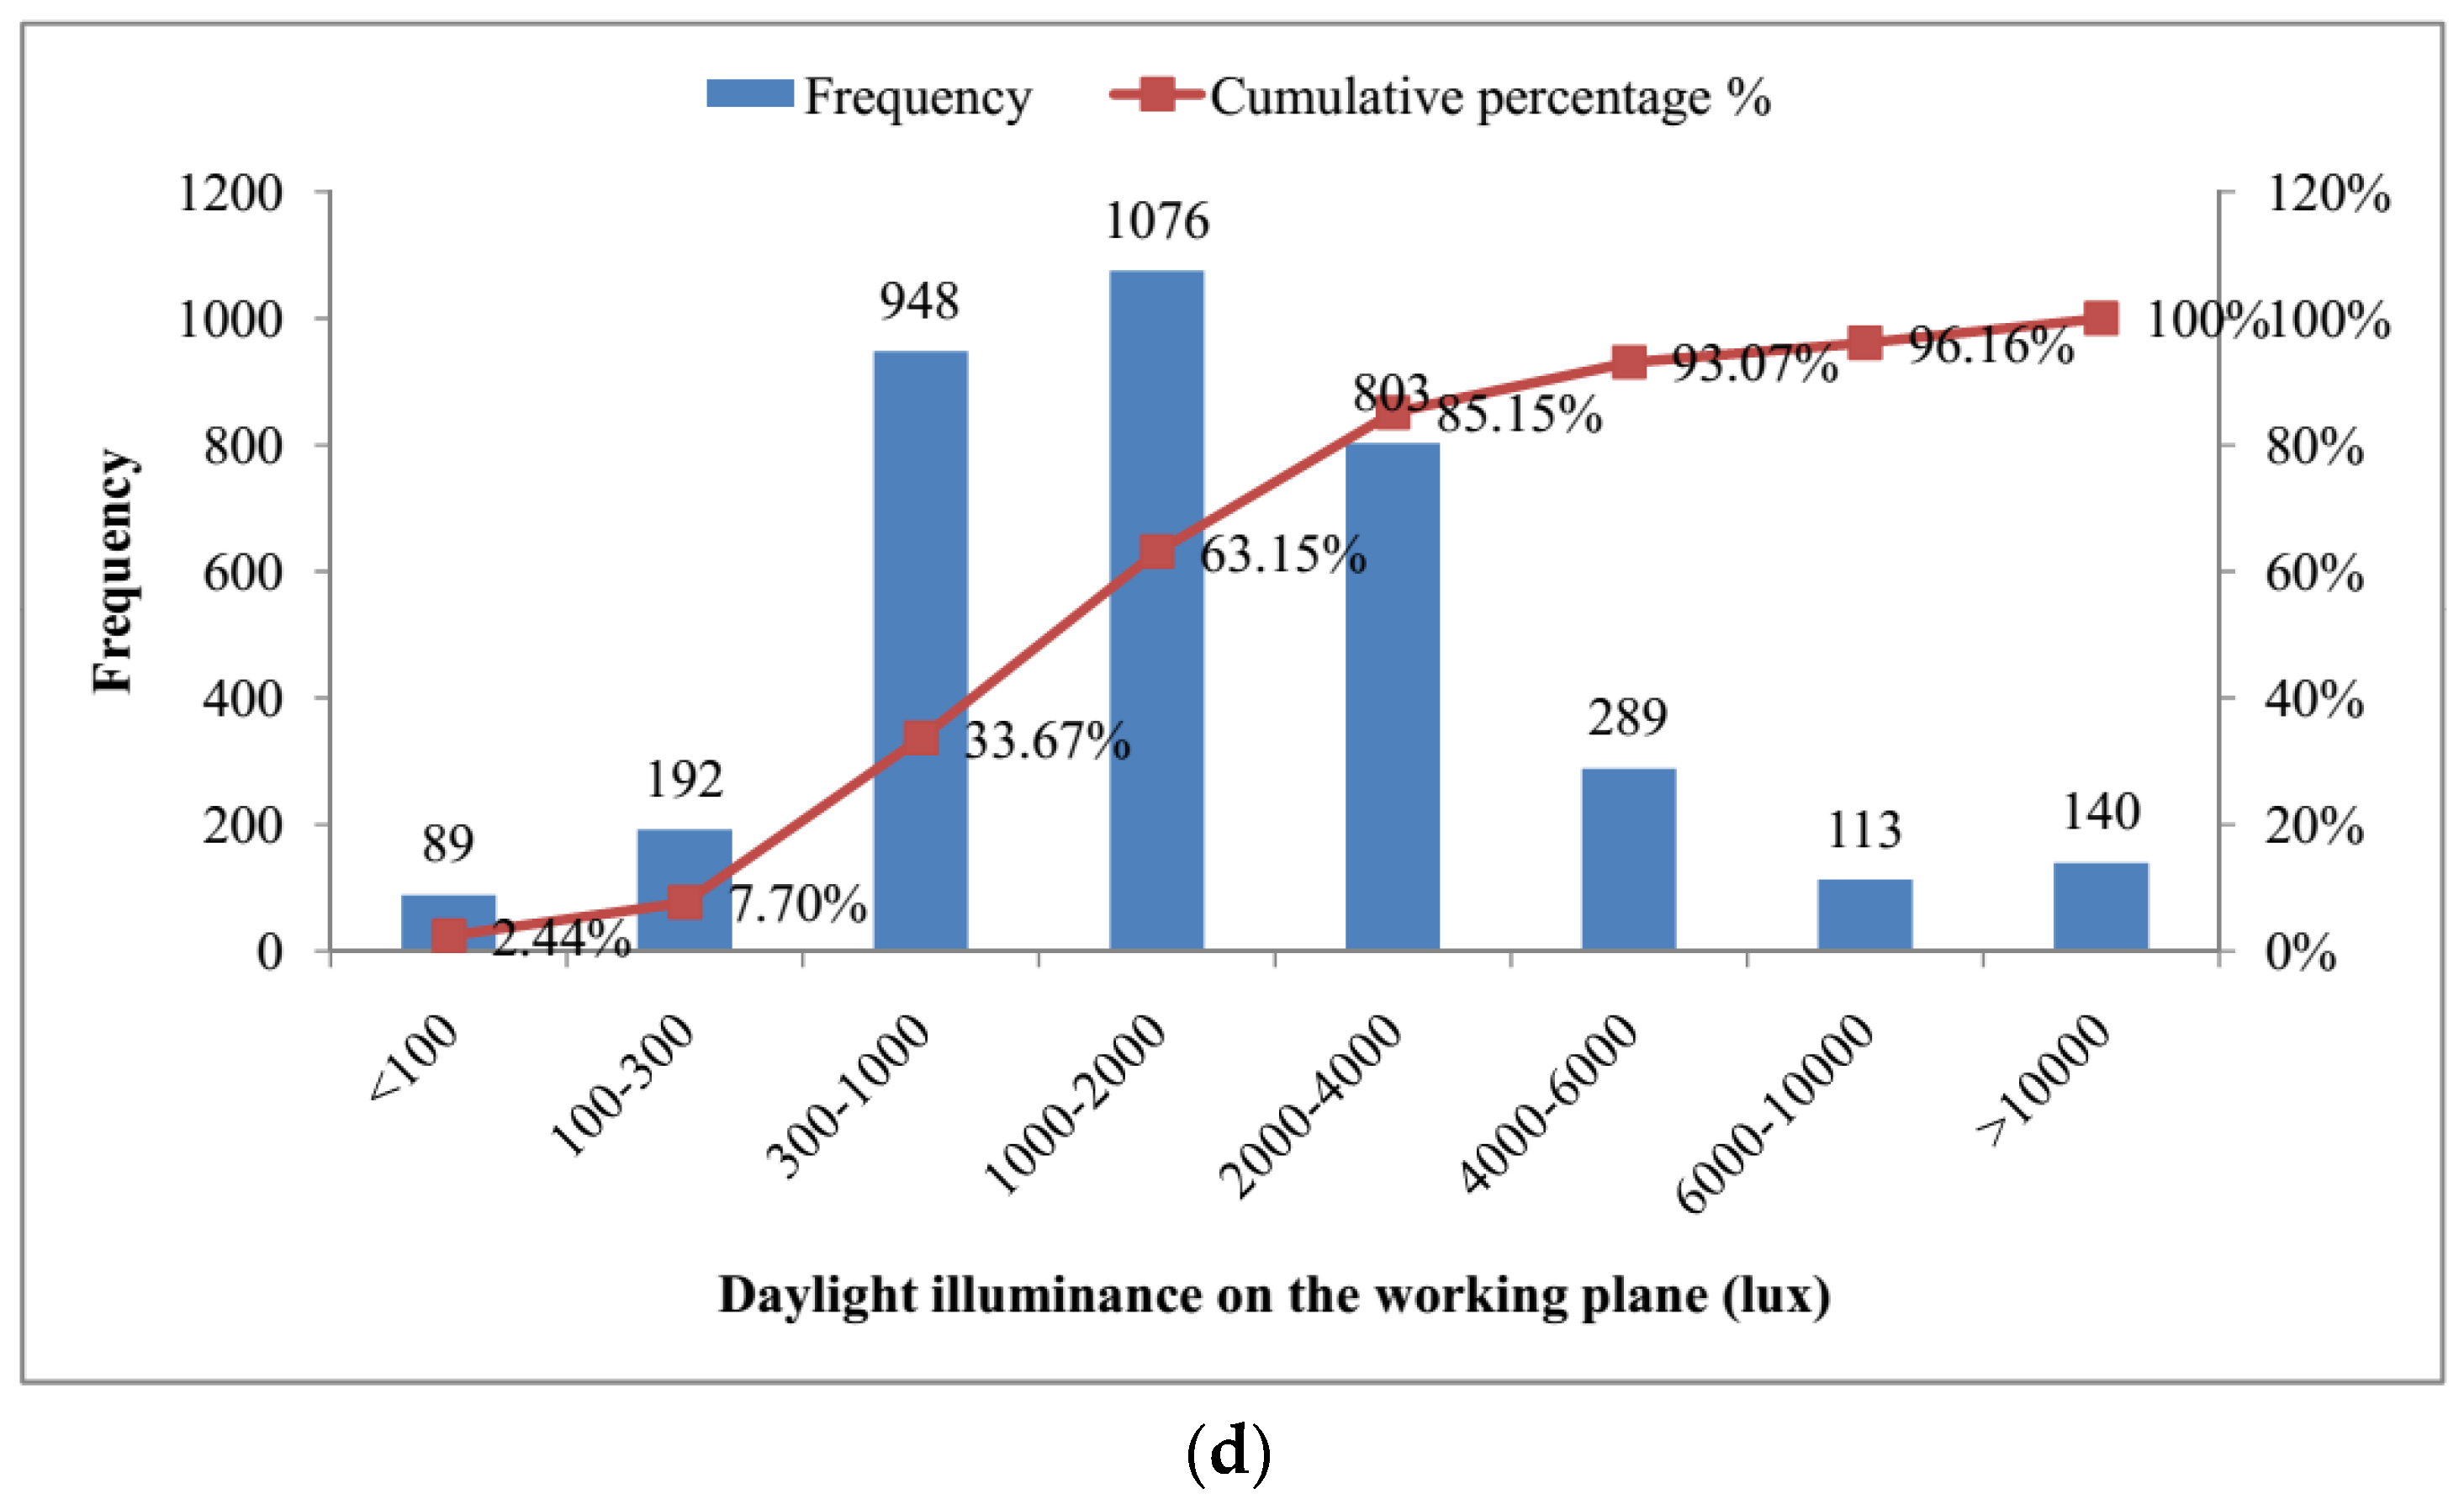
2.3.1. Useful Daylight Illuminance
As a quantitative index, useful daylight illuminance (UDI) can be used to evaluate the daylighting performance [
21]. According to UDI index, it can be determined that when daylight levels are not too dark for the occupant (more than 300 lux, otherwise additional electrical lighting is needed) [
22] and not too bright (less than 2000 lux, otherwise glare risks may occur) [
21].
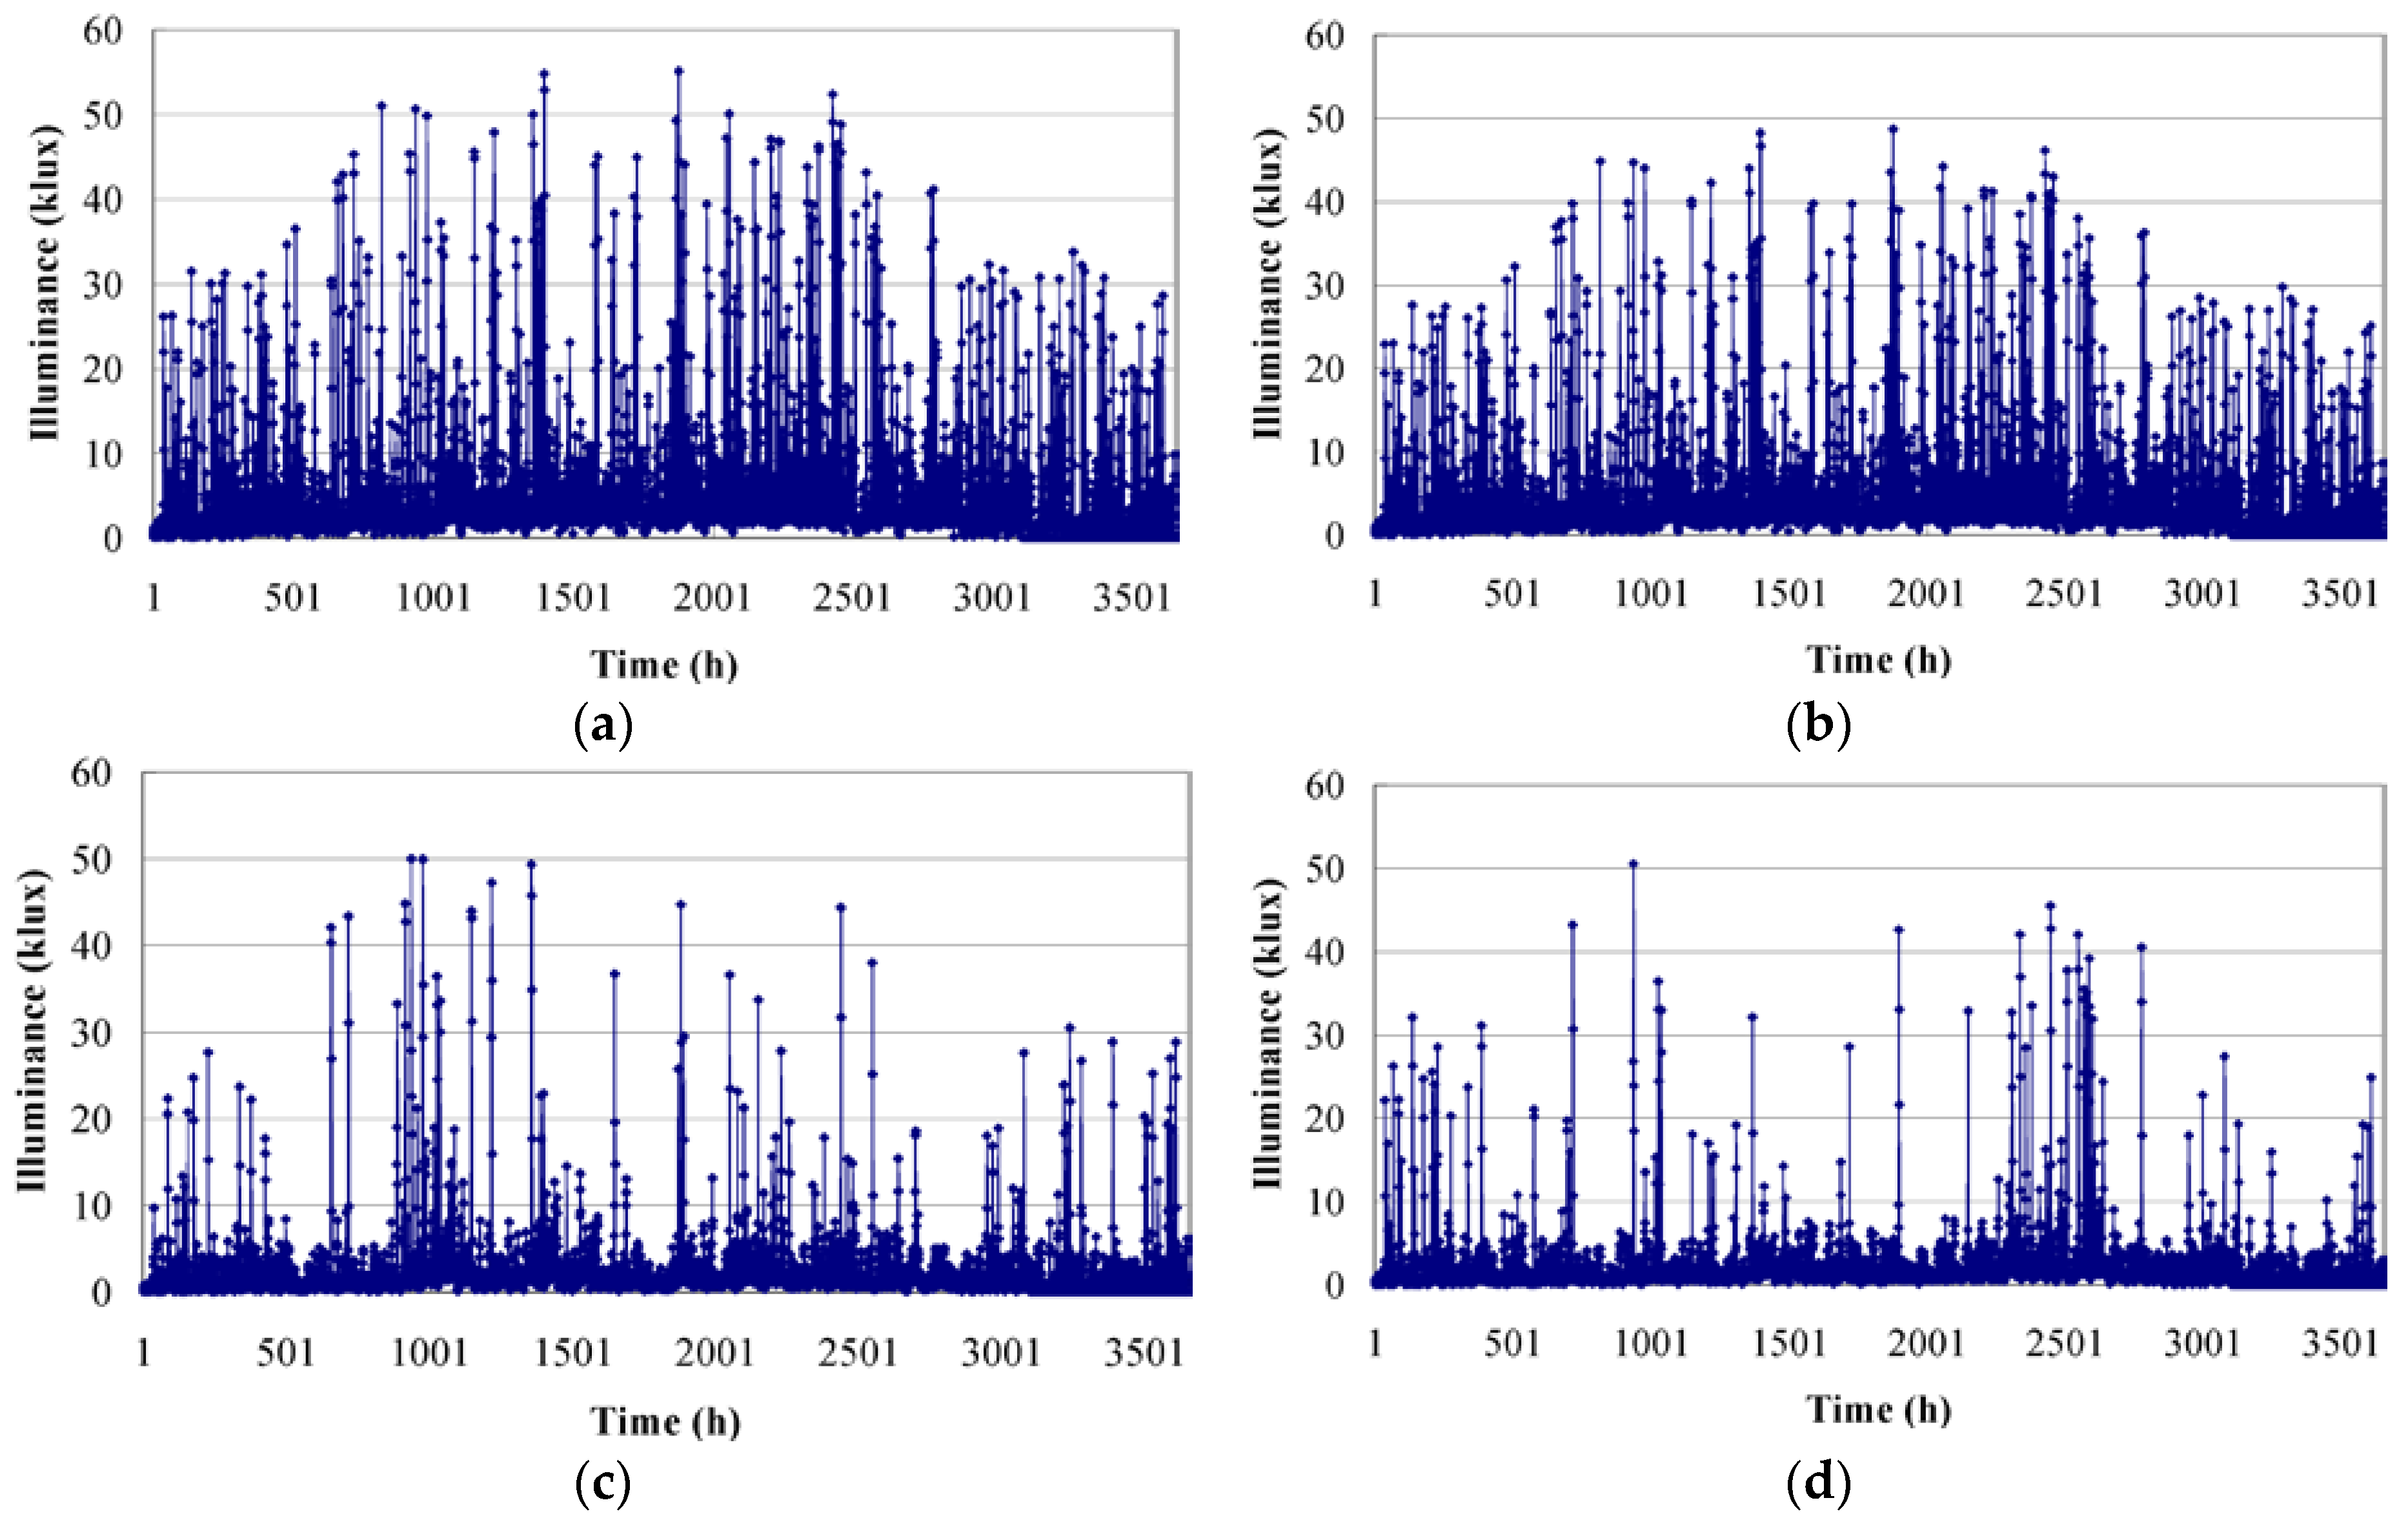
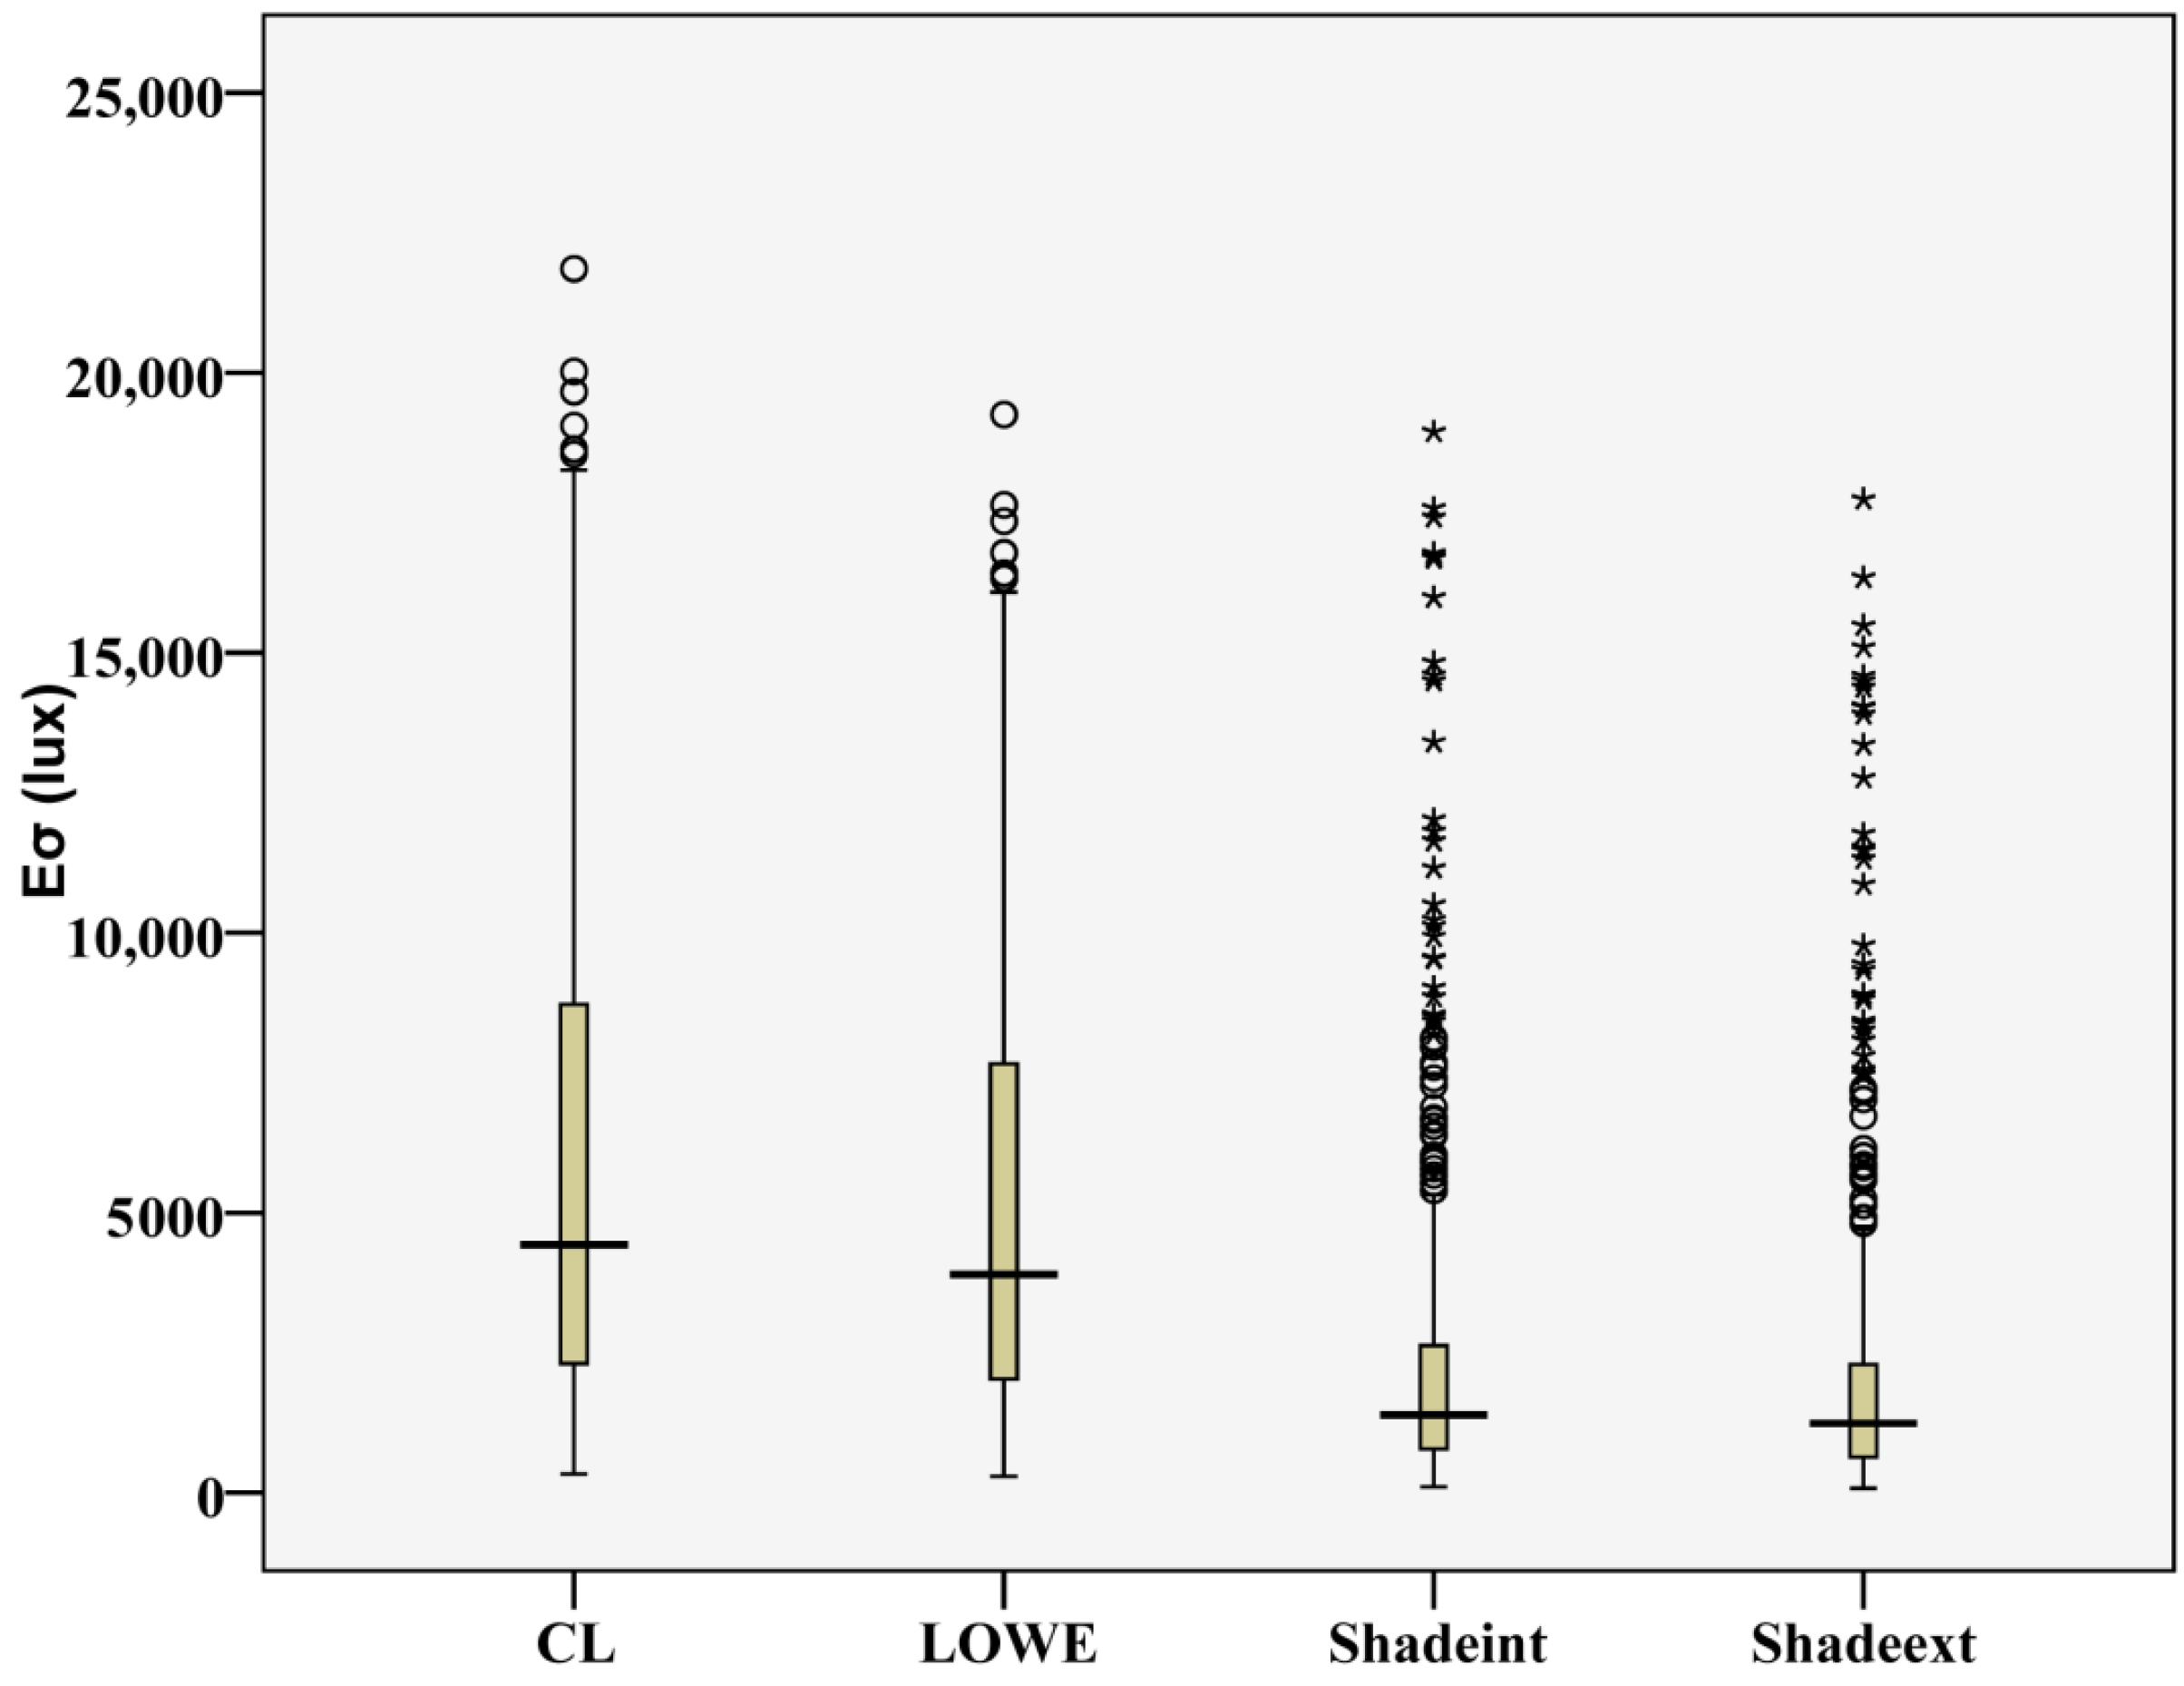
2.3.2. Daylight Illuminance Fluctuation
Daylight illuminance varies with sky conditions and a significant fluctuation of illuminance has a negative impact on indoor visual comfort and occupants may feel too bright or too dark during this change. Therefore, fluctuation of daylight illuminance is also an important factor in influencing occupants’ visual perception, and, in theory, the smaller the better. At present, there is no equation or index for calculating daylight illuminance fluctuation (DIF) and thus the authors have introduced the standard deviation as the evaluation index. This can be expressed as follows:
where
is the standard deviation of daylight illuminance,
N is the daytime working hours (10 h),
is the daylight illuminance of ith working hour and
is the average daylight illuminance of the working hours for a day as shown below.
2.3.3. Daylight Glare Index
Glare is a measure of the physical discomfort that may be caused by excessive light or contrast in a field of view [
23]. Daylight Glare Index (DGI) is an index for the evaluation of the magnitude of discomfort glare experienced from windows. DGI depends on the physical factors such as the luminance values of the light sources, background and window, the solid angle subtended by the source, and the solid angle subtended by the window. The first expression of DGI (the “Cornell formula” [
24]) was derived from the BRS formula. The original equation has been later modified by Chauvel [
25] as follows:
where
is the luminance of the source (cd/m
2),
is the background mean luminance (cd/m
2),
is the solid angle of the source (sr) and
is the solid angle subtended by the window (sr).
2.3.4. Daylight Glare Probability
Based on the vertical eye illuminance levels and other glare source parameters, Wienold and Christoffersen developed daylight glare probability (DGP) index [
26]. Compared to other glare indices or models, DGP shows a better performance in reflecting occupants’ glare perception. It can be calculated according to the following equation:
where
is the vertical illuminance at eyelevel (lux) and
is the Guth position index. The relationships between glare perception and DGI and DGP scores [
27] are shown in
Table 3.
2.4. Calculation of Analyzed Index
EnergyPlus is a powerful building performance simulation engine and it is capable of simulating daylighting and glare performance. Thus, UDI, DIF and DGI are simulated by EnergyPlus (or co-simulation by EnergyPlus and BCVTB for movable solar shades) or manually calculated according to the simulation output (UDI and DIF are further manually counted). These indices are simulated/calculated at occupant’s sitting position as shown in
Figure 1 (UDI and DIF with a working plane height of 0.8 m while DGI with occupant view direction shown in
Table 1). However, DGP is a newly developed index and has not been included in EnergyPlus simulation. Hence, it is calculated by a tool named Evalglare, developed by Wienold [
26].
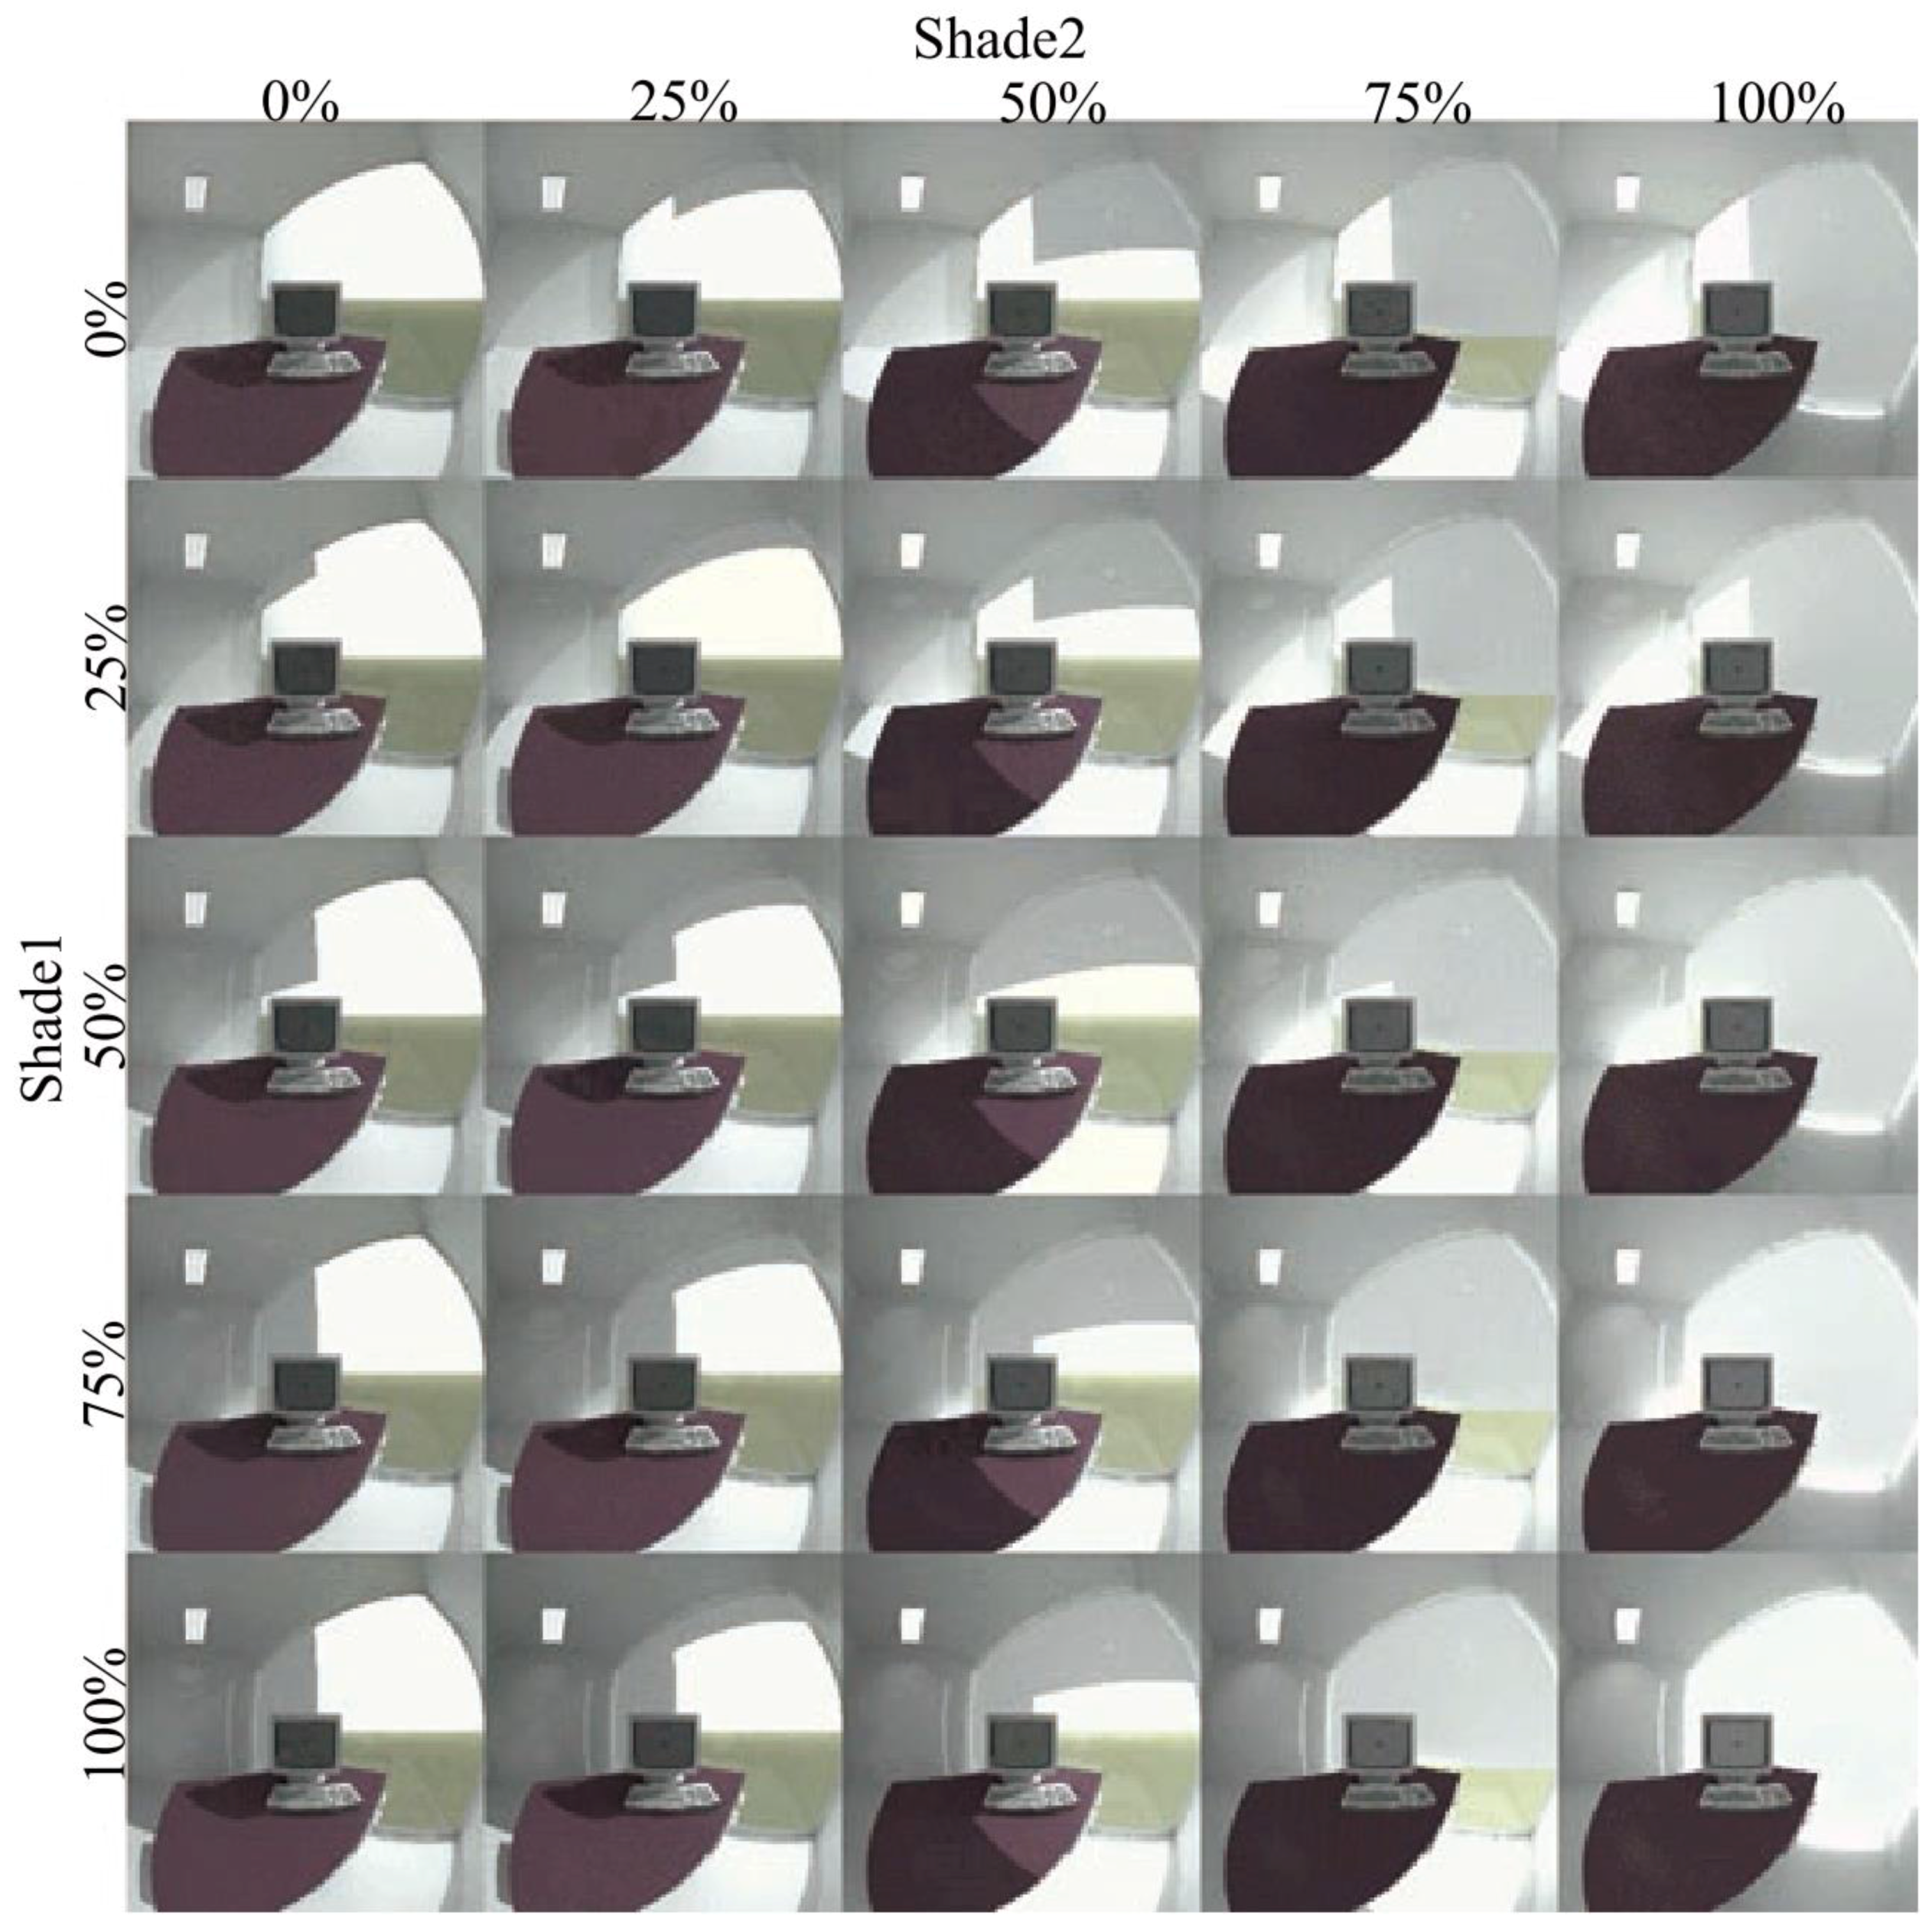
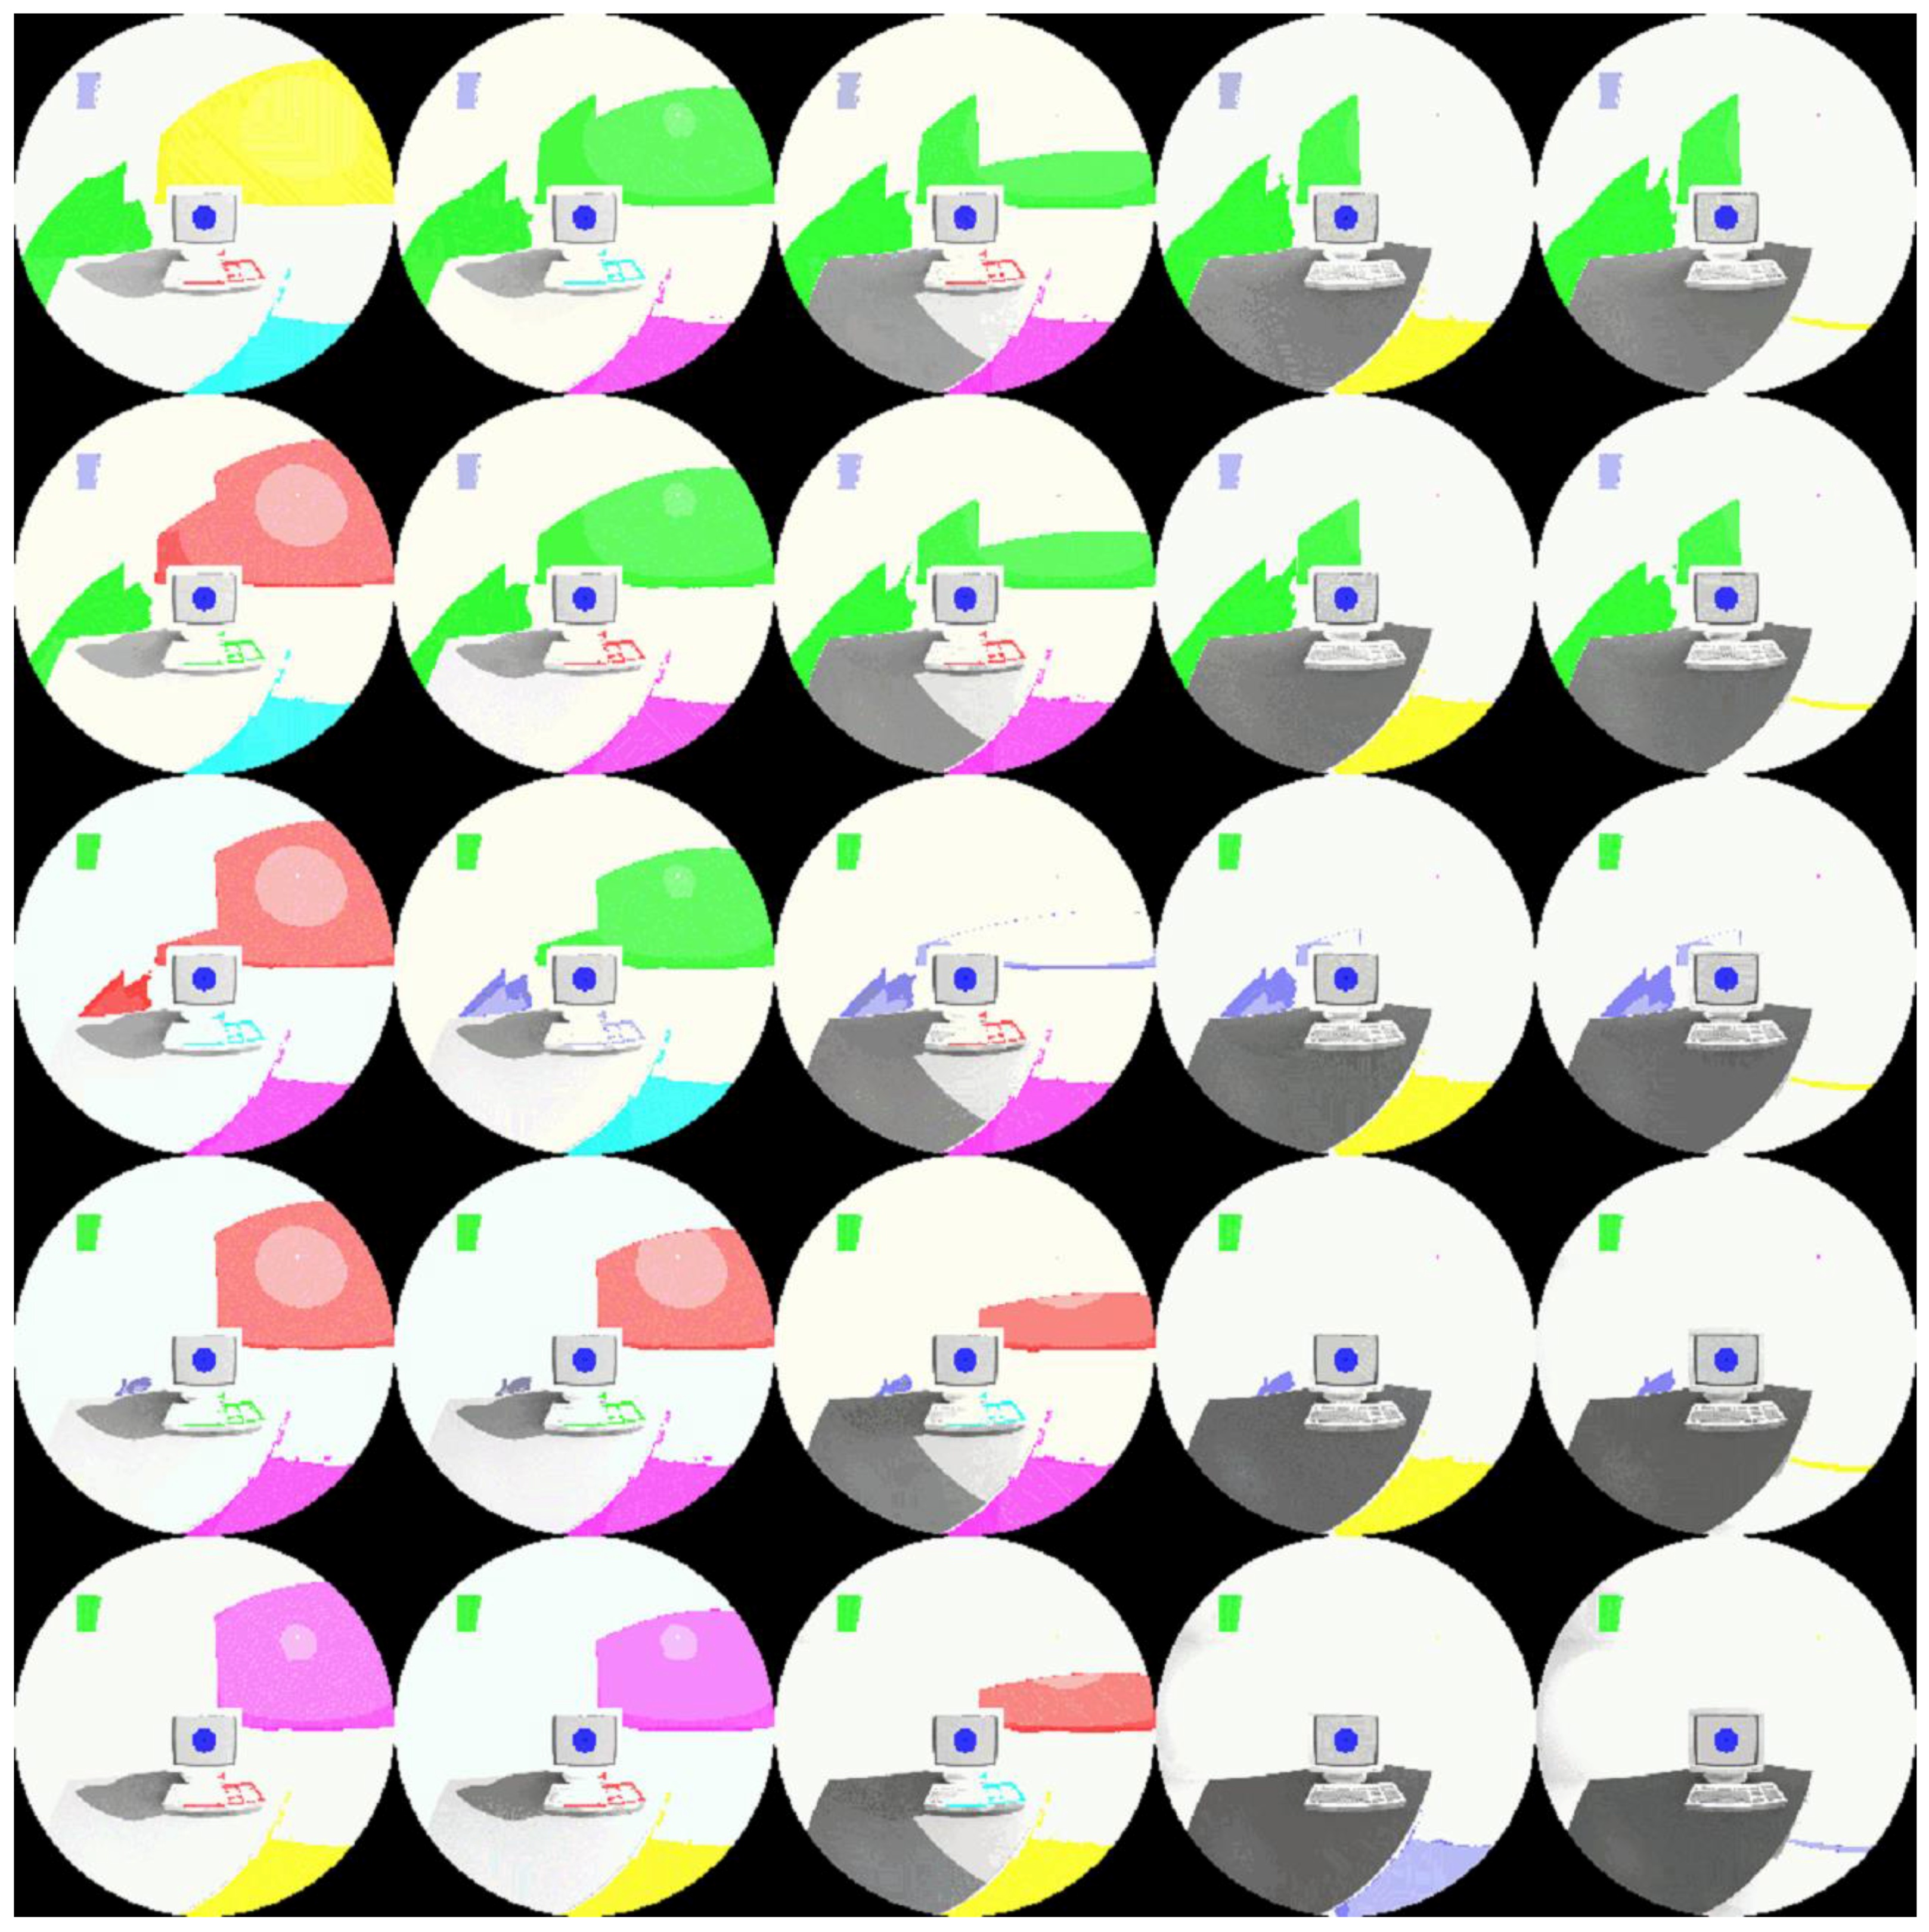
Evalglare uses images in the Radiance image format (PIC or HDR) which enables its user to evaluate simulated scenes as well. Thus the scenes of the room model with the four measures are simulated in Radiance, a widely used software for daylighting simulations [
28], and the PIC format images are created. For movable solar shades, there are 25 scenes (five shade positions for each solar shade and thus a total of 5 × 5 scenes) for Shadeint/Shadeext. Each scene is simulated for different seasons and daytimes (working hours are from 8:00 to 17:00) and three typical days in each season is considered (summer: 1 July, winter: 1 January, and transition season: 15 April) in each season (summer: from 1 June to 30 September, winter: from 1 December to 28 February and transition season: from 1 March to 31 May and from 1 October to 30 November) [
17], due to a prohibitively time consuming simulation in Radiance (the simulation of one scene is about 0.5 h and thus it would require a total of 91,250 h (0.5 × 3650 × 25 × 2) to simulate the whole year for the two movable solar shades hour). Due to the fact that the penetration of sunlight at different days in the same season does not change considerably, this assumption is therefore reasonable [
17].
Then the PIC format images for each scene at each time are used in Evalglare for glare scores (DGP) evaluation and the detected glare sources will be colored (the rest is automatically in grayscale, different colors). When evaluating glare intensity, a task luminance (a circular zone on center of the computer screen reflecting occupants’ computer tasks) is considered as threshold for the glare source detection. The advantage of using task luminance is that it takes into account the adaption of occupants’ eyes compared to a fixed luminance threshold value of 2000 cd/m2. The different colors indicate separate glare sources and no special meaning of the color exists in Evalglare version 1.08. Each pixel in the scene with a luminance value 10 times higher than the average task-zone luminance is treated as a glare source.
4. Conclusions
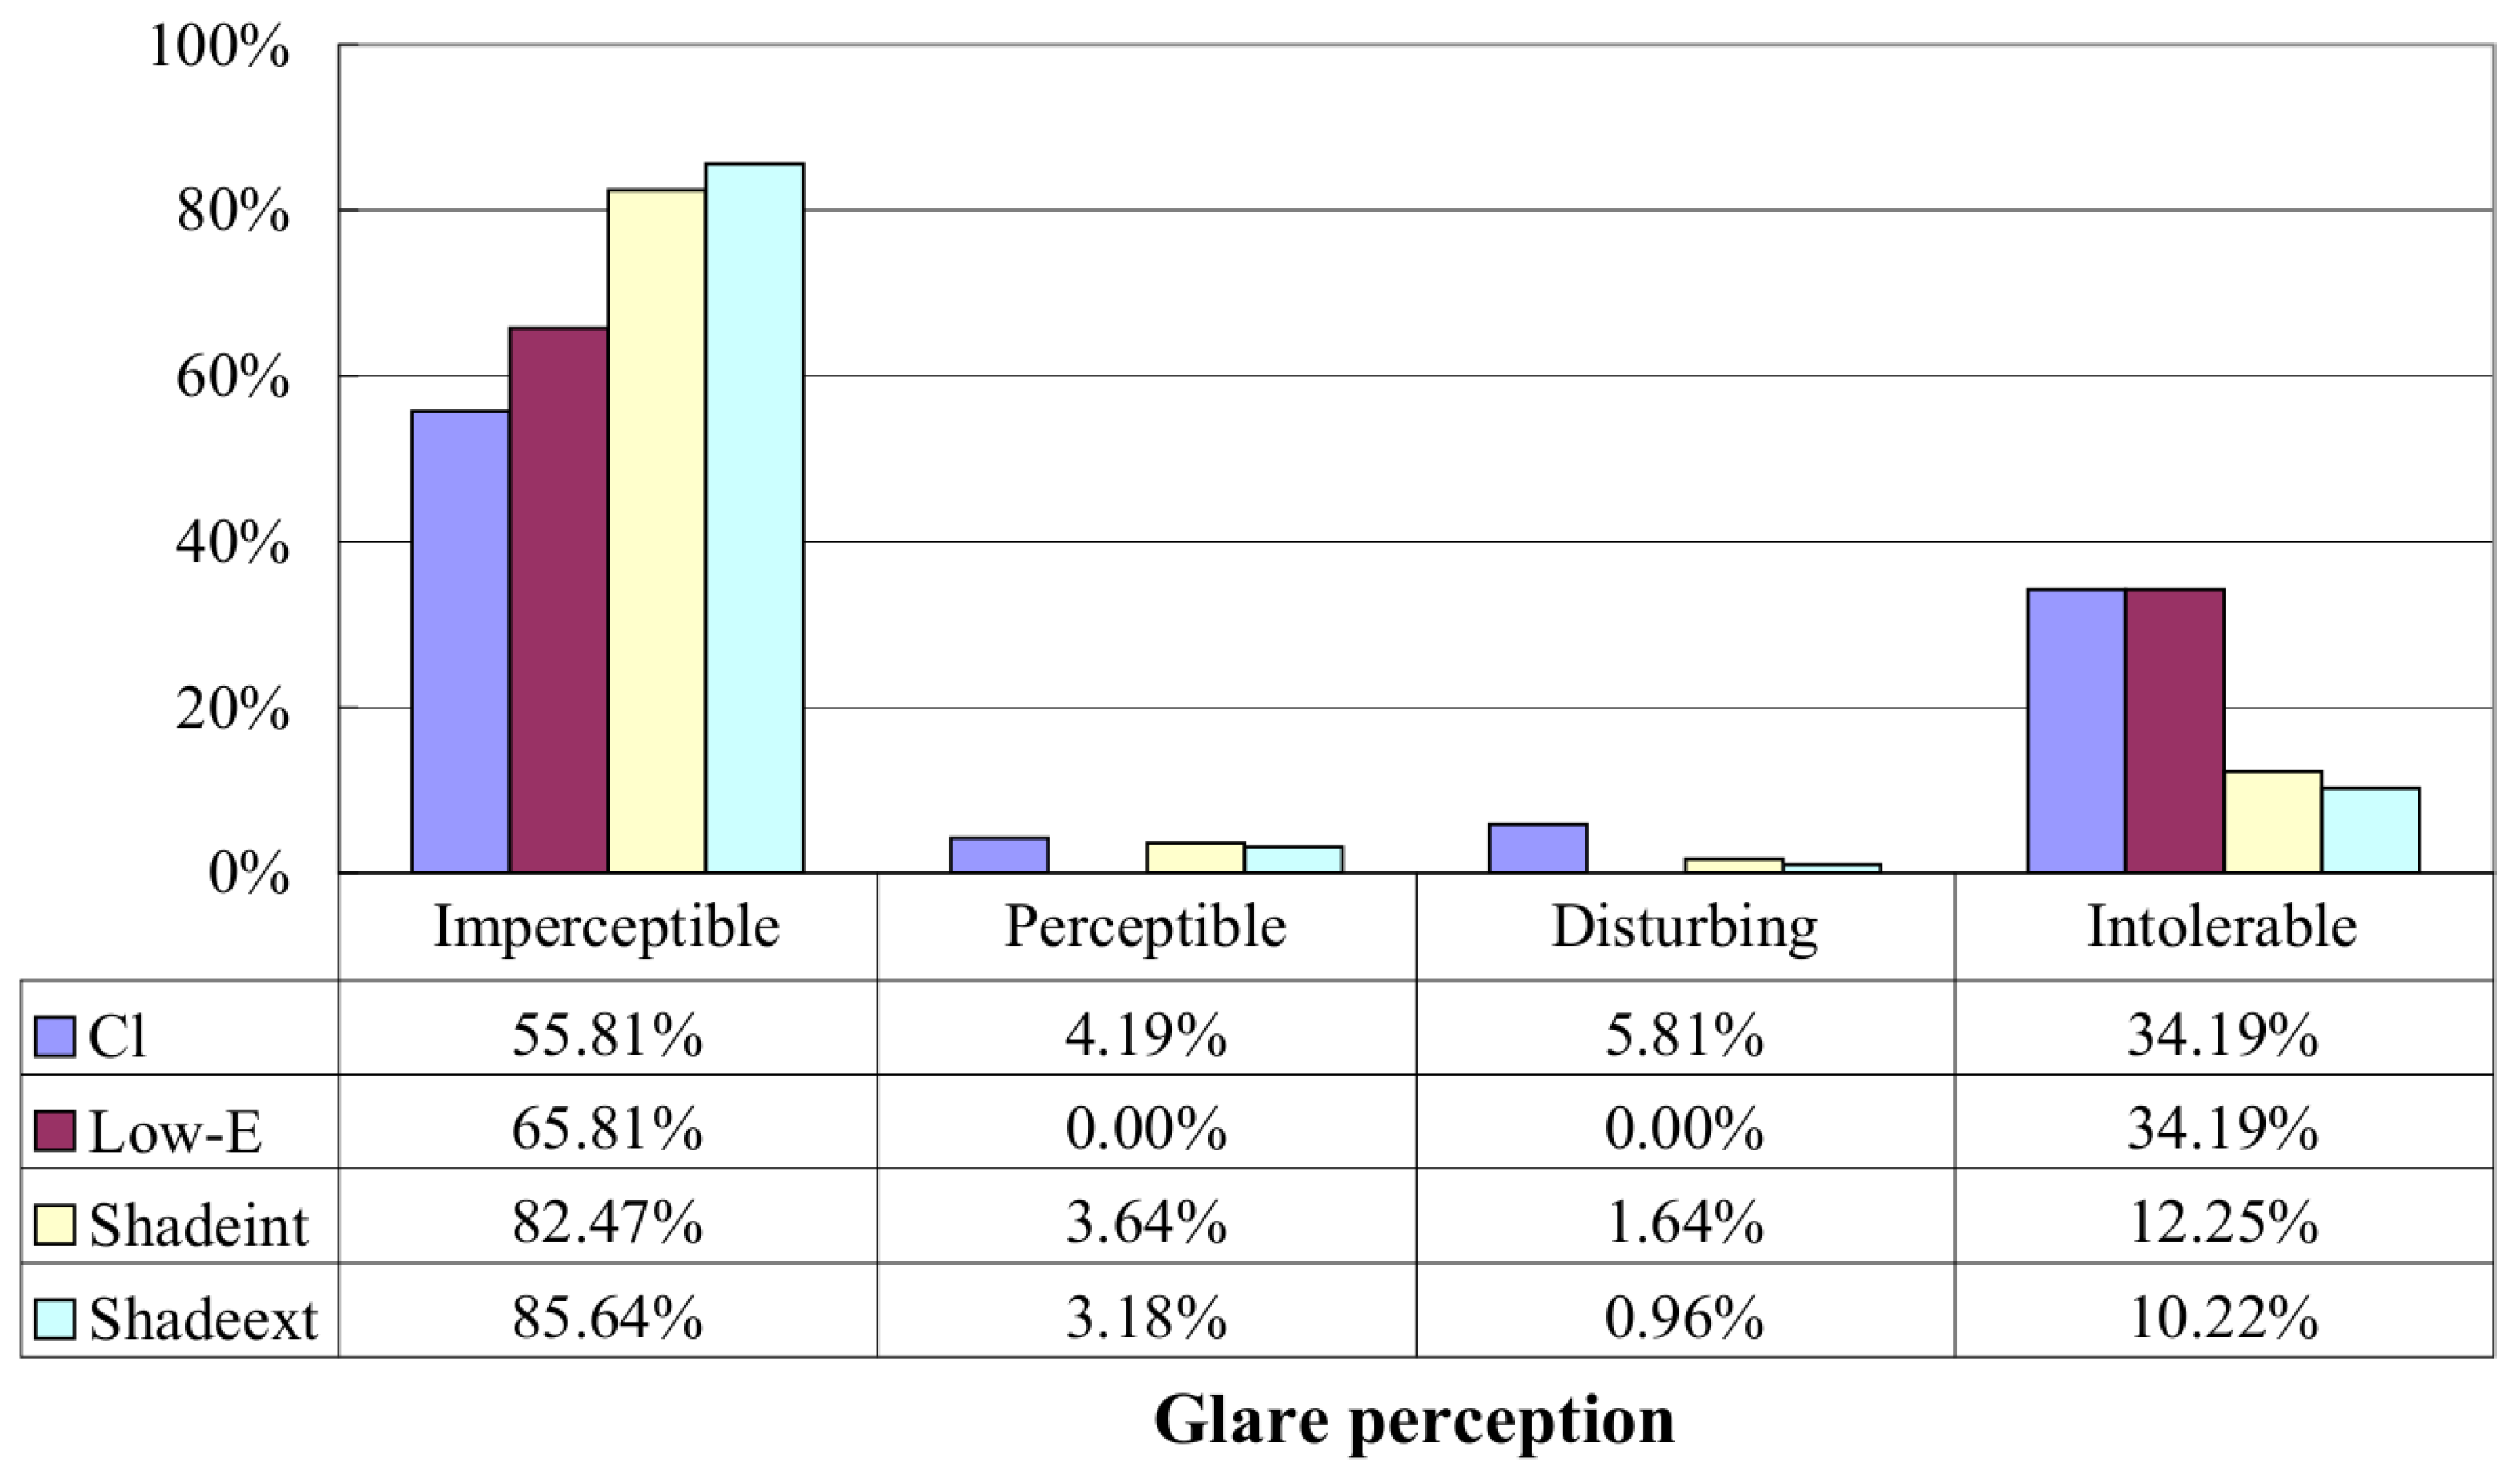
The adjustment of manual solar shades relies on occupants’ behavior, which is in fact stochastic. Thus, the impact of manual solar shades on indoor comfort is occupant dependent and the assumption of shades control with a fixed schedule cannot reflect the shade adjustment in reality. This paper tries to overcome this problem by taking into account the stochastic characteristic of occupants’ shade control. A co-simulation study was carried out to evaluate the impact of manually controlled solar shades on indoor visual comfort. Several visual comfort indices, including useful daylight illuminance (UDI), daylight illuminance fluctuation (DIF), daylight glare index (DGI) and daylight glare probability (DGP), have been adopted to have a comprehensive comparison with normal low-e windows and clear pane windows.
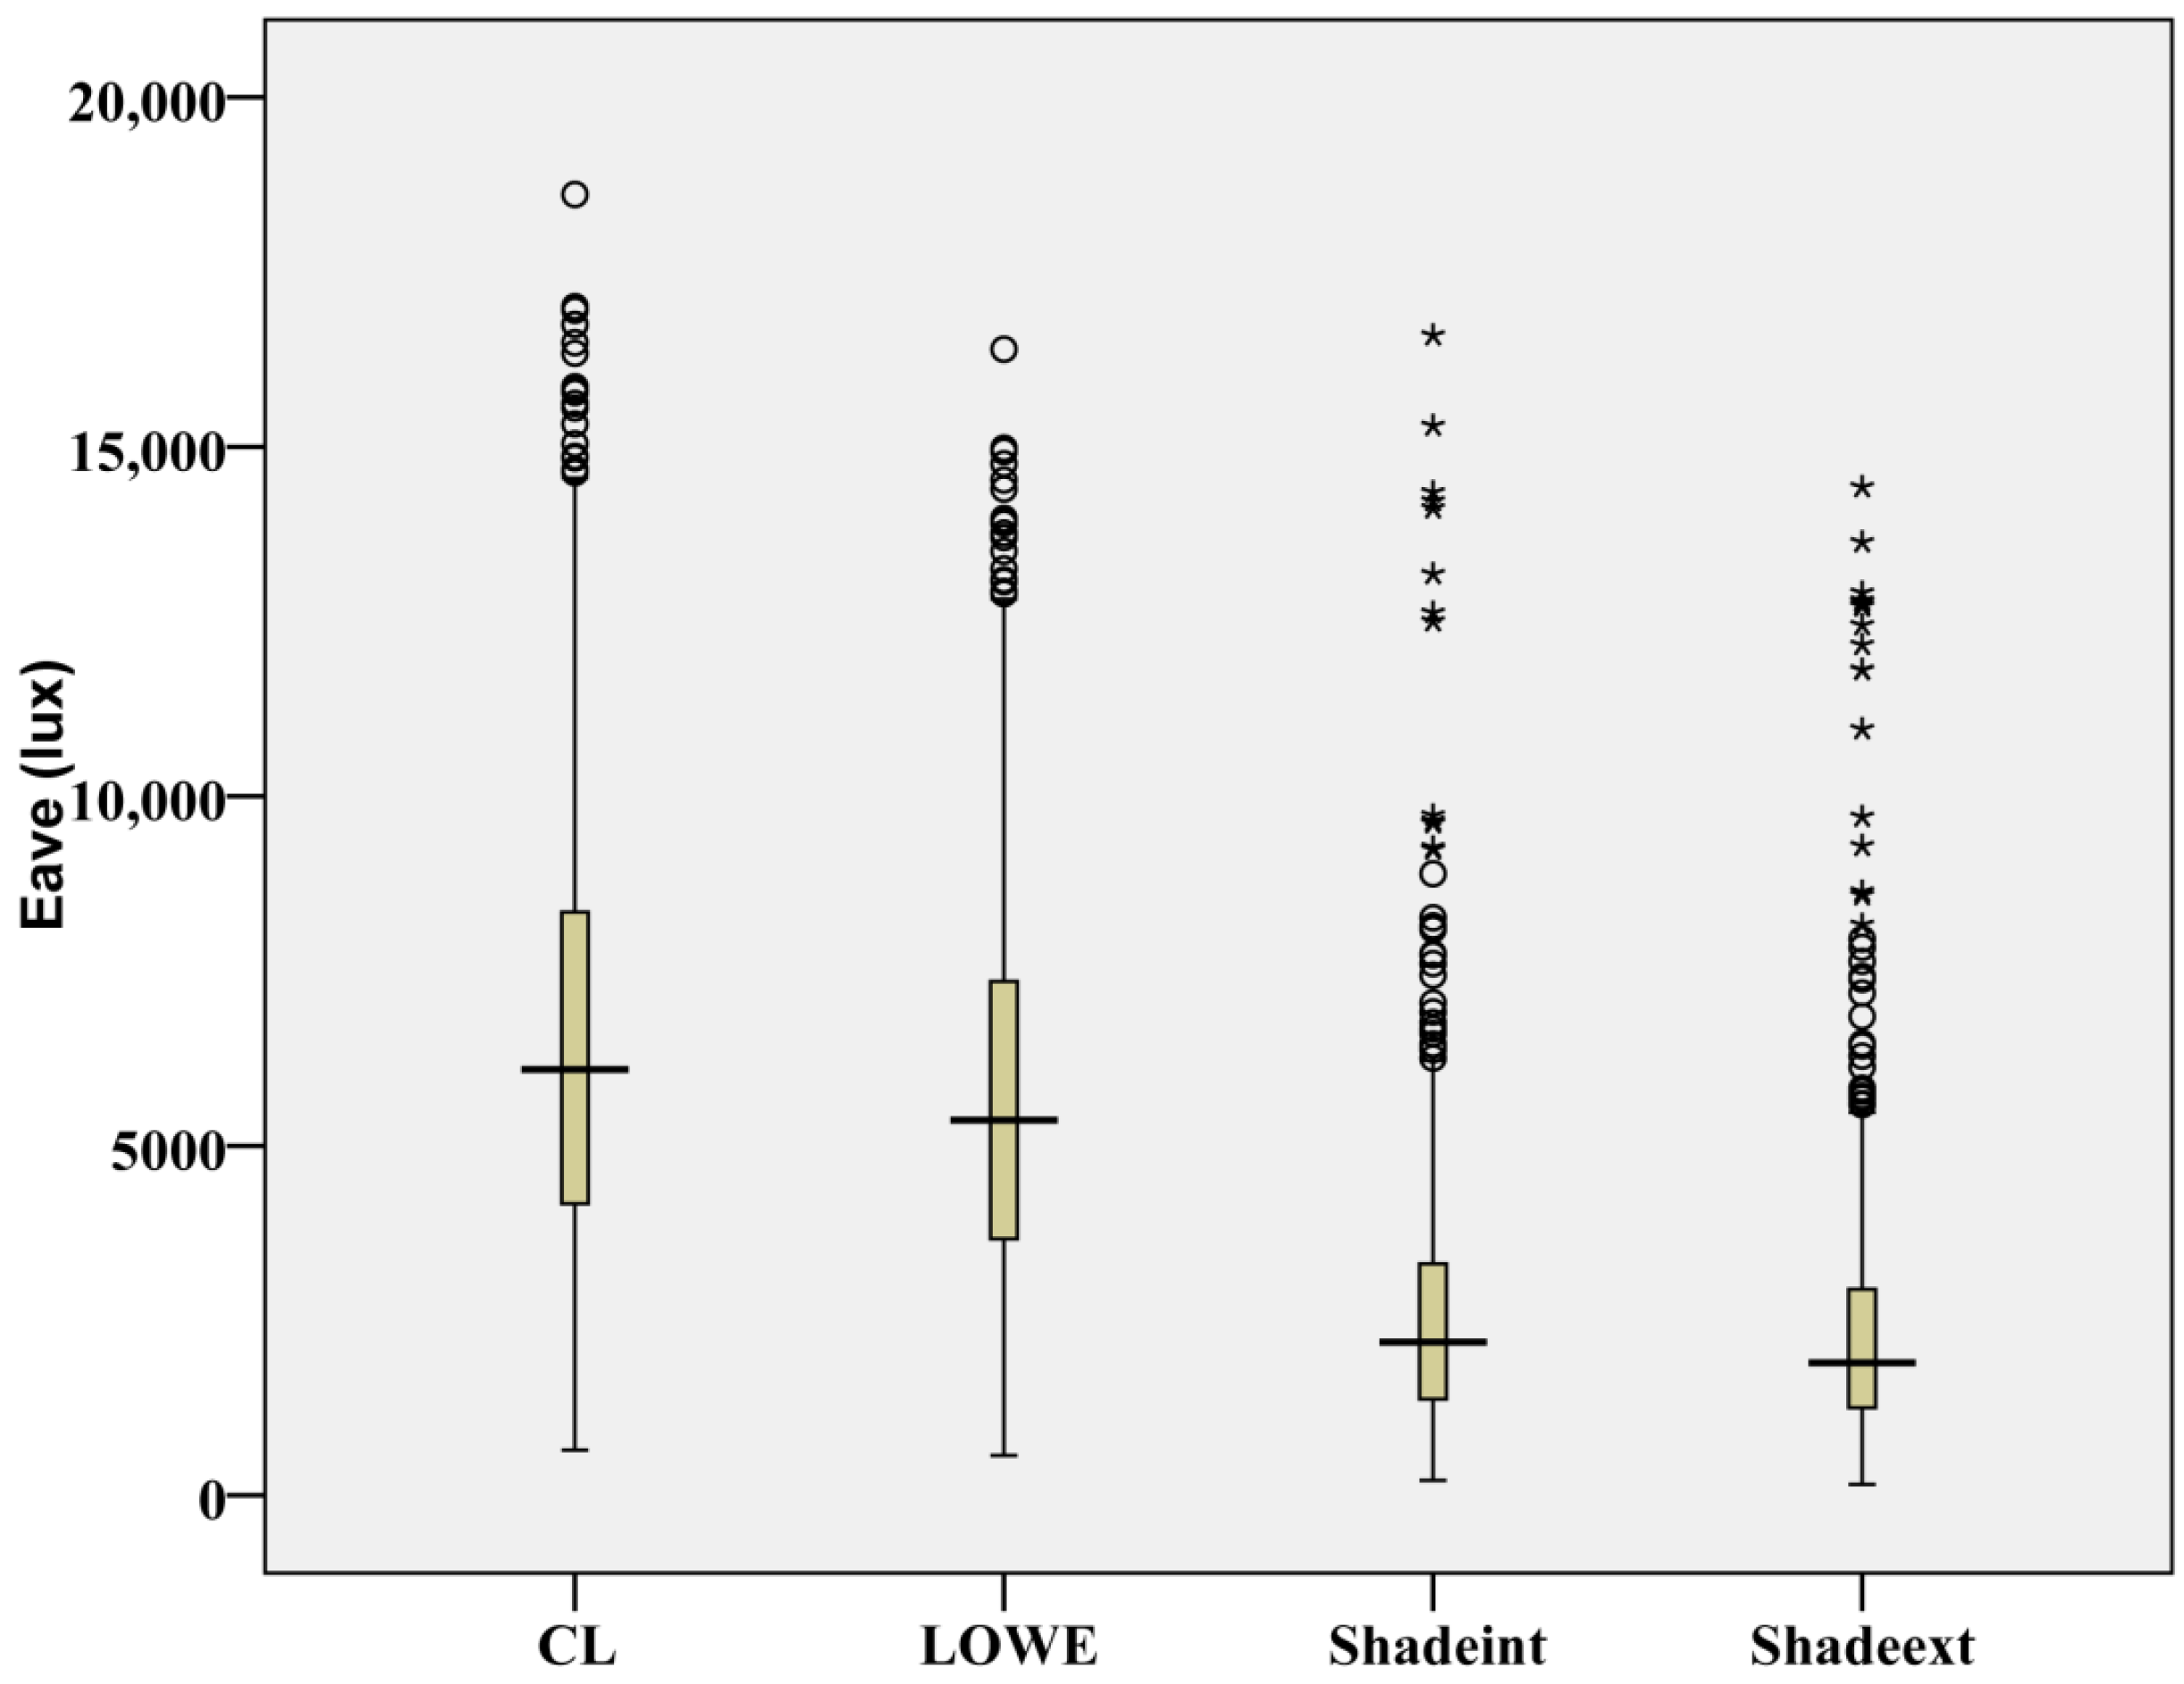
The results showed that movable solar shades have more than half of the working hours with a comfortable illuminance level (useful daylight illuminance), which is about twice higher than clear pane windows and low-e windows. Meanwhile, the daylight illuminance fluctuation for movable solar shades is also significantly less. For glare protection, movable solar shades increase comfortable visual conditions (glare imperceptible) by about 30% compared to clear pane windows and by about 20% compared to low-e windows. Moreover, the intolerable glare perception can be reduced by more than 20%. When manual solar shades are adopted in building design, it is better to consider external solar shades rather than internal ones since external shades provide not only a better visual comfort condition as discussed above but also a comfortable indoor thermal environment [
17] with less building energy consumption [
13]. The findings of this paper can be applied to buildings with similar solar shades. For other shading types, however, the conclusion may be different.
Although the quantitative evaluation of the impact of manual solar shade control on indoor visual comfort has been provided based on a co-simulation analysis, further studies including long-term field measurements of occupants’ visual perception will be needed to have a better understanding between occupants’ stochastic shade control and visual perception and to give possible suggestions on improving shade control for a better indoor visual condition.


