Article

Driving Sustainable Competitive Advantage in the Mobile Industry: Evidence from U.S. Wireless Carriers

College of Business Administration, Seoul National University, 1 Gwanak-ro, Gwanak-gu, Seoul 08826, Korea
*
Author to whom correspondence should be addressed.
Sustainability 2016, 8(7), 659; https://doi.org/10.3390/su8070659
Submission received: 19 May 2016 / Revised: 30 June 2016 / Accepted: 4 July 2016 / Published: 12 July 2016
(This article belongs to the Special Issue Sustainability in Supply Chain Management)

Abstract

:
In light of the growing importance of data network quality in the wireless industry, this study analyzes and compares efficiencies in management, service quality, network quality, and market in the 4G Long Term Evolution (LTE) wireless industry. For this purpose, a bootstrap data envelopment analysis (DEA) model using representative U.S. wireless carriers as decision making units (DMUs) was designed and conducted, with further verification through the Mann-Whitney U and Wilcoxon W test, to examine the differences in efficiency distribution. The results indicate that, in terms of efficiency distribution, network quality efficiency and market efficiency belongs to the same group as that which has high management efficiency. Based on these results, this paper suggests implications and strategic guidelines for wireless carriers for improvement in management efficiency.

1. Introduction

Communication services in the 21st century have witnessed a notable growth in the wireless market, driven by advances in long distance and satellite communication technologies. More specifically, advances in wireless technology from analogue to digital technology and IMT-2000, and again to 4G Long Term Evolution (LTE) technology have brought a shift in market priority from voice communication to data network communication. The advent of new technology has also intensified the competition in communication market to motivate firms to place greater efforts in improving service quality, whose most important factor also shifted to network quality over voice quality with the technological changes. In particular, the speed of downloads and uploads has been pinpointed by many, including the U.S. Federal Communications Commission (FCC), as the top factor determining network quality in the wireless industry.
Gronroos [1] classifies service quality into technical quality and functional quality, and under this classification, the technical quality of wireless communication can be understood as network quality and functional quality as customer confidence, attitude, and behavior [2]. Traditionally, the functional quality has been regarded as being more significant than technical quality in determining service quality [3]. However, with the growing importance of network quality, whether the priority of functional quality over technical quality still holds in the context of the wireless market is questionable. In a highly competitive market such as wireless communication services, identifying the most efficient area to focus resources and efforts can be critical for achieving a high business performance and good market position, and in turn, to becoming the leading firm in the market [4].
Measurement of efficiency rating have been used in previous literature on the wireless communications market as a way to identify focal areas for wireless carriers to improve business performance and market position [5,6]. However, most of these studies have focused on economic planning, investment section, or production in their investigations [7]. Therefore, this study proposes to investigate how technological advances in the wireless market has affected the influence of network quality versus service quality on business performance. That is, utilizing the well-supported method of measuring efficiency, this study analyzes which between the technical and functional quality of the wireless communication service determines the management efficiency of wireless carriers.
In doing so, this study applies Grönroos [1] classification to define technical quality as the data network performance and functional quality to the service provided to customers. Accordingly, the efficiency for technical quality can be described as “network quality efficiency” while the efficiency for functional quality can be expressed as “service quality efficiency”. To examine the relationship among network quality, service quality, and management efficiencies, three hypotheses are tested using bootstrap DEA to see the correlation among the distribution of efficient decision making units (DMUs) for each quality to management efficiency. The three-year data for representative U.S. wireless carriers, namely, Verizon wireless, AT & T, Sprint Nextel, and T-mobile, are used as the decision making units for analysis.
The composition of this study is as follows. Section 2 outlines previous discussions on service quality and network quality in the wireless industry from existing research to draw the input and output factors for this study. Section 3 explains the research model and methodology of research while Section 4 presents the results of analysis. The summary of the results and the implications and limitations of this study are given in Section 5.

2. Materials and Methods

2.1. Service Quality in the Wireless Industry

In terms of factors that determine service quality, Lewis and Brooms [8] defined service quality as the proximity of the service provided to the customers’ expectations, and Parasuraman, et al. [9] suggested measurement of service quality as the gap between customer’s pre-service expectation and performance based on the SERVQUAL model. However, in the case of communication service, Bolton and Drew [10] identified that service quality can be measured sufficiently by only looking at performance. Following Bolton and Drew [10], this study proposes to use performance, without customers’ pre-service expectations, as output factor.
On the other hand, this study identifies purchase experience and customer care, highlighted by Zaltman and Wallendof [11], as the outcomes (outputs) of service quality. These two elements are related to customer satisfaction, which is affected by service quality and contribute to the loyalty of customers as well as the product or service’s profitability [12,13]. A number of scholars have reported that better service quality leads to greater customer satisfaction to improve market share and significantly affect customers’ intention to revisit [14,15,16]. To increase customer satisfaction, wire carriers have been allocating a good deal of their budgets to sales promotion [17] as an effective sales tool in reflection of greater market competition and customers’ growing preference for cheaper services.
At the same time, scholars have pointed out that customers’ preference towards sales promotion benefits can differ by customer [18], that is, not all customers think cheaper is better. Chandon, et al. [19] argued that non-instrumental, empirical, and emotional benefits are central in sales promotion. Purchase experience and customer care influence service quality by providing customers benefits beyond price: purchase experience by enhancing all touchpoints between the customer and the brand and customer care by building customer trust. Thus, Lee-Kelley, et al. [20] stipulated that these two elements are important service quality factors that enable firms to maintain customer preference and loyalty in the long run. In other words, the expanding or preserving market share entails the management of purchase experience and customer care at the service interface to manage and improve service quality [21].
The indices used for purchase experience and customer care have been extracted from J.D. Power’s “U.S. Wireless Customer Care Full-Service Performance Study” and “U.S. Full-Service Wireless Purchase Experience Study”. J.D. Power is a global market research company that conducts surveys on customer satisfaction, product quality, and buyer behavior and provides indices on related topics.

2.2. Network Quality in the Wireless Industry

Existing literature expostulate the direct connection between network quality and customer satisfaction, for example, Kelly, et al. [22] reported that customer’s experience of access failure in network service connection affects brand conversion. Although voice quality has been highlighted in understanding customer satisfaction in mobile communication service in the past [23,24], as the telecommunication market shifted from 3G to 4G LTE, data communication quality has risen in priority in terms of network quality. In light of this change, leading information technology (IT) magazines such as PC World regularly measure and publish reports on each wireless carrier’s 4G wireless communication speed. In particular, the speed of uploads and downloads have been highlighted recently as the most significant element for network quality [25], by Tseng and Chiu [26] based on their research on the broadband service market in Taiwan as well as the FCC [27].
Focusing on data communication quality, this study uses upload/download speeds as factors for measuring the network quality of wireless carriers in the 4G LTE market. The data for upload/download speeds is drawn from the survey conducted for the U.S. region by NOVARUM, a private institution specializing in strategic consulting and analysis for the wireless industry.

3. Methodology

3.1. Data Envelopment Analysis for Measuring Performance

Data envelopment analysis (DEA) is a non-parametric approach based on linear programming for assessing the relative efficiencies of a set of decision making unit (DMUs) that transform input into outputs [28,29]. DEA was developed by Charnes, et al. [30] and has been applied to various areas [31,32,33,34,35,36,37]. The Charnes, Cooper and Rhodes (CCR) model and Banker, Charnes, and Cooper (BCC) model are the representative models of DEA, and depending on the input-output relationship, one can use either the CCR model, based on constant returns to scale (CRS), or the BCC model, based on variable returns to scale (VRS). The CCR model assumes that a 1 percent increase in input results in a 1 percent increase in output, whereas the BCC model assumes that a 1 percent increase in input results in an output greater or less than 1 percent. Thus, the CCR model is appropriate when all DMUs are operational in their optimum scale, whereas, from a managerial perspective, the BCC model may be preferred if the focus is on the extent to which the scale of operations affects productivity [38,39]. In this paper, the output-oriented BCC Model that assumes the VRS will be used. The BCC model can be shown as Equation (1) below [40], where u r is the weight assigned to the r-th output, v i is the weight assigned to the i-th input, y r j is the amount of r-th output of D M U j , x i j is the amount of i-th input of D M U j , ε is a non-Archimedean number, n is the number of DMUs, m is the number of input variables, and s is the number of output variables, and v 0 is the scale indicator:
Minimize  h 0 ( Efficiency of  D M U 0 )   = i = 1 m v i x i 0 + v 0 r = 1 s u r y r 0
s . t .   i = 1 m v i x i j + v 0 r = 1 s u r y r j 1   ,   j = 1 , 2 , 3 , , n
u r ε > 0   ,   r = 1 , 2 , 3 , ,   s
v i ε > 0   ,   i = 1 , 2 , 3 , ,   m
It should be noted that v 0 only exists in the BCC model and not in the CCR model, as the CCR model assumes constant returns to scale while the BCC model assumes a variable returns to scale which uses a scale indicator.

3.2. Bootstrap DEA

Since this study aims to compare and verify the distribution in management, service quality, network quality, and market efficiencies among the DMUs, Bootstrap DEA is performed following the suggestion by Simar and Wilson [41] to overcome the non-parametric restrictions that DEA has in general. While DEA provides the advantage of being able to evaluate efficiency using linear metric without statistical assumptions, this can also work as a disadvantage as the resulting efficiency scores are relative values that change with the change in the number of DMUs. That is, DEA can lead to a false evaluation as it lacks statistical verification for the efficiency score.
In recognition of these problems, Simar and Wilson [41] applied the bootstrap method to the existing DEA model. As a non-parametric statistical technique introduced by Efron [42], bootstrap DEA helps to compare the differences in efficiency among groups. The application of bootstrap on the non-parametric DEA model enables scholars to calculate the confidence interval and standard error for the frontier model, and also opens ways to explain the differences among efficient DMUs when DEA results evaluated multiple DMUs as efficient. In this study, the bootstrap DEA method is applied to eliminate the bias in the efficiency score to provide statistical significance as well as to tie-break the DMUs that are shown as efficient in the DEA analysis results.
The process to estimate the efficiency of the BCC model using bootstrap DEA follows that outlined by Simar and Wilson [41] and Kim and Kim [43]:
(1)
Calculate the technical efficiency score ^ k   ( k = 1 , 2 , 3 , L ) of individual DMUs through the standard linear programming DEA model
(2)
Generate a random sample in the size L from { ^ k   ( k = 1 , 2 , 3 , L ) } to utilize kernel density estimation to provide { 1 b * , 2 b * ,   3 b * , L b * }
(3)
Calculate {( x k ,   y k b * ) ,   k = 1 , 2 , 3 , L } as a pseudo data set to generate reference bootstrap technology
(4)
Calculate the bootstrap efficiency estimation ^ k b *   ( k = 1 , 2 , 3 , L ) of each DMU’s technical efficiency score, ^ k   ( k = 1 , 2 , 3 , L ) , by finding the values of a Bootstrap corresponding model
(5)
Repeatedly calculate B times (B is a larger number) in order to obtain the Bootstrap efficiency estimation { ^ k b *   ( b = 1 , 2 , 3 , B ) } . Hall [44] suggested B = 1000 to ensure the proper range of the confidence interval, and Simar and Wilson [45] suggested B = 2000.
The bootstrap efficiency estimation gained through the five steps above can be calculated using the following equation:
θ ¯ k * = 1 B b = 1 B θ ^ k b *
Simar and Wilson [41] suggested b = 1 ,   ,   B to be arranged in an incremental order of θ ^ k b * θ ^ k values and to eliminate the value of ( α 2 × 100 ) % from values at the far ends. Then, the values at the far ends (the smallest and the largest values) become b ^ α * and a ^ α * . Thus, the confidence interval of ( 1 α ) × 100 % for the estimated score can be expressed in the following equation:
θ k ^ + a α ^ * θ k θ k ^ + b α ^ *
At the same time, the bias of the efficiency estimation θ k ^ can be found using the bootstrap sample through the following equation:
b i a s k ^ ( θ ^ k ) = θ ¯ k * θ k ^
Therefore, the bootstrap DEA efficiency score is the efficiency score gained through the original efficiency score minus the bias score.

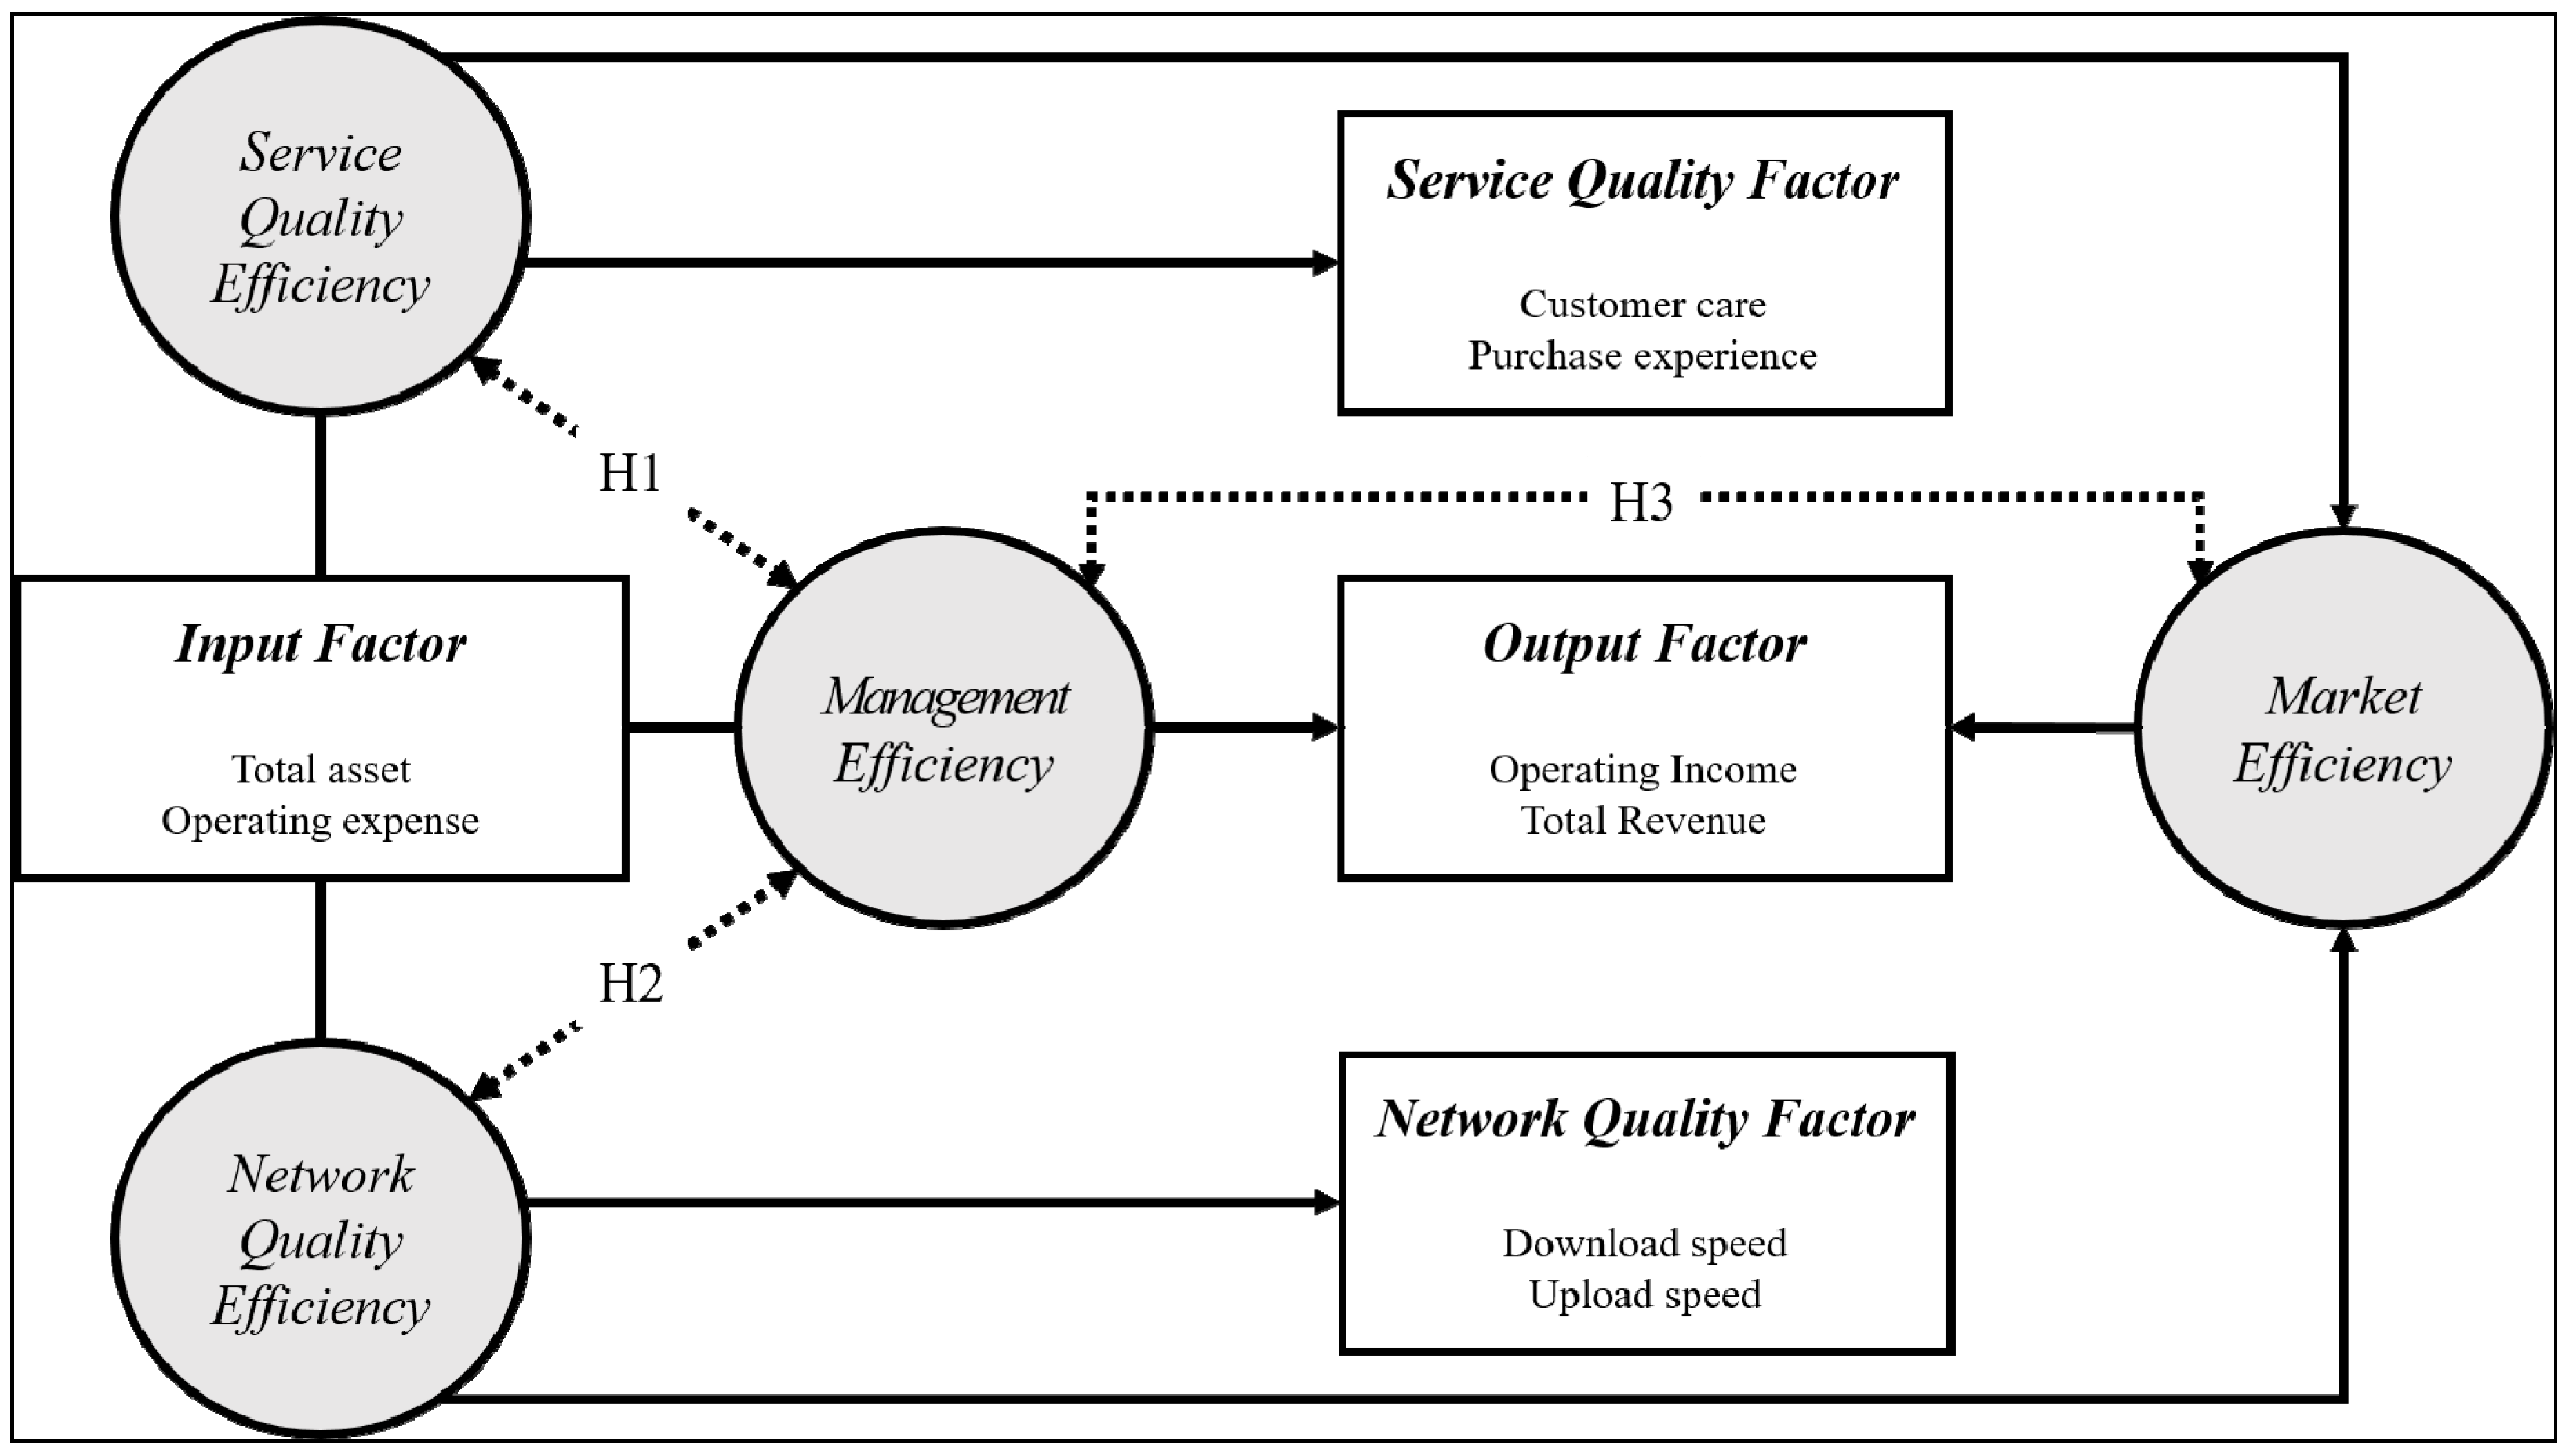
3.3. Service and Network Quality Efficiency Model

The research model, including the four DEA models tested in this study, is visualized in Figure 1, while the details of the four DEA models are given in Table 1. The four DEA models are conducted to analyze management efficiency, service quality efficiency, network quality efficiency, and market efficiency using the following input and output factors. First, Model 1 measuring management efficiency assigns total asset (fixed cost) and operating expense (variable cost) as input factors and operating income and total revenue as output factors. Model 2 for service quality efficiency and Model 3 for network quality efficiency also use the same input factors as Model 1, while for output factors, Model 2 uses customer care and purchase experience and Model 3, download speed and upload speed. The values for customer care and purchase experience were extracted from indices provided in J.D. Power’s “U.S. Wireless Customer Care Full-Service Performance Study” and “U.S. Full-Service Wireless Purchase Experience Study”, and the data for average download and upload speed from a survey conducted by NOVARUM for the U.S. region.
Lastly, Model 4 uses the efficiency scores for service quality and network quality gained from Models 2 and 3 as input factors with operating income and total revenue, the output factors for Model 1, as output factors to analyze market efficiency, which shows how effectively revenue is gained through service and network quality efficiency. In other words, these factors measure how well the firm utilizes its efficiency in service and network quality to maximize revenue in the market, which translates to market efficiency.
After the management efficiency, service quality efficiency, network quality efficiency, and market efficiency scores gained from performing DEA for Models 1–4 are tested using Mann-Whitney U test to verify the similarity in efficiency among the DMUs. The Mann-Whitney U test is used as the verification method, rather than the generally-used t-test, because DEA is a nonparametric statistics analysis method. As the main purpose of this study is to identify which between service quality and network quality efficiencies determine management efficiency, this study tests three hypotheses as follows:
  • H1: The distribution of management efficiency and service quality efficiency are the same across.
  • H2: The distribution of management efficiency and network quality efficiency are the same across.
  • H3: The distribution of management efficiency and market efficiency are the same across.
To visualize the relationship between network quality efficiency and service quality efficiency in DMUs, a 2 by 2 matrix is used to plot the DMUs based on their efficiency scores. The matrix is presented in Figure 2 below. In this matrix, Quadrant A shows efficiency in terms of establishing service quality while Quadrant B indicate efficiency in both service quality and network quality. Quadrant C represents inefficiency in both aspects. Lastly, Quadrant D denotes inefficiency in terms of establishing network quality.

4. Result

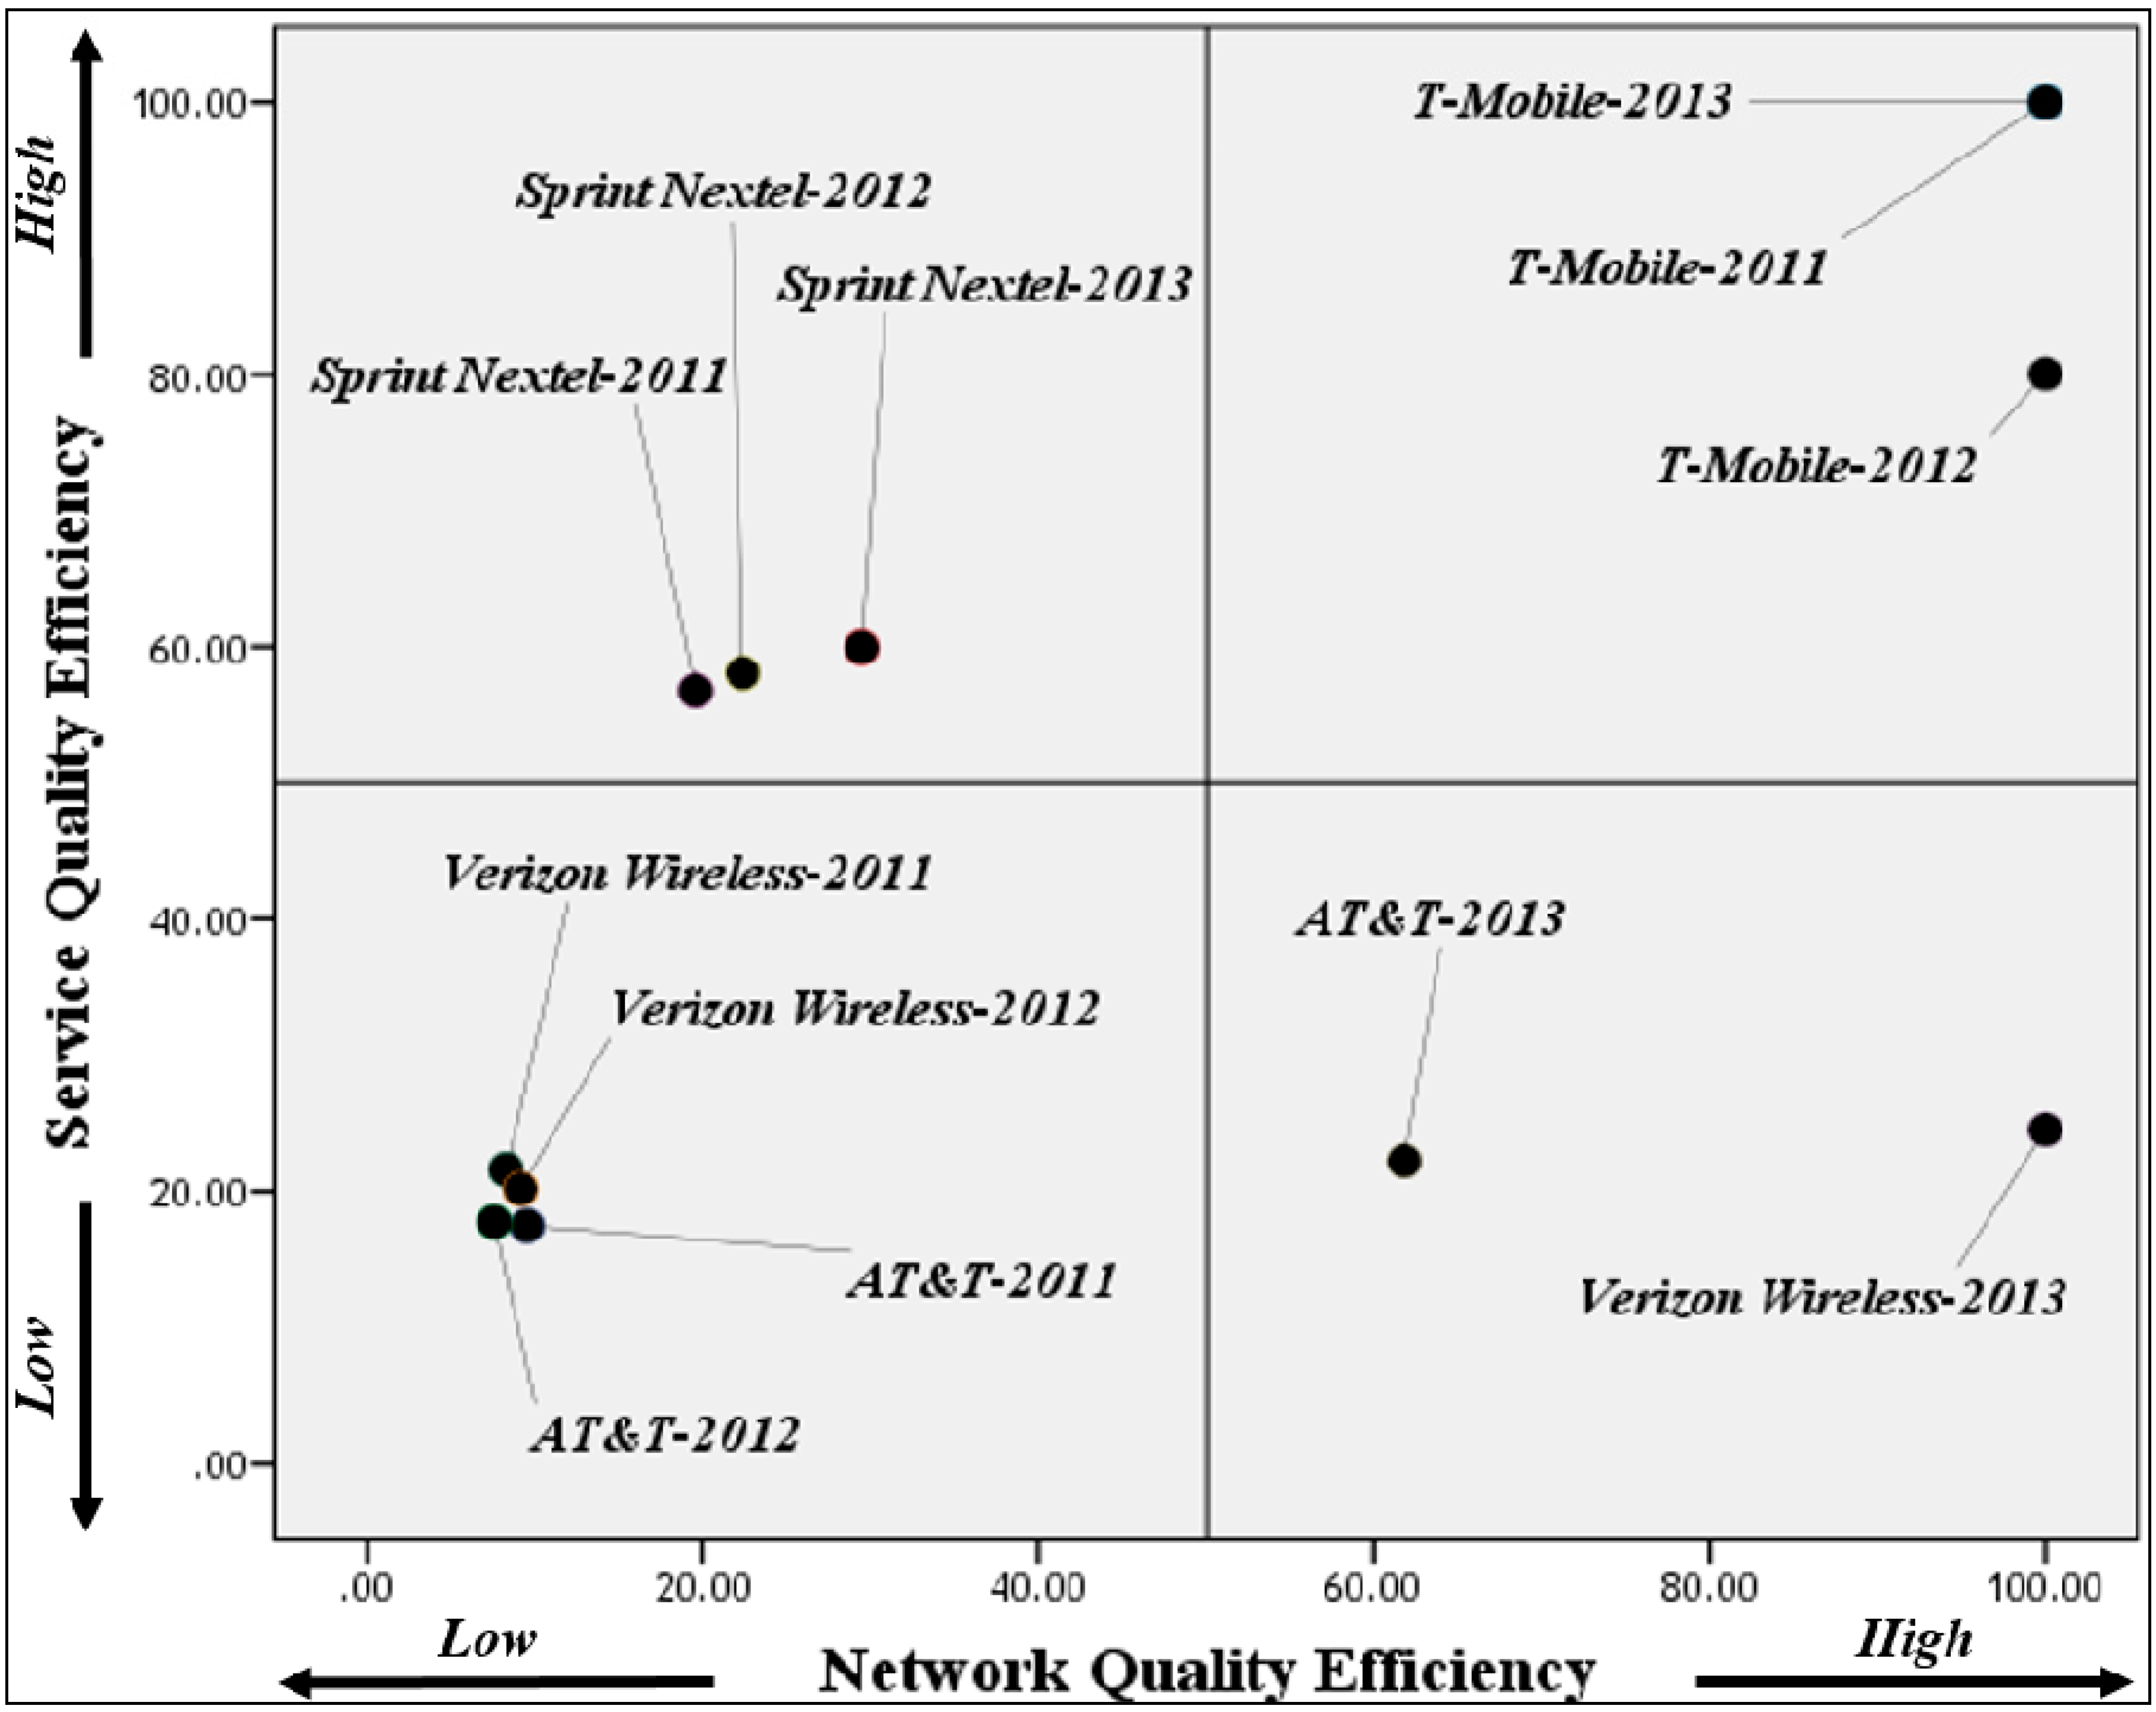
4.1. Efficiency Analysis Results

In this study, the three-year data from 2011 to 2013 of representative wireless carriers in USA—Verizon Wireless, Sprint Nextel, AT & T, and T-Mobile—are set as DMUs. Table 2 below shows the basic statistic of each factor. Each data is collected from the previously mentioned institution, J.D. Power and Novarum, and annual financial reports of each company.
According to Nyhan and Martin [46], the appropriate number of input factors are limited by DEA while the appropriate number of output factors are limited by the DMU. This is because an increase in the number of input and output factors in the DEA results in an increase in efficient DMUs. This, in turn, makes it difficult to distinguish the inefficient DMUs. Banker, et al. [40] and Nunamaker [47] claimed that the number of DMUs should be 3 times greater than the sum of the number of input and output factors, and Boussofiane, et al. [48] claimed that the number of DMUs should be greater than the product of the number of input and output factors. In addition, Fitzsimmons and Fitzsimmons [49] suggested that the number of DMUs should be twice as greater than the sum of the number of input and output factors. The number of DMUs and that of the input and output factors used in this study are 12, 2, 2, respectively, which all satisfies the criteria given by Banker, et al. [40], Nunamaker [47] as well as Boussofiane, et al. [48] and Fitzsimmons and Fitzsimmons [49]. Thus, the number of DMUs used in this study are appropriate for DEA.
The results of DEA verified using bootstrap DEA are listed in Table 3. The results indicate that the most efficient wireless carrier in terms of management is T-mobile in 2011, Verizon Wireless in 2012, and AT & T in 2013, all of which show efficiency scores of 1.
Figure 3 below presents a visual representation of how each of the DMUs performs in terms of service quality efficiency and network quality efficiency. A look at Figure 3 suggests that Sprint Nextel primarily focuses on service quality and is gradually improving its network quality efficiency. On the other hand, Verizon Wireless and AT & T shows the lowest performance in efficiency in 2011 and 2012, but have improved their network quality efficiency from 2013. T-mobile exhibits the highest efficiency in all years.
Based on the Mann-Whitney U test and Wilcoxon W test, the three hypotheses were verified at a significance level of 0.05. The summary of the hypothesis test results are tabulated in Table 4 below. The verification rejected H1, and confirmed H2 and H3. That is, the wireless carriers’ efficiency in establishing network quality and their management efficiency as well as their management efficiency and market efficiency show the same distribution.

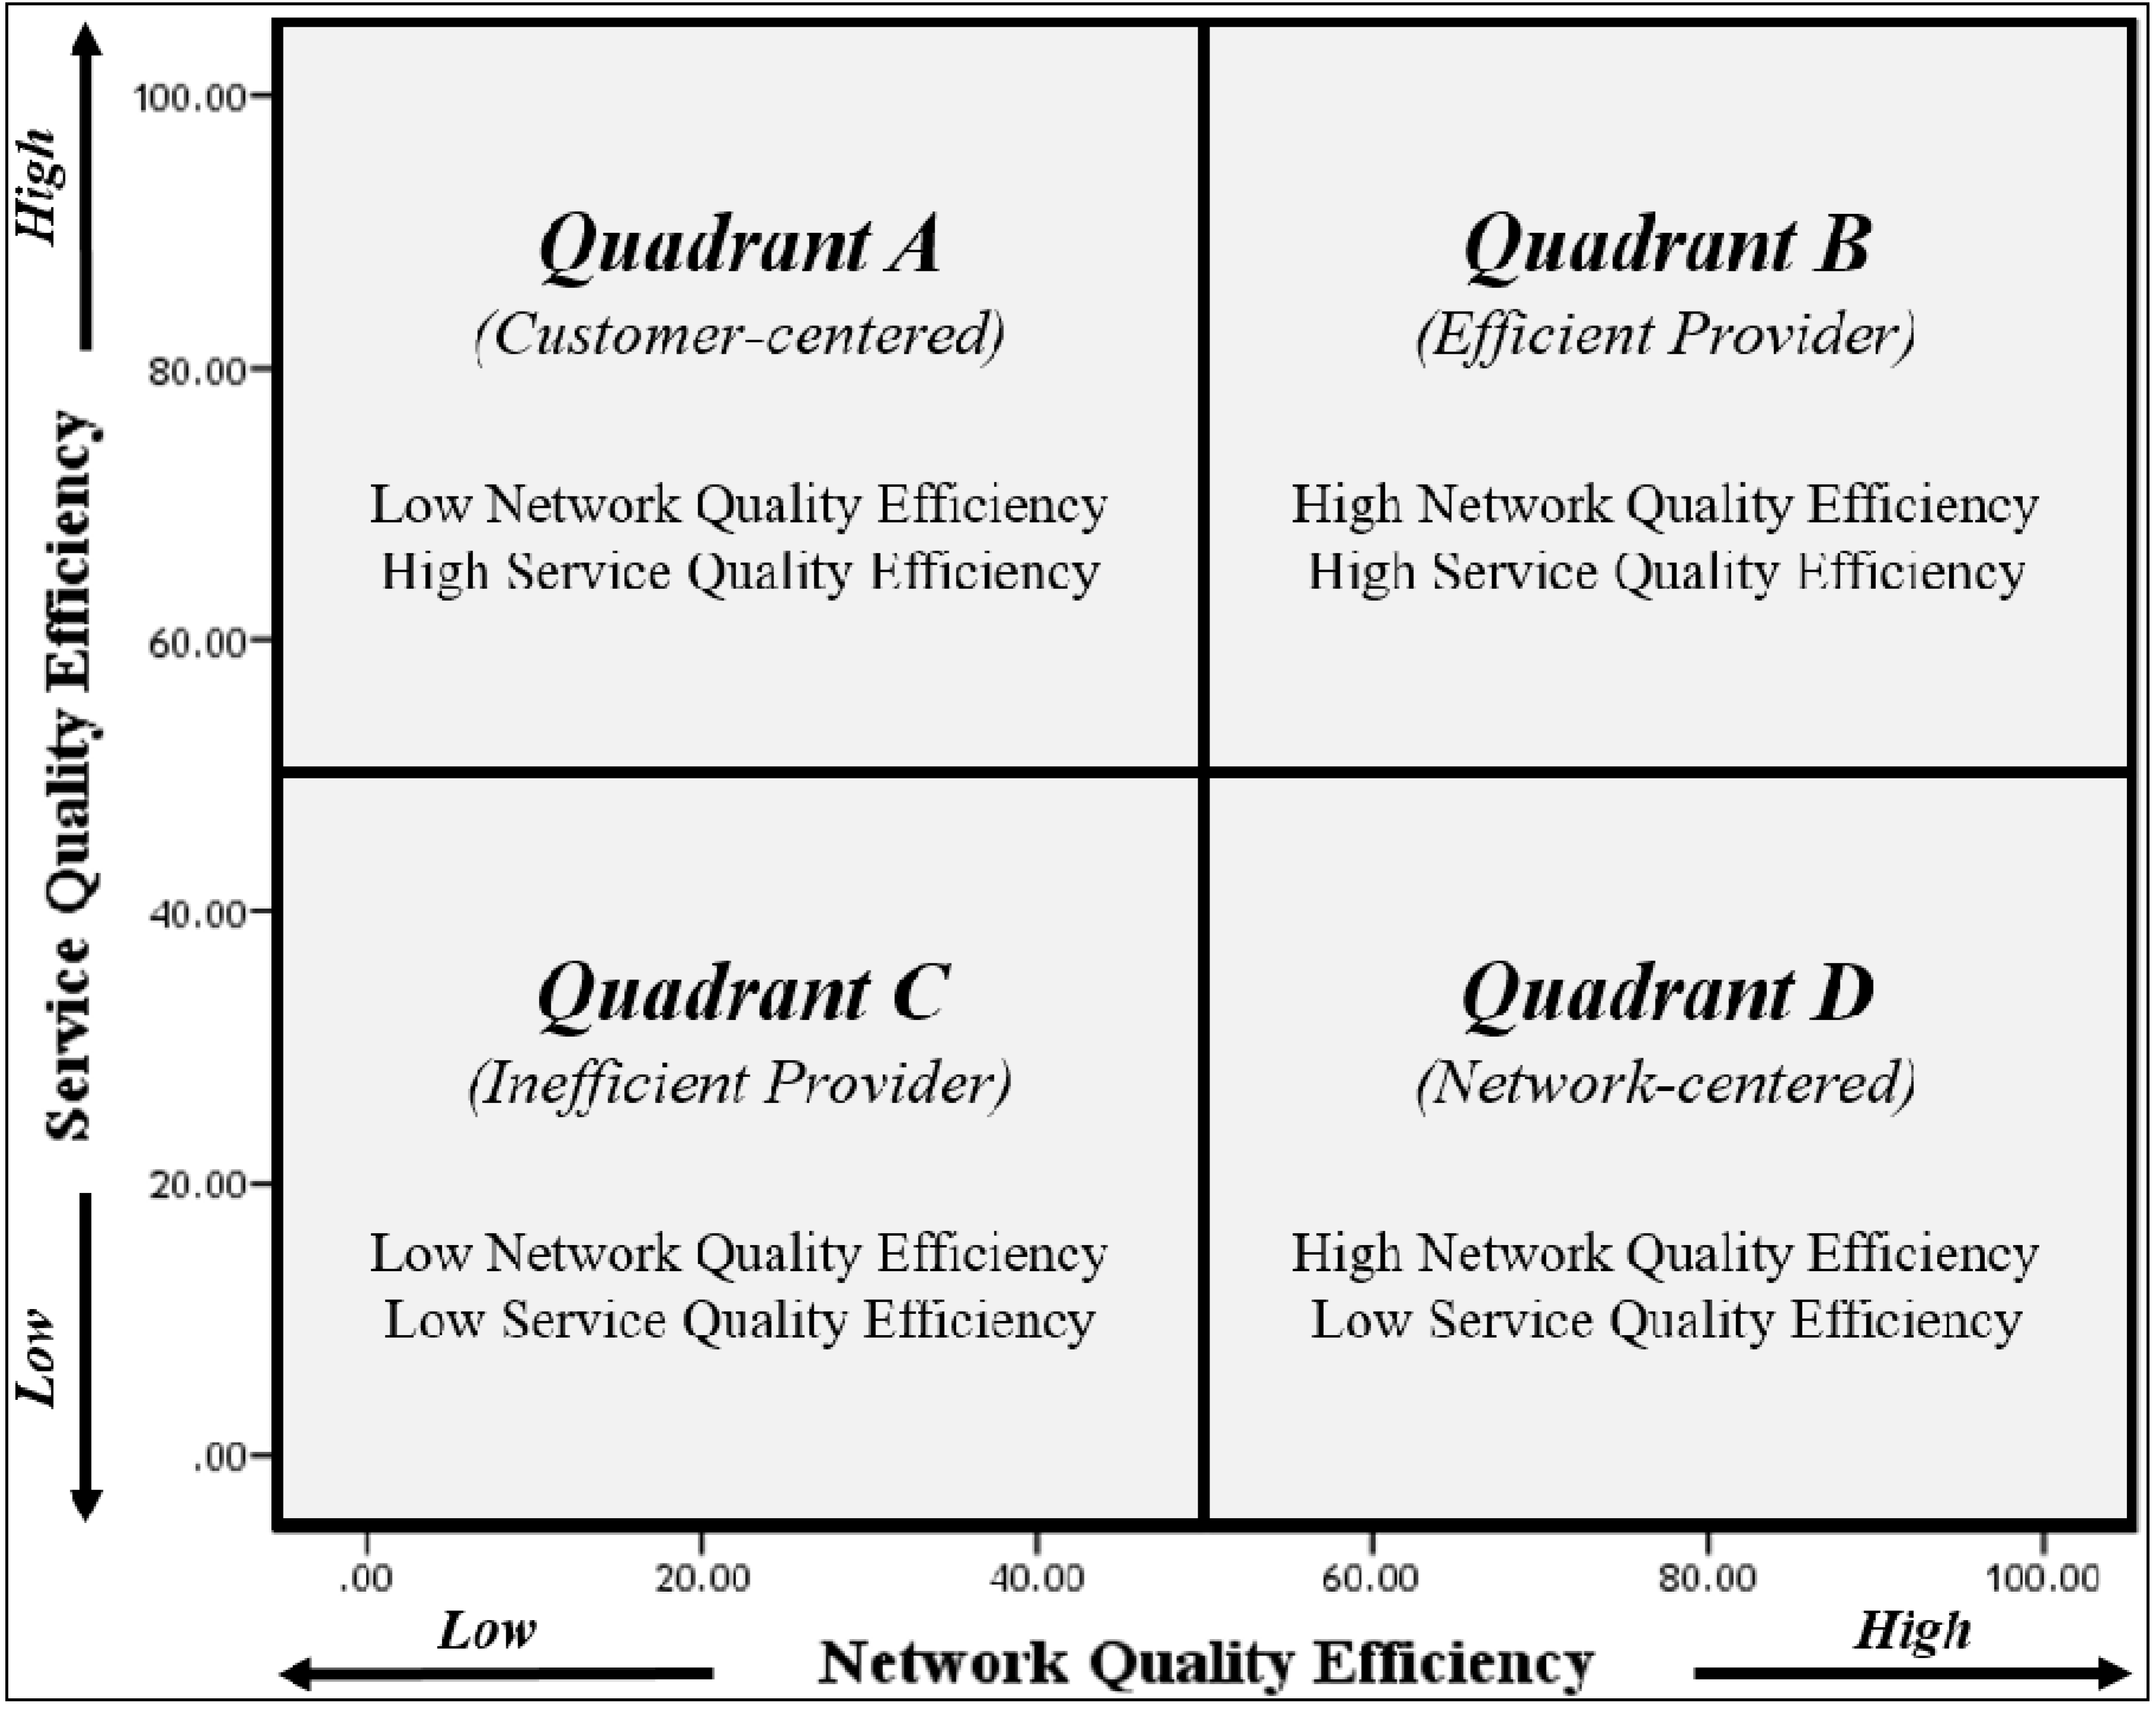
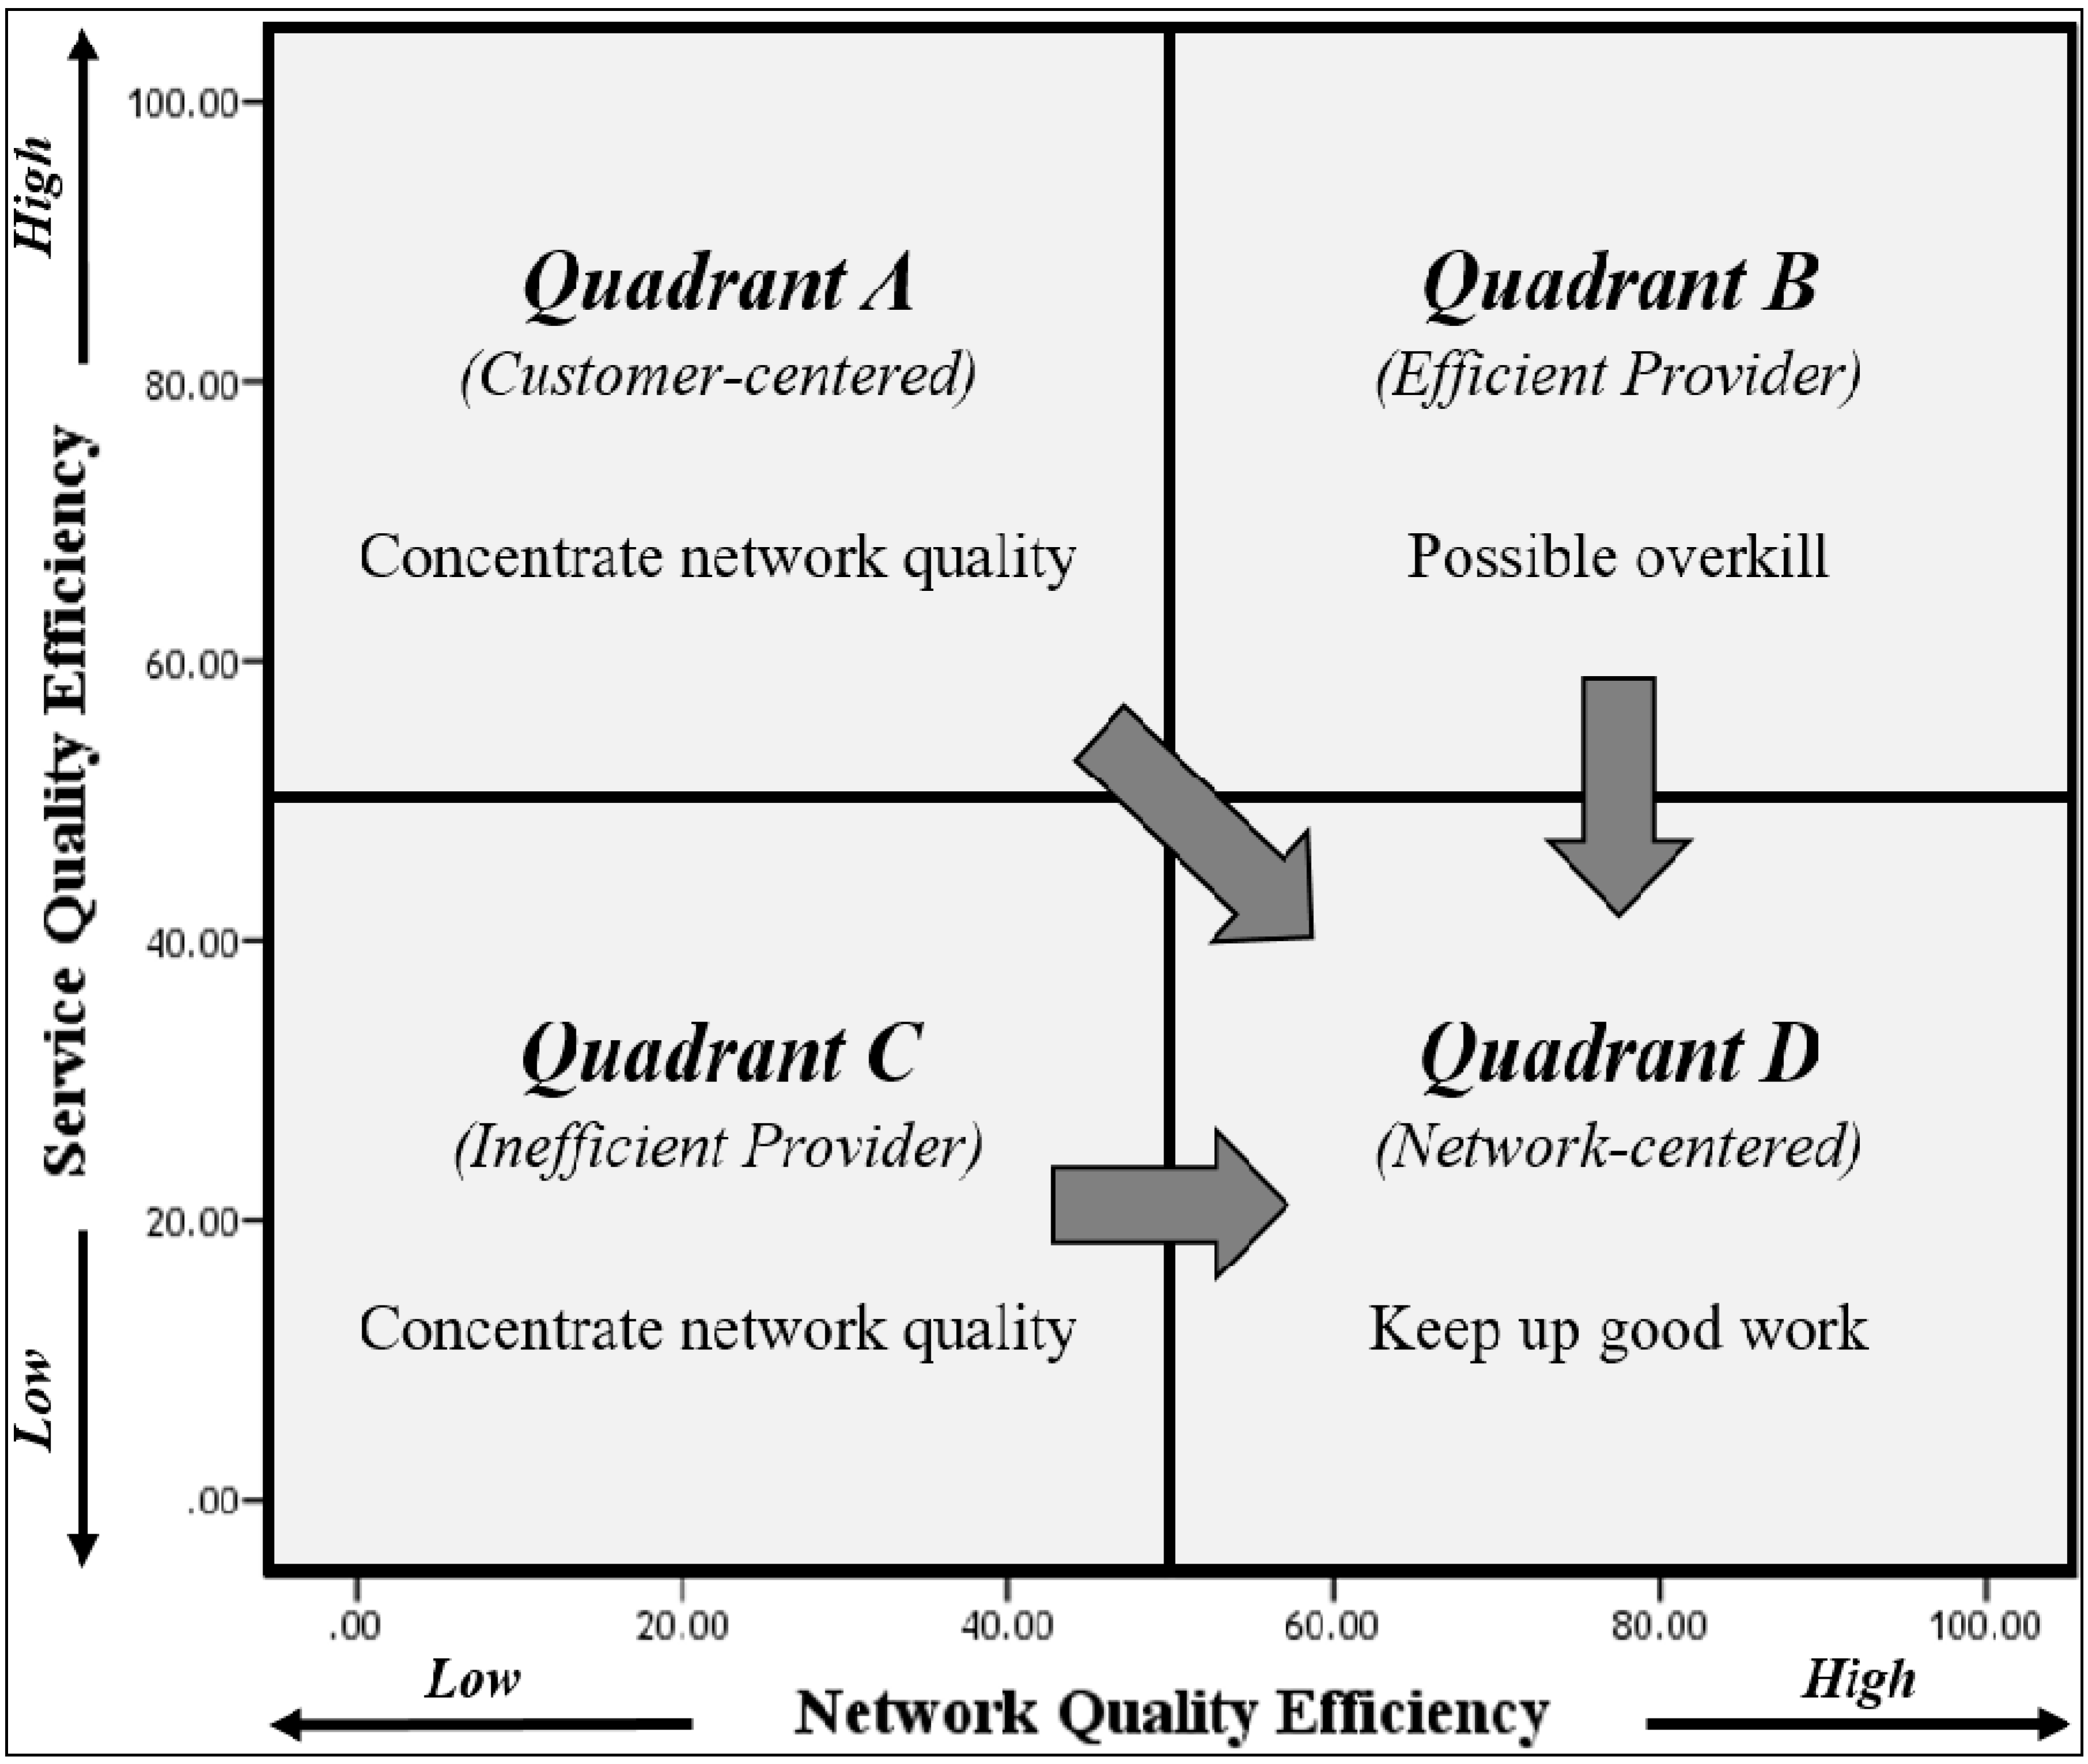
4.2. Guidelines for Wireless Carriers

The similarities in efficiency distribution verified through Mann-Whitney U Test and Wilcoxon W Test indicate that the U.S. wireless carriers showing management efficiency are the same as those showing network quality efficiency, and that they are also the same as those showing market efficiency. This outcome shows that network quality is more important than service quality in terms of improving the management efficiency and thus, suggests the following ways to interpret each quadrant on the service quality efficiency-network quality efficiency matrix, which is summarized in Figure 4 below.
To elaborate, striving for Quadrant D, where services are network quality-oriented, is the surest way to improve management efficiency. That the DMUs under Quadrant D have high management efficiency and thus, better market efficiency can be confirmed by DMUs, AT & T and Verizon Wireless for the year 2013. These two DMUs were plotted under Quadrant D, and their actual market shares in 2013 were the highest in the U.S. (32% and 35%, respectively). On the other hand, firms falling under Quadrant C, which represents low network quality efficiency and low service quality efficiency, need to focus on network quality efficiency to increase their market share or to improve their management or market efficiency.
Meanwhile, firms under Quadrant A should redistribute their resources to focus more on network quality efficiency rather than service quality efficiency, and those under Quadrant B, whose network quality efficiency and service quality efficiency are both high, should lessen their investment in service quality efficiency to achieve management and market efficiency. Thus, Sprint Nextel in Quadrant A, which is currently focusing on customer service quality, should invest more in network quality than service quality while T-mobile, which is efficient in both aspects, should direct a portion of its investment in customer quality service to network quality in order to improve its management efficiency.

5. Conclusions

This study applies bootstrap DEA to analyze the source of management efficiency of the 4G LTE-oriented companies in wireless industry. The three-year data for the representative wireless carriers in USA—Verizon Wireless, AT & T, Sprint Nextel, and T-mobile—are analyzed through the research model designed to analyze the management, service quality, network quality, and market efficiencies of each company.
This study is unique its application of Grönroos [1] classification of service quality to analyze how network quality has affected management efficiency by defining functional quality as service quality efficiency and technical quality as network quality efficiency. By looking into service quality and network quality separately, this study made it possible to evaluate the management efficiency of U.S. wireless carriers through a matrix that plots each wireless carrier based on service and network quality, which in turn, provided a strategic guideline for the wireless carriers on how to improve their management efficiency.
Using four DEA models applying the bootstrap method and verified by Mann-Whitney U test and Wilcoxon W test, this study also tested three hypotheses to examine the relationship among management efficiency, network quality efficiency, service efficiency, and market efficiency. This investigation revealed that the distribution of wireless carriers with high management efficiency and that of wireless carriers with high network quality efficiency were identical. As network quality was analyzed using upload/download speed as input factor, this result is significant in that it provides empirical analysis to support the FCC’s report [27] on the U.S. wireless industry which highlights upload/download speed as the most important factor for data network quality.
Another implication revealed through the hypotheses test was that the distribution of market efficiency, which was deduced using network quality and service quality as input factors, was identical to that of management efficiency. This result is supported by AT & T and Verizon Wireless, which were DMUs showing highest management efficiency for 2013 and, at the same time, showed market shares of 32% and 35% respectively in the fourth quarter of 2013. Thus, this study confirms and corroborates with previous reports that U.S. wireless market customers select their wireless carriers based on network quality such as upload/download speed, and presents a guideline for wireless carriers on where to focus in order to increase their market share.

6. Limitations

The present study holds the following limitations. First, this study analyzed the four representative wireless carriers in USA, however, there are also many other non-contract wireless carriers such as Virgin Mobile, TracFone, Boost Mobile, and so on, who provide wireless services in the U.S. While this study excluded these non-contract wireless carriers in order to maintain homogeneity among DMUs, but future studies may benefit from analyzing the efficiency of non-contract wireless carriers. Along the same line, this study focuses on wireless carriers in the U.S., and as such, future research may consider investigating wireless carriers in other countries. Second, this study regarded download speed and upload speed as network quality as they were the most important elements highlighted by the FCC [27]. However, since there are other elements that factor towards network quality (such as safety), consideration of such factors will be meaningful for further research.
Due to the limitation in data collection, this study was unable to measure voice quality efficiency such as voice call performance which can include factors such as dropped calls; static/interference; failed call connection on the first try; voice distortion; echoes; no immediate voicemail notification; and no immediate text message notification. Although upload and download speed are given increasing weight in service quality, voice quality is still an important factor for better customer service. Thus, future studies may gain greater implications by constructing a research model that includes voice quality.

Author Contributions

Changhee Kim and Soo Wook Kim conceived and designed the experiments. Hee Jay Kang collected the data. The experiment was performed by all related authors. Finally, the paper is written by Changehee Kim and Hee Jay Kang. All authors read and approved the final manuscript.

Conflicts of Interest

The authors declare no conflict of interest.

References

  1. Grönroos, C. A service quality model and its marketing implications. Eur. J. Market. 1984, 18, 36–44. [Google Scholar] [CrossRef]
  2. Zhang, H.; Lu, Y.; Gupta, S.; Zhao, L.; Chen, A.; Huang, H. Understanding the antecedents of customer loyalty in the Chinese mobile service industry: A push–pull–mooring framework. Int. J. Mob. Commun. 2014, 12, 551–577. [Google Scholar] [CrossRef]
  3. Kang, G.D. The hierarchical structure of service quality: Integration of technical and functional quality. Manag. Serv. Qual. Int. J. 2006, 16, 37–50. [Google Scholar] [CrossRef]
  4. Anderson, C.R.; Zeithaml, C.P. Stage of the product life cycle, business strategy, and business performance. Acad. Manag. J. 1984, 27, 5–24. [Google Scholar] [CrossRef]
  5. Tsai, H.C.; Chen, C.M.; Tzeng, G.H. The comparative productivity efficiency for global telecoms. Int. J. Prod. Econ. 2006, 103, 509–526. [Google Scholar] [CrossRef]
  6. Nigam, V.; Thakur, T.; Sethi, V.K.; Singh, R.P. Benchmarking of Indian mobile telecom operators using DEA with sensitivity analysis. Benchmark. Int. J. 2012, 19, 219–238. [Google Scholar] [CrossRef]
  7. Kumar, A.; Shankar, R.; Debnath, R.M. Analyzing customer preference and measuring relative efficiency in telecom sector: A hybrid fuzzy AHP/DEA study. Telemat. Inform. 2015, 32, 447–462. [Google Scholar] [CrossRef]
  8. Lewis, R.C.; Booms, B.H. The marketing aspects of service quality. Emerg. Perspect. Serv. Market. 1983, 65, 99–107. [Google Scholar]
  9. Parasuraman, A.; Zeithaml, V.A.; Berry, L.L. A conceptual model of service quality and its implications for future research. J. Market. 1985, 49, 41–50. [Google Scholar] [CrossRef]
  10. Bolton, R.N.; Drew, J.H. A multistage model of customers' assessments of service quality and value. J. Consum. Res. 1991, 375–384. [Google Scholar] [CrossRef]
  11. Zaltman, G.; Wallendorf, M. Consumer Behavior, Basic Findings and Management Implications; Wiley: Hoboken, NJ, USA, 1979. [Google Scholar]
  12. Zeithaml, V.A. Service quality, profitability, and the economic worth of customers: What we know and what we need to learn. J. Acad. Mark. Sci. 2000, 28, 67–85. [Google Scholar] [CrossRef]
  13. Shin, D.H. Measuring the quality of smartphones: Development of a customer satisfaction index for smart services. Int. J. Mob. Commun. 2014, 12, 311–327. [Google Scholar] [CrossRef]
  14. Fornell, C. A national customer satisfaction barometer: The Swedish experience. J. Market. 1992, 56, 6–21. [Google Scholar] [CrossRef]
  15. Jones, T.O.; Sasser, J.R.; Earl, W. Why Satisfied Customers Defect. Harv. Bus. Rev. 1995, 12, 11. [Google Scholar] [CrossRef]
  16. Pai, F.Y.; Yeh, T.M. The effects of interdependence and cooperative behaviors on buyer’s satisfaction in the semiconductor component supply chain. Sustainability 2016, 8, 2. [Google Scholar] [CrossRef]
  17. Kotler, P.; Armstrong, G. Principle of Marketing, 13th ed.; Pearson Education International: Upper Saddle River, NJ, USA, 2010. [Google Scholar]
  18. Blattberg, R.C.; Neslin, S.A. Sales Promotion: Concepts, Methods, and Strategies; Prentice Hall: Englewood Cliffs, NJ, USA, 1990. [Google Scholar]
  19. Chandon, P.; Wansink, B.; Laurent, G. A benefit congruency framework of sales promotion effectiveness. J. Mark. 2000, 64, 65–81. [Google Scholar] [CrossRef]
  20. Lee-Kelley, L.; Davies, S.; Kangis, P. Service quality for customer retention in the UK steel industry: Old dogs and new tricks? Eur. Bus. Rev. 2002, 14, 276–286. [Google Scholar] [CrossRef]
  21. Barsky, J.; Nash, L. Evoking emotion: Affective keys to hotel loyalty. Cornell Hotel Restaur. Adm. Q. 2002, 43, 39–46. [Google Scholar] [CrossRef]
  22. Kelly, J.P.; Freeman, D.C.; Emlen, J.M. Competitive impact model for site selection: The impact of competition, sales generators and own store cannibalization. Int. Rev. Retail Distribut. Consum. Res. 1993, 3, 237–259. [Google Scholar] [CrossRef]
  23. Gerpott, T.J.; Rams, W.; Schindler, A. Customer retention, loyalty, and satisfaction in the German mobile cellular telecommunications market. Telecommun. Policy 2001, 25, 249–269. [Google Scholar] [CrossRef]
  24. Lee, J.; Lee, J.; Feick, L. The impact of switching costs on the customer satisfaction-loyalty link: Mobile phone service in France. J. Serv. Market. 2001, 15, 35–48. [Google Scholar] [CrossRef]
  25. Lin, S.C.; Lin, S.W.; Chen, P.S.; Liu, Y.K. Adoption of 4G wireless services under consideration of technology and economic perspectives. Int. J. Mob. Commun. 2015, 13, 71–91. [Google Scholar] [CrossRef]
  26. Tseng, F.M.; Chiu, Y.J. Hierarchical fuzzy integral stated preference method for Taiwan’s broadband service market. Omega 2005, 33, 55–64. [Google Scholar] [CrossRef]
  27. FCC. Broadband Service for the Home: A Consumer's Guide. Available online: https://www.fcc.gov/research-reports/guides/broadband-service-home-consumers-guide (accessed on 20 April 2016).
  28. Fang, L.; Li, H. Lower bound of cost efficiency measure in DEA with incomplete price information. J. Prod. Anal. 2013, 40, 219–226. [Google Scholar] [CrossRef]
  29. Kim, H.J.; Kim, S.W.; Shin, J.S. Efficiency analysis of privatization using DEA and MPI. Public Perform. Manag. Rev. 2014, 38, 48–75. [Google Scholar] [CrossRef]
  30. Charnes, A.; Cooper, W.W.; Rhodes, E. Measuring the efficiency of decision making units. Eur. J. Oper. Res. 1978, 2, 429–444. [Google Scholar] [CrossRef]
  31. Bughin, J.; Hagel, J., III. The operational performance of virtual communities-towards a successful business model? Electron. Mark. 2000, 10, 237–243. [Google Scholar]
  32. Beck, R.; Wigand, R.T.; König, W. The diffusion and efficient use of electronic commerce among small and medium-sized enterprises: An international three-industry survey. Electron. Mark. 2005, 15, 38–52. [Google Scholar] [CrossRef]
  33. Ghapanchi, A.H.; Aurum, A. Competency rallying in electronic markets: Implications for open source project success. Electron. Mark. 2012, 22, 117–127. [Google Scholar] [CrossRef]
  34. Momparler, A.; Lassala, C.; Ribeiro, D. Efficiency in banking services: A comparative analysis of Internet-primary and branching banks in the US. Serv. Bus. 2013, 7, 641–663. [Google Scholar] [CrossRef]
  35. Choi, K.; Lee, D.; Olson, D.L. Service quality and productivity in the US airline industry: A service quality-adjusted DEA model. Serv. Bus. 2015, 9, 137–160. [Google Scholar] [CrossRef]
  36. Kim, H.; Lee, D.; Hwang, J. Measuring the efficiency of standardisation policy using meta-frontier analysis: A case of mobile platform standardisation. Int. J. Mob. Commun. 2016, 14, 79–98. [Google Scholar] [CrossRef]
  37. Sun, Z.; Luo, R.; Zhou, D. Optimal path for controlling sectoral CO2 emissions among China’s regions: A centralized DEA approach. Sustainability 2016, 8, 28. [Google Scholar] [CrossRef]
  38. Jacobs, R.; Smith, P.C.; Street, A. Measuring Efficiency in Health care: Analytic Techniques and Health Policy; Cambridge University Press: Cambridge, UK, 2006. [Google Scholar]
  39. Li, P.; Yang, Z. Performance evaluation of the public libraries in USA using data envelopment analysis. Int. J. Appl. Sci. Technol. 2014, 4, 2. [Google Scholar]
  40. Banker, R.D.; Charnes, A.; Cooper, W.W. Some models for estimating technical and scale inefficiencies in data envelopment analysis. Manag. Sci. 1984, 30, 1078–1092. [Google Scholar] [CrossRef]
  41. Simar, L.; Wilson, P.W. Sensitivity analysis of efficiency scores: How to bootstrap in nonparametric frontier models. Manag. Sci. 1998, 44, 49–61. [Google Scholar] [CrossRef]
  42. Efron, B. Bootstrap methods: Another look at the jackknife. In Breakthroughs in Statistics; Springer: New York, NY, USA, 1992. [Google Scholar]
  43. Kim, C.; Kim, S.W. A Mathematical approach to supply complexity management efficiency evaluation for supply chain. Math. Probl. Eng. 2015, 2015, 865970. [Google Scholar] [CrossRef]
  44. Hall, P. On the bootstrap and confidence intervals. Ann. Stat. 1986, 14, 1431–1452. [Google Scholar] [CrossRef]
  45. Simar, L.; Wilson, P.W. A general methodology for bootstrapping in non-parametric frontier models. J. Appl. Stat. 2000, 27, 779–802. [Google Scholar] [CrossRef]
  46. Nyhan, R.C.; Martin, L.L. Comparative performance measurement: A primer on data envelopment analysis. Public Prod. Manag. Rev. 1999, 22, 348–364. [Google Scholar] [CrossRef]
  47. Nunamaker, T.R. Using data envelopment analysis to measure the efficiency of non-profit organizations: A critical evaluation. Manag. Decis. Econ. 1985, 6, 50–58. [Google Scholar] [CrossRef]
  48. Boussofiane, A.; Dyson, R.G.; Thanassoulis, E. Applied data envelopment analysis. Eur. J. Oper. Res. 1991, 52, 1–15. [Google Scholar] [CrossRef]
  49. Fitzsimmons, J.A.; Fitzsimmons, M.J. Service Management for Competitive Advantage; McGraw-Hill: New York, NY, USA, 1994. [Google Scholar]
Figure 1. Research model.
Sustainability 08 00659 g001
Figure 2. Relationship between network and service quality efficiency.
Sustainability 08 00659 g002
Figure 3. Efficiency score of wireless carriers.
Sustainability 08 00659 g003
Figure 4. Guideline for wireless carriers.
Sustainability 08 00659 g004
Table 1. Input, output, and source used for each data envelopment analysis (DEA) model.
EfficiencyInputSourceOutputSource
Model 1Management EfficiencyTotal Asset
Operating Expense
Annual reportOperating income
Total revenue
Annual report
Model 2Service Quality EfficiencyTotal Asset
Operating Expense
Annual reportCustomer care
Purchase experience
J.D. Power
Model 3Network Quality EfficiencyTotal Asset
Operating Expense
Annual reportDownload speed
Upload speed
NOVARUM
Model 4Market EfficiencyService Quality Efficiency Score
Network Quality Efficiency Score
1st Stage DEA ResultsOperating income
Total revenue
Annual report
Table 2. Descriptive statistics of input and output factors.
FactorsMeanSumSDMinMaxUnit
Operating Expenses66,194.58794,33539,527.3223,424117,505million USD
Total Asset149,9871,799,84411,4957.79482.93277,787million USD
Customer Care762914417.687397951000 points (Likert scale)
Purchase Experience762.75915322.477417981000points (Likert scale)
Revenue74,453.25893,43949,769.719,719128,752million USD
Operating Income8441.17101,29412,626.03−639731,968million USD
Download Speed3.2939.452.720.629.12Mbps (4G)
Upload Speed1.6519.811.770.595.86Mbps (4G)
Table 3. Result of bootstrap DEA.
DMUBootstrap Efficiency Mean
Management EfficiencyService Quality EfficiencyNetwork Quality EfficiencyMarket Efficiency
Verizon Wireless-20110.93000.24220.10681.0000
Sprint Nextel-20110.91960.70240.32830.2524
AT & T-20110.89380.19700.12741.0000
T-Mobile-20111.00001.00001.00000.1601
Verizon Wireless-20120.95180.22870.11831.0000
Sprint Nextel-20120.92640.70450.31880.2548
AT & T-20120.91120.20010.13841.0000
T-Mobile-20120.75000.89451.00000.1532
Verizon Wireless-20131.00000.27491.00001.0000
Sprint Nextel-20130.92960.72380.51940.2627
AT & T-20131.00000.24930.78521.0000
T-Mobile-20130.88851.00001.00000.1897
Table 4. Hypothesis test results.
Null HypothesisU Value 1,2W Value 1,2Sig.Decision
H1Management Efficiency ↔22.00100.000.0029Reject
Service Quality Efficiency
H2Management Efficiency ↔42.00120.000.0887Accept
Network Quality Efficiency
H3Management Efficiency ↔63.00141.000.6300Accept
Market Efficiency
1 U value: Mann-Whitney U, W value: Wilcoxon W; 2 Asymptotic significances are displayed. The significance level is 0.05.

