1. Introduction
Many studies have attempted to predict corporate performance, stock prices, or economic trends in order to enhance the profitability of investments and the efficiency of mergers and acquisitions (M&A) [
1,
2,
3,
4,
5,
6,
7]. Such studies commonly analyze the market flow and financial information (e.g., financial statements) of companies to predict their performance [
2,
6,
7]. Recently, technology-intensive companies in the information technology (IT), electronics, and biotechnology (BT) industries have begun representing an increasing share of the total economy. The performance and stock prices of these companies are affected by their financial standing as well as their technological capabilities [
8]. Therefore, analyses based only on such companies’ financial information would likely lead to inaccurate predictions. There have been several attempts to analyze technology-intensive companies’ R&D capabilities, patents, core technologies, and so on, in order to predict their performance and stock prices [
9,
10,
11]. When considering the technological environment and the technologies owned by companies, most studies predict their performance based on the qualitative judgment of experts [
12,
13,
14,
15]. However, these judgments are subjective and, thus, cannot consistently predict corporate performance or establish managerial strategies. At the same time, the advancement of data processing technology and machine-learning algorithms have resulted in efforts to develop sustainable quantitative prediction models and to update new training data in a simple manner. For example, the management and economic sectors use machine-learning algorithms such as artificial neural networks and decision trees to produce quantitative predictions [
1,
3,
4,
5,
6,
7]. However, most related studies establish prediction models using financial indicators that have been deduced from financial information, excluding technological information, from which they predict performance and stock prices [
1,
3,
4]. Thus, excluding a technology-intensive company’s technological capabilities from model training limits the model’s ability to predict the company’s performance or to establish a sustainable managerial strategy. Therefore, to overcome this limitation, we develop a performance prediction model that considers the technological capability of a company by including a technological factor in the model training. To do so, we collected companies’ patent information in order to derive technical indicators that reflect their technological capability. We derived the financial indicators using the companies’ financial information. Then, we established a support vector regression (SVR)-based corporate performance prediction model using the derived indicators as predictors. However, the managerial environments in which companies operate have recently been experiencing significant changes. Accordingly, even a prediction model that performs well suffers from decreasing prediction performance over time. Moreover, when new data are added, training parameters should be adjusted accordingly. However, making these changes is seldom straightforward. In this study, we develop a model that applies the genetic algorithm to achieve sustainable predictability, despite the variability in managerial situations or the inclusion of new data. Thus, the model is expected to retain sustainability under various changes in managerial environments.
2. Literature Review
Recently, there have been numerous attempts to utilize machine-learning algorithms in the financial and managerial decision-making process [
1,
3,
4,
5,
6,
7]. Several attempts have tried to predict stock prices and managerial performance by using artificial neural network algorithms [
4,
6].
Ahn et al. (2000) predicted the insolvency of a company using a neural network algorithm and past financial performance information [
4]. They established a more accurate prediction model by reducing the information table after the preprocessing stage using a rough set approach. However, prediction models based on artificial neural network algorithms can be overfitted to training data, which limits their generalization performance. Thus, business prediction models based on support vector machines (SVM) have begun attracting the interest of researchers in an effort to resolve this problem [
1,
5,
7,
16]. Li and Sun (2009) suggested a prediction model based on SVM and the K-nearest neighbor algorithm to predict company insolvency [
16]. They collected financial information, including profitability, cash flow, and liabilities, from Chinese companies to establish the model in an empirical manner. Their empirical verification using test data showed that their model was feasible and valid for companies in China.
Other studies attempt to predict the rise and fall of stock prices [
1,
7]. Huang et al. (2005) suggested a model predicting the flow of a stock market using an SVM [
7]. They verified the suggested model empirically using the NIKKEI225 index as training data. Their model showed better prediction performance than that of artificial neural networks.
Other studies predict stock prices directly using support vector regression (SVR), which applies the SVM primarily as the classifier in the regression problem [
3,
17].
Hsu et al. (2009) predicted the stock prices of companies using a self-organizing map (SOM) and SVR [
3]. They performed the decomposition process by grouping variables with similar statistical distributions, using the SOM-based decomposition result as the predictor. Their empirical analysis conducted on stock price series from seven major financial markets confirmed that the prediction performance of the SOM-SVR model is better than when using SVR only.
Other studies reduce the dimensions of the predictors using SOM or PCA to enhance the prediction performance of SVR [
18,
19]. Other studies search for the optimal parameter required for the SVR and SVM training [
17,
20,
21]. Here, the most popular method is to use a genetic algorithm (GA), which mimics natural selection and the evolution process in nature [
17,
20,
21].
Yuan (2012) suggested a hybrid prediction model using SVR and a GA to predict the sales volume of trucks and small automobiles of a Thailand based automobile company [
17]. The performance of the prediction model is highly influenced by the cost (
), gamma (
), and epsilon (
), which are the parameters used in the SVR training, and finding the optimal parameter values is not easy. The study uses a GA to determine the optimal parameters for the training data. Their analysis confirms that the prediction performance of their suggested model using GA-SVR is better than that of both the models based on artificial neural networks and SVR.
Previous related studies have used only the financial information of a company to predict its performance or stock price [
1,
2,
3,
4,
5,
6,
7,
17]. However, a company’s technical skills influence the performance and the stock price of a company as much as its financial status does. As a result, recent studies have begun trying to evaluate the technical skills of companies in a quantitative manner [
9,
22,
23]. A popular method of doing so is to use information on patents, which allow a company the exclusive right to use a technology it has developed [
9,
10]. Moreover, patent information may reflect current technical trends by adopting the early disclosure system [
24]. Thus, we can understand the relationship between technologies and their qualities by analyzing patent citation information [
25,
26,
27].
Shane and Klock (1997) focused on semiconductor companies, and analyzed the relationship between the number of patent citations and Tobin’s Q, which is a typical indicator of the intangible assets of a company [
9]. Their results showed a significant correlation between the appraised market value of a company’s intangible asset and the number of forward citation counts of patents owned by the company.
Chen and Chang (2010) analyzed the relationship between patent indicators and corporate market value in the U.S. pharmaceutical industry [
22]. Relative patent position (RPP), revealed technology advantage (RTA), and patent citation were the patent indicators used in the analysis. The results indicated that patent citation and RPP were positively related to market value, while RTA had no statistically significant relationship with the market value.
Based on the findings that report associations between technical indicators and a company’s market value or performance, recent studies have predicted companies’ stock prices and performance using technical indicators [
23]. Shin et al. (2012) applied financial information and technical indicators, together with SVM, in order to predict a movement of companies’ stock prices quantitatively [
23]. In their study, the number of applications for patents, the number of registrations for patents, and investment in R&D were used as technical indicators. Their findings indicated that using technical indicators as predictors improved the predictability of a company’s market value.
3. Design of the Proposed Corporate Performance Prediction Model
As described earlier, we develop a quantitative corporate performance prediction model that considers the technological capability and financial status of a company.
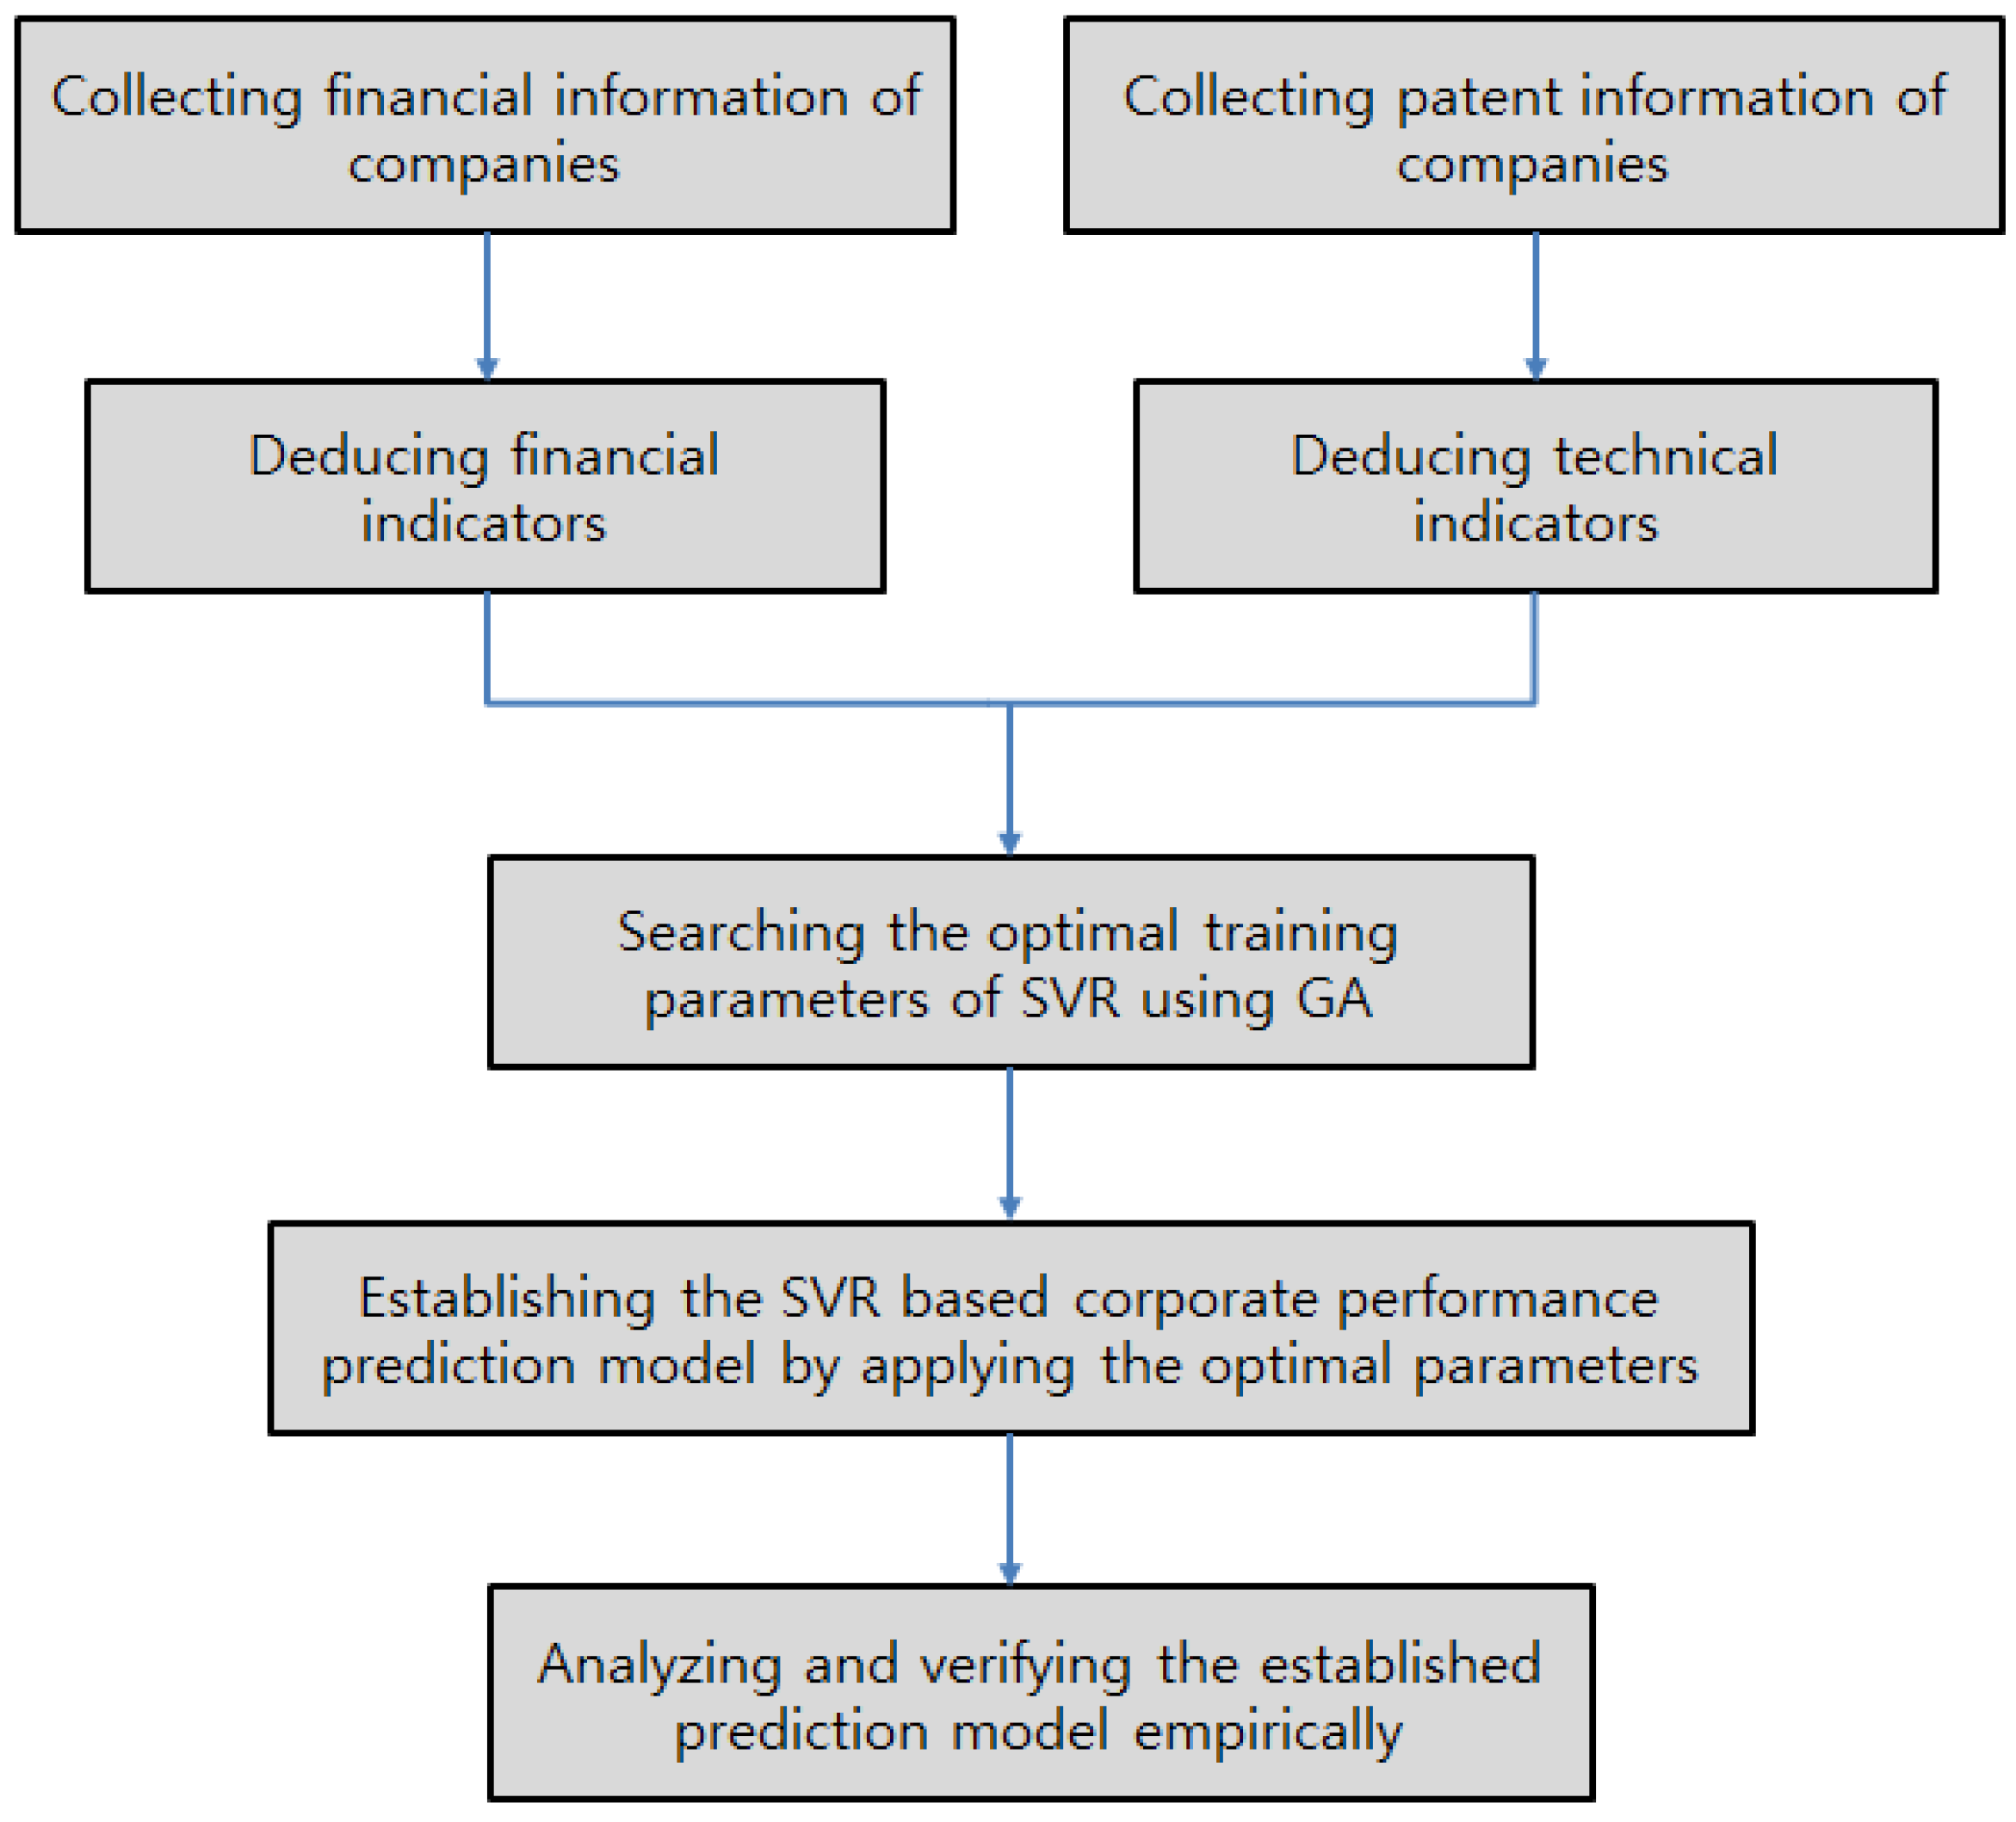
Figure 1 summarizes the proposed prediction model.
The most important elements required to establish the quantitative prediction model are the predictor, dependent variable, training algorithm, and training parameters, which are applied to the training algorithm. In this study, we use financial metrics, deduced from a company’s financial statements, to represent its financial status for the predictors of the proposed model. In addition, we use various patent indicators, deduced from patent information, for the predictors of the company’s technical information. The dependent variables (object variables) of the proposed model include sales, operating profits, and net profits, which show the performance of a company.
For the training algorithm of the proposed corporate performance prediction model, we use the SVR that can solve the problem of overfitting on the training data, and that can be applied to the regression problem.
The SVR training parameters (i.e., cost (), gamma (), and epsilon ()) should be designated before a model training stage. These parameters should be adjusted in accordance with the data used during training, and should be selected by considering the generalization performance of the model. Thus, we designed the proposed model to explore the training parameters optimized with the training data provided by the model. Here, we use the genetic algorithm, which is popular in optimization studies. Existing business or financial forecasting models lack the sustainable predictability of the established model when sudden changes occur in market or managerial environments. Applying the genetic algorithm to the model training enables us to establish a corporate performance prediction model that has sustainable, high prediction performance by adapting to a variable managerial environment. A detailed explanation of each of the elements of the proposed model is provided below.
3.1. Deduction of Corporate Performance Prediction Variables
Financial indicators are considered important indicators predicting the flow of an economy or the future performance of companies. Therefore, existing studies that predict corporate performance have established prediction models using financial indicators as independent variables. In general, financial indicators may be classified by size, productivity, growth, profitability, stability, and activity. Indicators that show the size of corporate activity include sales and stockholders equity. Indicators of profitability include return on equity (RoE) and return on sales (RoS). Growth indicators include sales growth rate and the growth rate of total assets. Stability indicators include the debt ratio and current ratio.
Recent studies attempt to quantitatively analyze and predict a company’s technical competitiveness by developing patent indicators by analyzing patent information, including the number of applications for patents and citation counts [
22,
23]. A patent is widely used for quantitative analyses because it includes specific details about technology. The form of the patent information is standardized internationally, making it easy to use in quantitative analyses. In addition, patents enable us to understand current technical trends through the early disclosure system. Thus, we use company patent information to deduce the predictors of the proposed model, which may show a company’s technical capability, quality of technology, and other technical factors [
10]. Here, among other patent indicators, we use the number of applications for patents to show the quantitative technological innovation of a company, and the number of citation counts of patents to show the quality of technology developed by a company. The technical indicators used in this study are described in the
Table 1 below.
Therefore, by using technical indicators that utilize patent citation information and application information as the predictors of the proposed model, we develop a prediction model that reflects a company’s technical capability.
3.2. Establishing the Prediction Model by Applying the SVR Algorithm
Recently, various machine-learning algorithms such as artificial neural networks, decision trees, and regression models have been developed and used to establish prediction models. Among these algorithms, artificial neural networks demonstrate high performance in the regression and classification problems. However, the training and prediction processes of these models are not easy to determine. Furthermore, the models may become overfitted to the training data, which means their generalization performance can deteriorate.
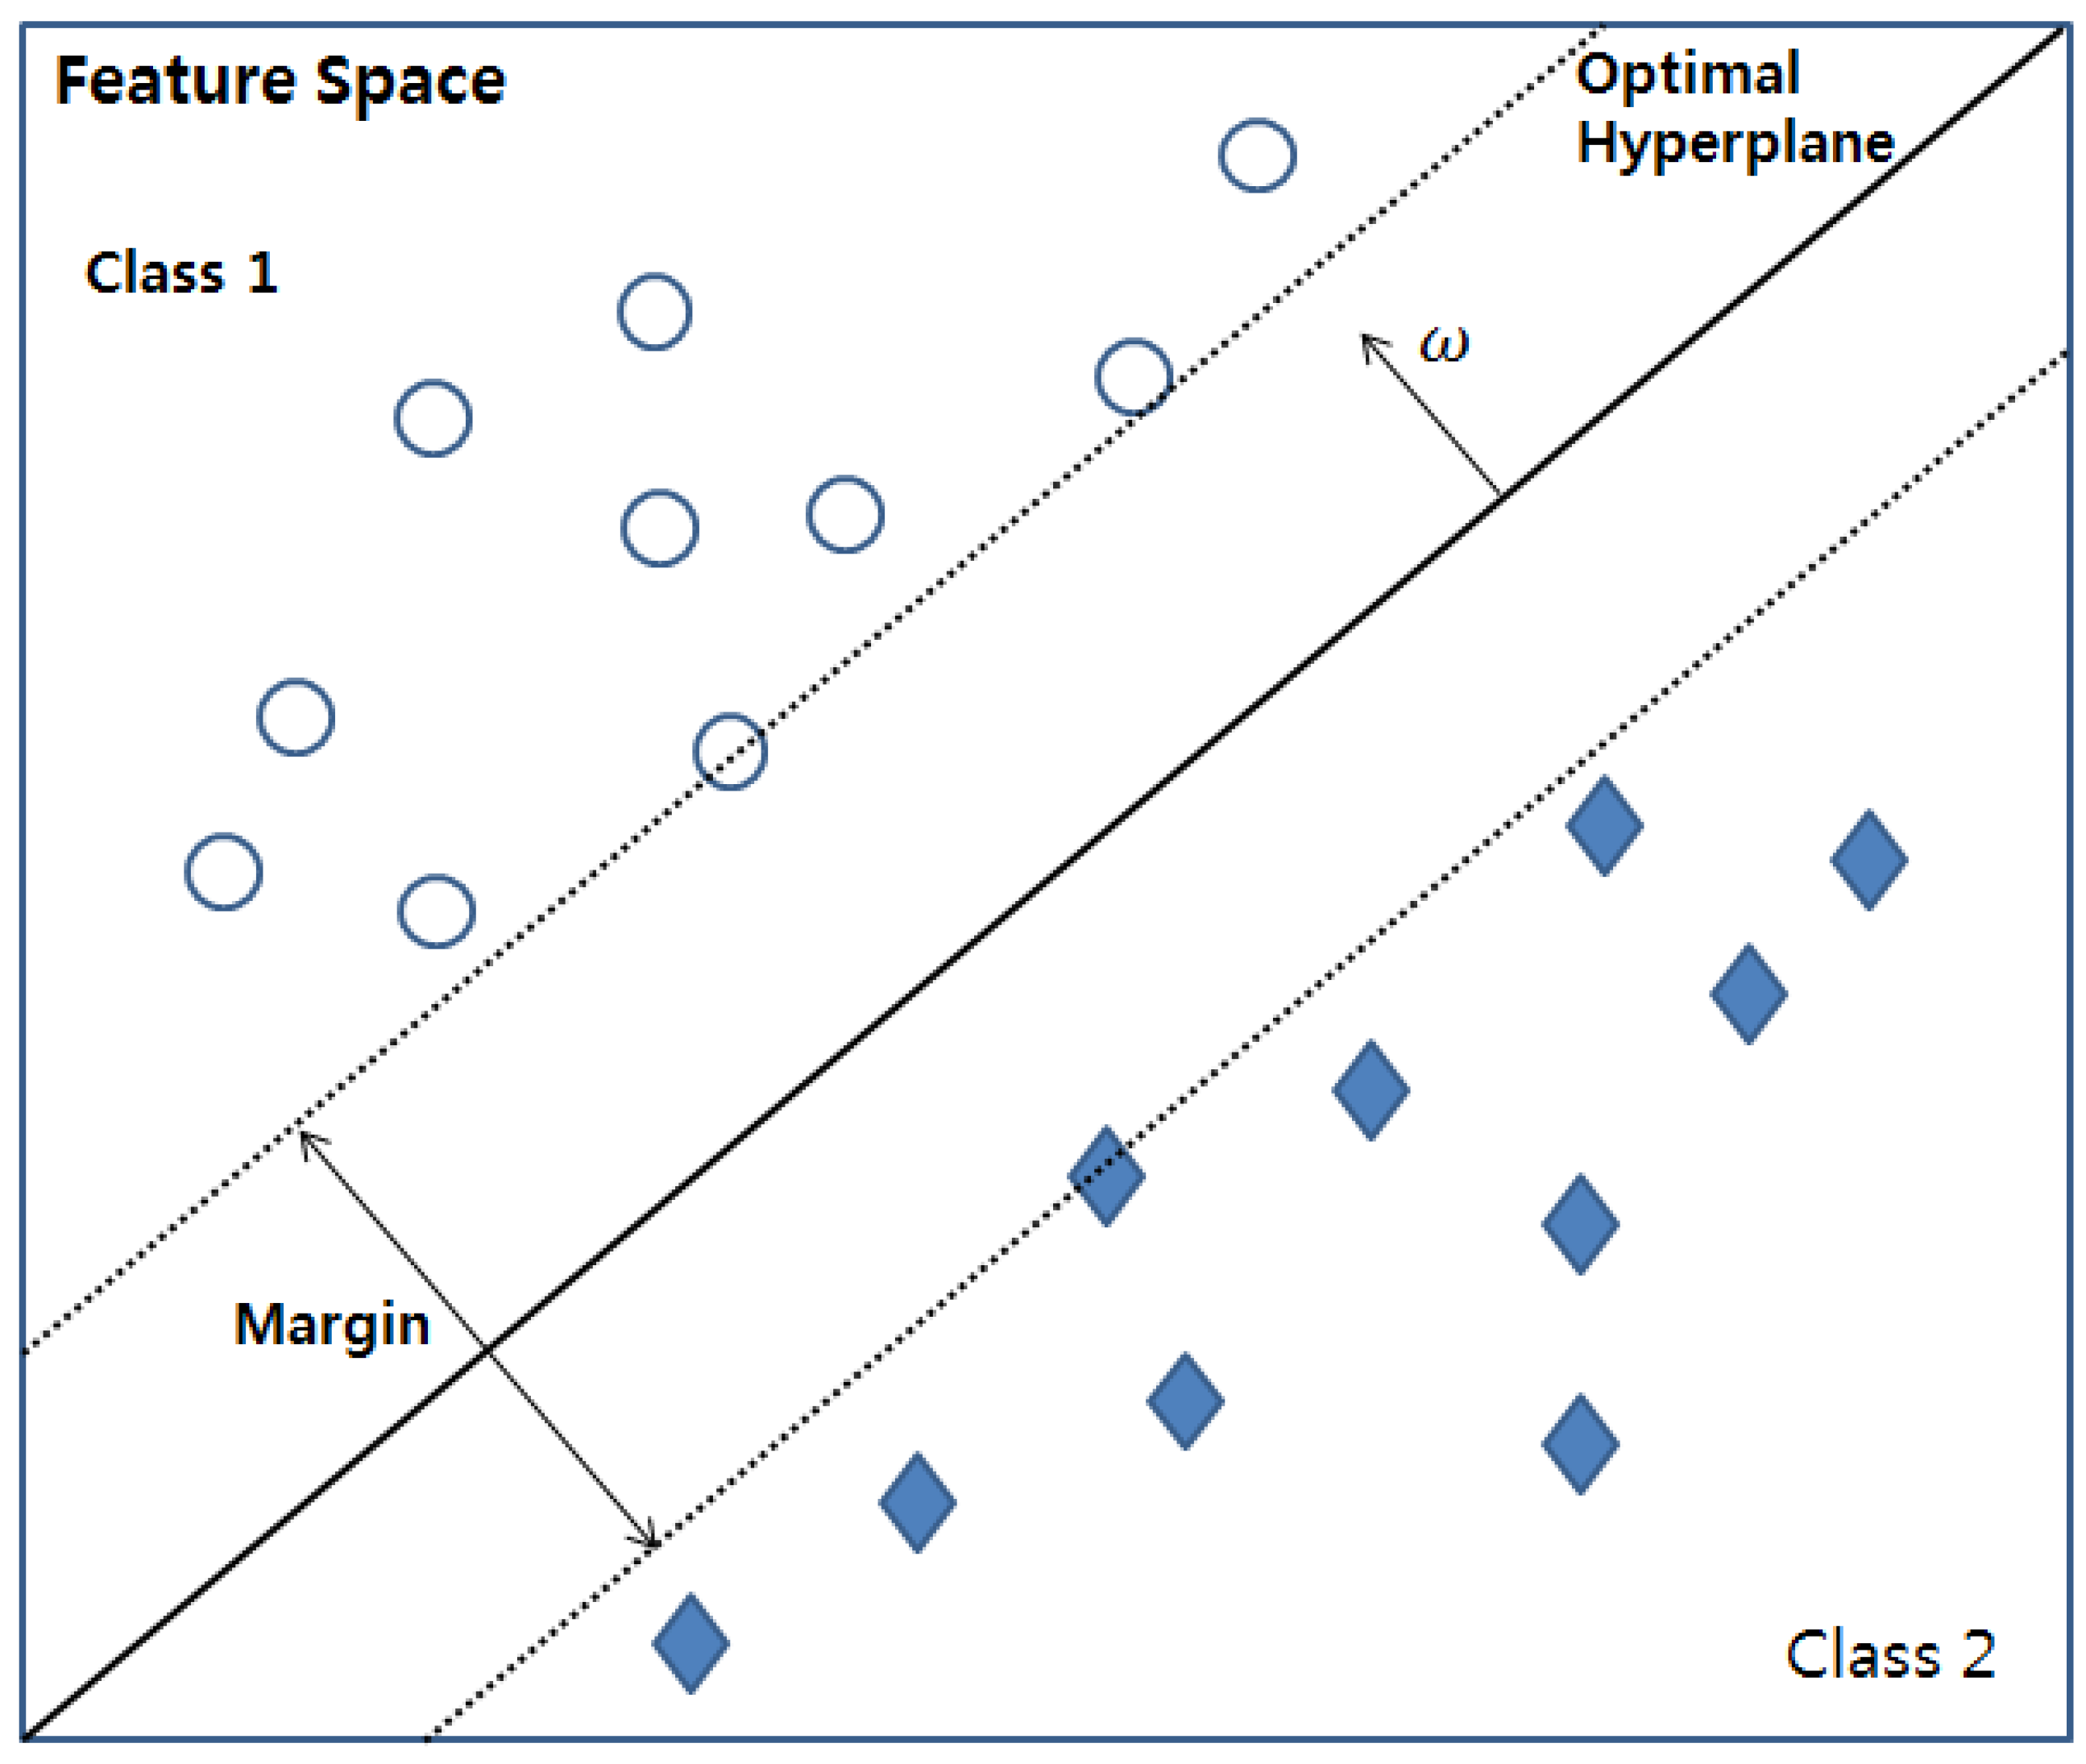
Vapnik proposed the support vector machine (SVM), which prevents the risk of overfitting, while enhancing the generalization performance [
28]. A key feature of the SVM is that it maps the input data set to a high-dimensional vector space and determines the optimal hyperplane, as shown in
Figure 2.
The division of input data into several classes based on the hyperplane finds the distance between the input data and the hyperplane. The smallest distance to the hyperplane is called the margin. The optimal hyperplane illustrated in
Figure 2 is the hyperplane with the maximum margin between the classes. Finding the optimal hyperplane enhances the generalization performance of an SVM-based training model [
3,
28].
Recently, SVR has been applied to predicting regression problems based on the features of the SVM [
29]. The purpose of SVR is to find the function that provides a general prediction to reduce the risk of overfitting, while reducing the prediction error on the training data. Just like the SVM, SVR also maps a data set to a high-dimensional feature space.
Consider the training data set
…
where
is the input vector and
is the corresponding output value of
. Then, the SVR objective function is as follows [
17]:
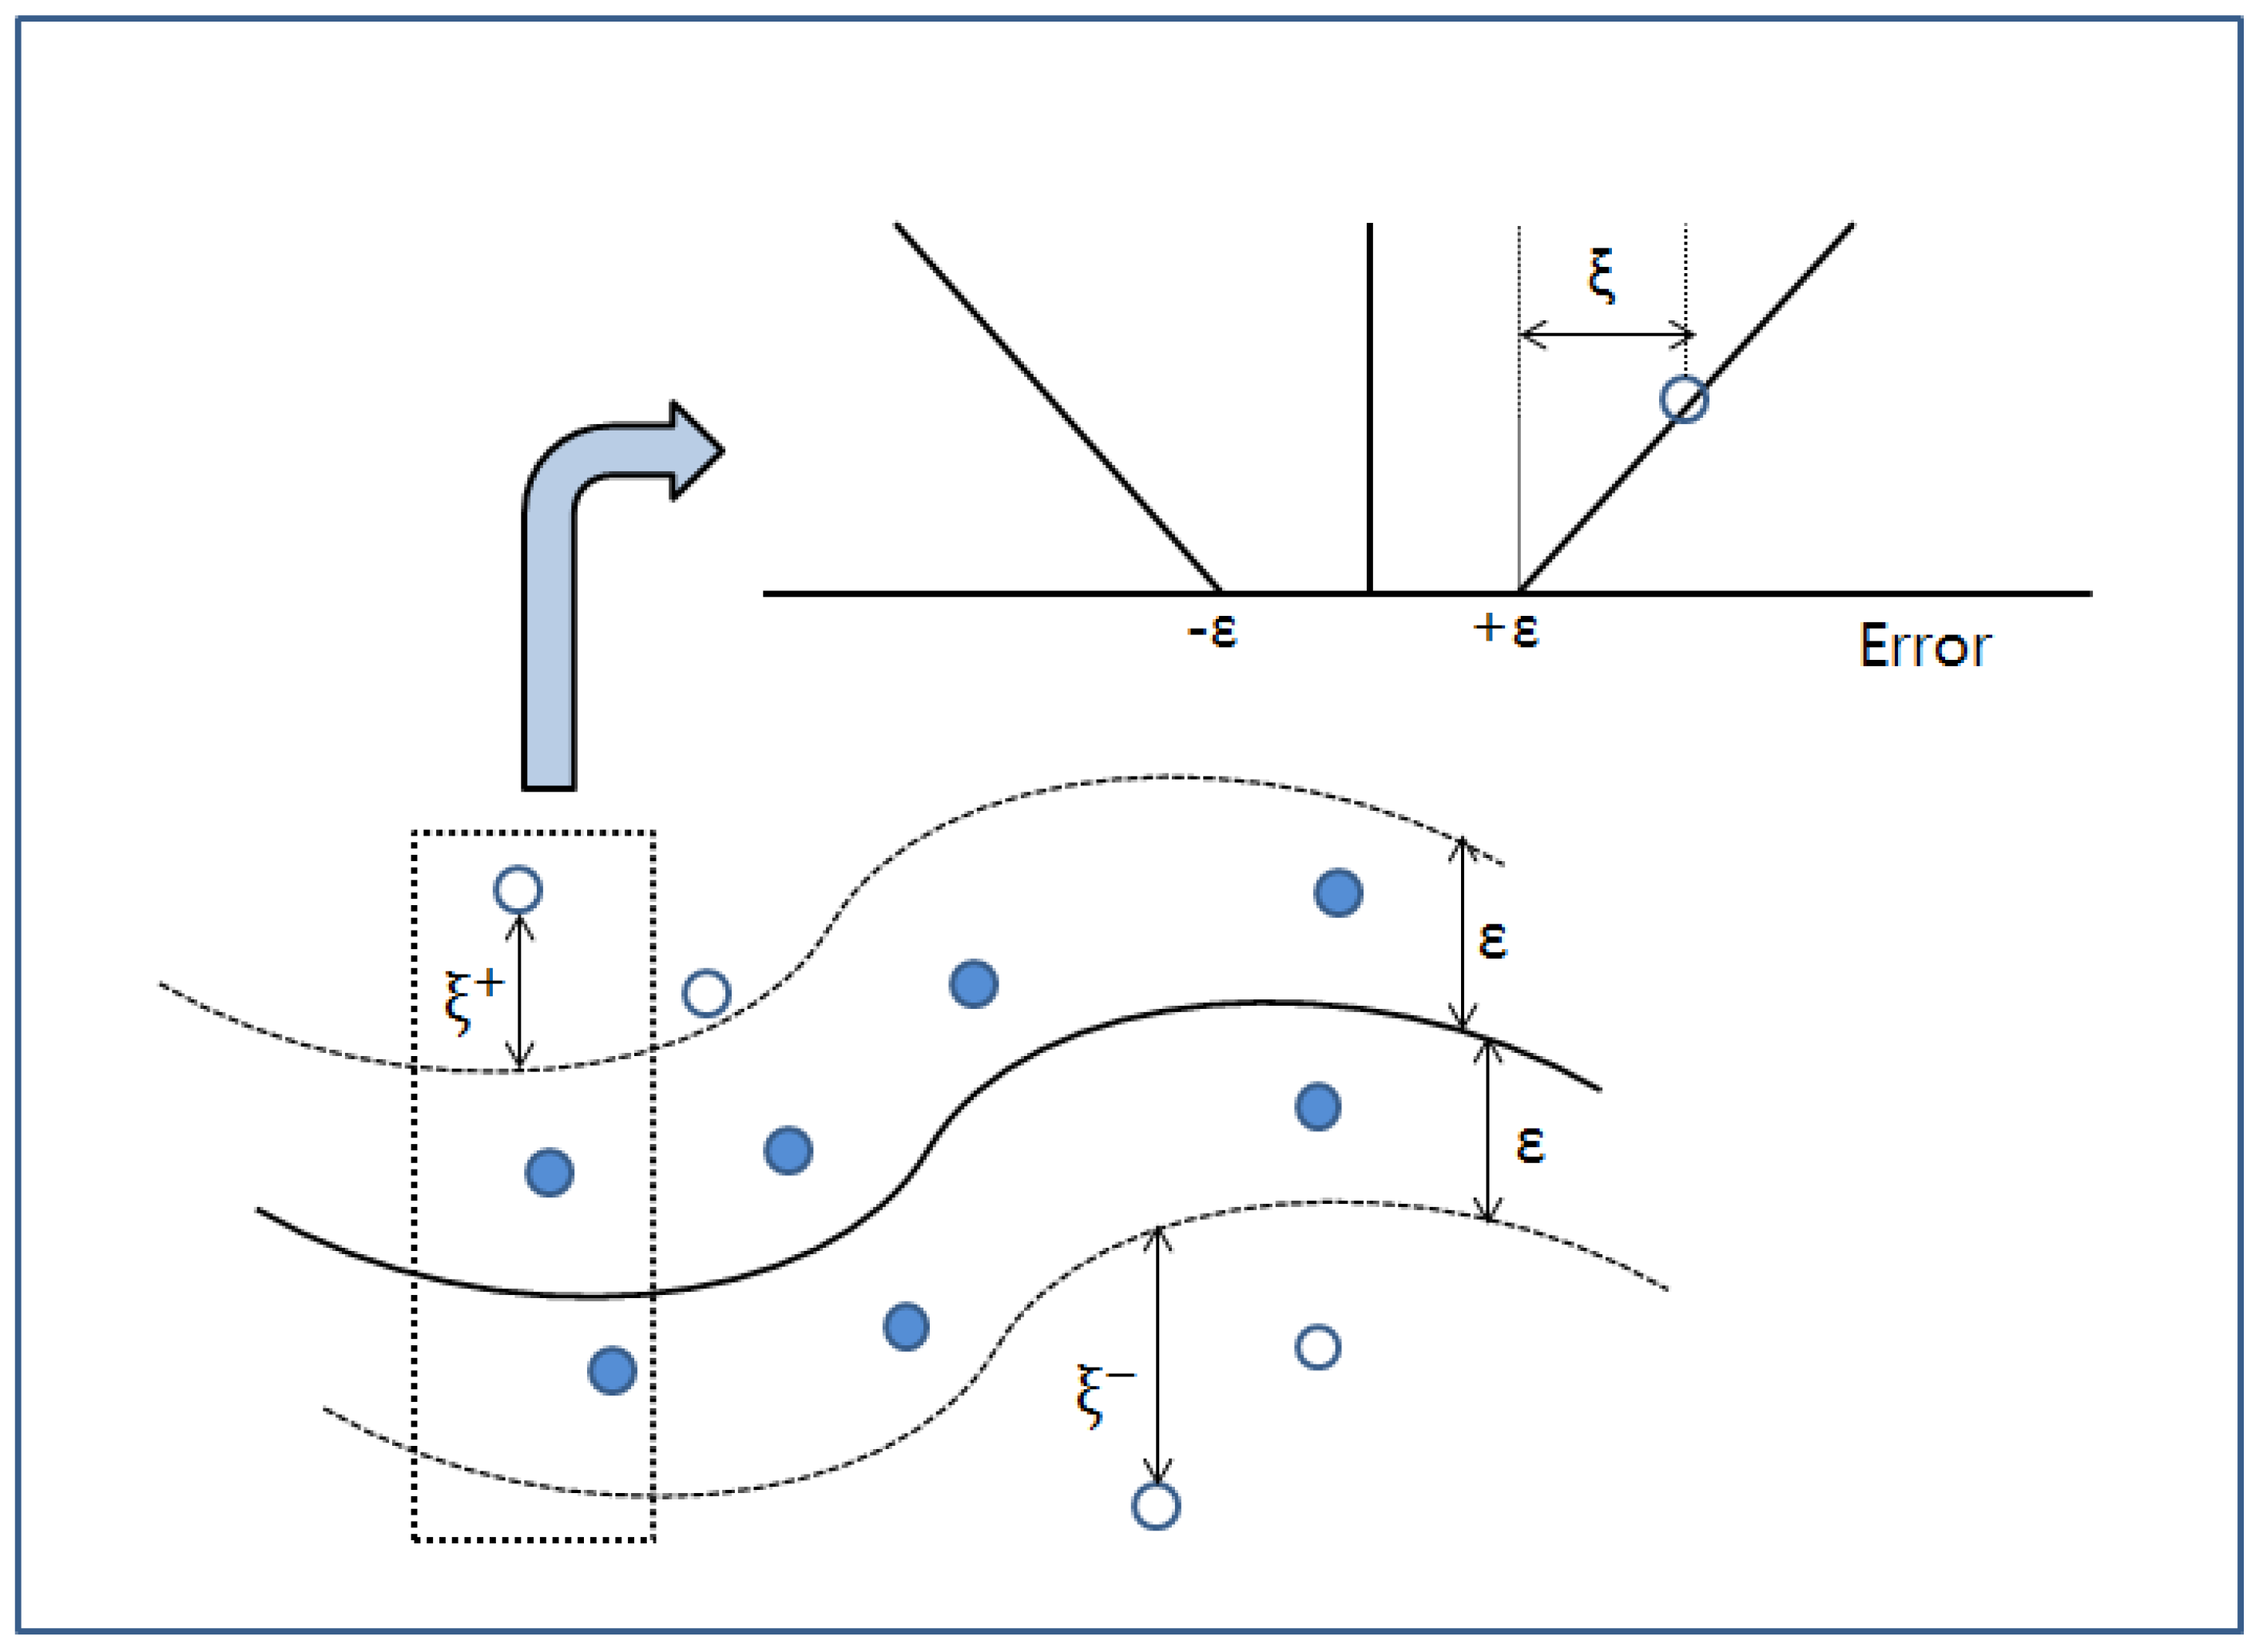
In SVR, the
-insensitive loss function is used to ensure the sparsity of the support vector. Then,
, showing the
-insensitive loss function, is as follows [
17]:
where
is the precision parameter showing the radius of the tube, including the surrounding regression function
, as shown in
Figure 3.
The error should be permitted to a degree, because the error between the actual value and the predictive value deduced by the SVR-based model cannot be avoided, as in the case of the SVM [
29]. Here, the SVR uses a slack variable
to show the distance from the boundary value of the
-tube to the actual value.
Then, we have the following optimization problem, using the slack variables [
17]:
The constant
determines the trade-off between the flatness of
and minimizing the prediction error [
29].
The optimization problem in Equation (3) can be formulated as a dual problem by using the Lagrangian function, yielding the following optimal solution [
1]:
Finally, the general form of the objective function
that we deduce using SVR is as follows [
1]:
In Equation (5),
is the kernel function. Polynomial and radial basis functions are mainly used for this kernel function [
1,
29].
Therefore, by developing a prediction model that applies SVR to improve generalization performance, the model is expected to prevent itself from overfitting to the training data, thus achieving better prediction performance. The parameters of SVR (, , ) should be designated for the model training. In addition, these parameters influence the performance of the SVR-based prediction model. However, an appropriate designation of these three parameters in accordance with the training data is very difficult. Thus, we use the genetic algorithm to find the optimal parameters for the proposed corporate performance prediction model.
3.3. Optimization of SVR Parameters Applying Genetic Algorithm
The genetic algorithm (GA) mimics natural selection and the evolution process of nature [
30]. A feature of the GA is that it finds the optimal solution to a problem by working through several generations and applying the law of the survival of the fittest. This evolution process suggests that descendants inherit the genes of parents. In the GA, solutions are expressed as chromosomes. The typical stages of the GA include the calculation of the fitness value based on the fitness function, a selection operation, a crossover operation, and a mutation operation [
21]. In order to search for the optimal chromosome in a problem, a fitness function is required to evaluate the suitability of the chromosome. The GA can produce new genes that do not exist in the parent chromosomes by applying a mutation operator. During the mutation operation process, parts of the gene forming the chromosome are modified by randomly selecting parts of the chromosome in accordance with the mutation occurrence rate. Increasing the mutation occurrence rate generates more varied chromosomes, which enables a more dynamic search for an optimal solution. However, increasing this rate decreases the convergence speed to the optimal solution. The GA that mimics nature’s evolution process is widely applied in various areas, including system optimization, neural network optimization, and automatic control, among others, in which determining an optimal solution is difficult. As described earlier, the proposed corporate performance prediction model uses SVR for the model training and uses a GA to search for optimal values of the parameters (cost (
), gamma (
), and epsilon (
)) required for the SVR training. Many SVR or SVM parameter optimization studies using GAs use the entire training data set to calculate the fitness value for the search for the most suitable parameters. However, this may decrease the prediction performance of the model because of overfitting to the training data. This problem becomes worse if the training data are time series data. In addition, the inclusion of new training data in the model training process may change the optimal SVR parameters. Thus, the prediction model cannot be used in a sustainable manner. Therefore, we design the SVR model optimization so that the model can adapt to changes in the training data and to changes in the managerial environment, while enhancing the model’s generalization and prediction performance at the same time. The model optimization process is shown in
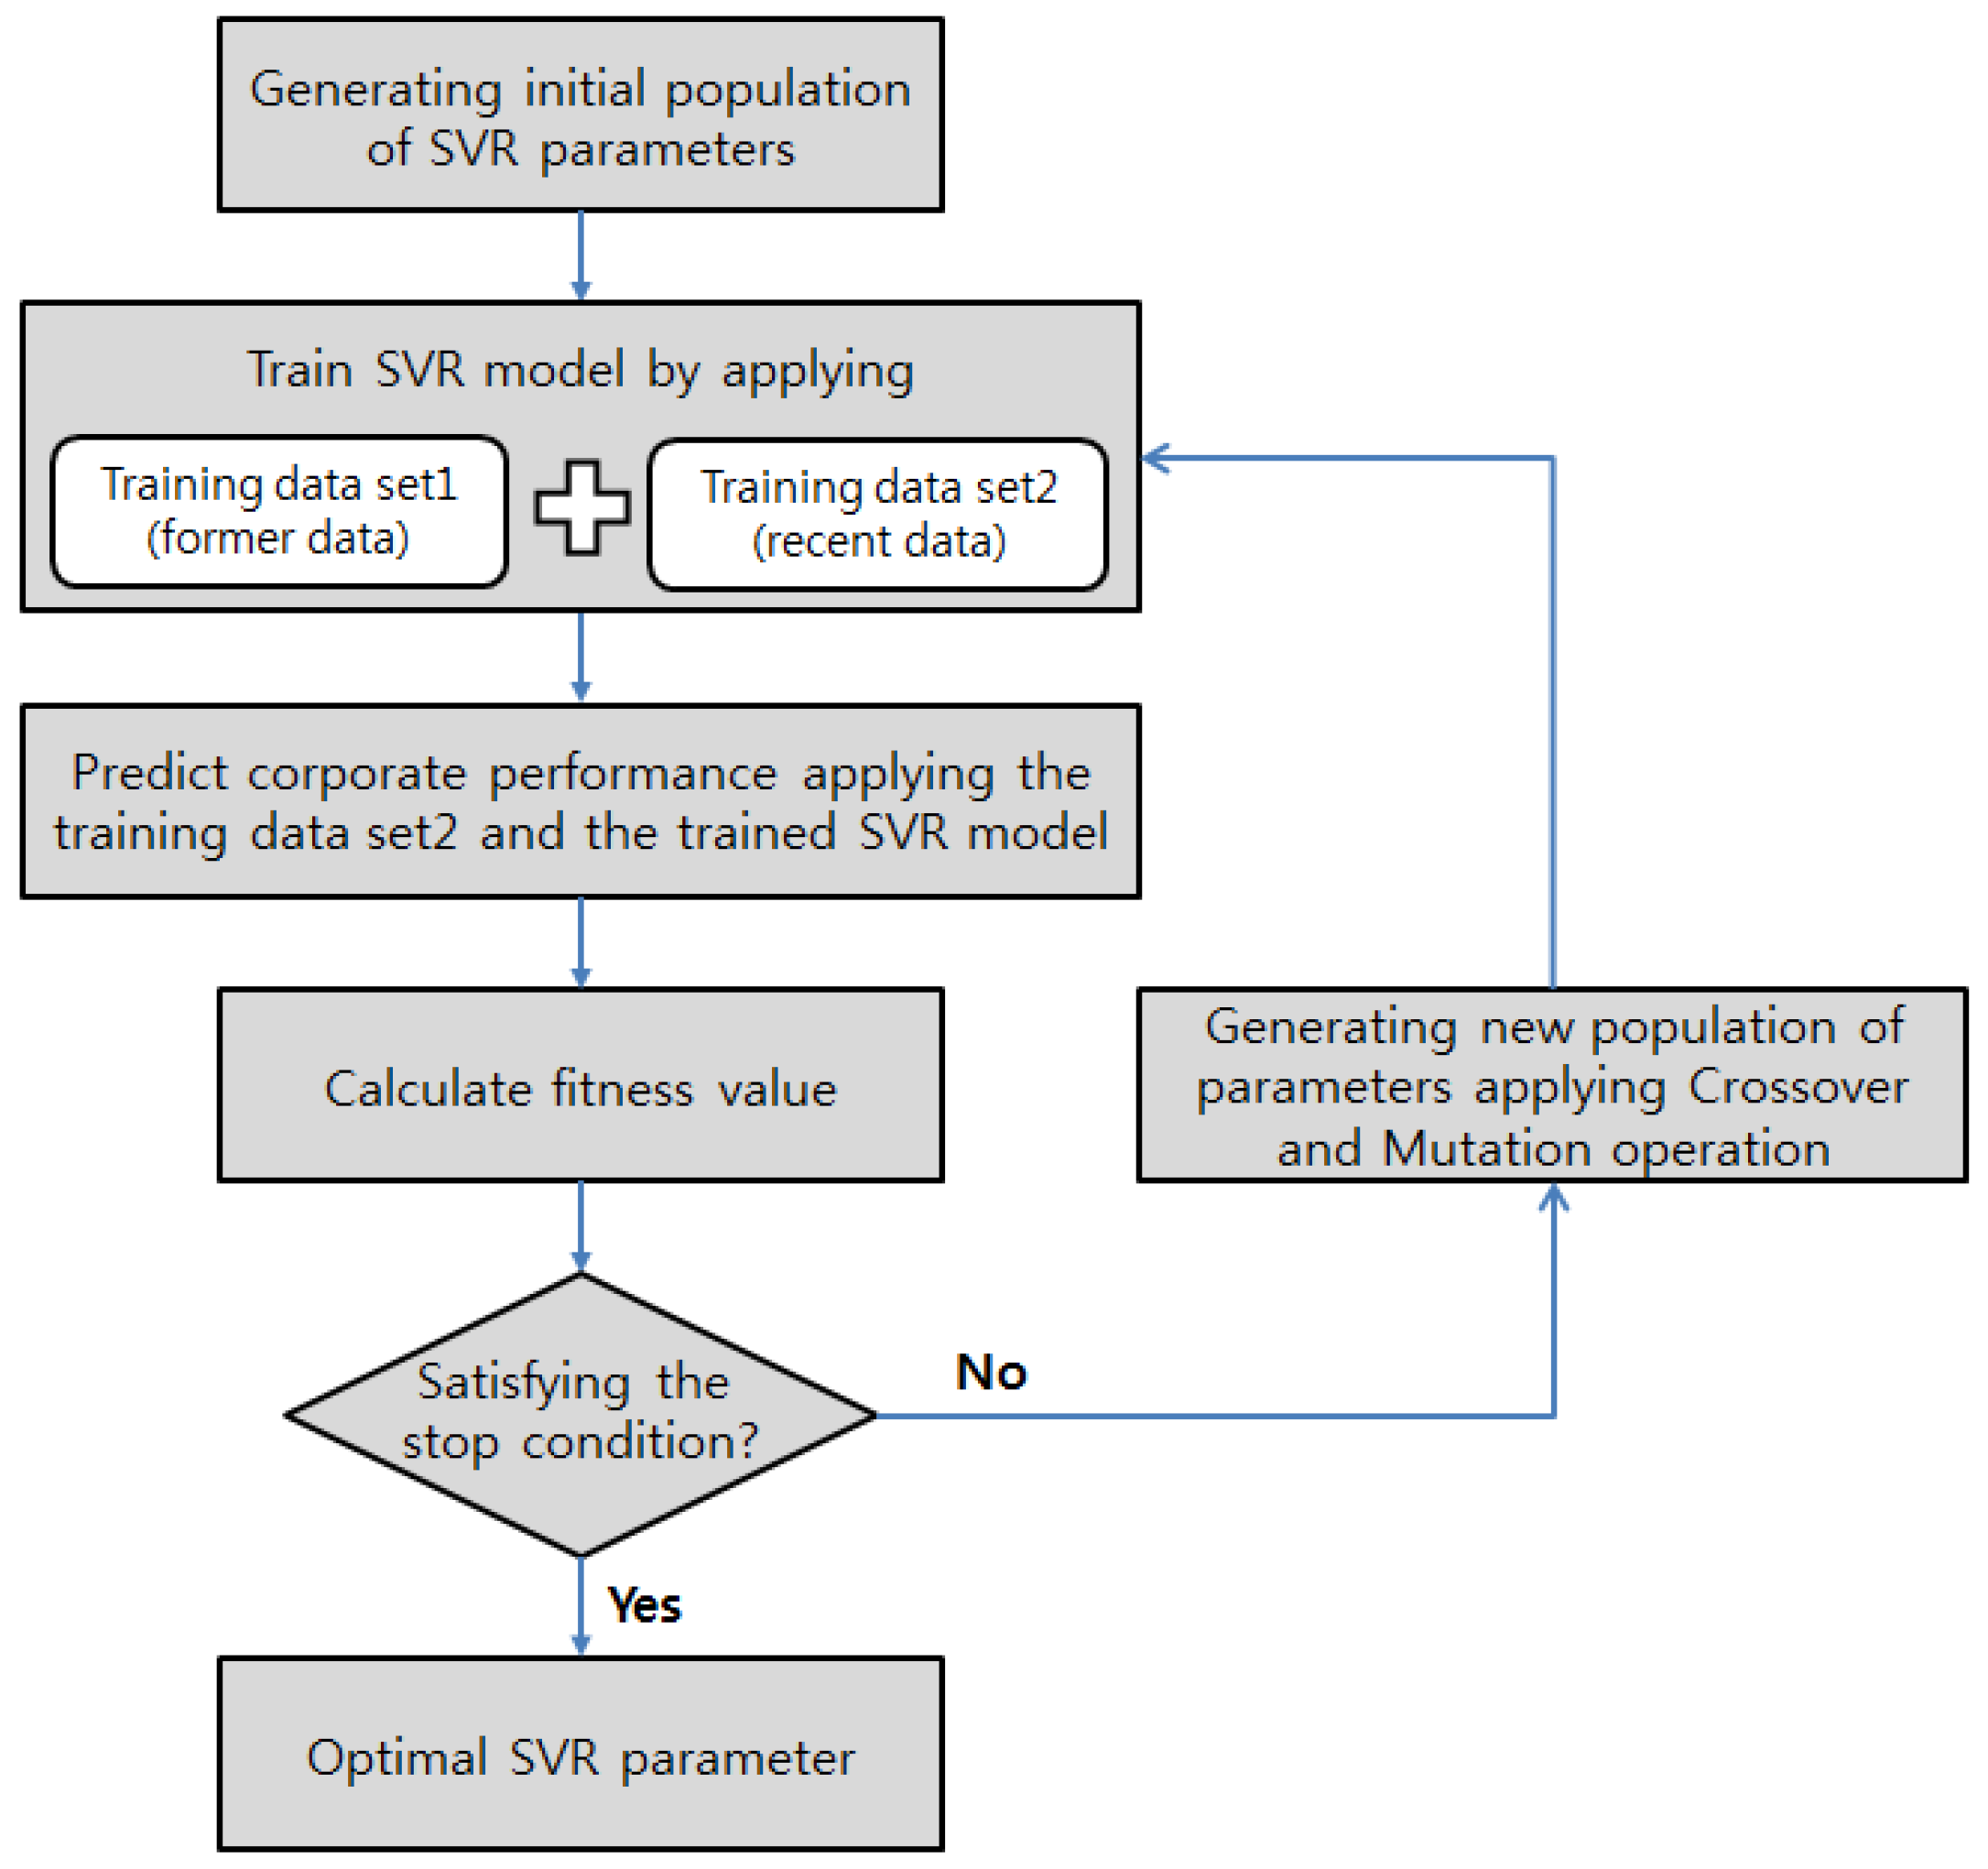
Figure 4.
As illustrated in
Figure 4, we do not use the entire training data for the optimization process when deducing the SVR parameters. Instead, we divide the training data set into two data sets. Both data sets are applied to establishing the SVR-based prediction model. Moreover, the training data set of relatively recent data is applied to deduce the predicted values using the established prediction model. Then, it is applied to search for the optimal SVR parameters that minimize the RMSE between the deduced predicted values and the actual values. By searching for chromosomes that are more suitable for recent data, the prediction performance of the model may be enhanced.
4. Empirical Verification of the Proposed Corporate Prediction Model
For the empirical verification of the proposed corporate prediction model and the analysis of its prediction performance, we establish the model using time series data, including the financial, patent, and corporate performance information of 44 electronic and IT companies. Then, we predict the sales, operating profit, and net profit of these companies using the proposed model. Moreover, we establish two prediction models based on same set of training data using an artificial neural network and SVR (without GA-based optimization) for a comparative analysis.
For the empirical analysis of the proposed model, we collected patent application information and financial information of the 44 electronic and IT companies in order to deduce the financial and technical predictors of the proposed model.
In order to deduce the financial predictors, we downloaded financial statements from 2001 to 2013 for each company from Y-Chart, which is a corporate information service company based in the United States. To deduce the technical predictors that show the technical capability of a company, we downloaded information on 307,552 patents from LexisNexis for the period 2001 to 2013.
We applied 13 financial indicators, including the sales growth rate and the stockholders’ equity turnover ratio, to establish the model (see
Table 2).
The deviation of the collected financial indicators is relatively high. This is because the 44 companies in the data include both large- and medium-sized companies. In particular, the net profit growth rate and return on sales show extremely high deviations. The fluctuations of certain companies’ net profits or operating profits have contributed to these high deviations. In such cases, the companies’ net profits or operating profits converge almost to 0 in the previous fiscal year, before making a huge profit or loss in the following year, leading to an extremely high or low net profit or operating profit. The cases that show such high deviations in the collected financial information are Applied Micro Circuits’ net profit growth rate in 2011 and Electronics for Imaging’s net profit growth rate in 2007.
In this study, we deduced five patent indicators using the downloaded patents of the 44 companies. We used citation information and the number of patents the companies applied for on a year-on-year basis to deduce these patent indicators. The patent indicators used for the technical predictors include the number of applications for patents, the number of forward citations, cites per patent (CPP), the increase in the rate of patent applications, and the relative cumulative number of patent applications (see
Table 3).
The purpose of the study is to develop a model that can predict the sales, operating profit, and net profit of companies accurately using financial and technical predictors. The sales, operating profit, and net profit of a company tend to change in a more stable way than a company’s stock price does. Thus, establishing a model predicting the performance of a company using data from the previous quarter has low variability. Therefore, an analysis and comparison of the prediction performance of the proposed model against that of the artificial neural network and SVR algorithms is difficult. Moreover, determining the contribution of a patent to the performance of a company after commercializing the patent requires two to four years. Thus, we designed the proposed model to predict the sales, operating profit, and net profit of a company using the financial predictors of the previous year and the technical predictors from three years previously. To do so, we create time-lag variables with a year’s time lag between financial predictors and the corporate performance, and a three-year time lag between the technical predictors and the corporate performance.
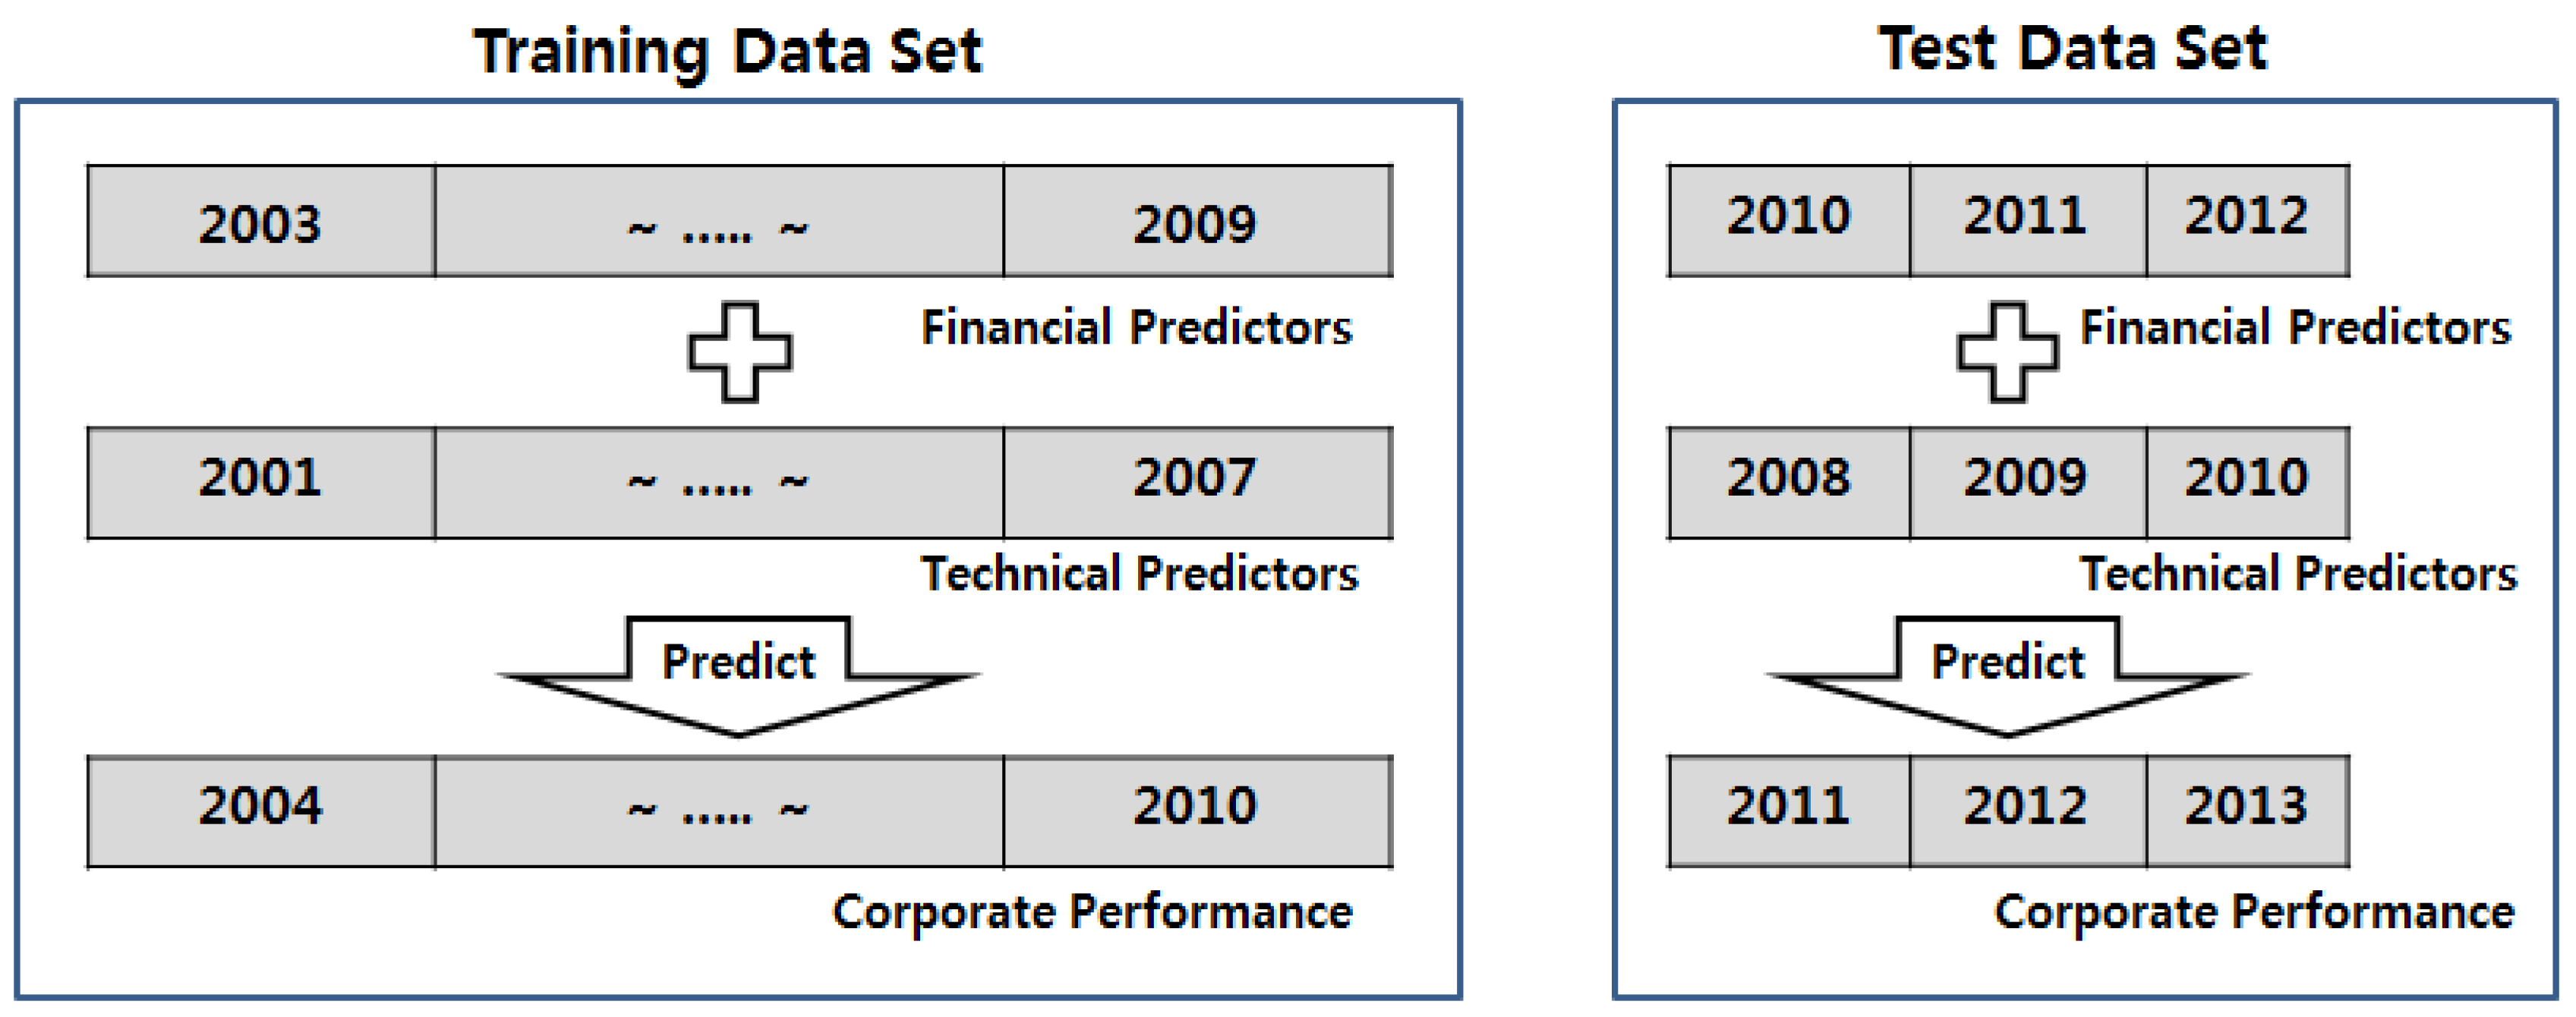
As shown in
Figure 5, we trained the proposed model to predict the corporate performance for 2004–2010 using the technical predictors from 2001 to 2007 and the financial predictors from 2003 to 2009 as independent variables of the model. Then, we predicted the corporate performance for 2011–2013 using the technical predictors from 2008 to 2010 and the financial predictors from 2010 to 2012 using the constructed model. We then analyzed the prediction performance of the proposed model by comparing the predicted values to the actual corporate performance values.
The proposed prediction model uses the GA to find the optimal parameters (cost (), gamma (), and epsilon ()) that influence the prediction performance of the SVR-based prediction model. The population, mutation rate, and crossover rate have to be designated before finding the optimal value using the GA. Here, we used values of 1000, 0.05, and 0.8 for the population, mutation rate, and crossover rate, respectively.
Table 4 shows the optimal SVR parameter values for the sales, operating profit, and net profit prediction models.
We established the sales, operating profit, and net profit prediction models using the optimal SVR parameters and the training data set. In addition, we predicted the corporate performance from 2011 to 2013 using the test data set to verify the prediction performance of the model. As a result, the RMSE value between the actual sales and the predicted sales came to $6714.688 million. The RMSE values between the actual operating profit and the predicted operating profit, and the actual net profit and the predicted net profit were $3486.226 million, and $2873 million, respectively.
We also established two other prediction models using same training data in order to compare the prediction performance of proposed model with that of other learning algorithms. The learning algorithms used to establish the two other prediction models are the GA-ANN algorithm, which optimizes the weights of the artificial neural network nodes, and the SVR algorithm, without optimizing the parameters using a GA. We use the RMSE to measure the prediction accuracy of the three models, as in related studies [
31]. The results of the comparison are shown in
Table 5.
As shown in
Table 5, the prediction performance of the proposed GA-SVR-based model is excellent. In particular, in the case of operating profit and net profit, which are subject to higher levels of variability than sales, the SVR-based prediction model performs better than the ANN-based prediction model. In order to determine whether using technical indicators as predictors will improve the prediction ability of the model, we established the same GA-SVR model, but without the technical indicators, and determined the RMSE values between the predicted values and the actual values. The RMSEs for total sales, operating income, and net profit were 6769.779, 3493.381, and 2982.982, respectively. Accordingly, the results confirm that using technical indicators as predictors helps to enhance the prediction performance of a prediction model.
5. Conclusions
We have proposed a prediction model using SVR to enhance the generalization performance of the model. For the SVR-based model training, cost (), gamma (), and epsilon () need to be designated, and the prediction performance of a model varies in accordance with the parameter values. Because the optimal values of these parameters vary with the training data, continuously finding optimal parameter values whenever the training data change is difficult. Thus, we designed a model to search for the optimal parameters using a genetic algorithm. Unlike the GA fitness function often used in other studies, we divided the training data set in two, using one section for the model training and the other for the fitting criterion adjusting the predictive value of the training model. Owing to these differences, the proposed model is expected to detect SVR parameters that are more suitable for the current data and trends. Moreover, because the proposed prediction model used the genetic algorithm, the model itself will adjust to the changing managerial environment and the inclusion of new data, as well as maintain a stable prediction performance. In this sense, we can sustainably use the proposed prediction model. Our results confirmed that the prediction performance of the proposed model is better than both the ANN and general SVR models. In particular, the proposed prediction model was shown to predict operating profit and net profit, which fluctuate more than sales, better than both of the other models. From this, we conclude that when forecasting a company’s performance, SVR models that enhance the generalization performance can increase the prediction performance of the models.
The model’s prediction performance could be improved by adopting a feature selection technique when deducing the predictors. Moreover, it is expected that collecting companies of similar sizes will establish a model with a better prediction performance.
In addition, placing more weight on the recent data during the training by making the most of the features of the time series training data could help to establish a better prediction model.
Unlike existing studies, we predicted the performance of companies using technical indicators as predictors, deduced from patents that the companies applied for. In addition, to analyze whether using technical indicators that reflect companies’ technical capability as predictors will help improve the prediction performance of a model, we established the same model without the technical indicators, and compared the two. Here, we found that the model using technical indicators as predictors proved to have a better prediction performance. From this, we confirmed that when predicting the performance and stock prices of technology-intensive companies in information technology (IT) or biotechnology (BT) industries, using predictors that reflect the companies’ technological capabilities improves the prediction performance of a model. In order to use the technical indicators more effectively during model training, a time-lag analysis of the influence of the technical indicators on the enhancement of managerial performance is required. Furthermore, an empirical analysis of the effect of technical indicators on the various industrial fields may be required.


