1. Introduction
Voluntary green building certification systems have become increasingly popular among commercial buildings over the last decade. Such trends should be welcomed because it encourages sustainable and energy-efficient design to minimize commercial buildings’ environmental footprints. In the U.S., the two main voluntary green certification programs for commercial buildings are the Leadership in Energy and Environmental Design (LEED) program developed by the non-governmental private organization U.S. Green Building Council (USGBC), and the Energy Star program sponsored by U.S. Environmental Protection Agency and U.S. Department of Energy.
Beginning with its launch in 2000, the LEED system has become the flagship for green buildings with its rating systems spanning many aspects throughout the development and construction process. Through 2012, more than 13,500 commercial-building projects are LEED-certified in the U.S. The rating systems cover five environmental categories including sustainable sites, water efficiency, energy and atmosphere, materials and resources, and indoor environmental quality. In 2009, USGBC proposed a new LEED rating system called LEED2009. LEED2009 imposes a prerequisite to water efficiency and buildings that apply for the certificates must meet a maximum water usage threshold. Another important change with LEED2009 is the introduction of a new credit weighting system with an increase emphasis on the reductions of energy consumption and greenhouse gas emissions. The third change is adding innovation in design and regional priority credits, which awards additional points on sustainable building expertise and specific regional environmental design [
1].
The other green certification program, Energy Star, was created in 1992. Over 50 different product categories, as well as homes, commercial buildings, and industrial plants, can be certified by this program with a blue Energy Star label. To be eligible for Energy Star certification, a building must perform as the top 25 percent of energy-efficient buildings in the nation. In 2012, the Energy Star program successfully saved energy costs for businesses and consumers of about $24 billion across the U.S [
2].
Green certification is an indicator of the original design of a building’s quality in terms of sustainability. Environmental sustainability involves lower environmental footprint and reduction of carbon emissions. The design of buildings that can meet the LEED and Energy Star requirements is intended to enhance environmental sustainability and, thus, generate positive externalities. Such green building certification is a governmental and commercial instrument in favor of the diffusion of positive externalities. Although behavior response of commercial building occupants might offset some energy conservation from energy efficient technologies through “rebound effects” [
3,
4], green certified buildings have received more attention as the awareness of energy efficiency and the established “green” premia on building rents and market values have strengthened [
5]. Hence, understanding the factors influencing the diffusion of voluntary green building certificates is of critical interest to both marketers and policy makers.
Firms might choose to go green for several reasons. First, the falling relative price of renewable energy to traditional energy is starting to offer firms another way to cut costs [
6]. Second, going green allows firms to enjoy an energy efficiency gain even when going green does not necessarily cut energy expenses [
7]. Third, there is evidence that a company’s decision to go green is rewarded by the markets through increasing property values and rent prices [
8].
Peer effects—defined as the phenomenon that members of a peer group with similar characteristics and social status tend to influence each other’s decisions—are considered as an important factor in the diffusion of new technologies or programs. There is evidence that peer effects can influence various corporate activities, such as executive compensation and product development [
9]. Peer effects can influence firm actions through various mechanisms such as changes in corporate conditions through competition, information spillover, pooling of resources, and preference changes. This paper estimates, empirically, the peer effects of commercial buildings’ adoption of green certificates. The diffusion of green certification is also in line with the concept of diffusion of innovation by Rogers [
10]. According to Rogers [
10], new ideas or innovation can spread through communication among the members of a social group. In the context of this paper, the innovation is green building certification. The diffusion channel we analyze is peer effects, which involves communication among building owners or developers who work in areas geographically close to each other.
There has been a rich body of literature examining peer effects based on household or individual choices. However, empirical research estimating peer effects among firms has been sparse. Devenow and Welch [
11] show that financial firms’ decisions are influenced by those of other financial firms via information acquisition, informational learning, and/or reputation signals based on managers’ desires. Patnam [
12] provides evidence that peer effects have significant influence on investment strategies and executive compensations of firms. Leary and Roberts [
9] show that firms’ financing decisions are heavily influenced by peers’ financing decisions and not so much determined by changes in firm-specific characteristics. They also find that the types of firms that are most influenced by peers are smaller firms with less experienced CEOs and financial constraints.
As will be discussed in
Section 3, empirically estimating peer effects has many challenges. This paper builds upon the empirical model in Bollinger and Gillingham [
13] to consistently measure the peer effects in commercial buildings’ adoption of green certificates. In particular, peer effects on the diffusion of green certification in New York (NY) and Arizona (AZ) are detected by using a unique panel dataset of commercial buildings from ProspectNow [
14] and certificate-application-and-approval information from LEED and Energy Star programs. Moreover, the magnitudes of peer effects before and after the revision of LEED rating system in 2009 are compared and peer effects decreased in magnitude after 2009. There have been studies examining peer effects in the adoption of green technologies such as solar panels and energy efficient vehicles by households [
13,
15,
16]. This paper adds to the existing literature by providing empirical evidence that peer effects are also present in the adoption of green certificates of commercial buildings. This paper analyzes both retrofits and new construction. Our results have important implications for policymakers and the green-building industry via two dimensions: (1) diffusion can be facilitated by establishing early adopters of green certificates or green building demonstration projects; and (2) diffusion can also be encouraged by creating platforms for interactions among building managers or corporate environmental staffs.
The paper proceeds as follows. After the introduction,
Section 2 discusses current empirical challenges in peer-effects estimation, presents our empirical strategy, describes the data used and provides summary statistics.
Section 3 presents the econometric results.
Section 4 performs robustness checks.
Section 5 discusses the results and
Section 6 concludes.
2. Materials and Methods
2.1. Empirical Challenges to Estimate Peer Effects
There are different ways of identifying peer effects in the existing literature: the structural model approach established by Manski [
17], experiments where assignment of peers is random [
18,
19,
20], and other models leveraging network structures, non-linearity, and lagged variables [
21,
22,
23]. A commonly-cited approach to estimate peer effects uses observational data and regresses an agent’s own outcome on peer outcomes, which is called the linear-in-means model. The model can be described as:
where
yit is the outcome of agent
i at time
t;
E(y|
xi,
t) is the average outcome of the peer group;
x are characteristics of the agent’s peer group;
z are observable individual attributes; and
u are unobservable individual attributes.
As elaborated in Manski [
17], Brock and Durlaf [
24], Moffitt [
21], Soetevent [
25], and Bollinger and Gillingham [
13], two major problems of this approach make it difficult to identify causal peer effects: self-selection and reflection. Self-selection is the problem that individual agents generally opt into groups with members of similar characteristics/preferences, leading to an apparent existence of peer effects. As a result, it will appear that peers’ outcomes cause the agent’s outcome but the actual causality is the opposite. Reflection is the simultaneity problem where if peers influence an agent, the agent’s action also influences them. Thus, an agent’s decision is not really influenced by peer effects in the strict sense, but instead a reflection of what he/she might have already decided even in the absence of a peer group. An example would be one building’s decision-maker has decided to obtain green certification and explained her rationale to her peers. Some of her peers then become green-certified around the same time. In this case, it might appear that her decision is influenced by her peers but, in fact, even without these peers, she would also obtain green certification. This reflection problem can contribute to the endogeneity issue.
In the context of applying for green building certificates, the potential identification problems are as follows. First, it is relatively safe to assume that buildings in the same neighborhood probably face similar institutional environments, environmental policies, and other characteristics, such as capital level and ability of building management. These factors are likely to influence buildings’ decisions regarding green certification. If these factors are not observable and measurable, they are then embodied in peer buildings’ actions and, hence, bias the estimates of peer effects. Second, one individual building’s decision to apply for green certification can influence its neighboring buildings’ decisions to apply for green certificates, thus making peer effects un-identifiable.
To address the self-selection problem, one can conduct an experiment where assignment of peers is random [
18,
19,
20]. However, conducting randomized experiment is not always feasible. In the absence of experimental data, one common approach is to utilize panel data and include fixed effects to eliminate unobservable characteristics that might generate self-selection [
16,
26], as shown in Equation (1). As explained in more details in [
13], “if peer group fixed effects ξ
i can control for group-specific characteristics and if self-selection is the only issue, then β can be consistently estimated”.
where ξ
i is the peer group effects and σ
t is the time fixed effects.
To address the reflection problem, several studies find instruments for an agent’s peers’ outcomes. For example, the outcomes of peers’ parents or other relatives can influence peers’ outcomes and are not related to the agent’s own outcome [
27]. Another common strategy to solve for the reflection problem, as shown in Equation (3), is to use the peers’ lagged outcomes to replace peers’ current outcomes
E(
y|xi,
t) [
9,
13,
28,
29]. In Equation (2), the coefficient β for the peers’ lagged outcome is the peer effects. To do this in the context of technology diffusion, “installed base” of the technology adopted in the peer group by year
t − 1 is used as peers’ lagged outcome. The installed base is the total number or size of the technologies adopted in the peer group. Using the installed base to explain diffusion of a product or technology has been common in the literature [
16,
26,
30,
31,
32,
33,
34,
35,
36].
2.2. Econometric Models
Following Bollinger and Gillingham [
13], we utilize the fact that there is a time lag between the application for a green certificate and the actual timing for being certified. Based on the records of existing green buildings, on average, there is a one-to-three-years lag between the application and the actual certification due to the time needed for application preparation and submission, extensive review by experts, construction, and approval process. We assume that the peer effects of green certification would not have an impact until the certificates are approved and granted by relevant agencies. This is a reasonable assumption because only after a building is officially certified can people see the sign of LEED or Energy Star certification on the building and the building can enjoy any market-driven benefits associated with green buildings, such as higher rental prices. This time lag can help solve the reflection problem because the application of a building in year t would not have influenced the approval of peers’ certificates by year t whose applications were started at least more than a year ago. To solve for the self-selection problem, we have included both time and peer group fixed effects. We adopt the installed base model similar to the one in Equation (3).
Our analysis is at the zip code level. In our primary model, we estimate how peer effects influence the probability that a commercial building in zip code
z adopts green certificates:
where
Yzt is the share of commercial buildings in a zip code that were previously non-green buildings and applied for a green certificate in year
t, including both retrofits or new construction (
Yzt =
nzt /
Nzt. Here
nzt is the number of green certification applications in zip code z in year
t, meaning the number of commercial buildings that were previously non-green and applied for green certification in year t.
Nzt is the total number of commercial buildings in zip code z in year
t);
bzt is the sum of green-certified buildings in year
t (
bzt is the sum of green certified buildings across the years. This is a standard approach in technology diffusion literature to calculate the installed base of technology [
13,
30]. We do not just use the sum of green buildings in each year because the green buildings in previous years can also impact the decisions of commercial buildings in current year);
Xzt is a vector of explanatory variables including mean year built, average assessed value per square foot, average square footage of commercial buildings and the number of business establishments in each zip code;
hz are zip code fixed effects;
xt are year fixed effects;
ezt is a mean-zero stochastic error. We estimate the model in Equation (4) in different approaches as shown below, including first differences model (FD) and first differences model with mean-differenced zip code fixed effects (FD_MD). We then modified Equation (4) to incorporate a change in the LEED rating system in 2009.
First differences model: Aaccording to Narayanan and Nair [
37], the traditional mean differenced fixed effects model is biased in dynamic panel models. Following Bollinger and Gillingham [
13], we use the first differences model to estimate Equation (4) consistently. The first-differences specification is:
First differences model with mean-differenced zip code fixed effects: zip code-level factors that are time variant, such as zip code-level zoning regulations, can influence the installed base of green-certified buildings. To control for such localized time trends, we run the regression on the first-differences data (Equation (5)) with the inclusion of mean-differenced zip code fixed effects. This is analogous to including zip code time trends.
Model testing change of LEED rating system in 2009: as discussed in
Section 1, there were significant changes in LEED rating system in 2009 which brought a prerequisite for water efficiency for the first time, and put more emphasis on energy efficiency and reducing greenhouse gas emissions, as well as the addition of innovation in design and regional priority credits. There could be two opposite effects of the higher requirements in LEED 2009 rating system on the magnitudes of peer effects. On one hand, the premium enjoyed by LEED certificates obtained after 2009 could be higher because tenants might be aware that these green buildings are more environmentally friendly than LEED buildings certified prior to 2009. As a result, as non-green buildings learn about this fact from their peers, they might be more willing to apply for LEED certificates after 2009, so we might see an increase in peer effects after 2009. On the other hand, peer effects could have been mitigated because information about higher cost and difficulty in obtaining LEED certificates could deter non-green buildings from applying. It boils down to the comparison of the change in the gap between marginal benefit and marginal cost prior to and post 2009.
In order to compare the magnitudes of peer effects before and after the revision of LEED rating system in 2009, we generate a dummy variable indicating whether it was before or after year 2009. We modify Equation (4) by adding an interaction term that multiplies 2009 dummy by the sum of green buildings in year t. To be specific, we estimate:
where
bzt ×
Year2009t is the interaction term and
Year2009t is the dummy variable indicating before or after 2009. We expect β to be positive if there are peer effects and θ to be negative if the 2009 change in LEED program makes it harder to apply for LEED certificates.
2.3. Data and Descriptive Statistics
The main dataset used in this paper is compiled from three sources: a general commercial building stock collected from ProspectNow.com, Energy Star database from the Energy Star program, and LEED database from USGBC. ProspectNow is a commercial real estate data provider which offers detailed information of approximately six million commercial properties, including address, year built, square footage, total assessed value, and property type. According to property type, buildings are categorized as “commercial general”, “commercial office”, “store/office”, “department store”, “whole sale outlet”, “parking lot”, and “hotel/motel”. Given that ProspectNow is a commercial data provider, we obtain its data by purchasing it. The data from the other two sources are publicly available. We rely on PropsectNow for two types of information: assessed property value and basic descriptive characteristics of the properties. The descriptive characteristics are publicly available information that can also be found from county records. For the assessed property value, which is an estimate and outside of our areas of expertise, our data-provider selection criteria are comprehensive of coverage and number of users by assuming that market forces will increase the users of the most reliable provider. Most existing studies on green commercial buildings are focused on office buildings only. In this paper, however, we analyze all commercial buildings rather than only commercial office buildings.
From the ProspectNow.com database, we calculate average assessed commercial building property value which is the assessed property value per square footage. This variable represents the expected future property values and potential economic gains from the property. The lack of information on energy cost savings and business revenue of commercial buildings makes it challenging to predict the benefits from getting green certificates, and therefore we use the assessed property value per square foot as a proxy for potential economic gain from green certificates. We also use the average square footage per building and average year built from the ProspectNow.com database as explanatory variables in order to examine whether building size and age make an impact on decisions of applying for green building certificates.
The Energy Star program has been long established for certification of energy-efficient appliances. In 1999, it was extended to commercial buildings. Starting in 2000, LEED has grown into a comprehensive rating system specifically for buildings and constructions, covering many aspects of design, operation, and construction. Energy Star and LEED databases are obtained from the Energy Star program and U.S. Green Building Council, respectively. The two datasets contain information of each green commercial building, including address, years of certification, and rating systems. Using Geographic Information Systems (GIS), we match green-certified commercial buildings with the general commercial building stock from ProspectNow by building address.
This study collects information on local economic activities which could also influence buildings’ certification decisions. For example, commercial buildings located in a high-wealth area are more likely to afford the cost of green building certification. As described in
Section 2, the econometric models are at the zip code level. The only publically-available zip code-level economic data is the total number of establishments (EST) and total annual payroll (AP) of each zip code from the United States Census Bureau (USCB)’s County Business Patterns (CBP) in 2013. The definition of an establishment is “a single physical location where business is conducted or where industrial operations are performed and total annual payroll in a zip code includes all forms of compensation, such as salaries, wages, commissions, dismissal pay, bonuses, vacation allowances, sick-leave pay, and employee contributions, to qualified pension plans paid during the year to all employees” [
38]. Since there is a high correlation between EST and AP (correlation coefficient 0.75), we only include EST as a control variable for zip code-level economic activities in the model.
This paper focuses on two states: New York and Arizona. NY is one of the leading states in terms of total number of green-certified commercial buildings. AZ is a representative of states that have relatively smaller total number of green commercial buildings. From the various data sources described above, we constructed a panel dataset starting from year 1999 to 2012 for Energy Star (For Arizona, the time span for Energy Star dataset is 2000–2012 because we do not have data for AZ’s Energy Star commercial buildings prior to 2000) and a panel dataset of 2002–2012 for LEED program. The shorter time span for the LEED panel dataset is due to its later starting date.
Table 1 lists the summary statistics of the key variables for the year of 2012 for NY and AZ. The number of zip codes in each state included in the model is less than the actual number of zip codes because zip codes with no commercial buildings in 2012 are excluded.
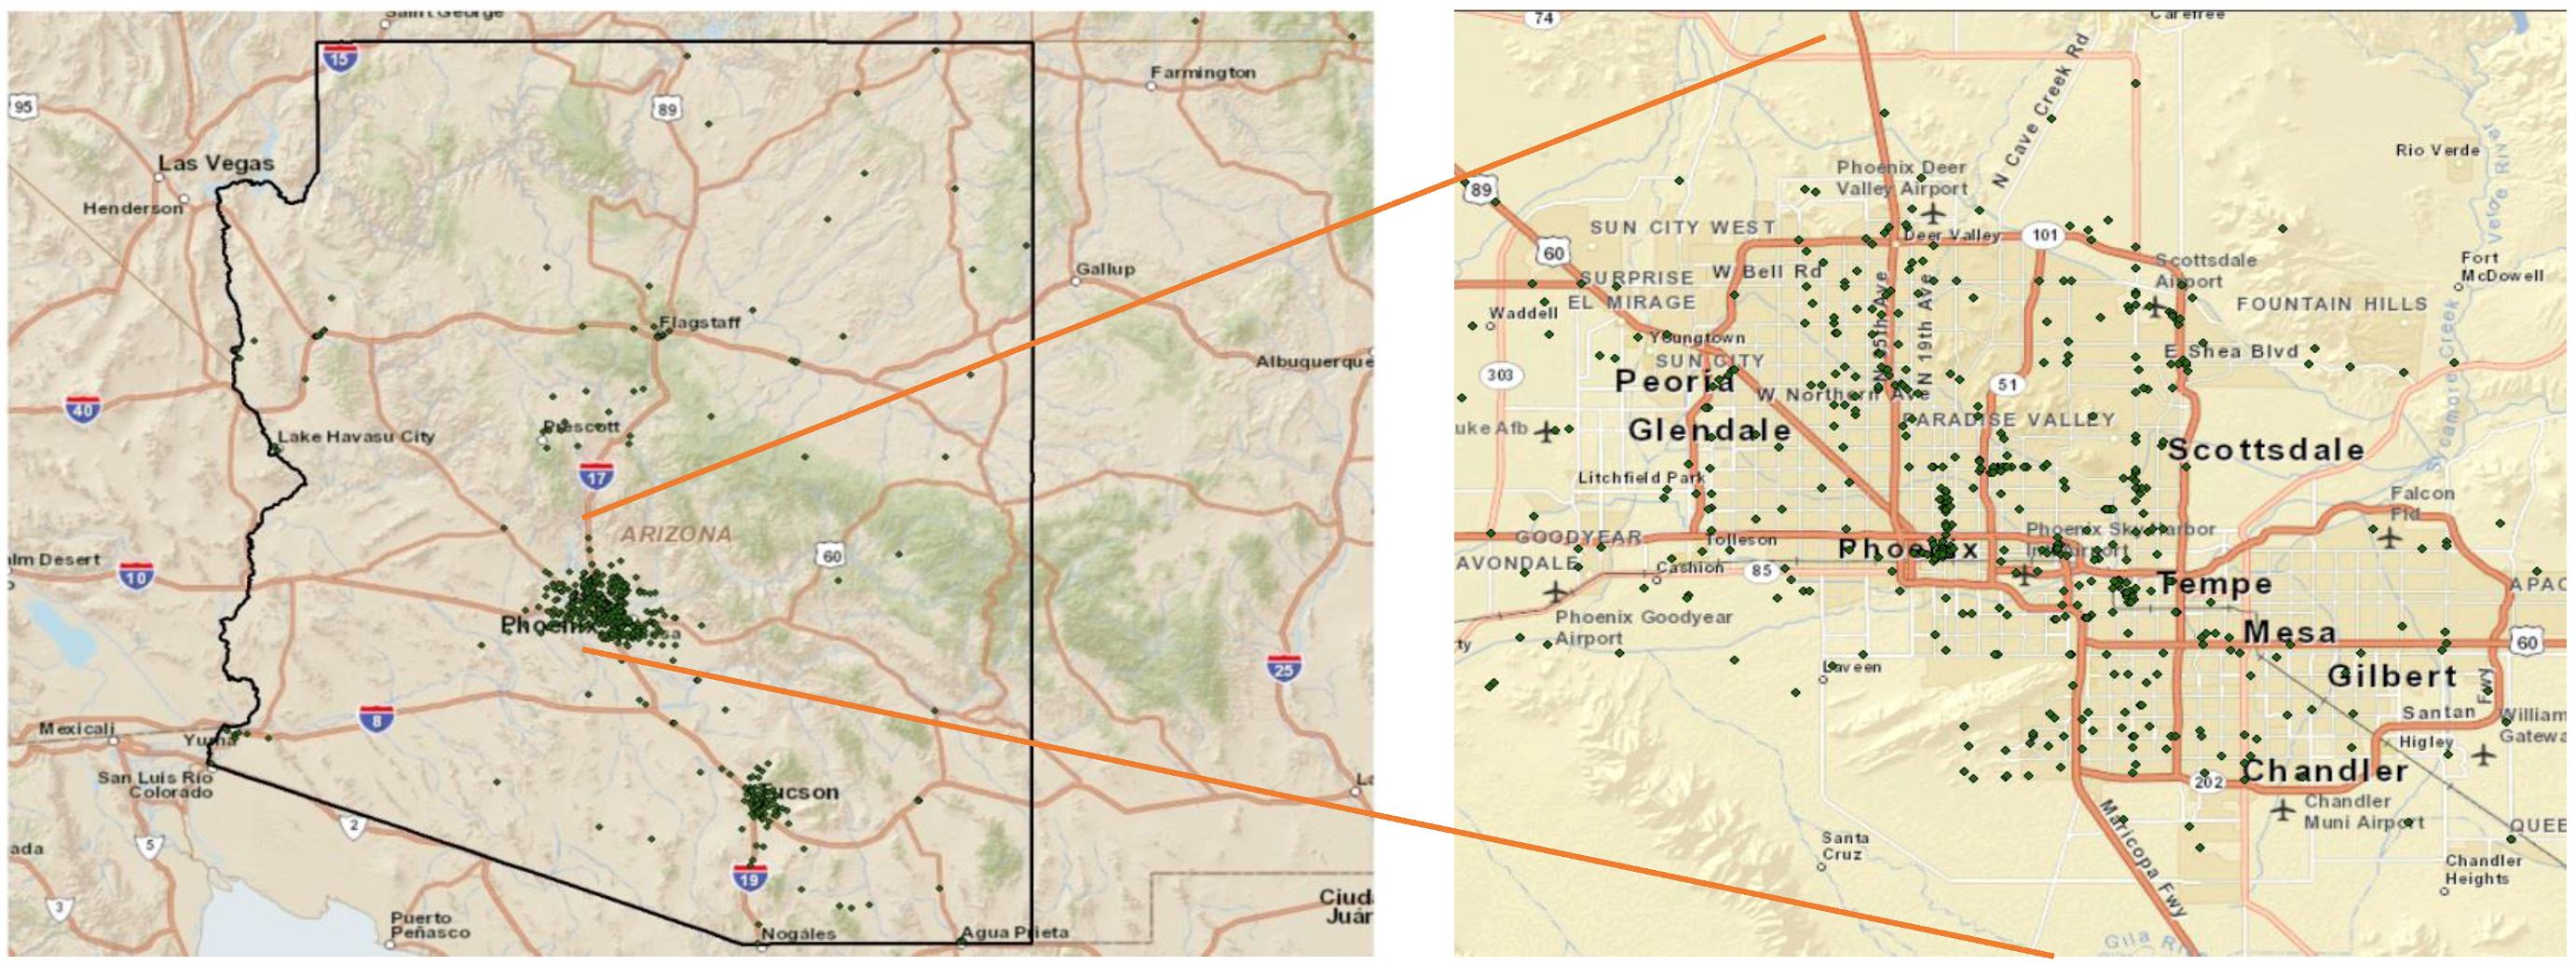
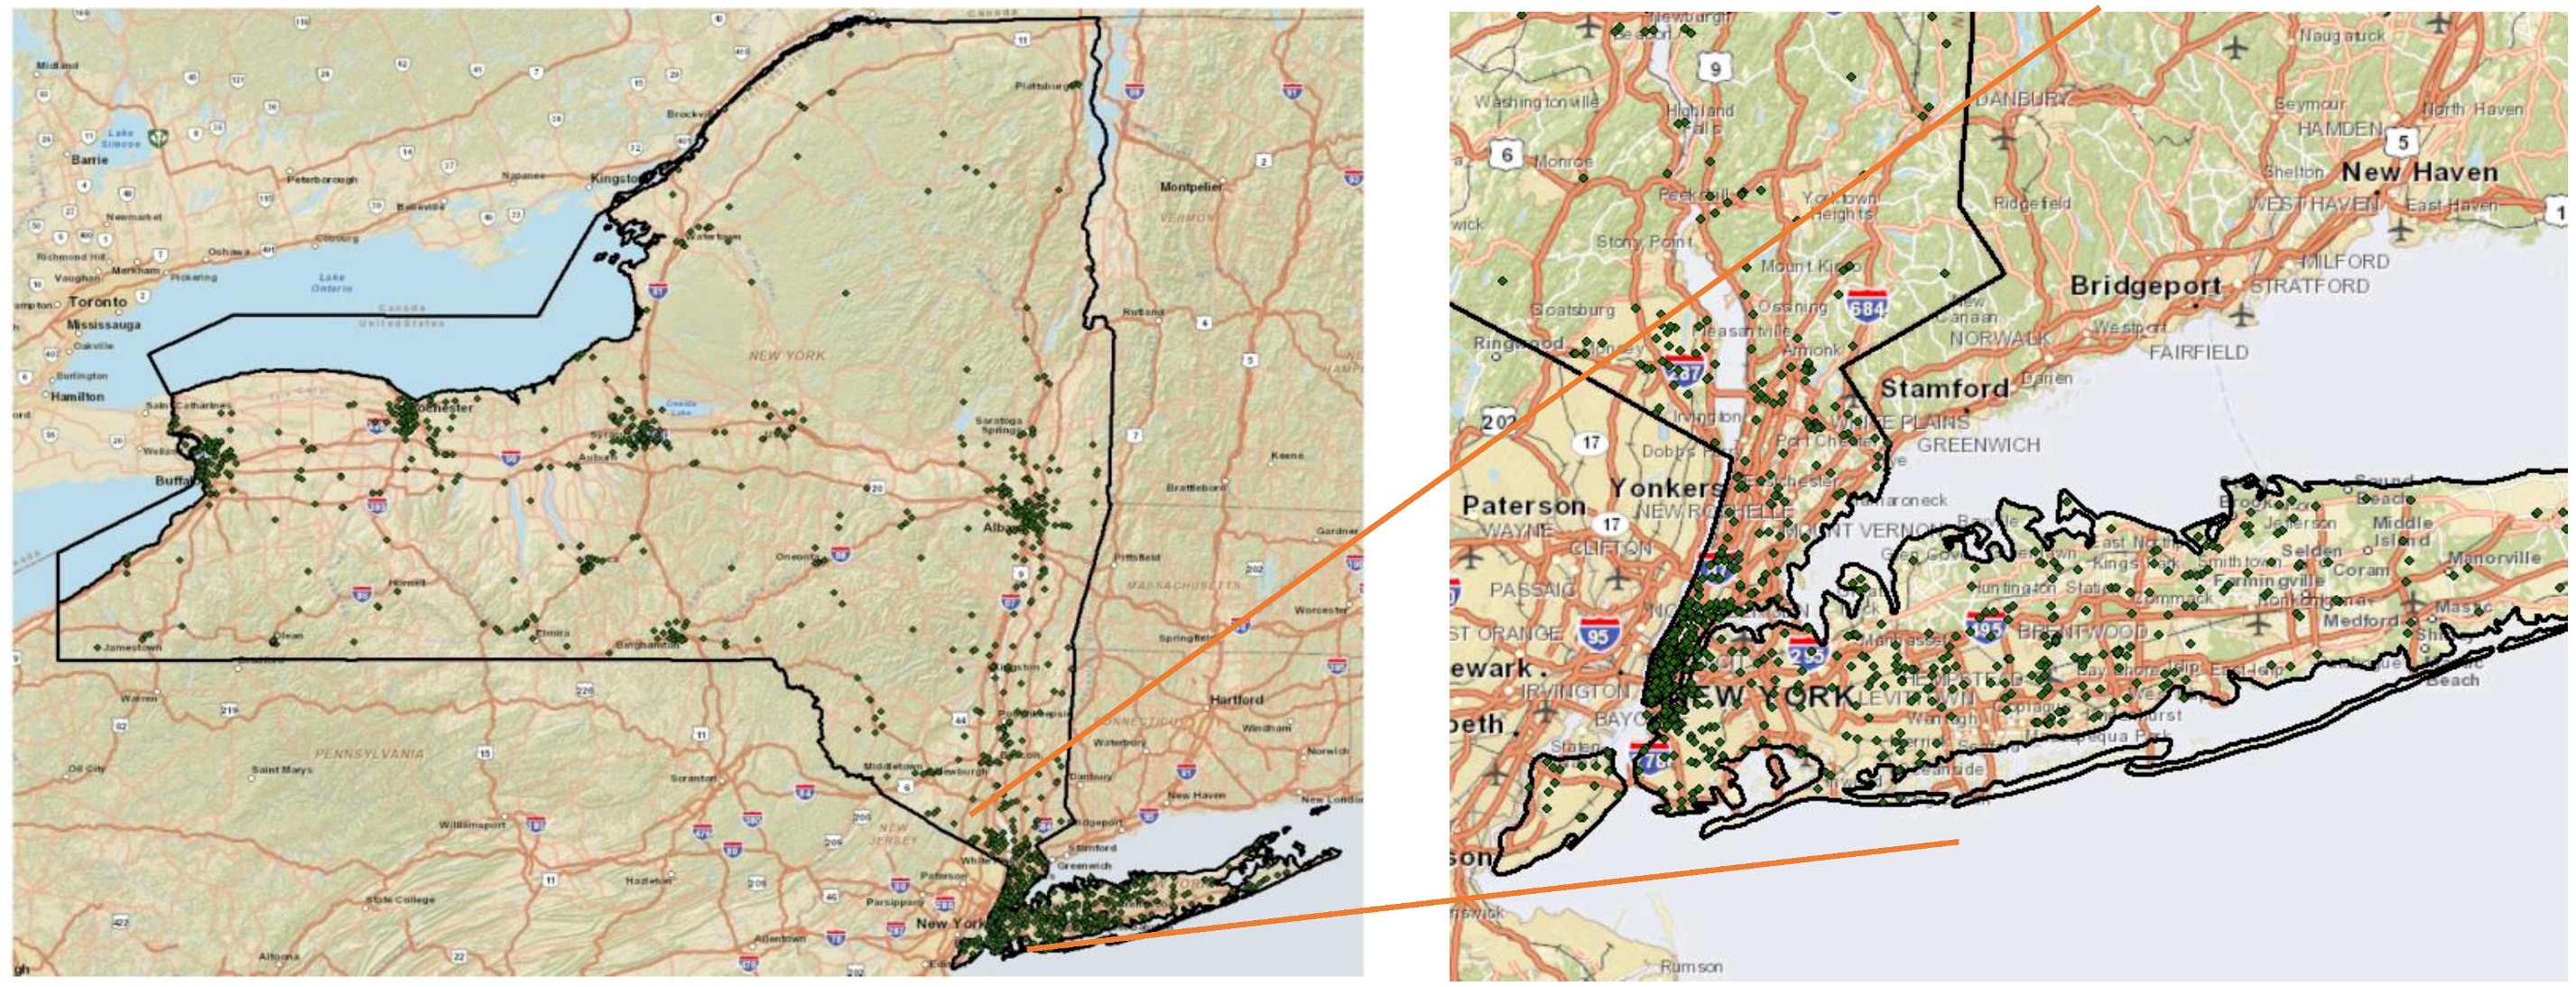
Figure 1 and
Figure 2 show the geographic distributions of green buildings in NY and AZ, reflecting the existence of green-building clusters. Clusters of commercial buildings are different from peer effects. To avoid the confusion between building clusters and peer effects, we conduct zip code-level analysis and the dependent variable is the share of commercial buildings in a zip code that were previously non-green buildings and applied for a green certificate in year
t. In addition
Figure 1 and
Figure 2 potentially reflect the existence of spatial correlation. Our finding of peer effects can be one reason for the existence of spatial correlation within a zip code. Our definition of a peer group is a zip code. One limitation of this definition is that we do not estimate the peer effects among adjacent buildings that are located in two separate zip codes.
3. Results
Table 2 and
Table 3 report the estimation results of first differences models (FD) and first differences model with mean-differenced zip code fixed effects (FD_MD). Due to data availability,
Xzt is cross-sectional and does not vary over time so, to be more accurate,
Xzt should be
Xz in Equations (4)–(6). As a result the coefficients of
Xz will be omitted using fixed effects regressions. In order to test the influence of
Xz, we also ran a random effects model, including generalized least square random effects (RE GLS) and maximum likelihood random effects (ML RE), as well as a between effects (BE) model. Due to their more stringent assumptions, results of the random effects and between effects models are listed in
Appendix A and the main discussion of the results are focused on the FD and FD_MD models. The standard errors are clustered at the zip code level.
Table 2 lists the results for NY and
Table 3 lists those for AZ. Models 1–4 and Models 7–10 examine LEED certification while Models 5–6 and Models 11–12 examine Energy Star certification. In
Table 2,
Table 3,
Table 4 and
Table 5, the unit of β, the coefficient of the sum of green-certified buildings, is share/count. For example, if β = 0.0350, it means if there is one more number of green certified building in the zip code, the share of buildings that applied for green certification in year t will increase by 3.5 percentage points. In
Table 6, the unit of β is one. For example, if β = 0.781, it means that if the share of number of green certified building in the zip code increases by 10 percentage points, the share of buildings that applied for green certification in year t will increase by 7.81 percentage points. For
Table 7, β = 1.028 means that if the share of green certified building in the zip code increases by 10%, the share of buildings that applied for green certification in year t will increase by 10.28%.
The coefficients on the sum of green buildings in Equations (4)–(6) measure the peer effects. If these coefficients are positive and statistically significant, then peer effects likely exist in the decisions of commercial buildings to obtain green certificates.
Table 2 and
Table 3 show that these coefficients are all significantly positive, which imply that peer effects indeed influence firms’ decisions on green building certification and the results are robust to different estimation methods. Models 1 and 2 in
Table 3 show that the coefficients of existing number of LEED buildings in NY range from 0.03 to 0.04, indicating that every additional LEED building would increase the share of annual LEED applications or the probability of a commercial building applying for a LEED certificate by 3 to 4 percentage points. Similarly, Models 5 and 6 in
Table 2 imply that an additional Energy Star certificate would increase the probability of a commercial building in the same zip code applying for an Energy Star certificate in NY by about 1–2 percentage points. Models 7 and 8 in
Table 3 imply that an additional LEED certificate would increase the probability of a commercial building in the same zip code applying for a LEED certificate in AZ by 3–4 percentage points; Models 11 and 12 imply that an additional Energy Star certificate would increase the probability of a commercial building in the same zip code applying for an Energy Star certificate in AZ by about two percentage points.
Models 3–4 and 9–10 report the regression estimation results of Equation (6) that measures whether the change in the LEED rating systems in 2009 had an influence on peer effects. As discussed in
Section 2, the change or upgrade of the LEED rating systems in 2009 could have two opposite impacts on peer effects because on the one hand the premium enjoyed by LEED certificates obtained after 2009 could be higher while, on the other hand, greater difficulty (and, hence, cost) to certification can discourage potential applicants. In Models 3–4 and 9–10, the coefficients for the sum of LEED green buildings remain significantly positive and are stable across most specifications. The coefficients for the interaction term between the dummy variable of changing rating system in 2009 and sum of LEED green buildings are negative, suggesting that the impact of peer effects on the share of annual green building applications have decreased after changes to the rating system in 2009. The new rating system operates a stricter application process, thus making certification harder and more costly. Not surprisingly, firms make trade-offs between the benefits and costs of green certificates. According to Kahn et al. [
3], energy conservation from environmental friendly technological progress may be offset by the behavior response of commercial building occupants, which adds to the uncertainty of the benefit from green certificates. It is also possible that firms learn about the higher cost of post-2009 certification via peer effects as well. As a result, after 2009, impacts of peer effects on certification have been reduced.
We also run the models using office buildings only. The results are listed in
Table 4 and
Table 5. The results show that there are also statistically significant peer effects among office buildings and the magnitude is similar to that of the models using all building classes.
Appendix A shows the results of random effects and between effects model. The coefficients of average square footage per building are all significantly positive, indicating that the share of annual green building applications will go up as building size increases. The coefficients of total number of establishments are negative and statistically significant. An establishment is a separate business unit with a single physical location, for example, a manufacturing plant or a store. Within a zip code, if there are more factories and stores around, it is likely that the area already has a higher density of buildings so that fewer new green buildings would have been constructed. Compared with existing non-green buildings, new constructions are more likely to obtain green certificates because it is more costly and time consuming to retrofit an existing non-green building in order to make it green. Therefore, the share of annual green building applications would be lower in these areas with more business units.
5. Discussion
After correcting for self-selection and reflection problems, existence of causal peer effects on whether to apply for green certification is demonstrated by empirical evidence. As discussed earlier, peer effects could be a possible driver of applying for green building certificates through the following mechanisms: (1) peers’ decisions to get certified can reduce the perceived risk on economic returns; (2) peers getting green can impose a new norm in a neighborhood and, thus, buildings feel the pressure to conform; (3) green building knowledge spillovers such as how to apply for a green building certificate and where to find experts on relevant technologies; (4) increased competition in the rental markets or other business environment due to green certification; and (5) there is empirical evidence showing that when in peer groups, agents are more willing to take risks [
39]. Future empirical research is needed to identify these mechanisms and differentiate among them.
The empirical evidence of peer effects presented in this paper does have at least one caveat, and that is the fact that the empirical models utilized in this study do not include the monetary costs (either direct or shadow) associated with obtaining green certification. Given that it is possible that the cumulative adoption level is correlated with these costs, and buildings within the same neighborhood probably face similar costs for green certification, omitting such costs might induce an overestimation of peer-effects. While acknowledging this as a potential drawback to the findings, it should also be noted that certification costs, assuming that buildings in a neighborhood face similar costs, can be viewed as another unobservable character faced by all buildings. Additionally, as discussed in
Section 2.1, this paper also adopts a common approach to eliminate unobservable characteristics by including fixed effects in the panel analysis. Hence, although such a method is not perfect, the omission of certification costs might not be as severe a drawback as it first appears.
The implication of the existence of peer effects for policy makers is that, in order to promote the diffusion of green buildings effectively, establishing early adopters or demonstration projects is important, because these early adopters can pressure their peers to follow the trend. Bollinger [
40] shows that demonstration sites have positive effects on the adoption of green technologies. Through various policy instruments such as tax credits, early adopters of green certificates can be established. As peer effects take hold, government can gradually phase out or reduce subsidies, while the number of adopters of green buildings can still increase. The implication for green-building-related business or professionals is the following: when marketing to commercial buildings and business owners about obtaining green certificates, emphasizing peers’ choice is important in the communication. Another implication for both policy-makers and industry is that hosting any information provision programs, such as green-building-related industry meetings, will help increase the word-of-mouth impact among building decision-makers, an important channel for peer effects to take place, which ultimately can increase the adopters of green certificates.
6. Conclusions
This paper adds to the existing literature by examining peer effects in the adoption of green certificates by commercial buildings. This paper exploits a rich panel dataset and the fact that there is a lag between the application submission and approval to correct for the self-selection and reflection issues often present in the identification of causal peer effects. Empirical results show that an additional approved LEED certificate within a zip code will increase the probability of a commercial building in the same zip code to apply for a LEED certificate by 3–4 percentage points in NY and AZ; an additional approved Energy Star certificate within a zip code will increase the probability of a commercial building in the same zip code to apply for an Energy Star certificate by 1–2 percentage points in NY and AZ. In addition, the magnitude of peer effects decreases after 2009 when LEED systems started to impose more stringent standards, suggesting that perhaps through communication with their peers, commercial buildings learned that it has become more difficult and costly to obtain LEED certification after the change in 2009. Given that NY is one of the largest states in terms of commercial buildings (both in types and in quantity) and that AZ’s unique weather pattern increases the potential benefits of green certification, empirical results from this study are highly relevant given that it focuses on the two states that are more likely to be impacted by green-certification diffusion. That said, generalizing the results to states dissimilar to NY and AZ should always be performed with caution.
The magnitude of the peer effects found in this study is relatively significant in the diffusion given that the base share of green buildings is low. This study only shows that there is empirical evidence confirming the existence of peer effects among commercial building decision-makers when it comes to green-certifications, but the evidence does not reveal the exact mechanism via which peer effects come into existence, thus limiting our ability to make policy recommendations to enhance peer effects. Such questions are reserved for future research.


