1. Introduction
A concrete artificial side (AS) at a gob-side entry (GSE) is an important part for GSE retaining. The long-term stability of the concrete AS is a key issue for successful mining practice [
1,
2]. However, the long-term stability of AS can be affected by the state of stress and deformation characteristics. The AS has to experience mining-induced influences and long-term creep deformation (1–2 years), which can easily lead to stress or deformation failure. If the stress and deformation cannot be controlled effectively, the AS will be destabilized, and the whole gob side entry will finally collapse. Therefore, studying the failure criteria and the stress variation of the AS is important for successful implementation of a GSE retaining. Based on a theoretical study, a failure criterion can be implemented in practical design, which will improve the recovery rate of coal resources and ensure working safety.
The behavior of a material can be defined with a strength criterion. The Tresca yield criterion [
3] can be used to define the behavior of an elastic material. When the maximum shear stress reaches a certain value, the Tresca material will yield and slide along the maximum shear stress direction. In the Mohr criterion [
4], the failure of a certain point in the material is mainly determined by the maximum principal stress and the minimum principal stress. The failure of a Mohr material is independent of the intermediate principal stress. The ultimate shear strength of the material is closely related to the cohesion and the internal friction angle in Coulomb criterion [
5]. These three representative strength criteria only consider the influence of normal stress in a shear stress plane. Thus, these strength criteria consider only the maximum and minimum principal stress, but not the intermediate principal stress, and are known as single shear strength theory.
Yu (1983) proposed a generalized twin shear strength theory that is appropriate for a material that has different strength in tension and compression [
6,
7,
8,
9]. The failure mode of the AS is affected by many factors [
10,
11,
12], especially dynamic load induced by blasting which can cause significant damage to AS. In this study, we determined the failure characteristics and the variation of shear stress of the concrete AS of the GSE, which were affected by the coal mining. To achieve this, a uniaxial compression failure experiment was conducted with large and small-scale specimens. The distribution characteristics of shear stress were obtained from a numerical simulation. Based on the results, a failure criterion was determined and implemented in a strengthening method for the artificial side.
2. Structural Model of the Artificial Side
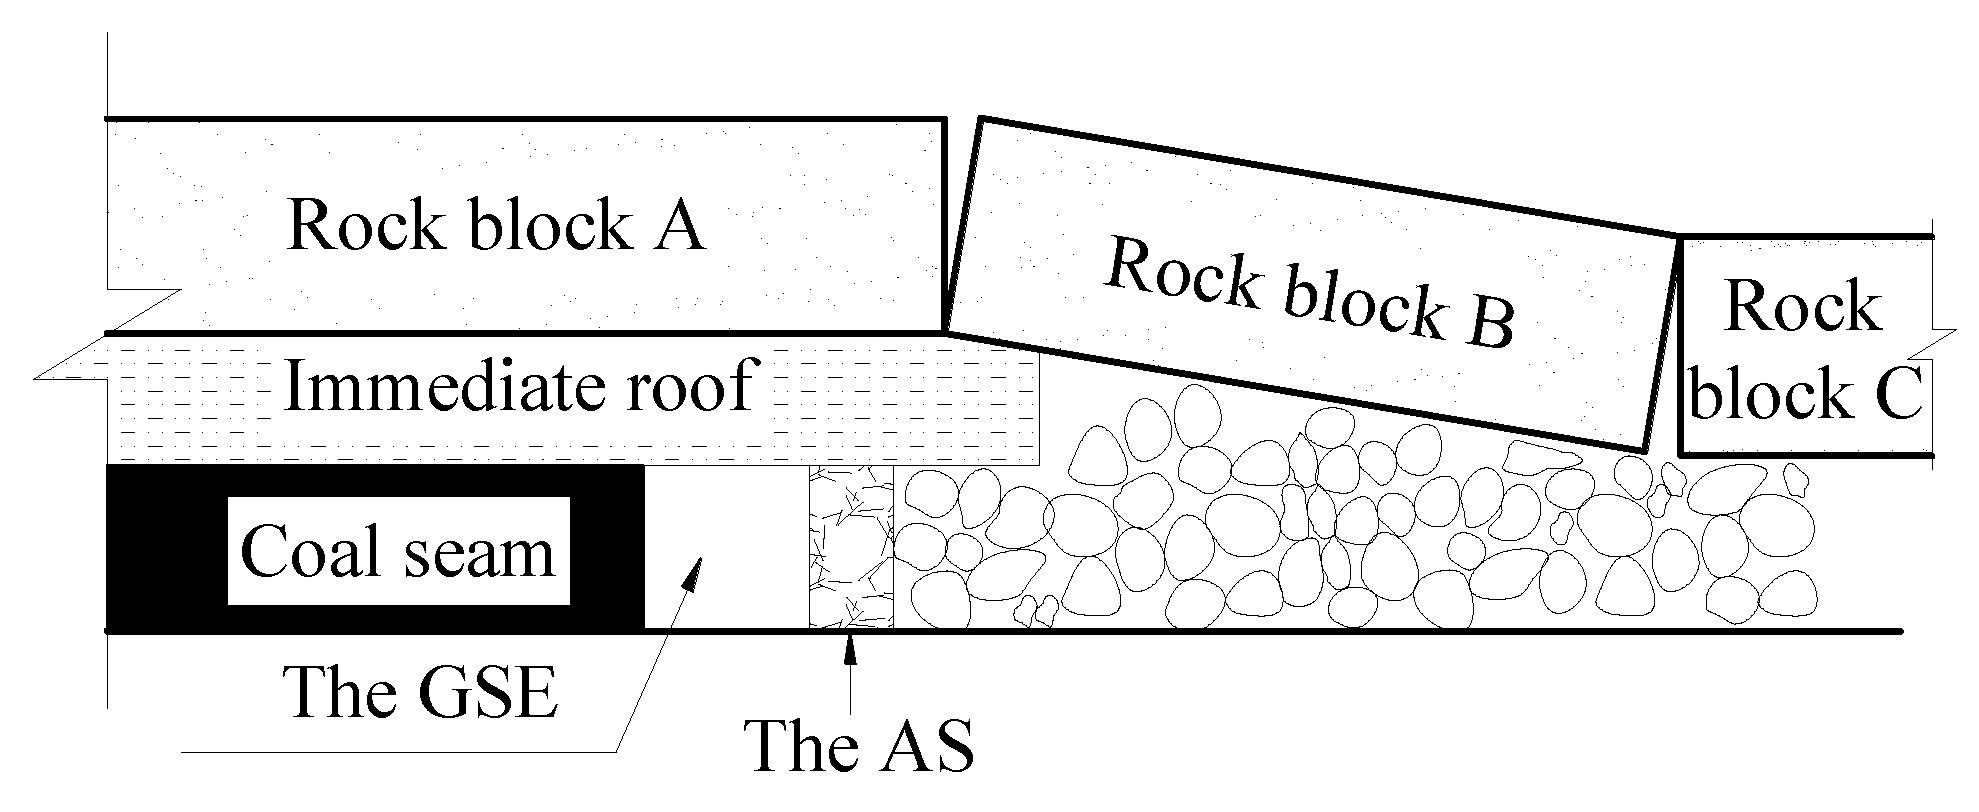
A schematic diagram of a GSE is presented in
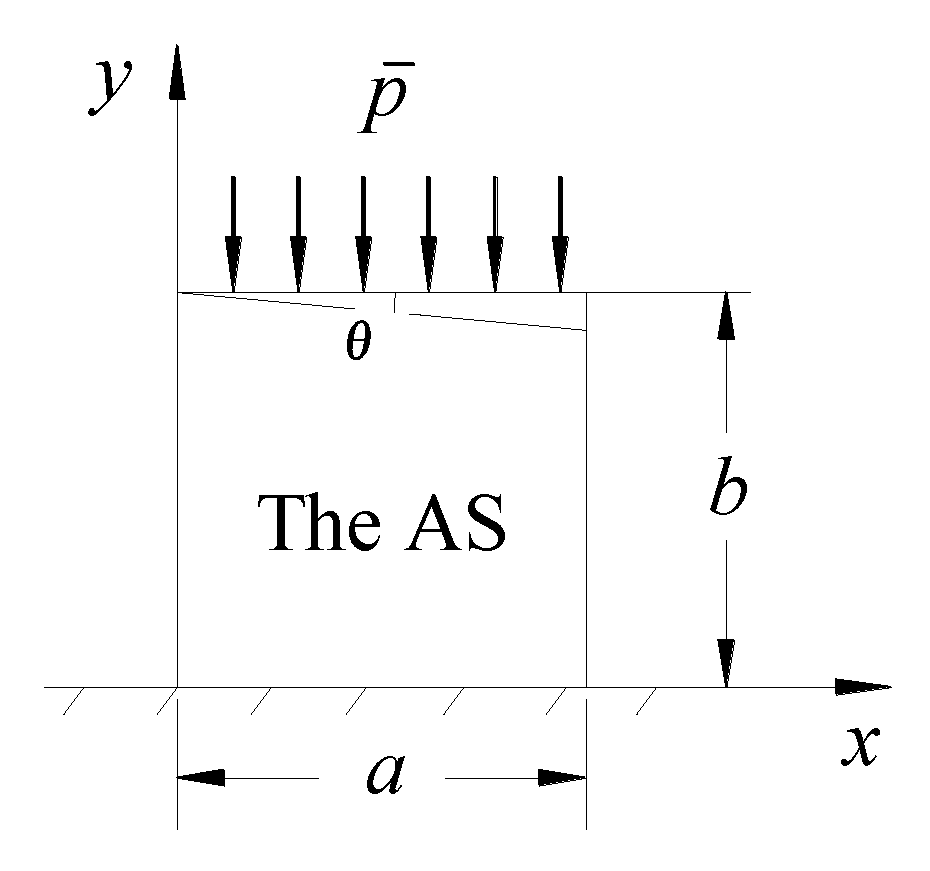
Figure 1. The immediate roof above the AS prevents ground movement and rock deformation induced by GSE formation. The stiffness of the main roof and immediate roof are assumed to be much greater than that of the AS and the rigid floor that supports it. Thus, deformation occurs at the upper boundary of the artificial side, and the vertical displacement at the lower boundary is ignorable. Based on these conditions, a structural model of the AS was established, as shown in
Figure 2.
During the entire service period, the AS experiences three stages [
1,
2]. The bearing load of the AS in the process of face mining can be classified into two parts: the dead weight of the immediate roof and main roof, and the additional load induced by rotation of the main roof [
13]. Thus, high abutment pressure develops behind the working face. The deformation of the AS increases due to the abutment pressure. The fracture on the AS induced by abutment pressure decreases its structural integrity and load-carrying capacity. Finally, the failure of the AS can cause overall structural instability of the GSE.
3. Failure Criterion of Artificial Side
3.1. Uniaxial Compression Failure Experiment
The mixture ratio of a specimen is determined according to the specifications for the mix proportion design of ordinary concrete (JGJ 55-2011) [
14], as shown in
Table 1. In the process of mixing, the amounts of the various materials need to be adjusted based on the moisture content of the sand and the particle size of the pebbles.
Based on
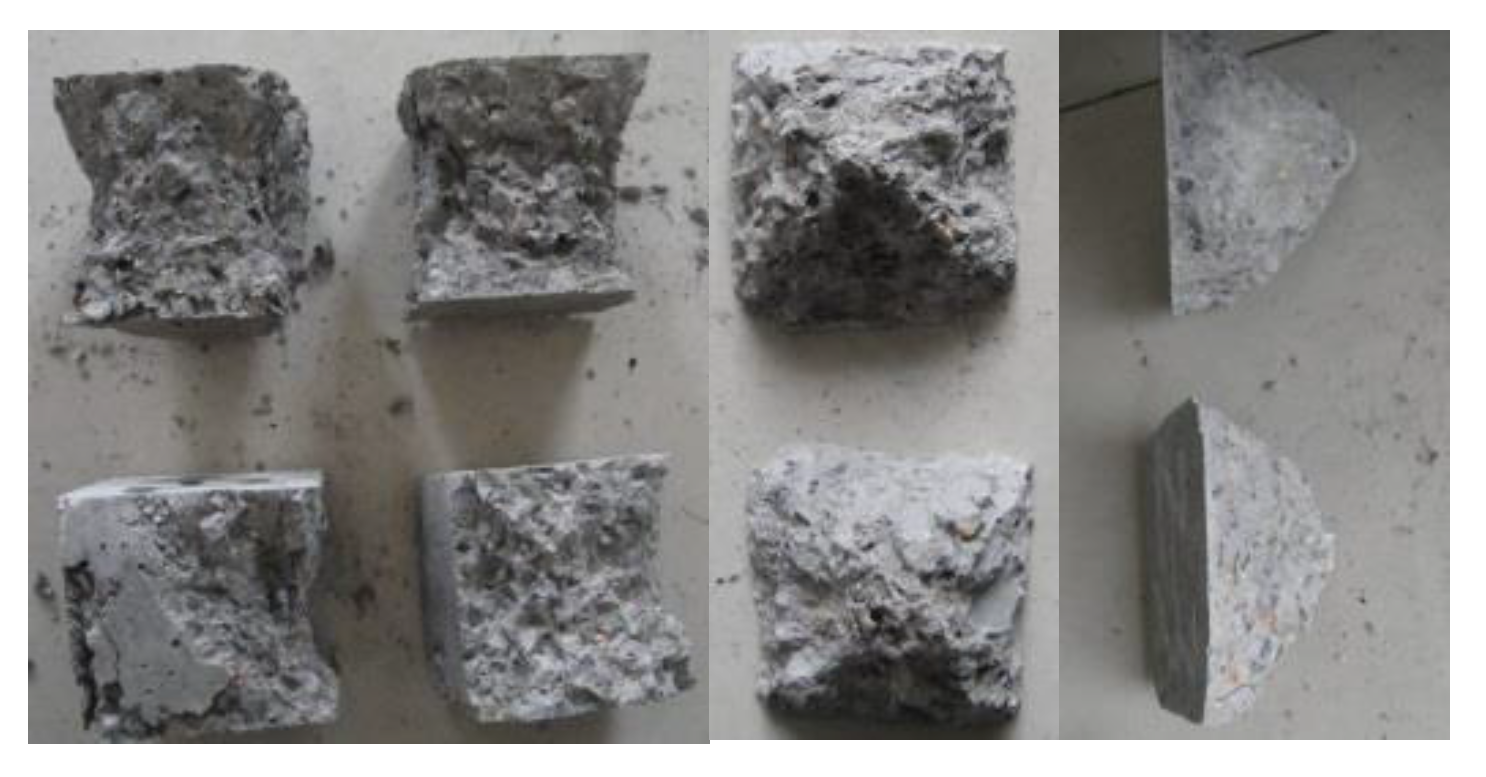
Table 1, small and large specimens were fabricated. The small specimen was 70 mm × 70 mm × 70 mm, and the large specimen was 1500 mm × 600 mm × 900 mm (length × width × height, respectively). The specimens were moist cured to delay shrinkage for 28 days. One-time-concreting shaping technology was applied to cast the large specimen. The fabricated specimens are shown in
Figure 3.
The uniaxial compression failure experiment was conducted with the custom-built large-scale experimental system shown in
Figure 4 for the large-scale specimen. This system can be used to characterize the behavior of large-scale coal and rock under high loading conditions. The maximum size of a specimen is 1500 mm × 600 mm × 900 mm. The maximum pressure is 20 MPa, and the strain gauges have a strain measurement accuracy of one micro strain. For small-scale specimens, the experiment was conducted with a computer-controlled electronic universal testing machine.
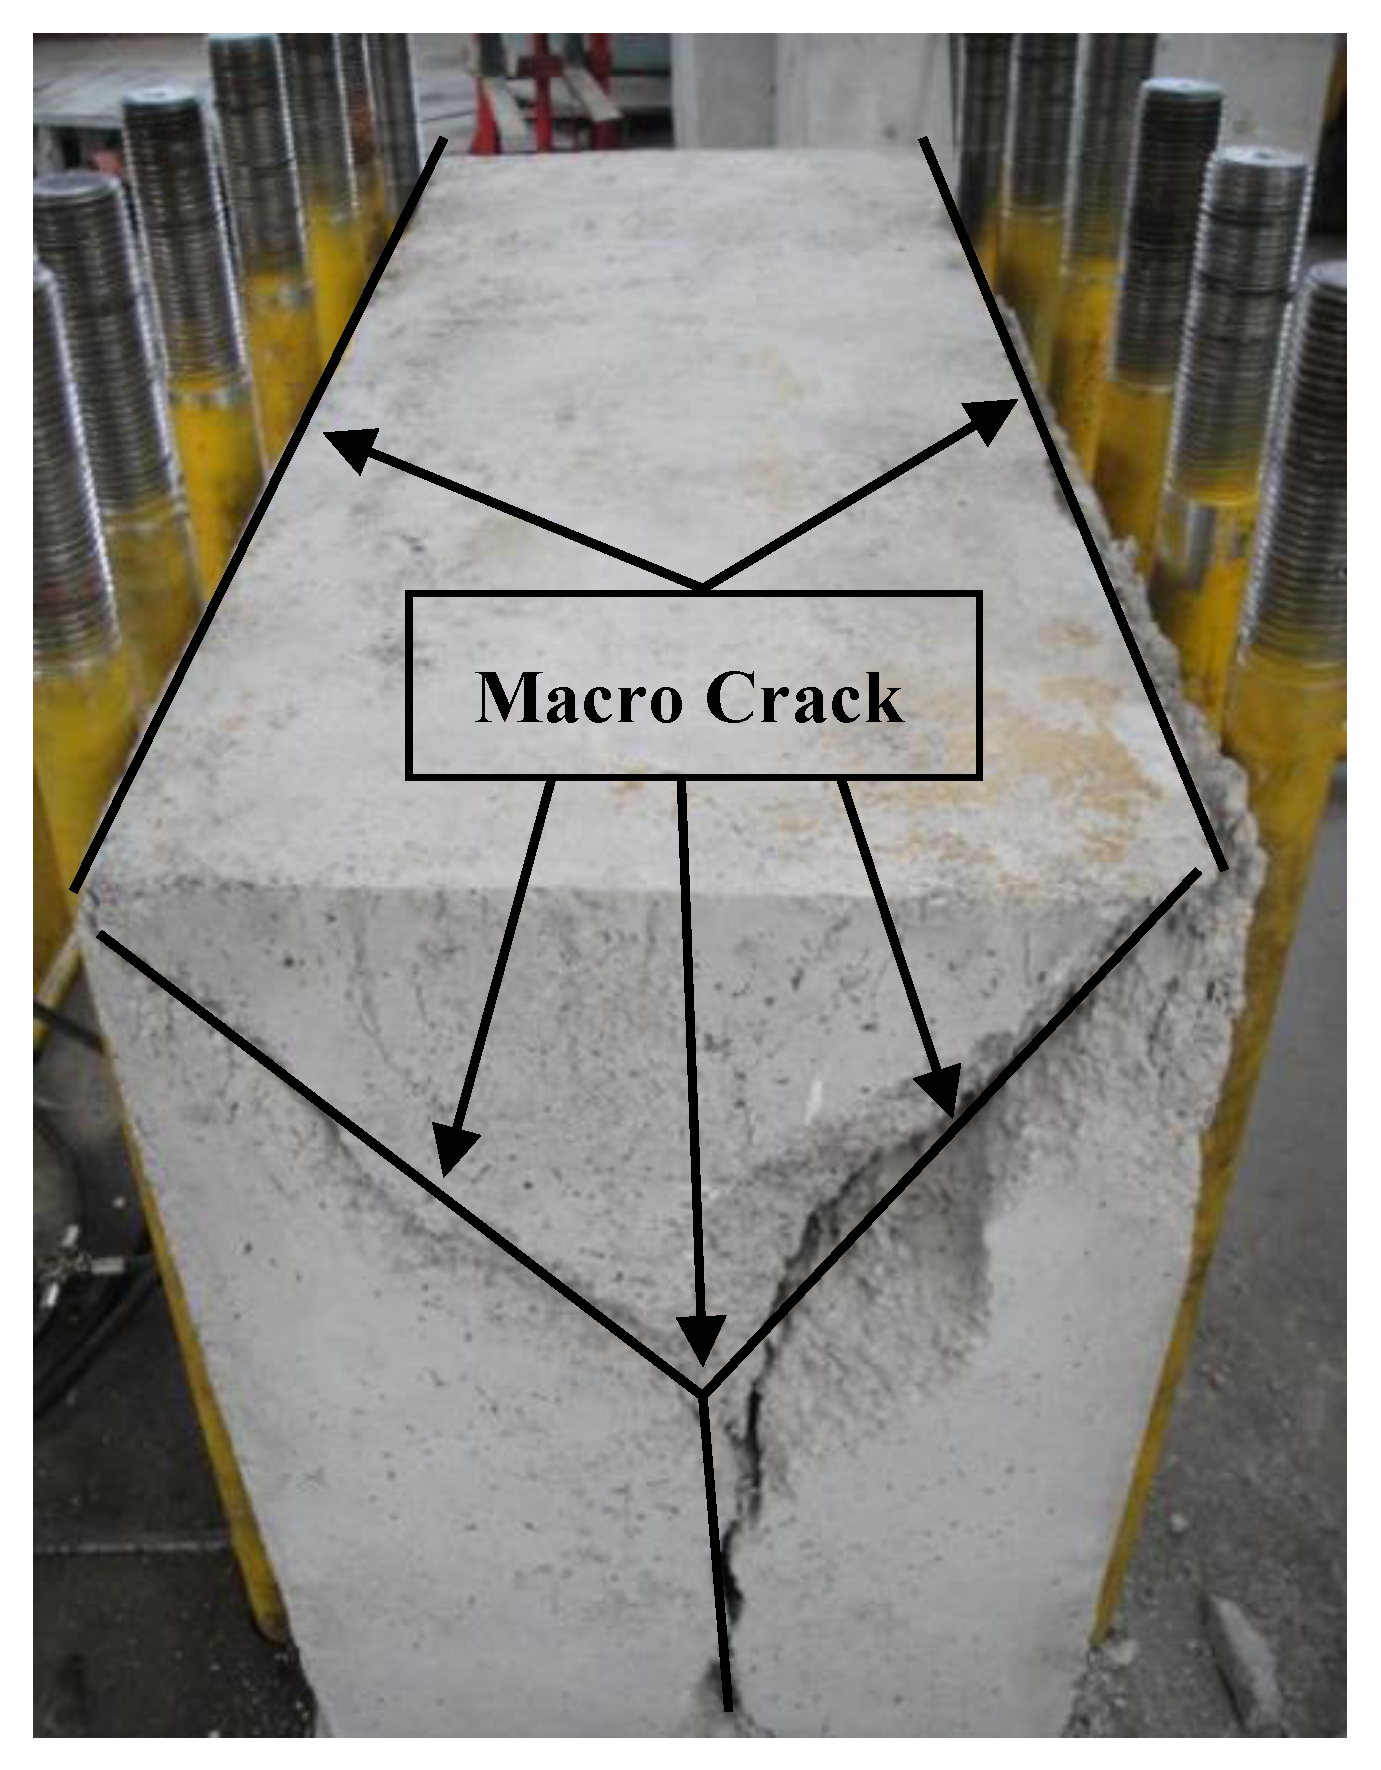
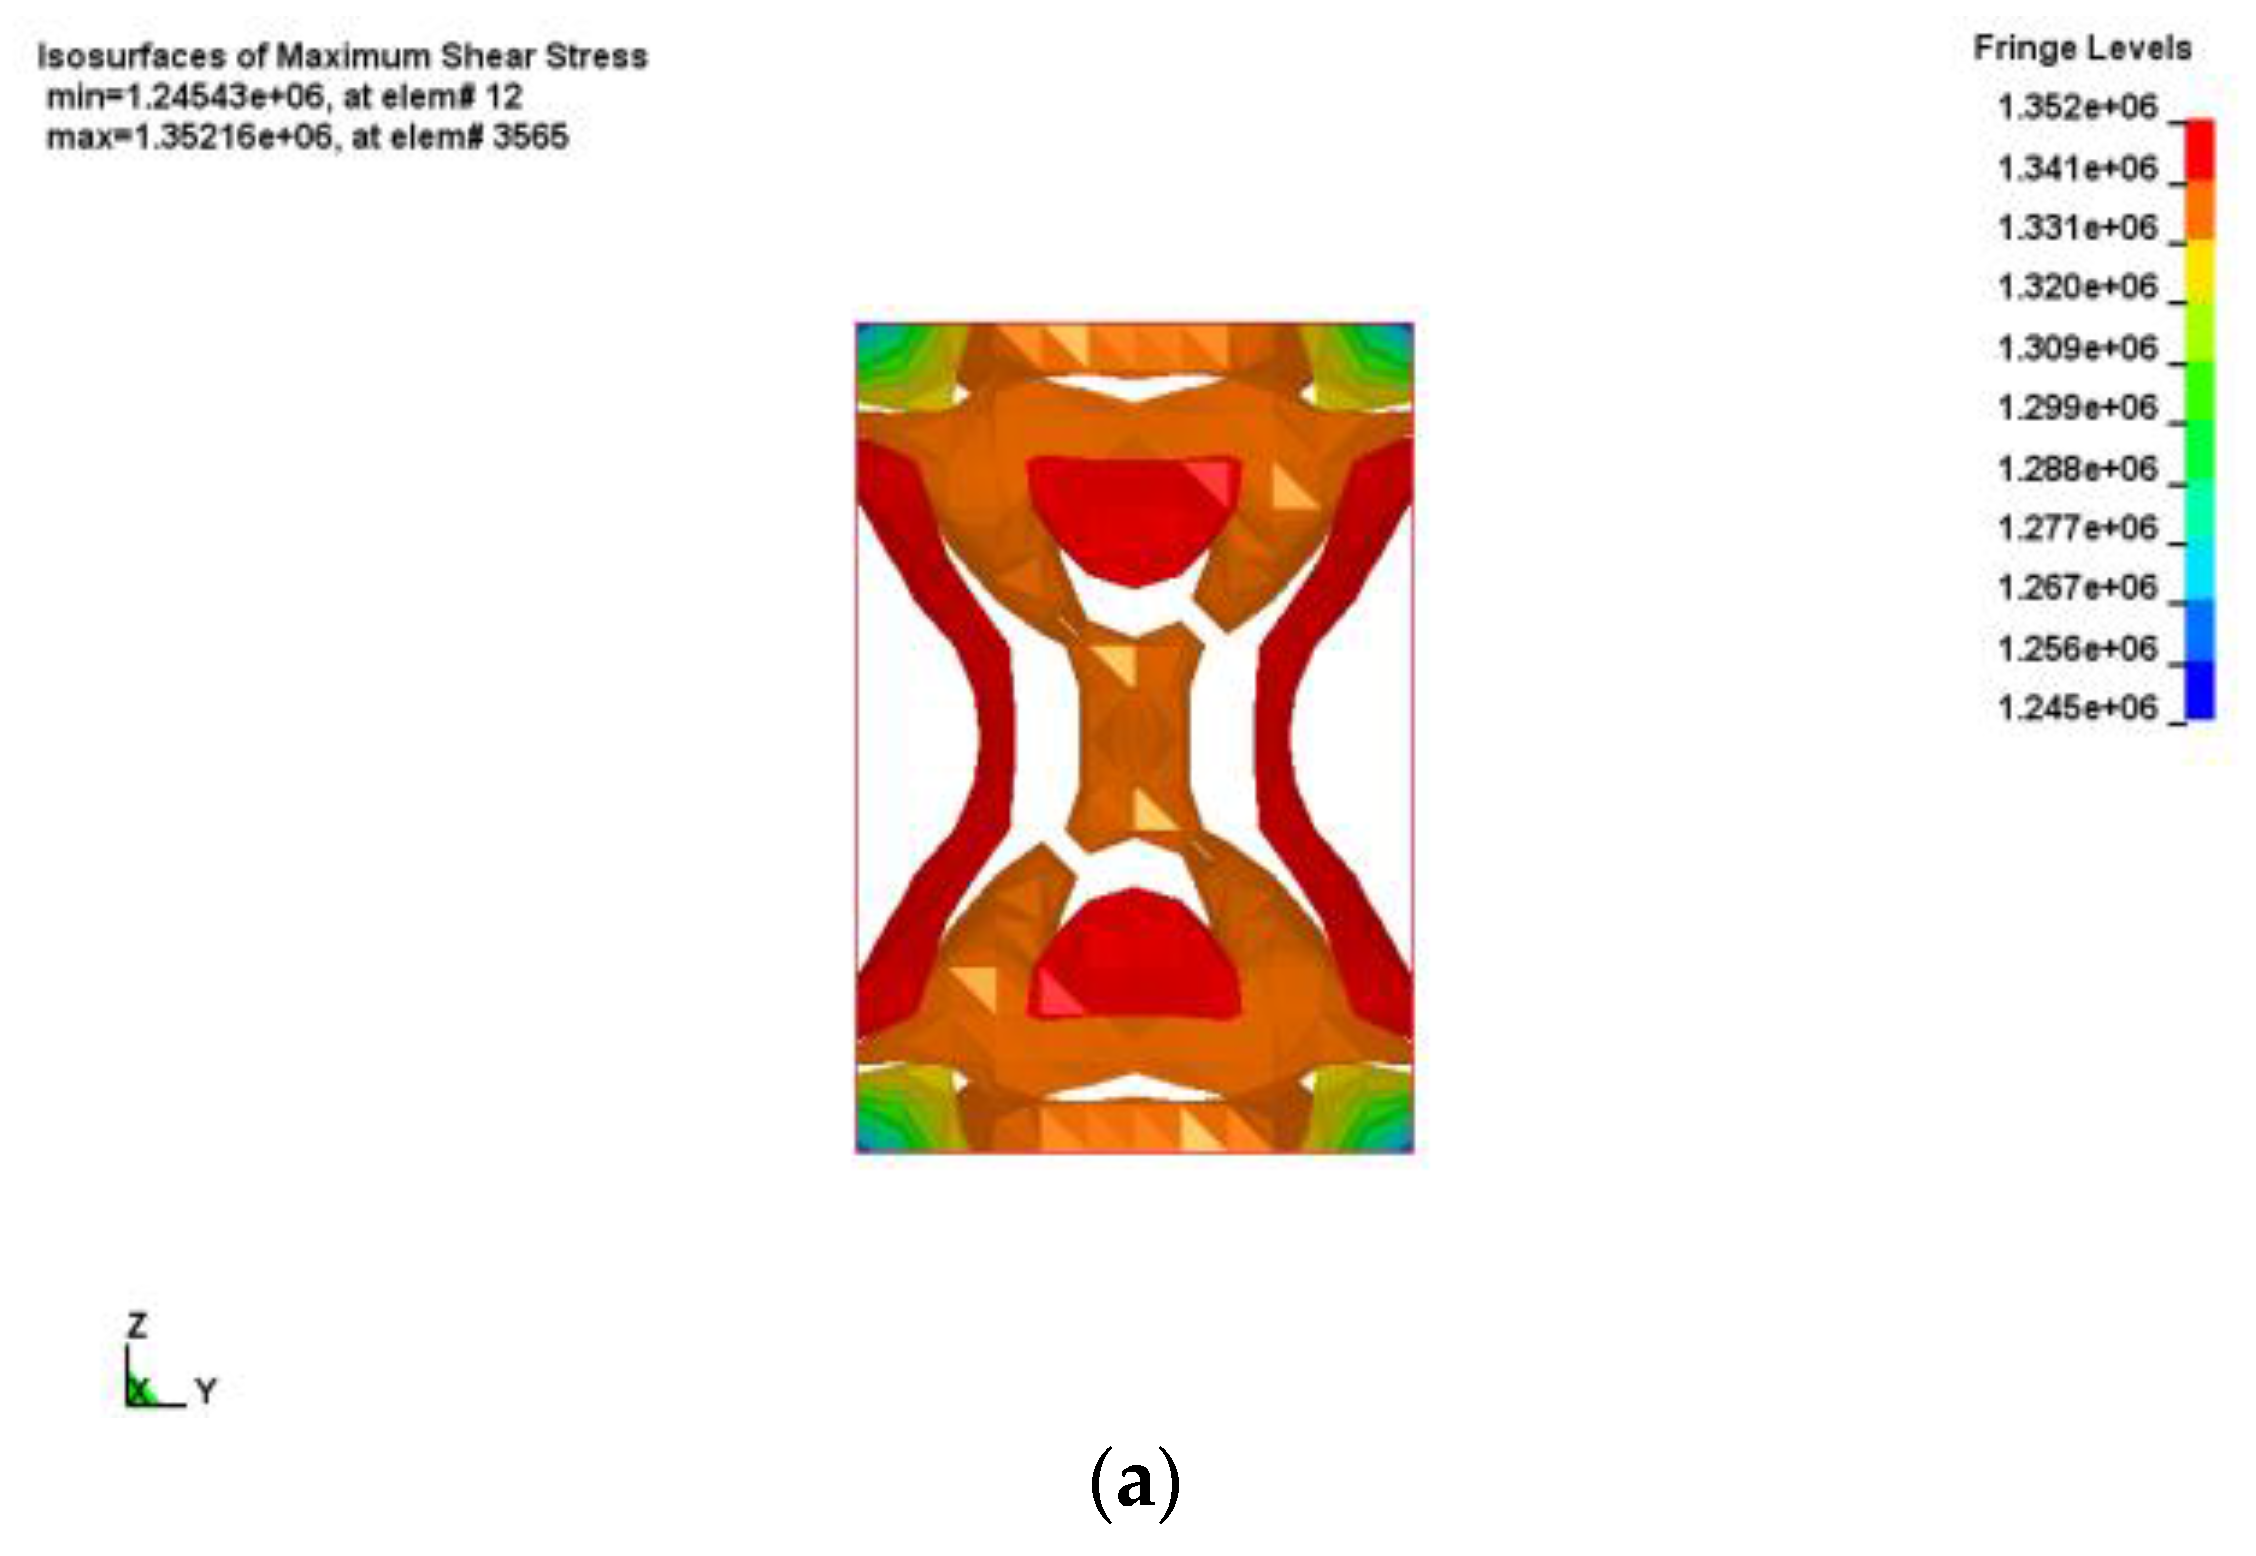
Figure 5 and
Figure 6 present the failure pattern of a concrete AS for different specimen sizes. An X-shaped failure pattern was found in the small-scale specimens. The angle between the failure plane and the upper and lower planes ranged from 48° to 56°, as shown in
Figure 5. The failure pattern of the large-scale specimen also appeared X-shaped, as shown in
Figure 6. The AS showed brittle failure after transfixed fractures, and then it quickly lost its load-carrying capacity.
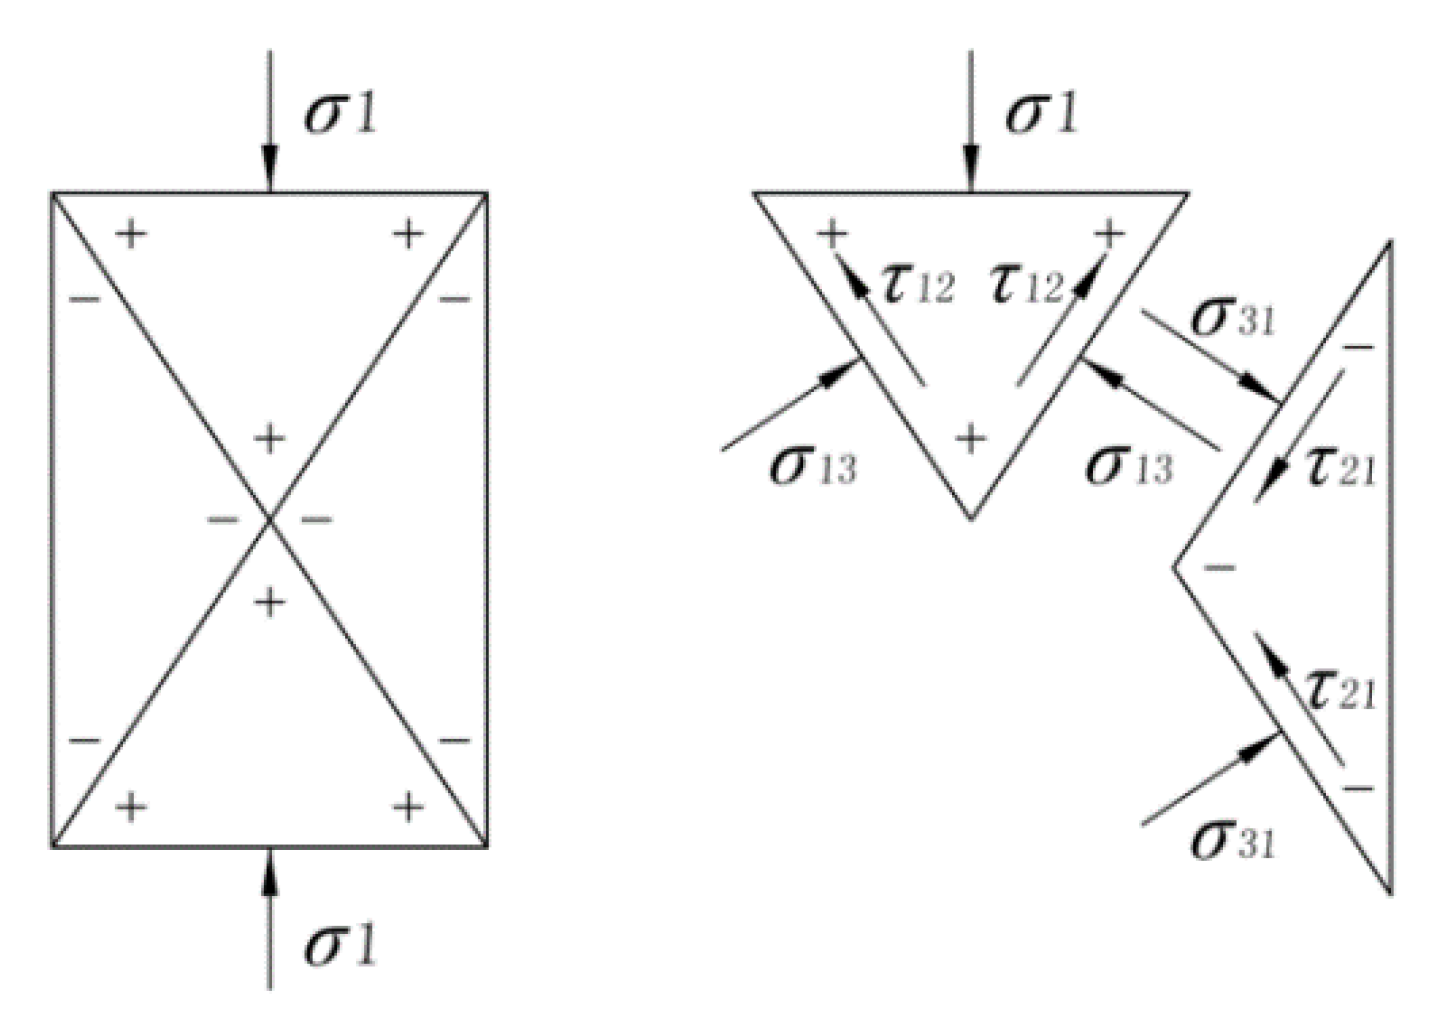
From
Figure 5 and
Figure 6, it can be seen that the failure pattern of the specimen appears X-shape regardless of specimen size. Unfortunately, it is hard to explain this failure pattern with one maximum shear stress (τ
13). It is clear that the X-shaped failure pattern results from two sets of shear stresses (τ
13 and τ
12), as shown in
Figure 7.
3.2. Distribution of the Maximum Shear Stress
An experiment can be conducted to characterize the failure mode. The variation and distribution of the maximum shear stress of a specimen cannot be monitored in the experiment, so numerical analysis was performed using the commercial nonlinear analysis software LS-DYNA. The Drucker-Prager criterion was adopted for the simulation of a specimen, and the mechanical parameters of constitutive model are presented in
Table 2. The simulation process was divided into 10 load steps, thus the 2 MPa of step load was imposed on top of the specimen until the axial deformation reached 3%. The boundary condition for the numerical model was identical to the experimental set up, and the four sides of the specimen were free to deform.
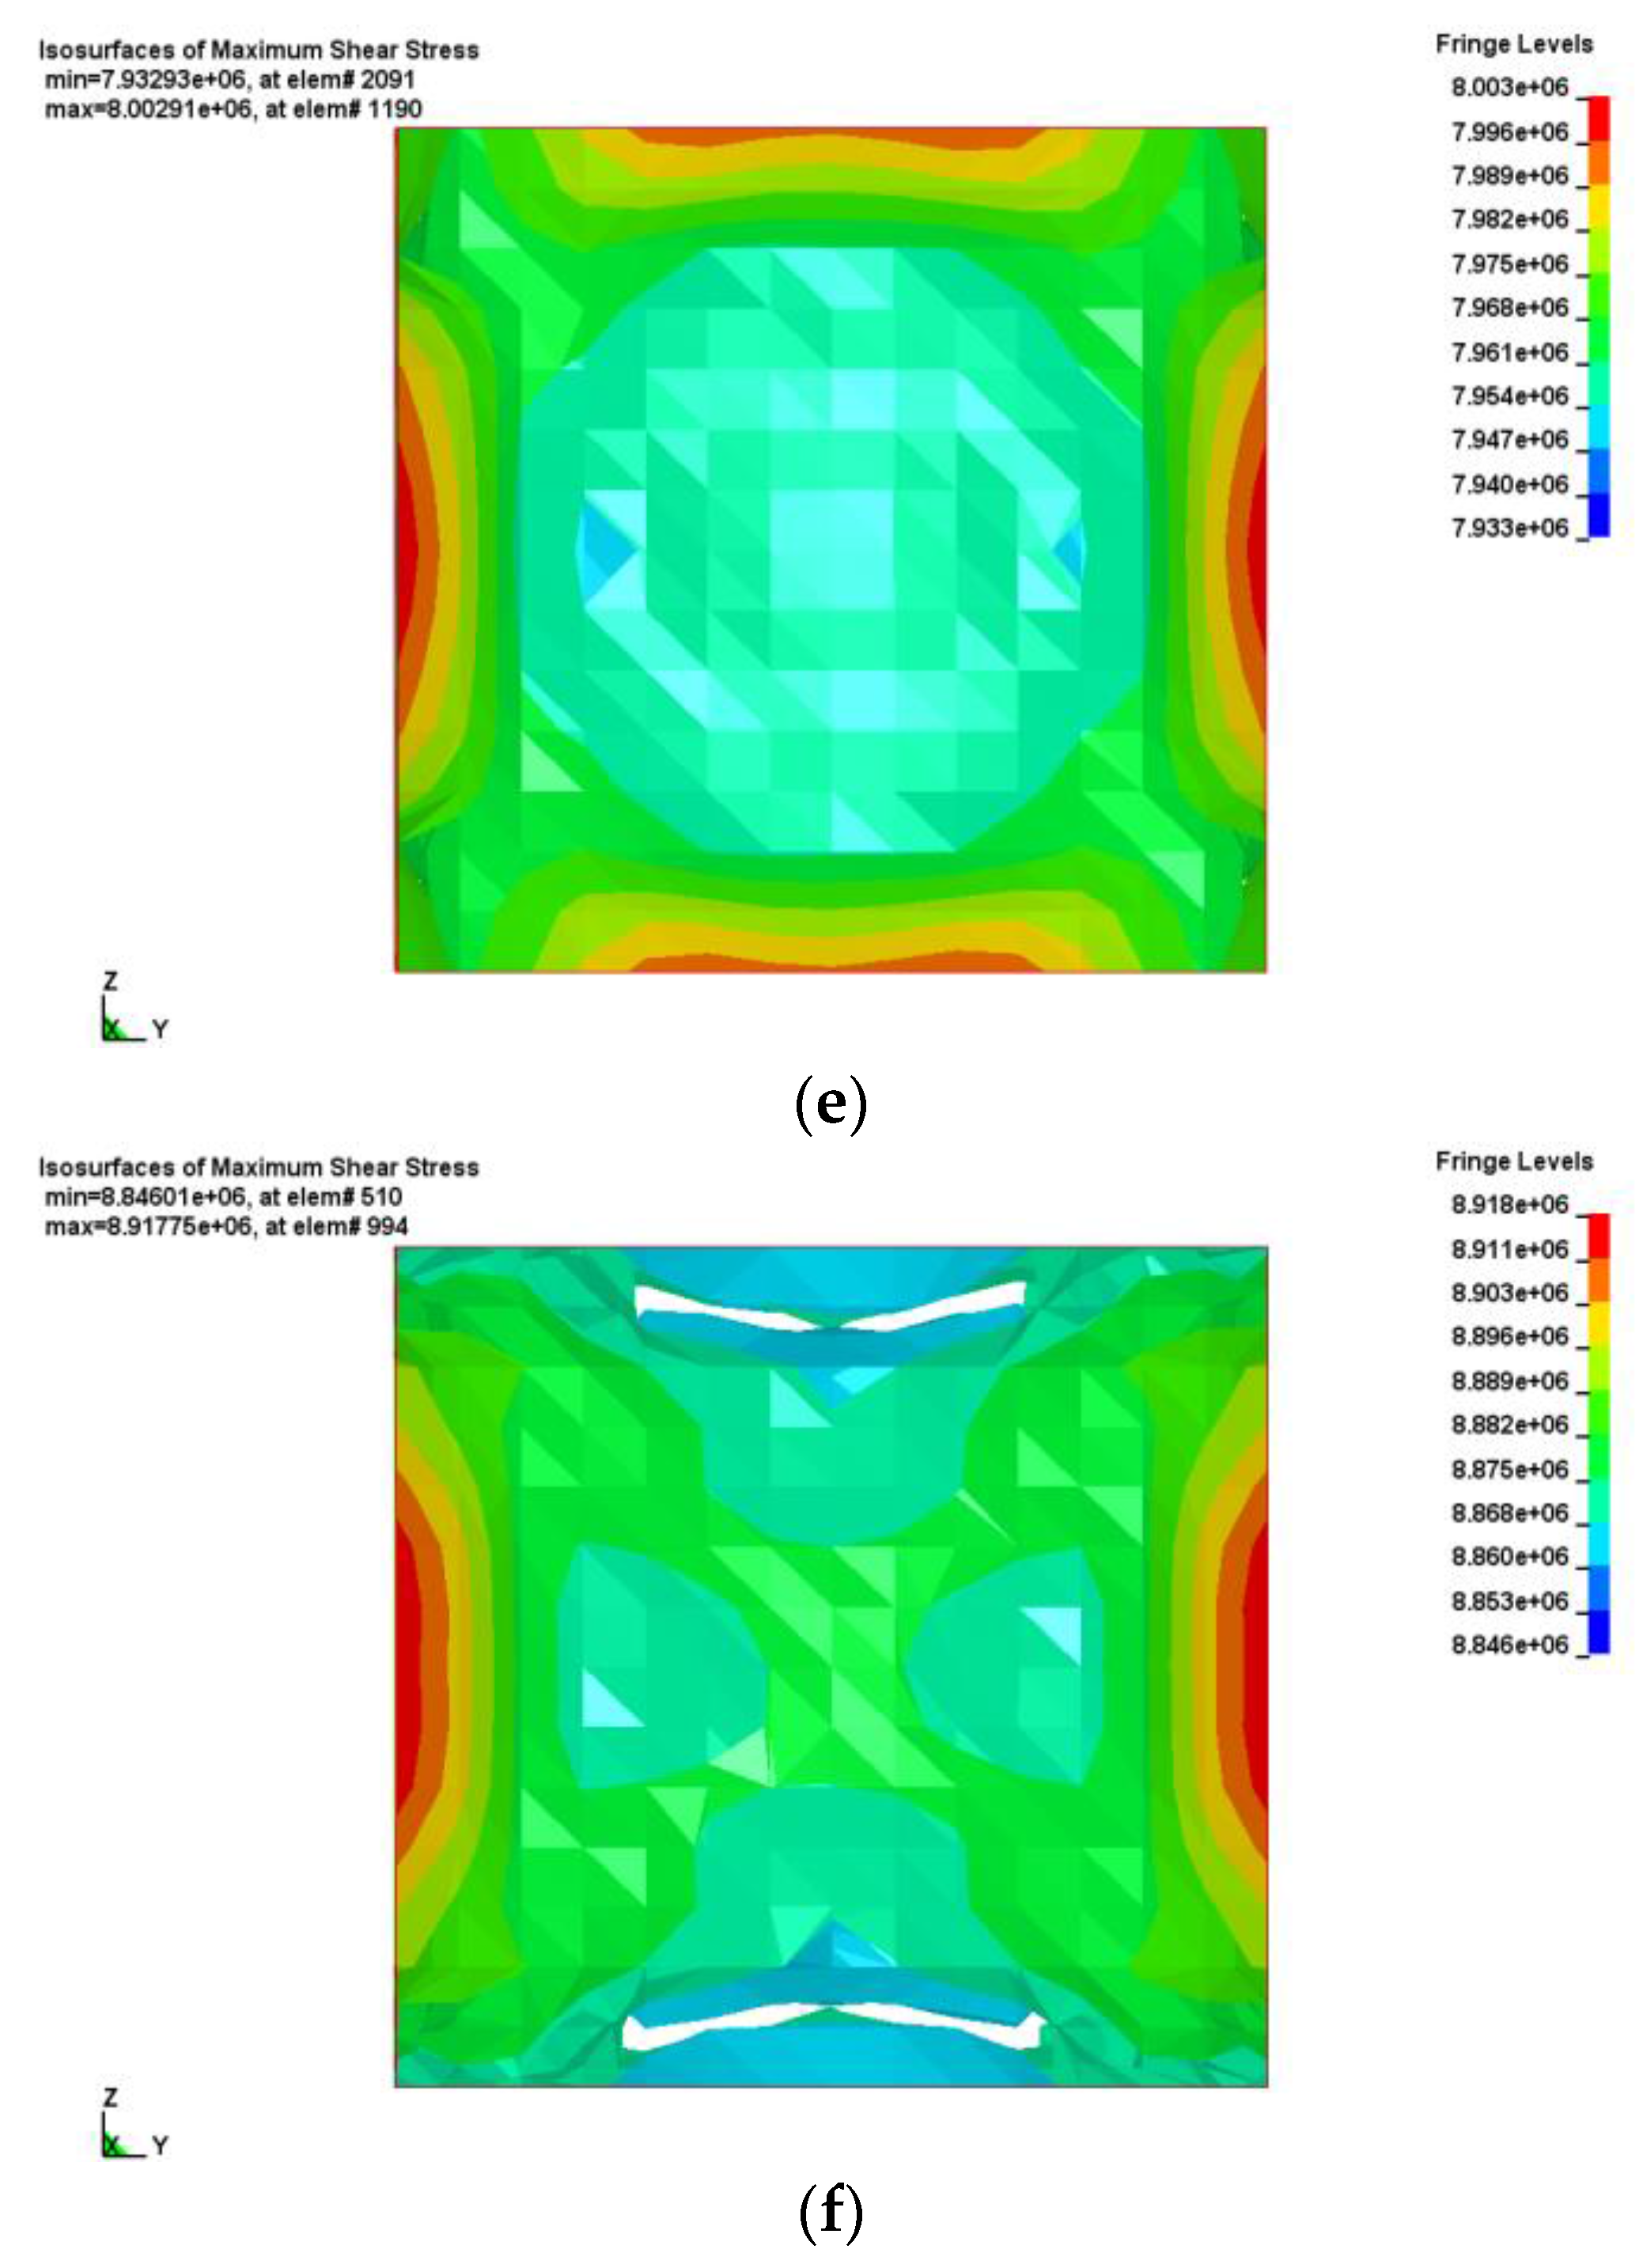
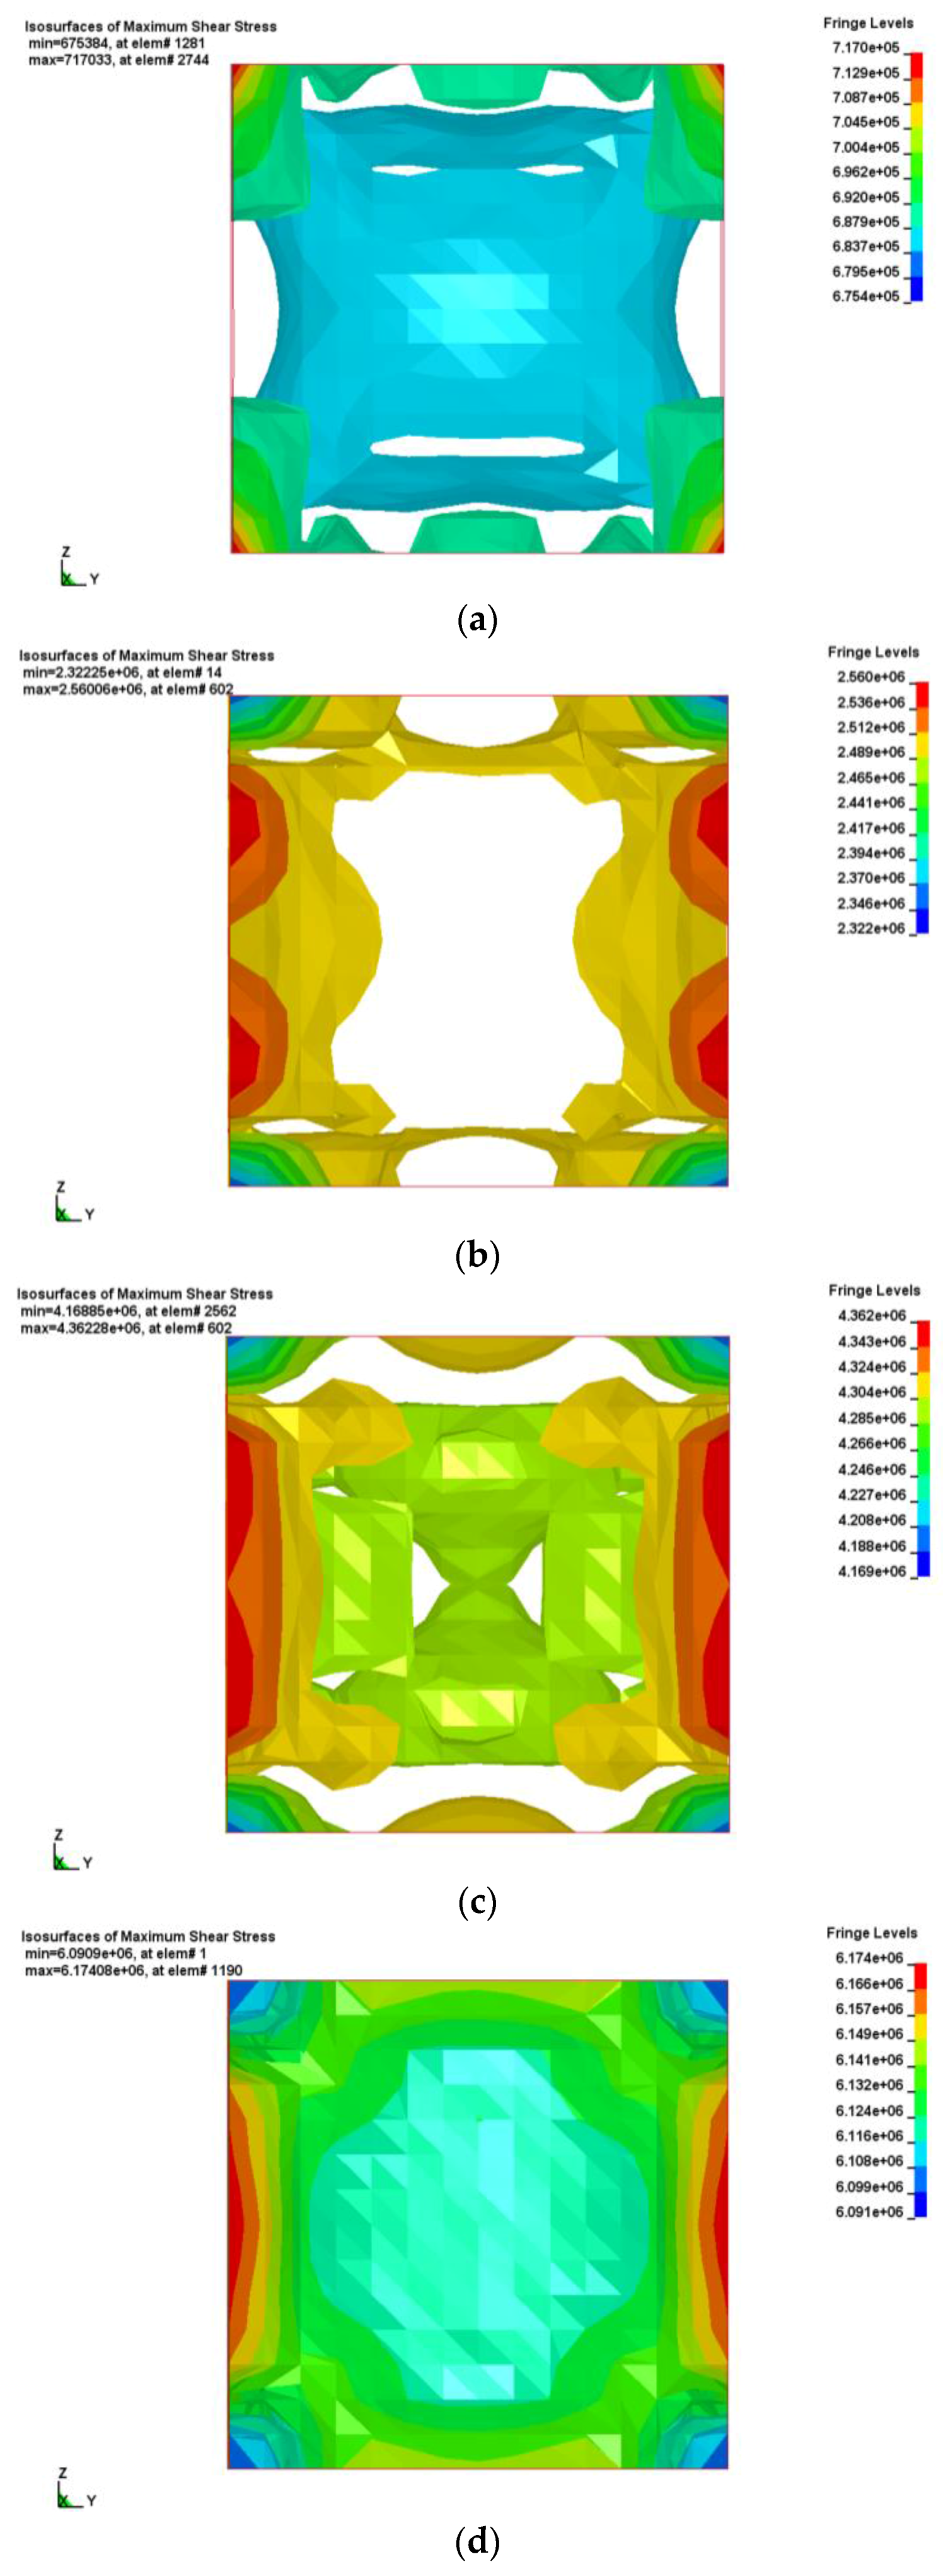
Figure 8 shows the variations of the maximum shear stress of the small specimen during a uniaxial compression failure experiment. A shallow maximum shear stress band appeared at upper and lower parts of the specimen in the initial stage of loading. As the load increased, the shear stress level increased at the center of the specimen. The shear stresses that started from the upper and lower parts of the specimen overlapped and formed the X-shaped maximum shear stress distribution shown in
Figure 8f. The distribution pattern of the maximum shear stress is basically consistent with the failure pattern of the small-scale specimen in
Figure 5. It can be concluded that the distribution pattern of the maximum shear stress determines the failure pattern of the small-scale specimen.
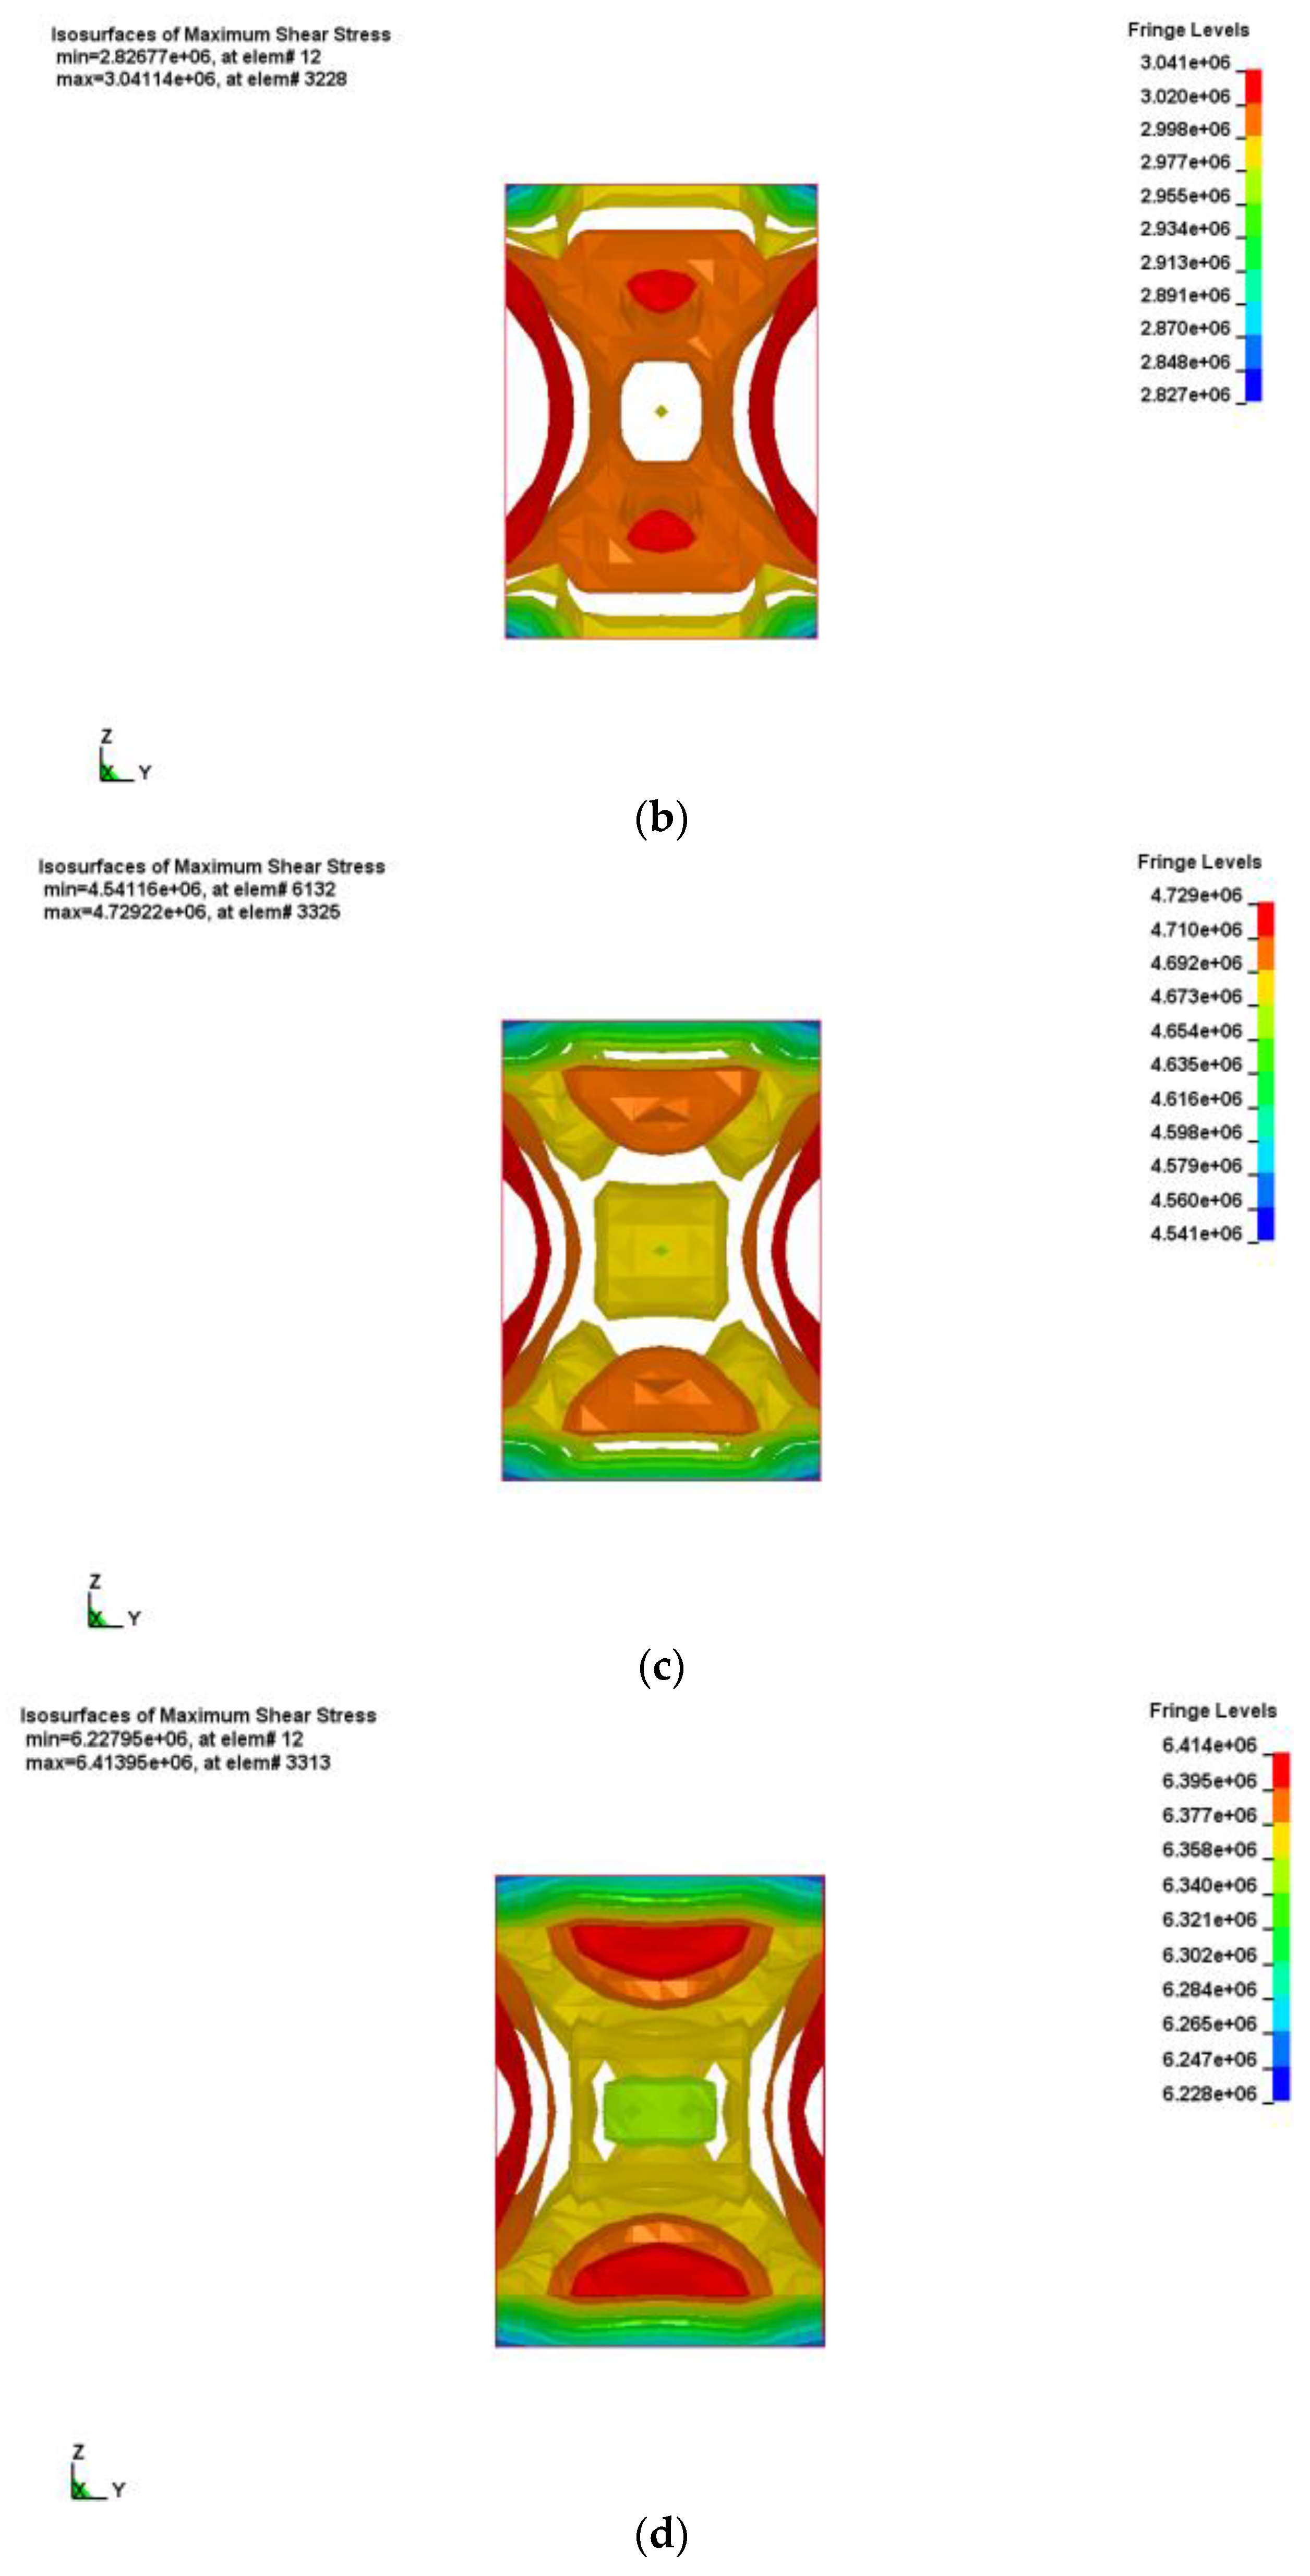
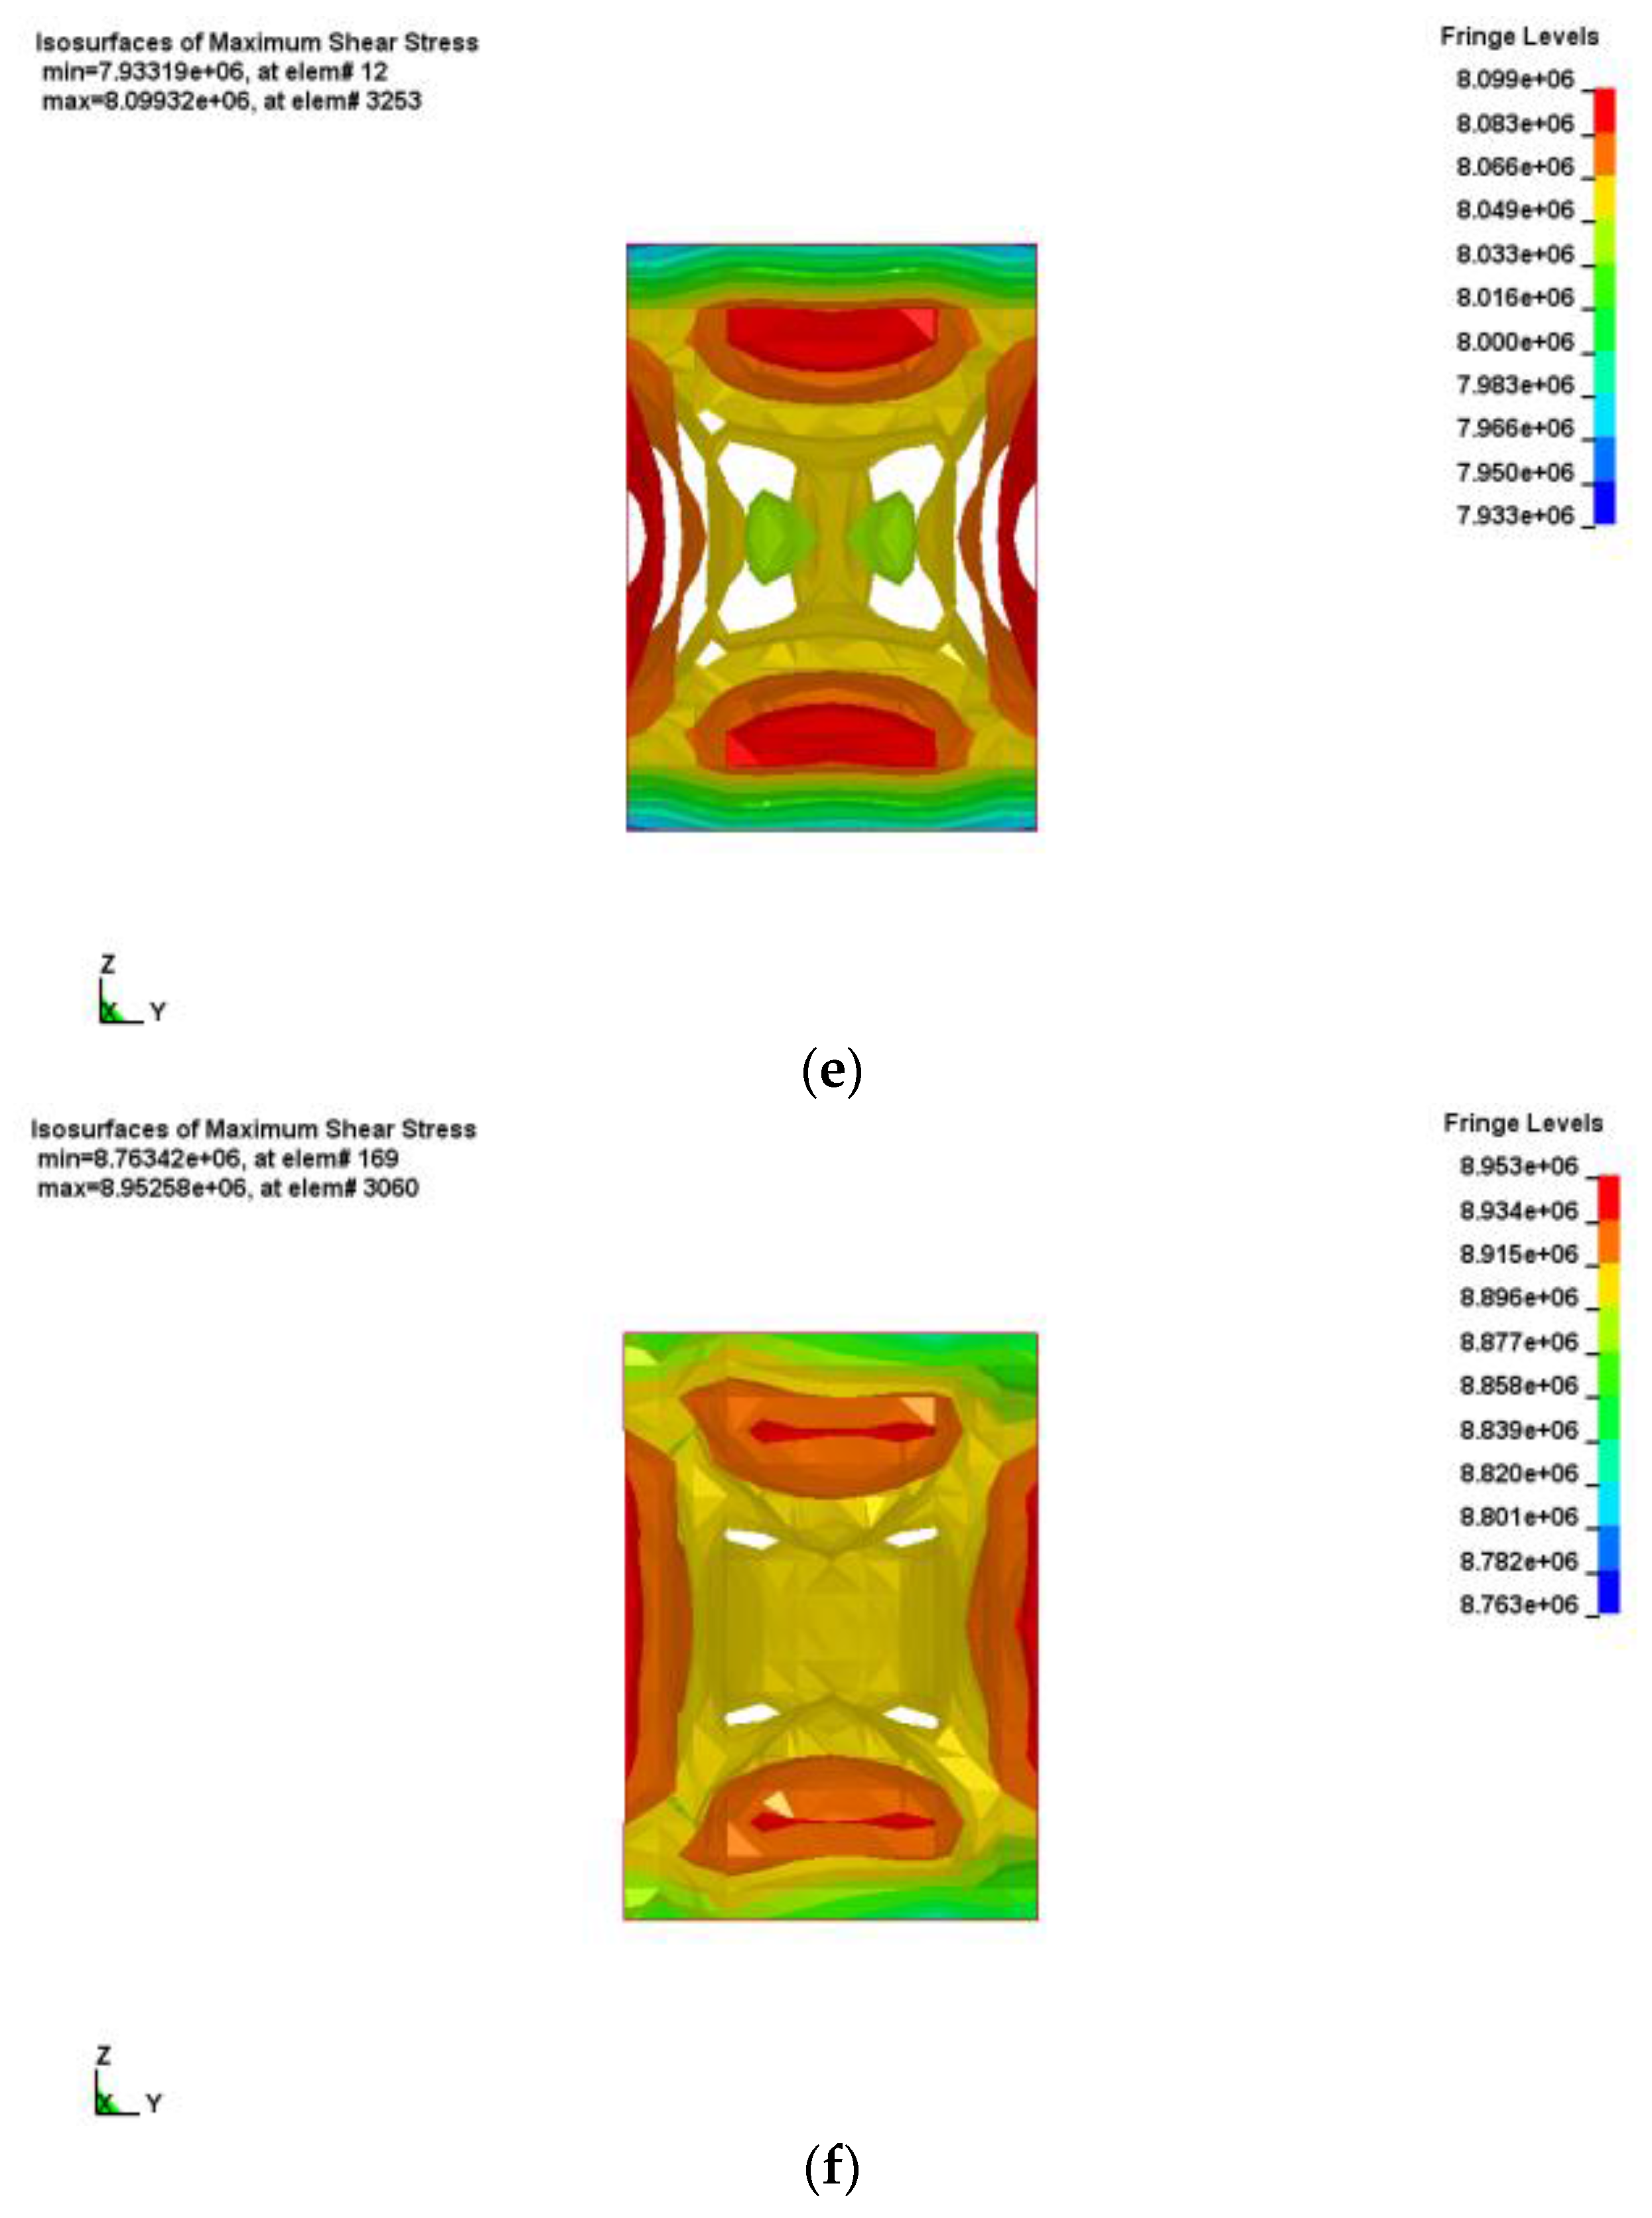
The variation of the maximum shear stress in the large-scale specimen during the uniaxial compression failure test is shown in
Figure 9. The maximum shear stress initially appeared at upper and lower parts of the specimen. Two internal shear stress bands developed in the middle of the specimen, and the distribution range of the maximum shear stress band was extended to the peripheral part as the load increased. The maximum shear stress band formed an X-shaped pattern, as shown in
Figure 9f. The distribution pattern of the maximum shear stress is consistent with the failure pattern of the large-scale specimen in
Figure 6. It can be concluded that the distribution pattern of the maximum shear stress determines the failure pattern of the large-scale specimen as well.
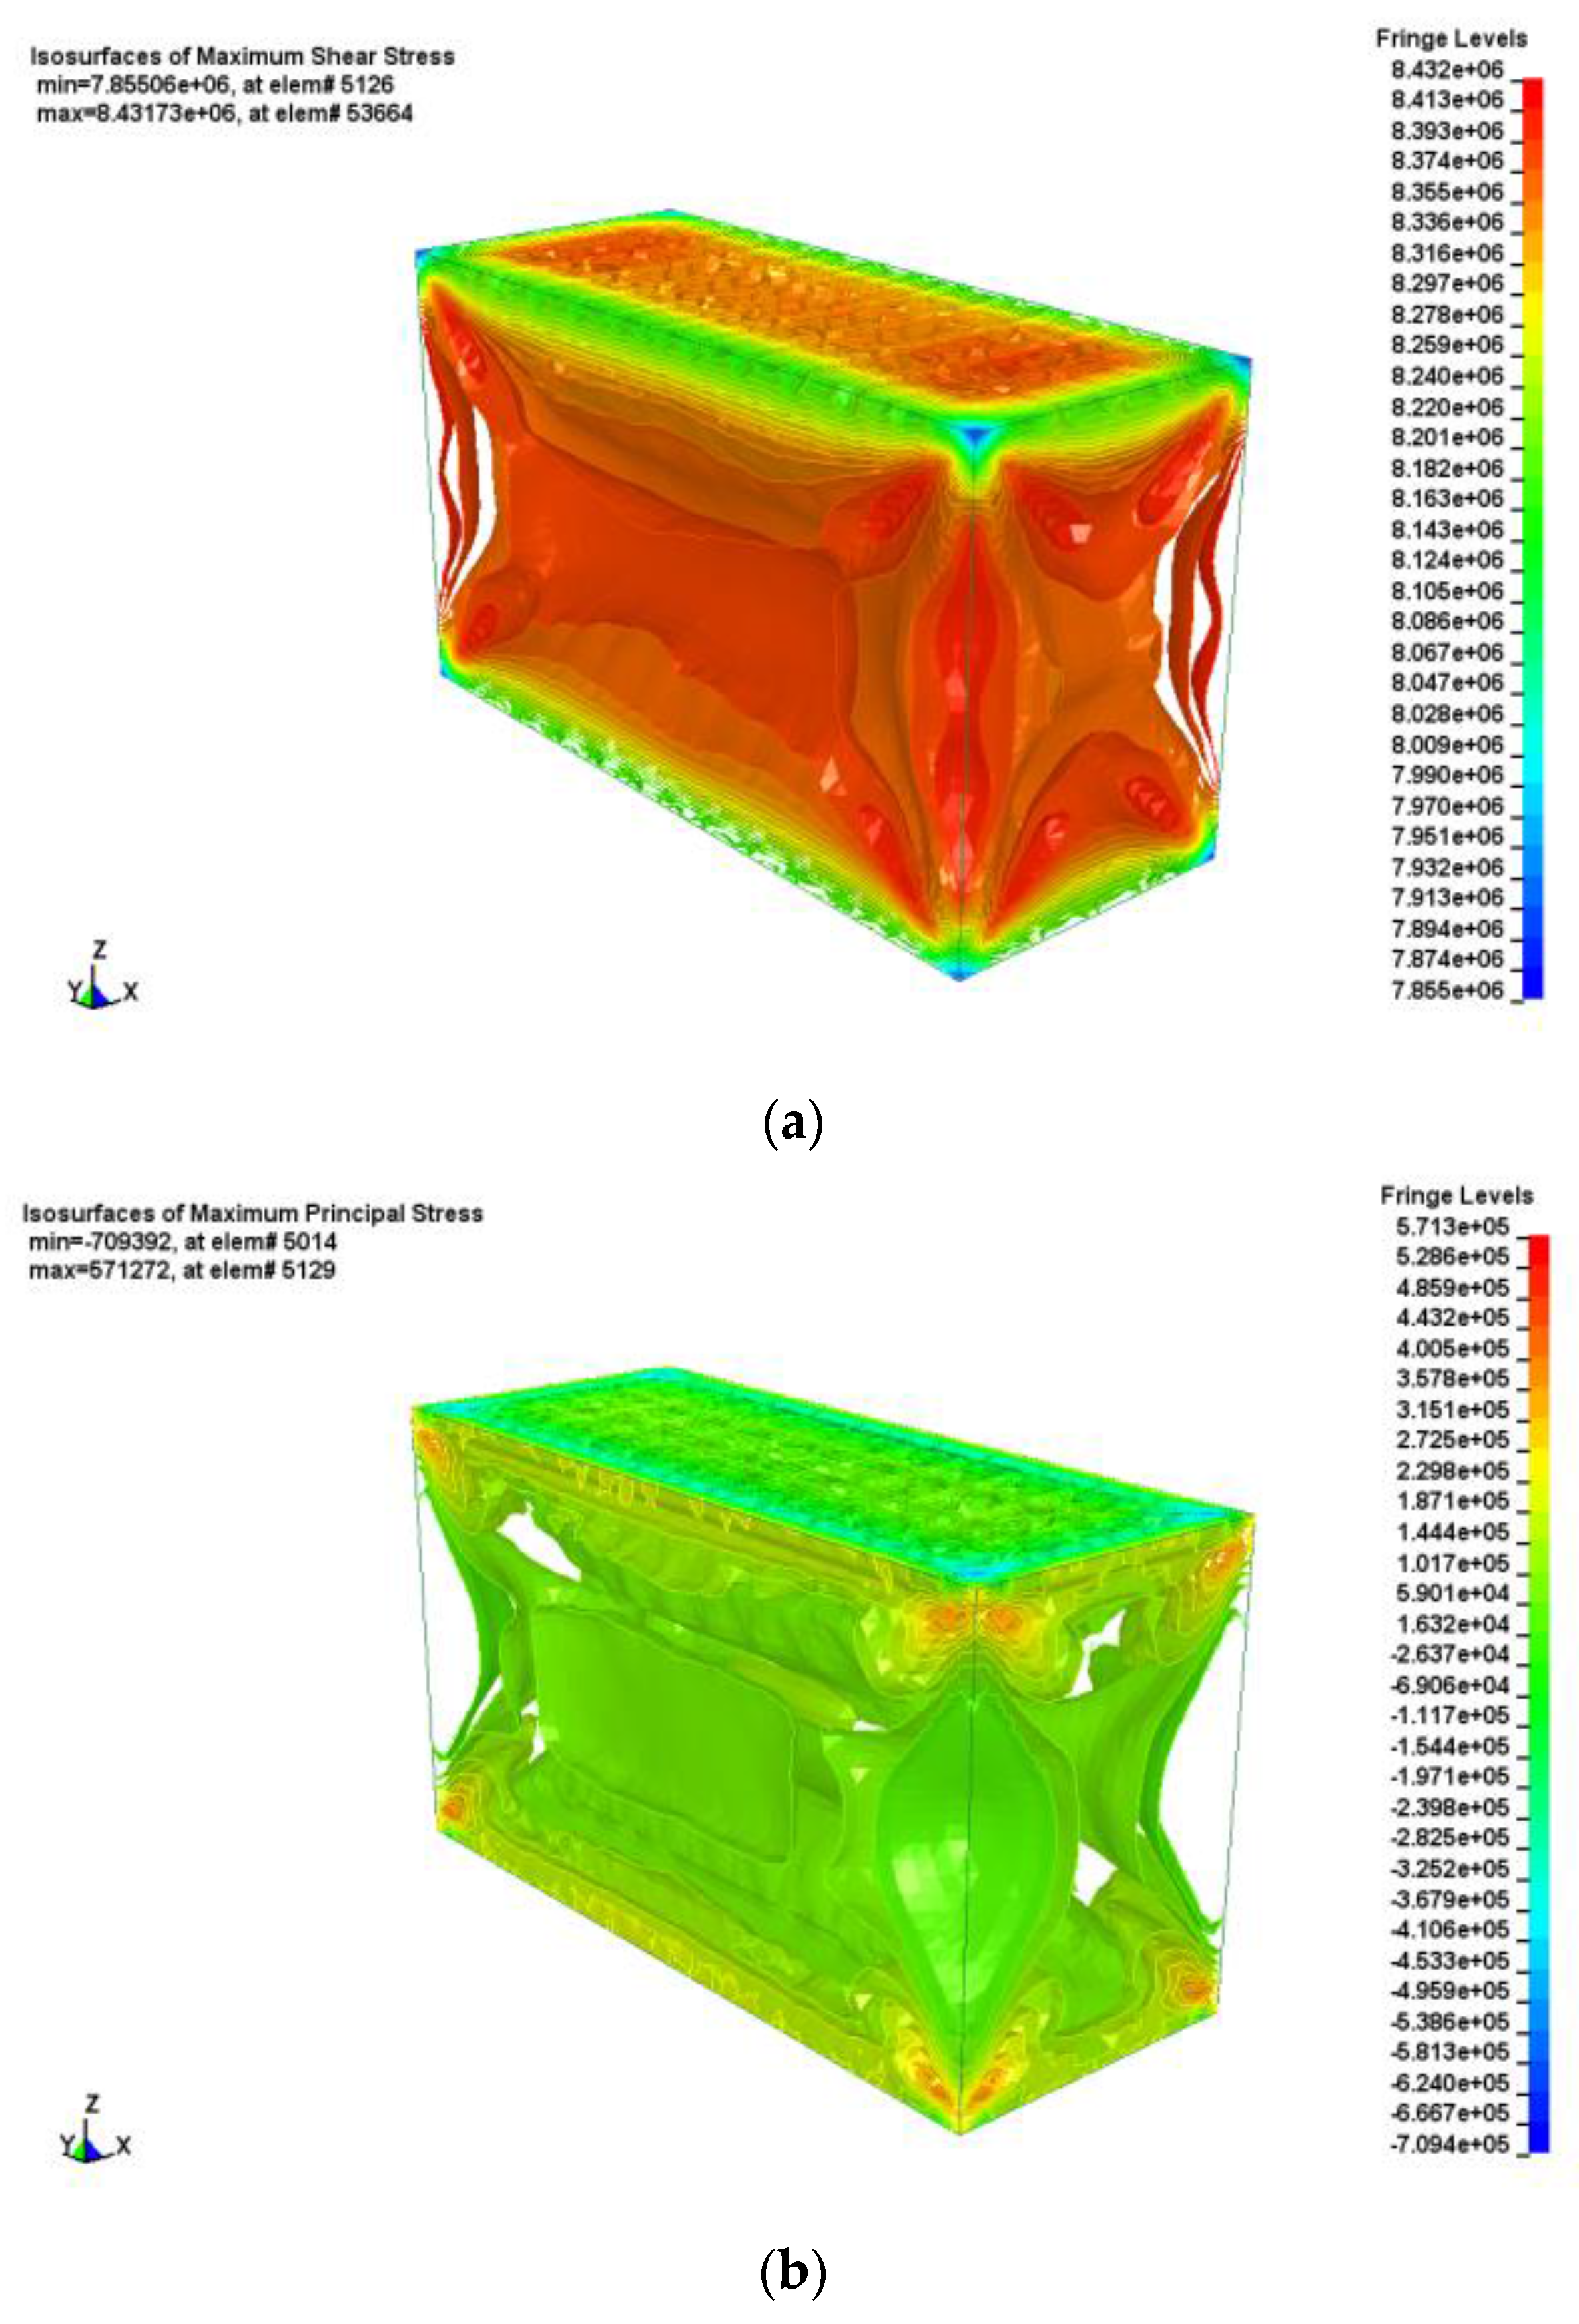
Figure 10 shows the contours of the maximum shear stress and maximum principal stress of the large-scale specimen. Based on the stress distribution pattern, the specimen was divided into four parts as shown in
Figure 11. The upper and lower parts in
Figure 10 and
Figure 11 show the compressive stress zone, while the left and right parts show the tensile stress zone. The locations of these zones are closely related to the aspect ratio of the specimen. The area of the compressive stress zone is inversely proportional to the aspect ratio, while the area of the tensile stress zone is proportional to the aspect ratio [
1,
2]. The distribution pattern of the maximum shear stress of the specimen appears X-shaped, and the maximum shear stresses in the four shear planes are identical in opposite directions.
3.3. Failure Criterion of the Artificial Side
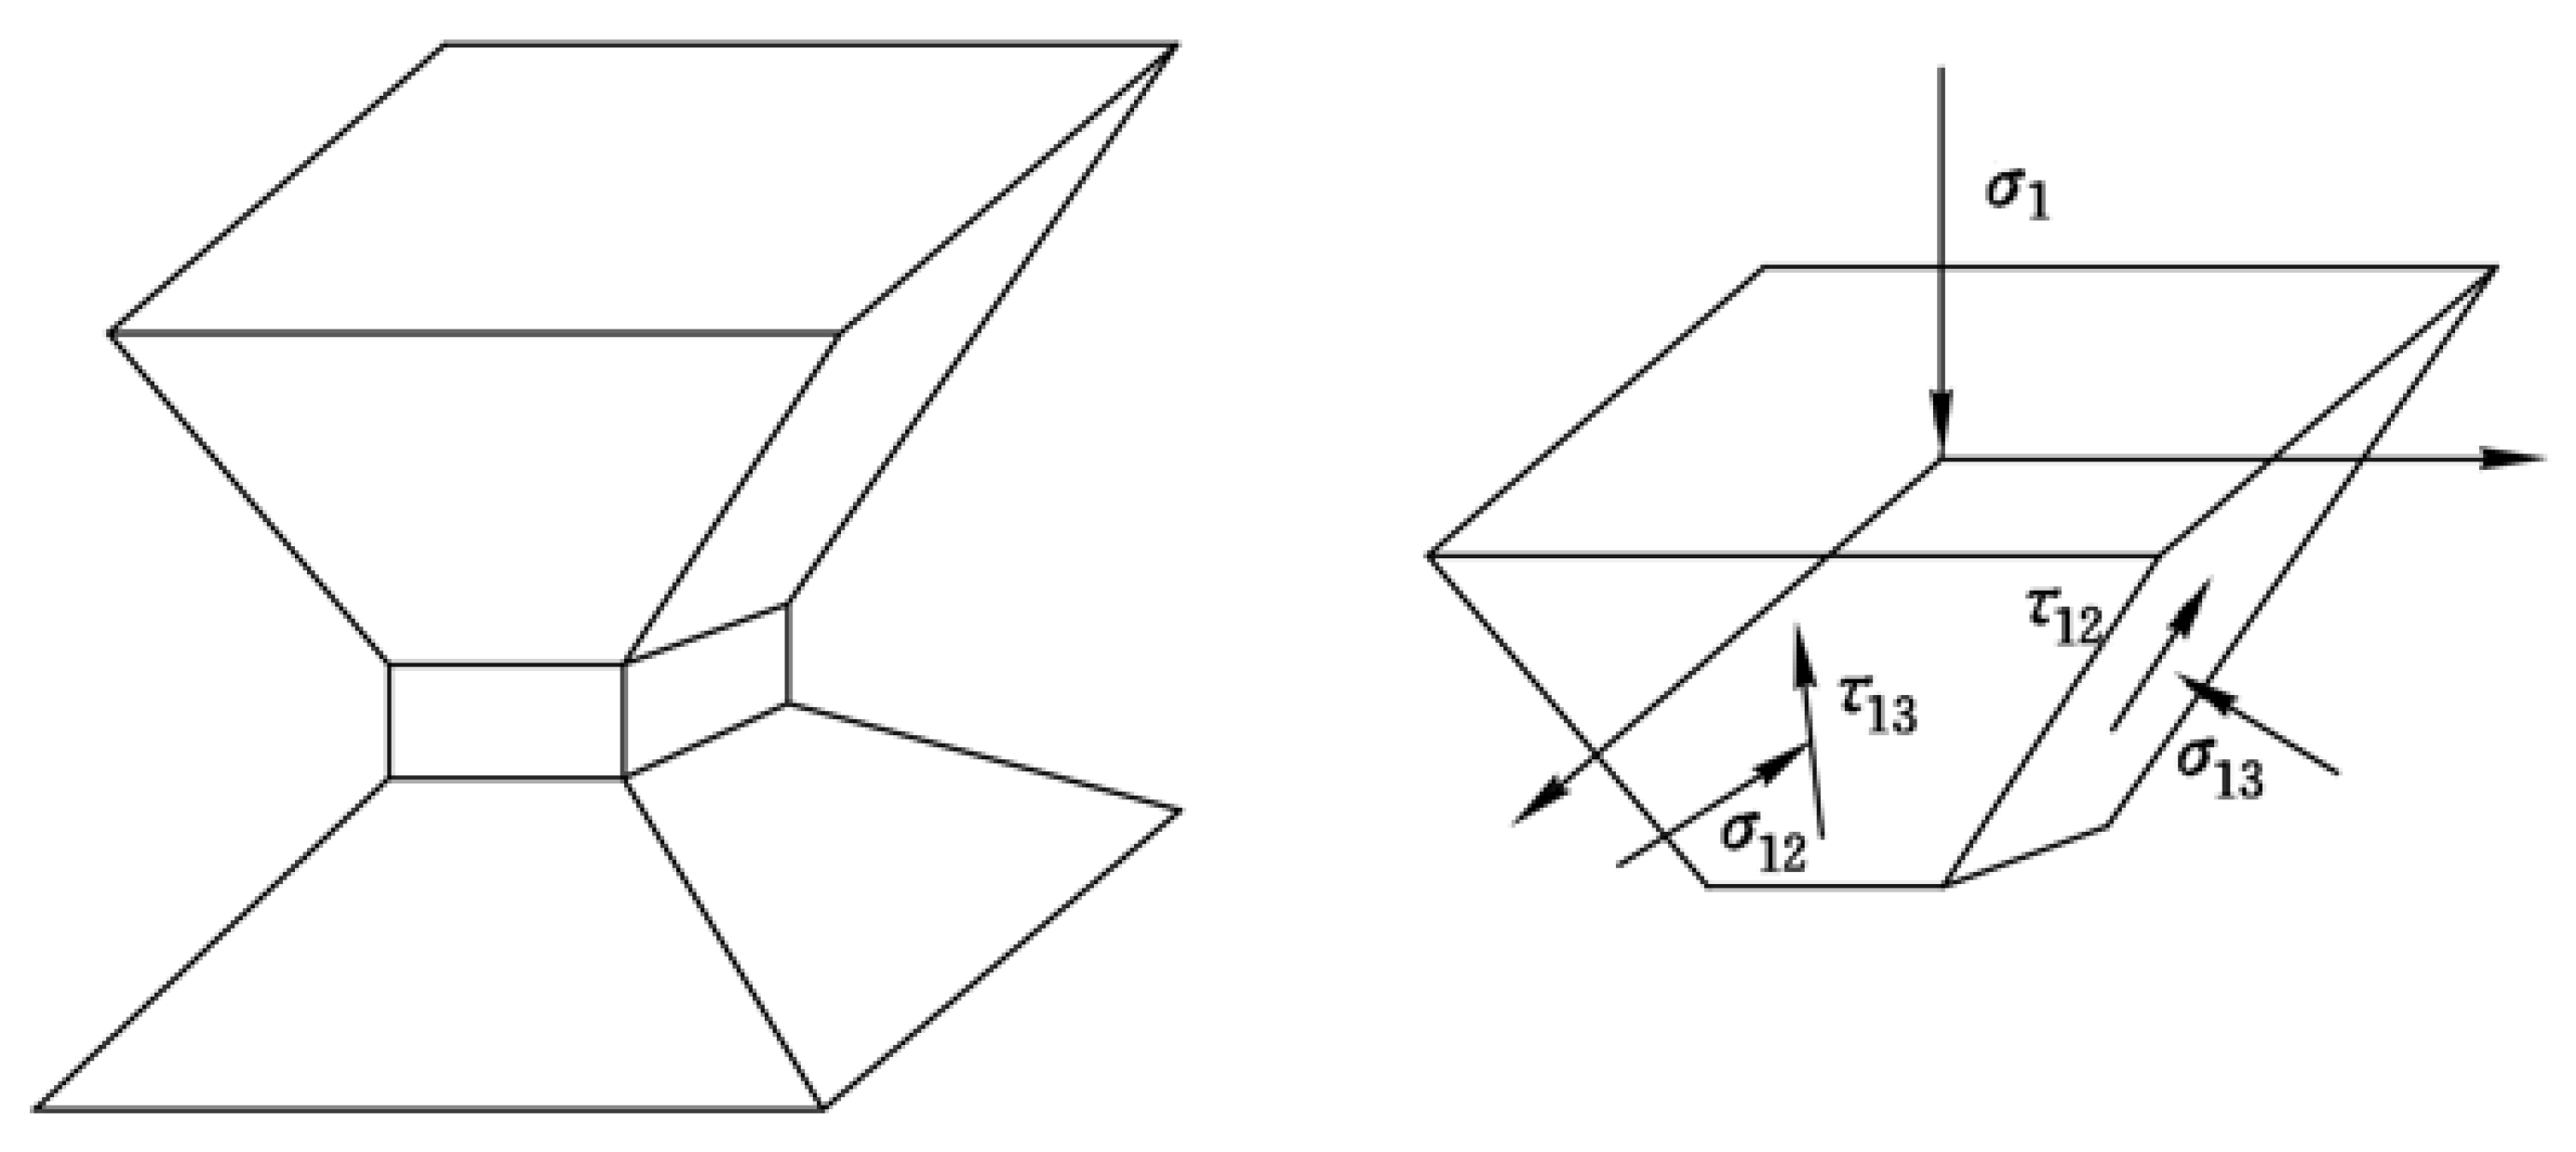
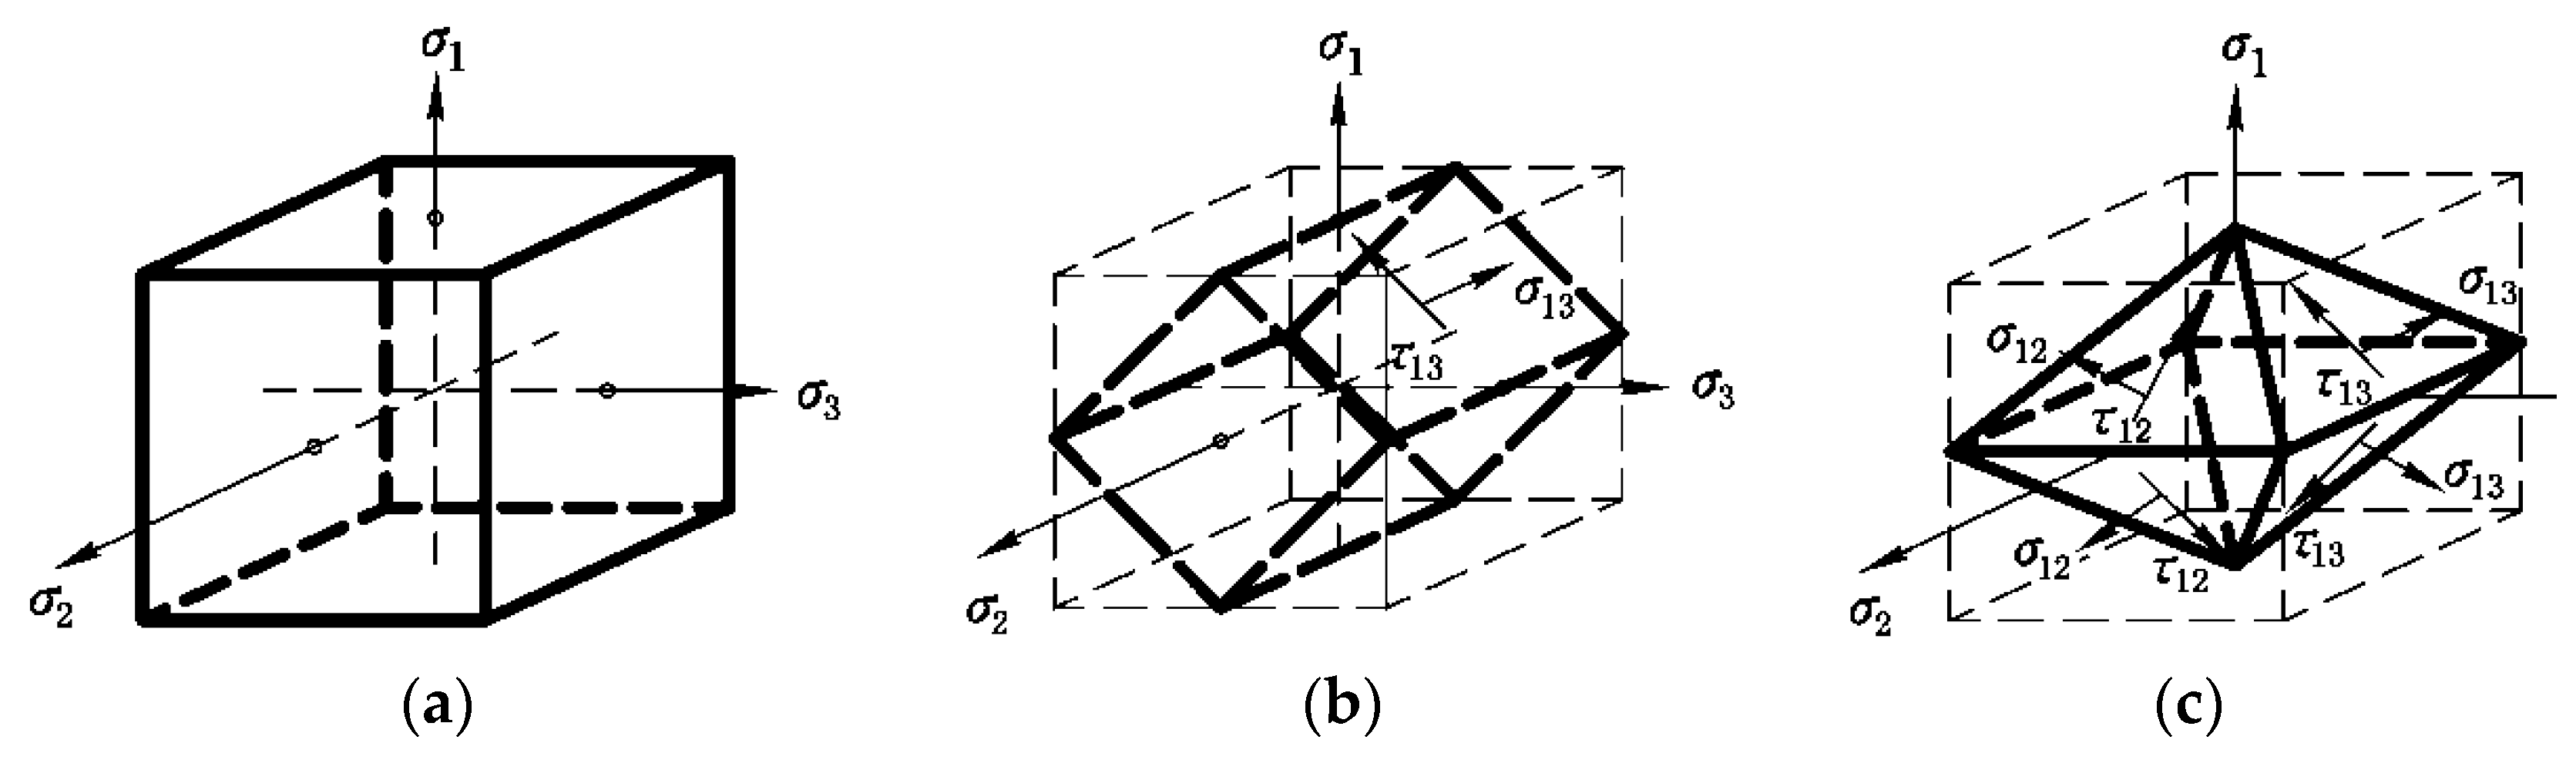
3.3.1. Orthogonal Octahedron and Its Stress Function
The cube unit considered in this study is a space aliquot body. A cube unit is commonly used in general material mechanics and in elastic and plastic mechanics. It is composed of three pairs of mutually perpendicular sections, as shown in
Figure 12a. When four sections inclined 45 degrees in σ
1 and σ
3 space intersect the cube unit, the space aliquot body becomes the unit body of maximum shear stress, as shown in
Figure 12b. A set of mutually perpendicular sections with principal shear stress are used to cut the unit body of maximum shear stress, and the space aliquot body becomes the orthogonal octahedron shown in
Figure 12c.
There are two sets of principal shear stresses in the orthogonal octahedron,
τ13 and
τ12. Thus, it can be considered as a twin shear stress unit. The stress components in the orthogonal octahedron are
τ12,
τ13,
τ23,
σ12,
σ13, and
σ23. The twin shear stress function can be defined as follows:
In this function, two straight inclined lines show the effect of intermediate principal stress σ2.
3.3.2. Twin Shear Strength Theory
For the twin-shear stress unit shown in
Figure 12c, the stress components can be defined as follows:
The twin shear strength theory was established based on the concept of the twin shear stress state in the twin-shear stress unit [
8]. In twin shear strength theory, the material will fail or yield when a critical state is reached in the influence function of the two sets of shear stress and normal stress on corresponding planes in the twin shear stress unit. The mathematical expression is defined as follows:
where
β and
C are material parameters that can be determined by the limit (
σt,
σc) of the tensile strength, compressive strength, and the ratio of the tensile strength to compressive strength (
α = σt/σc):
By substituting Equations (2), (3), and (5) into (4), the principal stress in the twin shear strength theory can be written as follows:
As shown in Equation (6), the twin shear strength theory reflects the influence of the intermediate principal stress σ2 on the material behavior.
4. Strengthening the Stability of Artificial Side
4.1. Reinforcement of Artificial Side
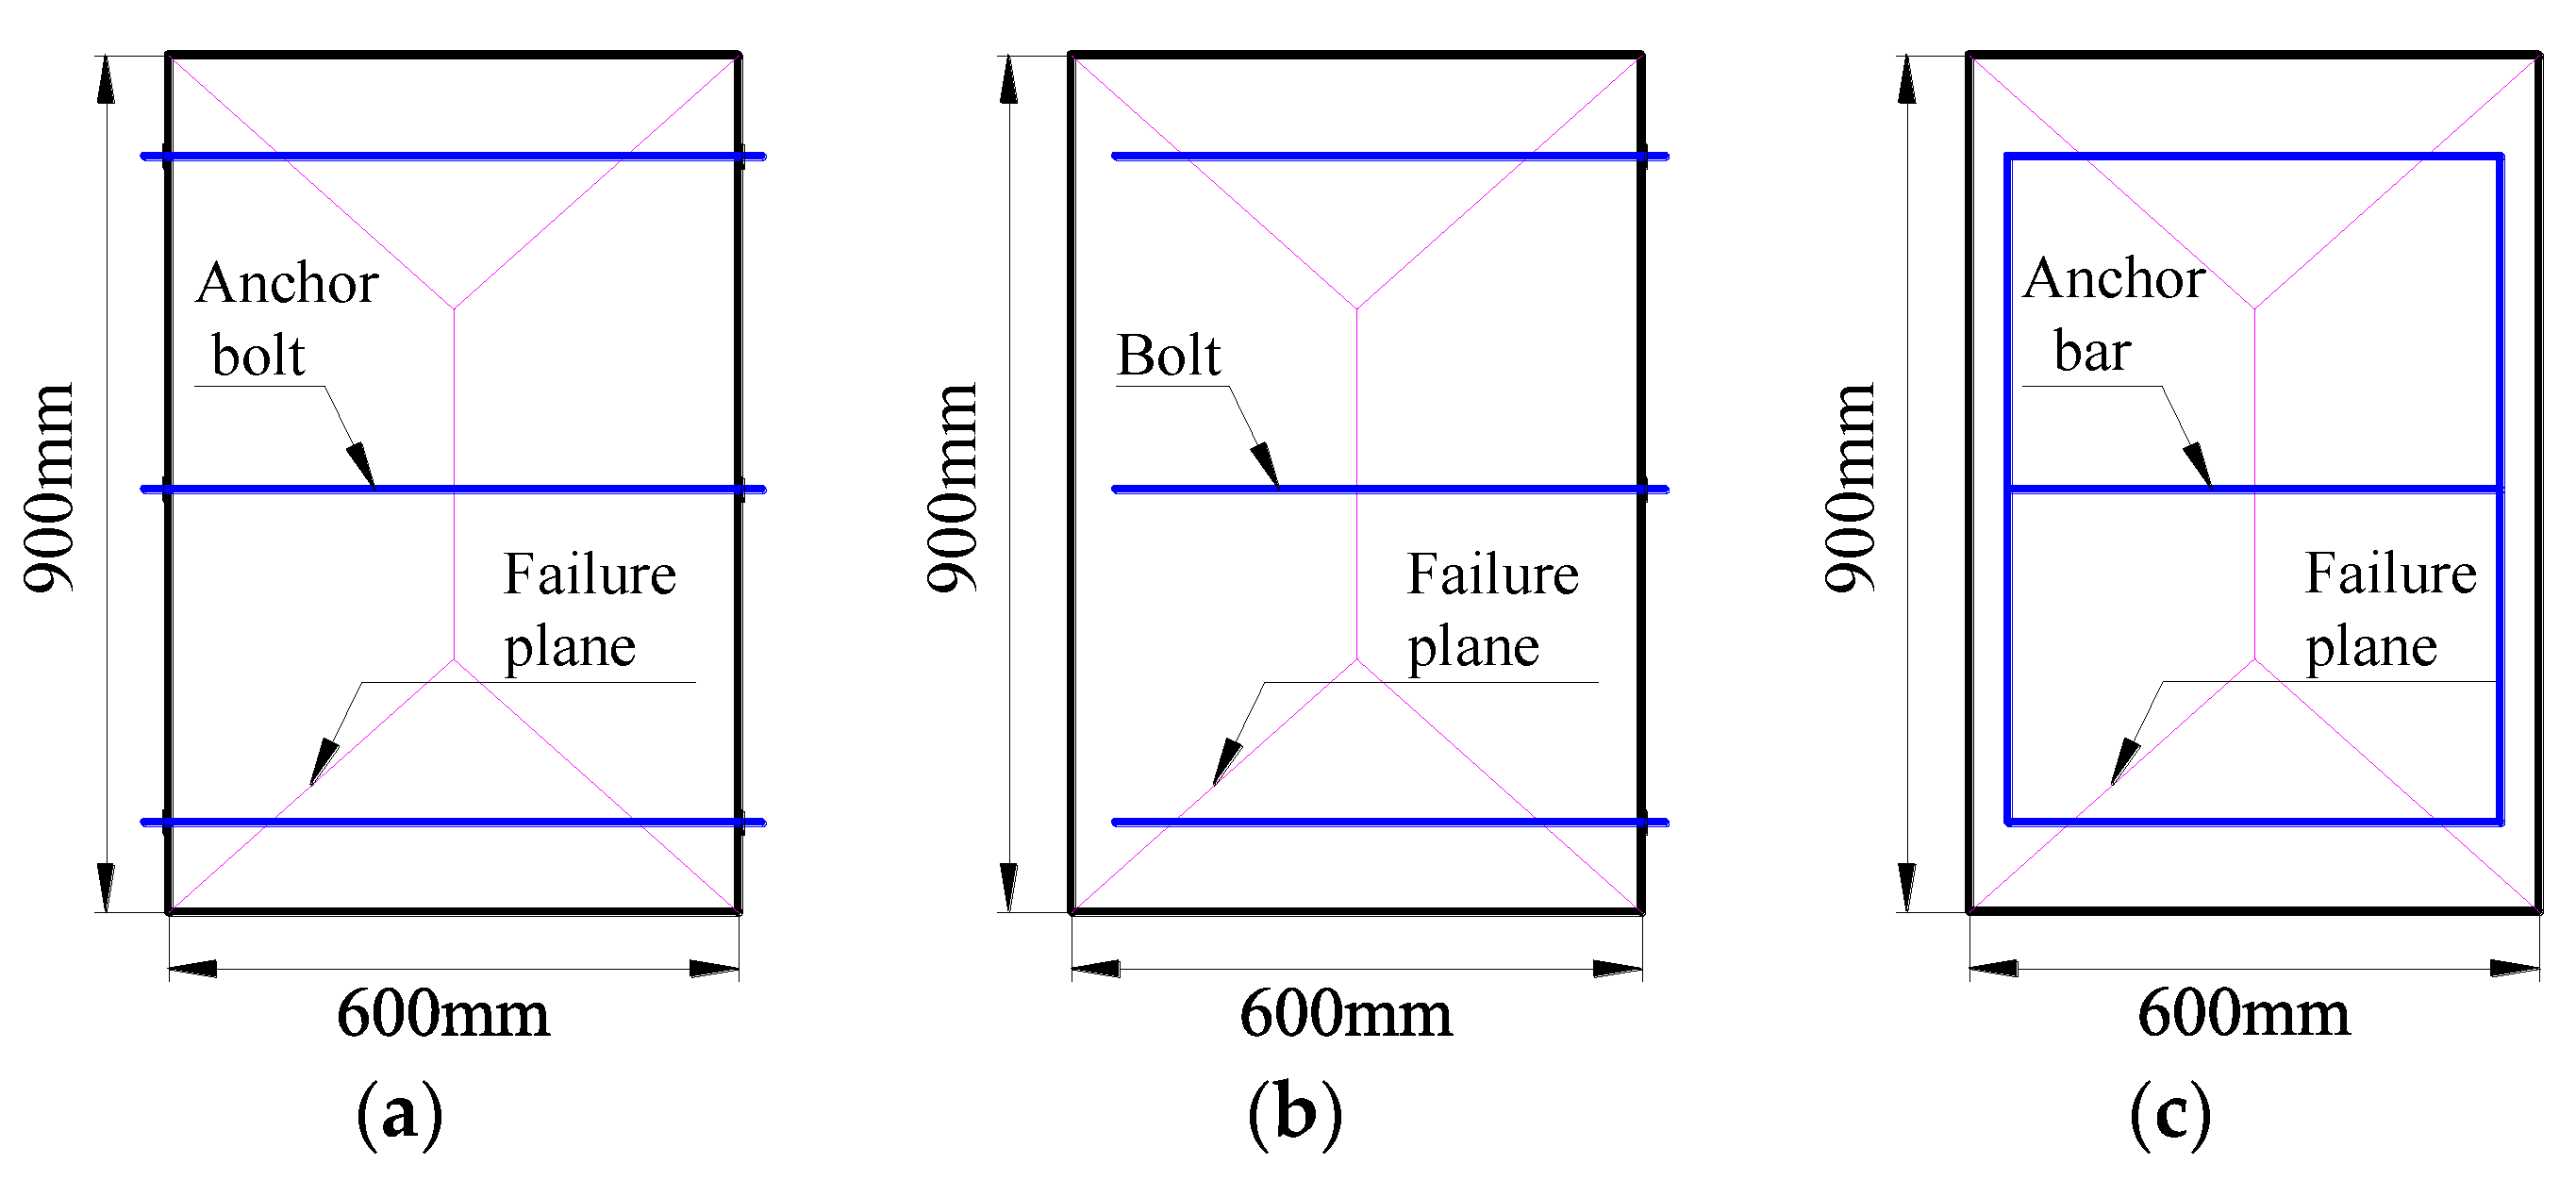
According to the experimental and numerical studies, an X-shaped failure pattern is commonly found in an artificial side, regardless of specimen size. From a theoretical point of view, the X-shaped failure pattern is mainly induced by the combination of two sets of shear stresses. To enhance the performance of the artificial side, bolt-type reinforcements such as an anchor bolt, bolt, or anchor bar is suggested in this study as shown in
Figure 13.
4.2. Reinforcement Mechanism
The limit equilibrium condition of the plastic softening material can be defined as follows:
where
φ and
c are the internal friction angle and the cohesion, and
σ1 and
σ3 are equivalent to the load-carrying capacity and lateral confining stress, respectively. The bolt-type reinforcement can develop a lateral confining effect,
σ3 > 0. From Equation (7),
σ1 increases as
σ3 increases. Increasing the lateral confining stress changes the state of stress on both sides of the AS from two-dimensional to three-dimensional. In the three-dimensional state of stress, the plastic property of the AS can be fully activated under excessive loading.
When the AS is stable, bolt-type reinforcement constrains the lateral deformation and improves the internal friction angle φ, cohesion c, and enhances the shear strength of the artificial side. When the AS is unstable due to damage, the constraining effect induced by bolt-type reinforcement can prevent a broken block from sliding along the shear failure plane and improve the residual strength of the artificial side. Thus, the load-carrying capacity of the AS can be sustained. Therefore, the bolt-type reinforcement improves φ and c of the AS and enhances the load-carrying and anti-deformation capacity.
4.3. Validation of Bolt-Type Reinforcement
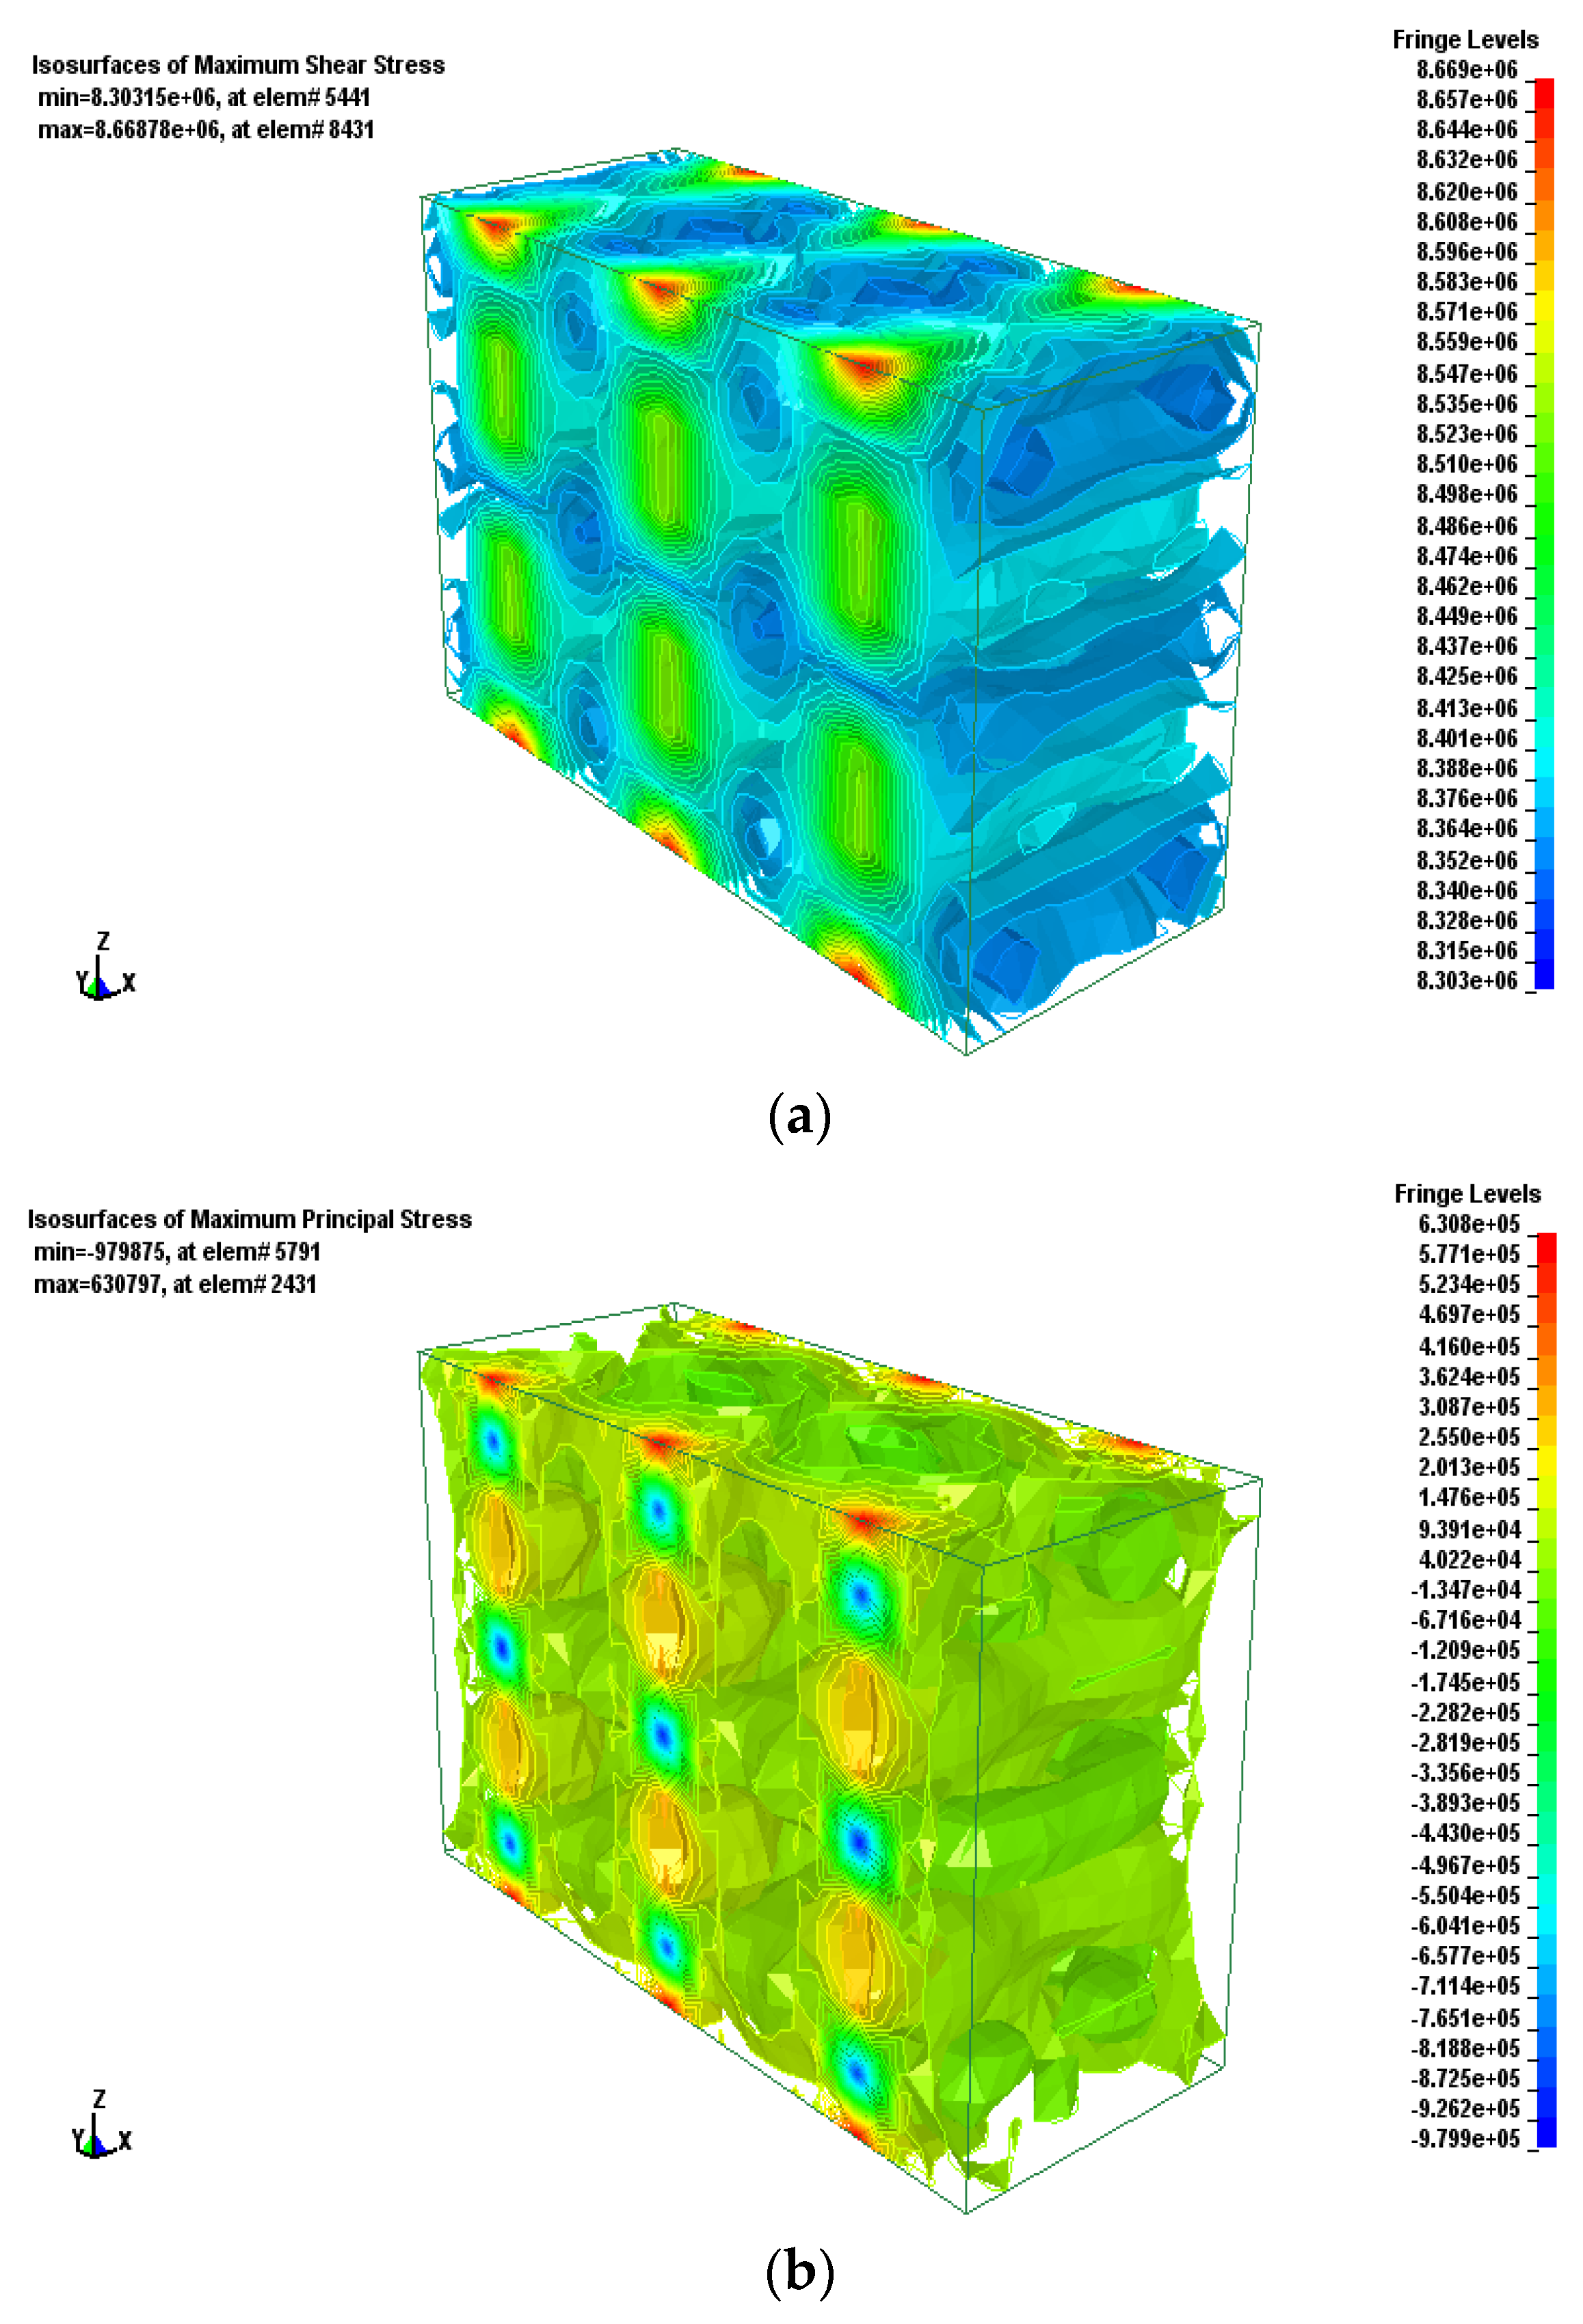
An additional numerical study was performed to validate the effect of the reinforcement. It was assumed that nine anchor bolts were installed in a large-scale specimen. The variations of the maximum shear stress and maximum principal stress of the reinforced large-scale specimen are presented in
Figure 14.
In
Figure 14a, the distribution of the maximum shear stress changed: the X-shaped pattern disappeared, the maximum shear stress decreased, and the shear strength increased. The lateral deformation was also constrained significantly. In
Figure 14b, the distribution pattern of the principal stress has changed: the load-bearing area expanded while the tensile area shrank. The maximum principal stress and the maximum tensile stress decreased. Due to the installation of anchor bar, the compressive strength of the AS increased, and the load-carrying capacity of the AS was improved.
5. Application of Artificial Side
5.1. Geological Conditions
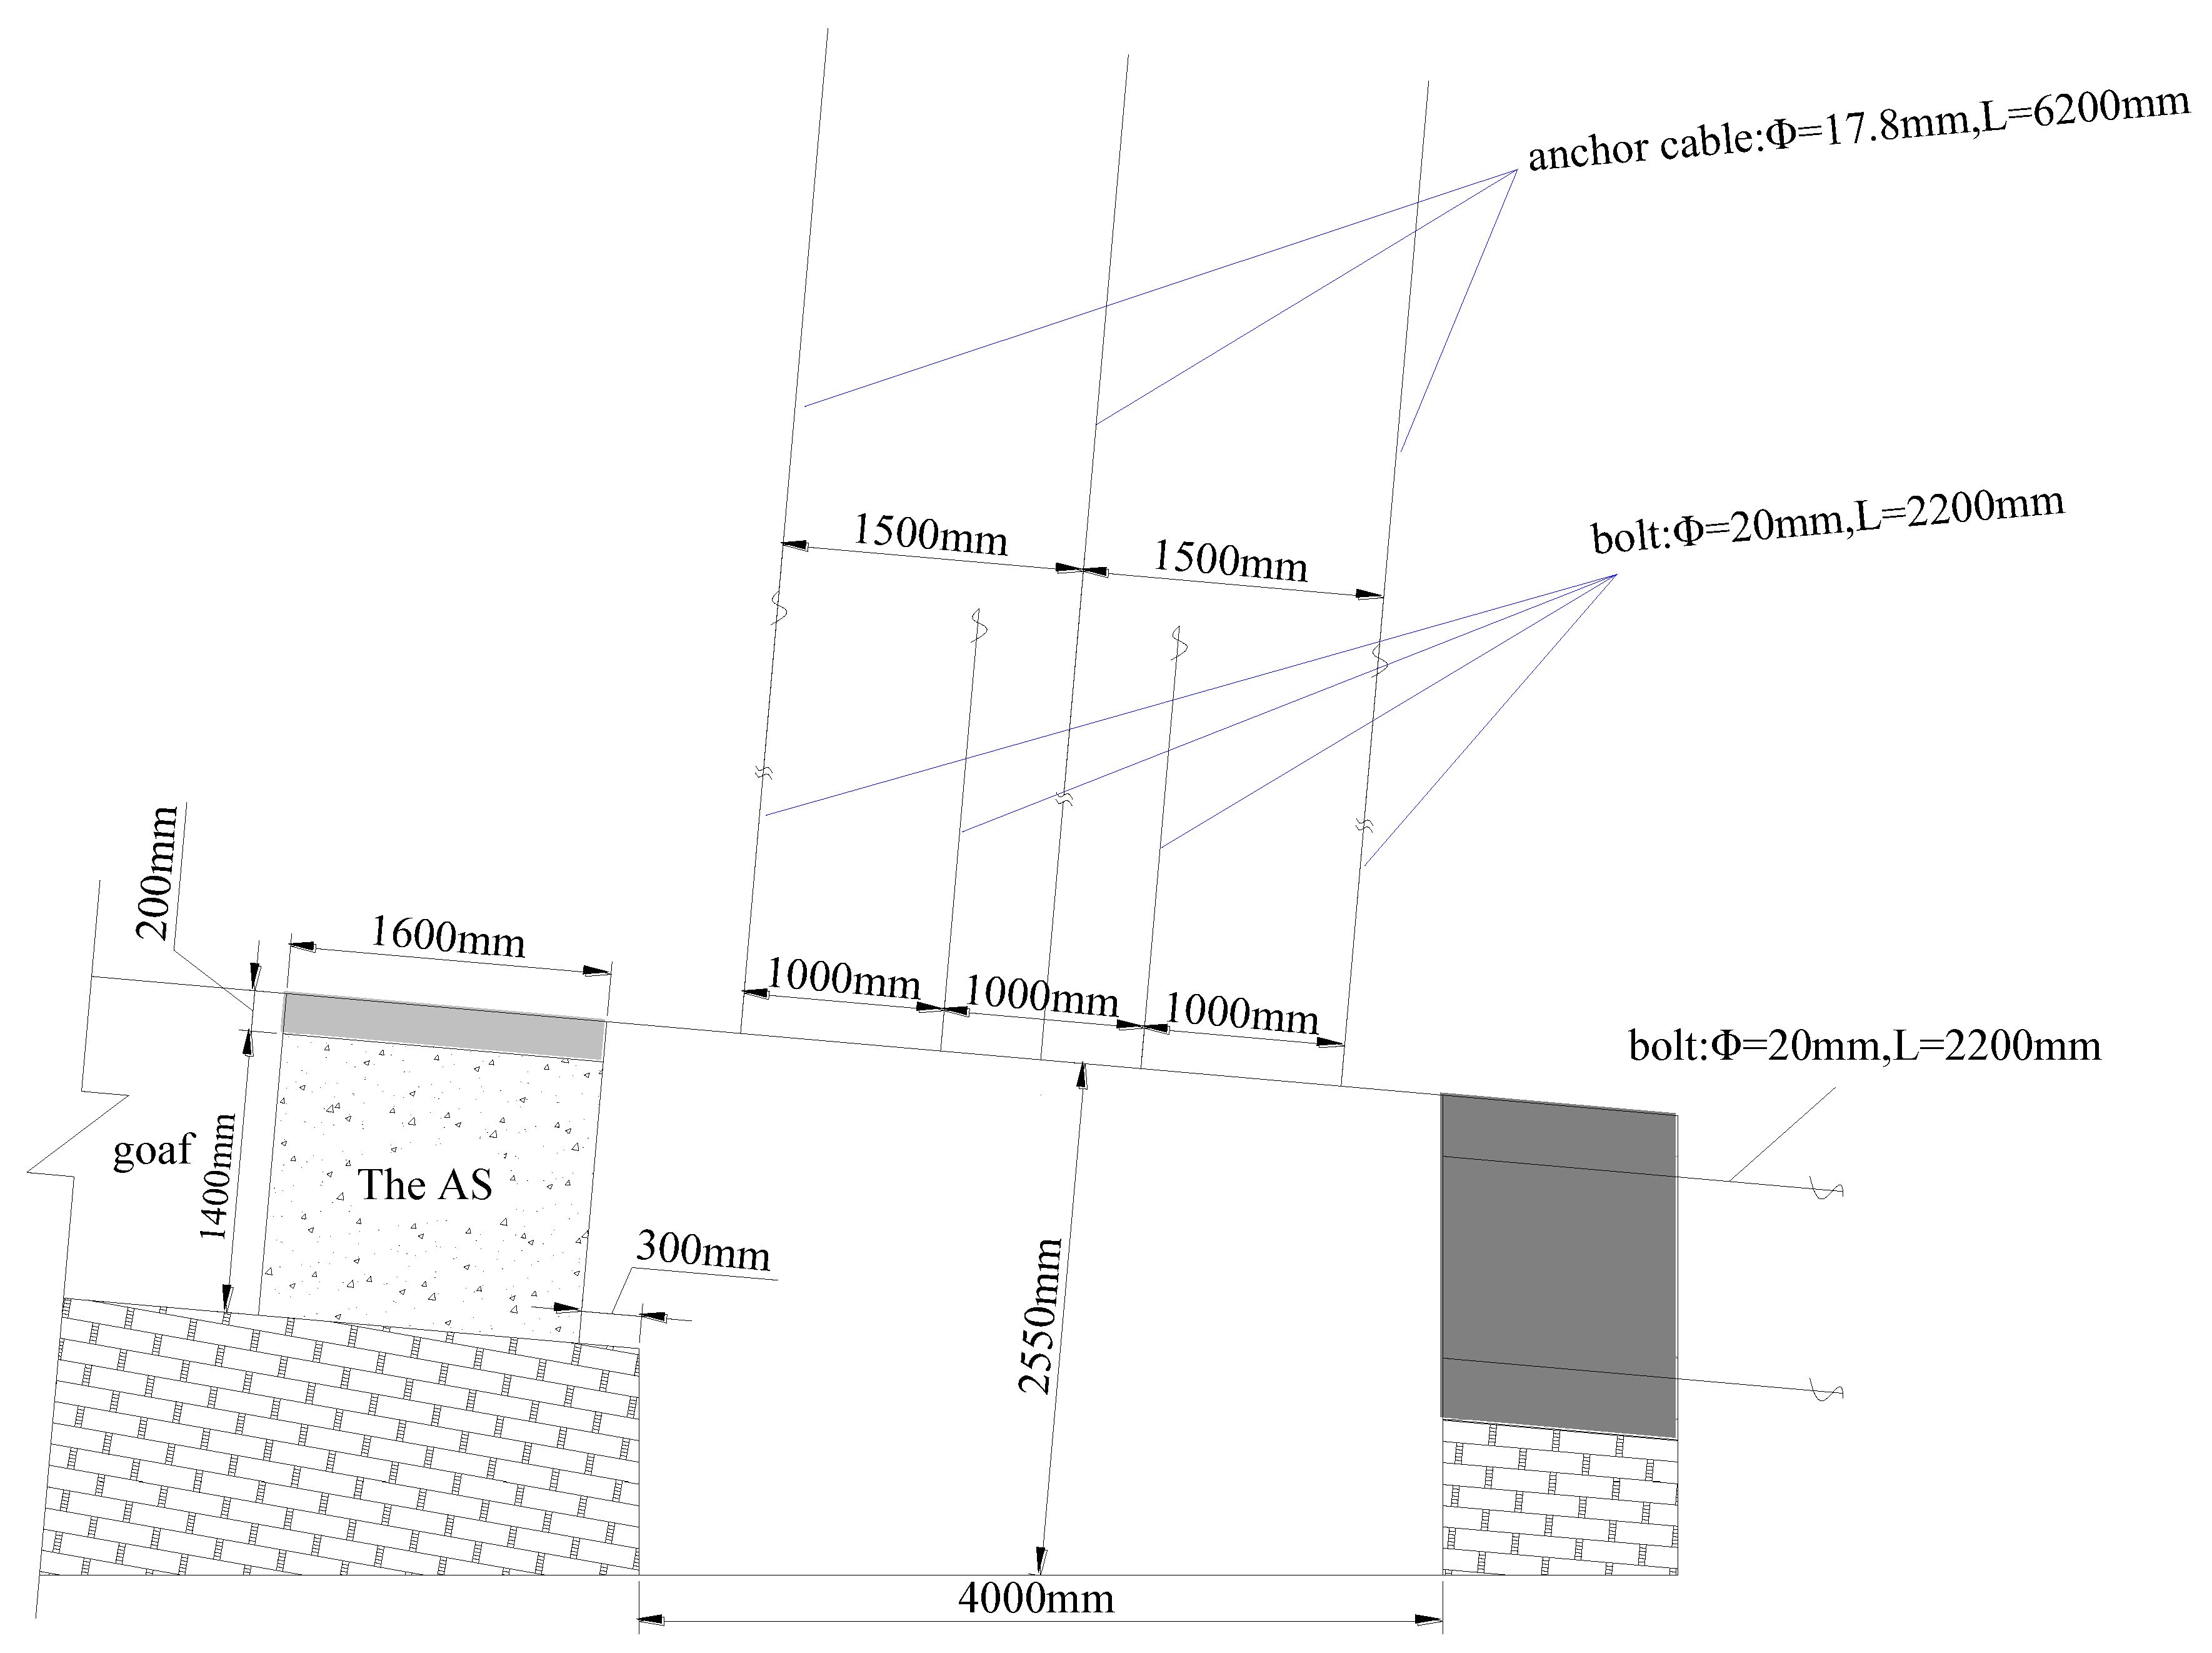
Figure 15 shows the layout of the Left No. 1 Working Face in the West No. 2 Working Area of the Jixian Coalmine. The seam thickness of No. 9 ranged from 1.4–1.68 m with an average of 1.6 m. The seam pitch was 10°. The immediate roof was grey medium sandstone with a thickness of 1.7 m. The immediate floor was grey fine sandstone with a thickness of 0.6 m. The main roof and floor were black siltstone with thicknesses of 2.6 m and 3.3 m, respectively. A belt transportation roadway was tunneled along the roof of the No. 9 seam and used for air intake and coal transportation. The length of the roadway was 768 m. GSE retaining technology was adopted to increase the resource recovery rate. The section of the GSE is shown in
Figure 16.
5.2. Parameters of the Artificial Side
To decrease the load on the AS when the main roof fractures and rotates, a soft-hard structure was used for the AS [
1,
2,
15]. Based on the seam thickness of the coal, the given deformation of the key block in the main roof was about 240 mm, so the thicknesses of the upper soft structure and the hard structure at the bottom were 240 mm and 1400 mm, respectively. The height of the AS was 1640 mm. The results [
1,
2] show that the load-bearing area and load-carrying capacity are highest when the aspect ratio is 1:1. Therefore, the width of the AS is decided as 1600 mm.
5.3. Construction Method of the Artificial Side
Considering the geological conditions of the working face, rail transport and monorail system were used to transport large concrete blocks that were fabricated in advance. Concrete blocks were stacked in two layers to build up the artificial side.
5.4. Reinforcement of Artificial Side
Anchor bars were installed in the AS to improve the load-carrying capacity. The anchor bar was thread steel, its diameter was 18 mm, and its length was 1600 mm. One hundred millimeters of both ends were folded inside, and the anchor bars were fixed with round steel of 14 mm in diameter. The anchor bar framework was fixed at the center of a mold, and then concrete paste was added. The AS is wet-cured for more than 28 days at normal temperature. The anchor bar framework and the large concrete blocks are shown in
Figure 17a,b, respectively.
5.5. Performance of Artificial Side
5.5.1. Effect of GSE Retaining for the First Mining
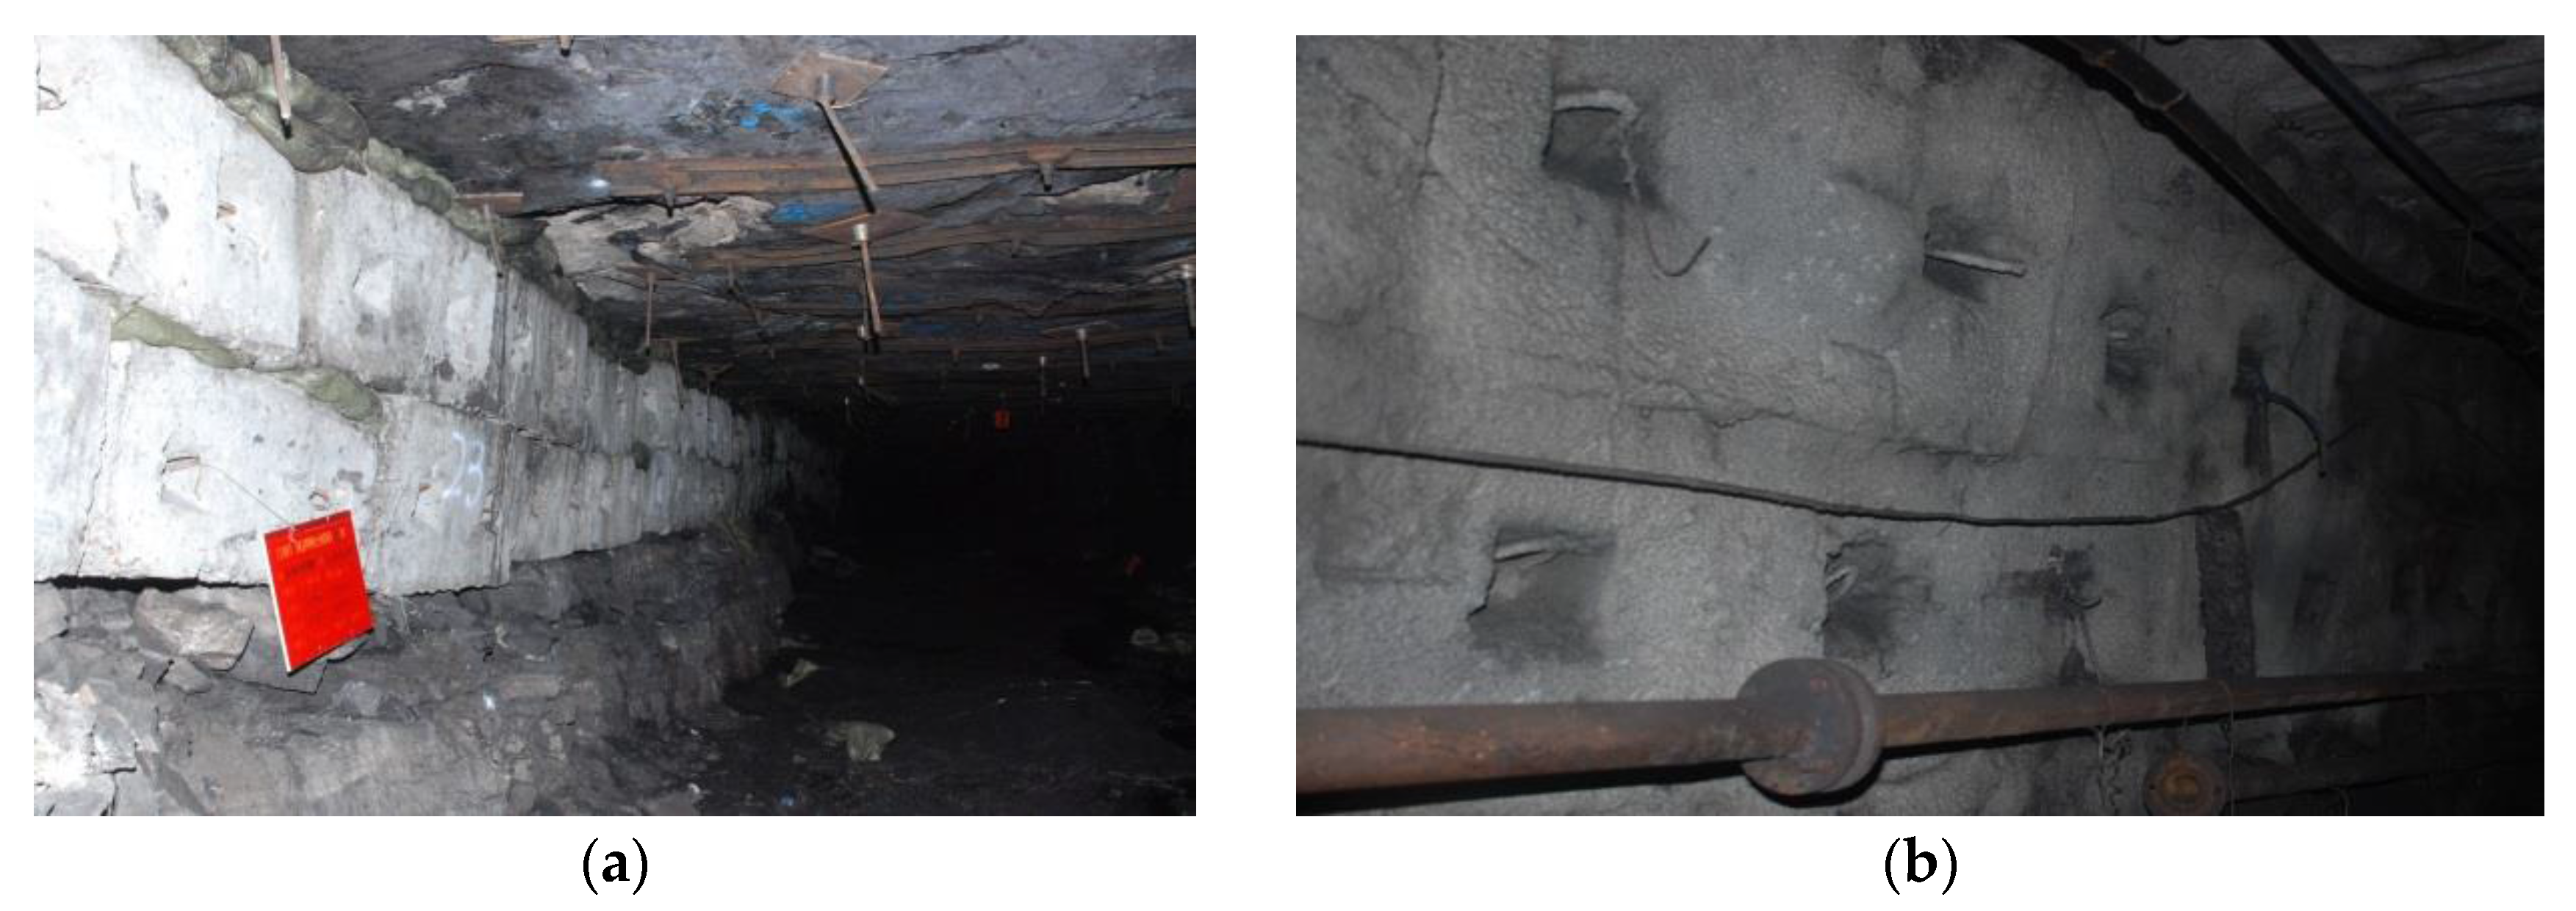
Mining work started on 26 September 2012, at the Left No. 1 Working Face, and it finished on 25 October 2013. The length of the retaining roadway was 768 m. Deformation induced by the first mining work is shown in
Figure 18.
5.5.2. Effect of GSE Retaining for the Second Mining
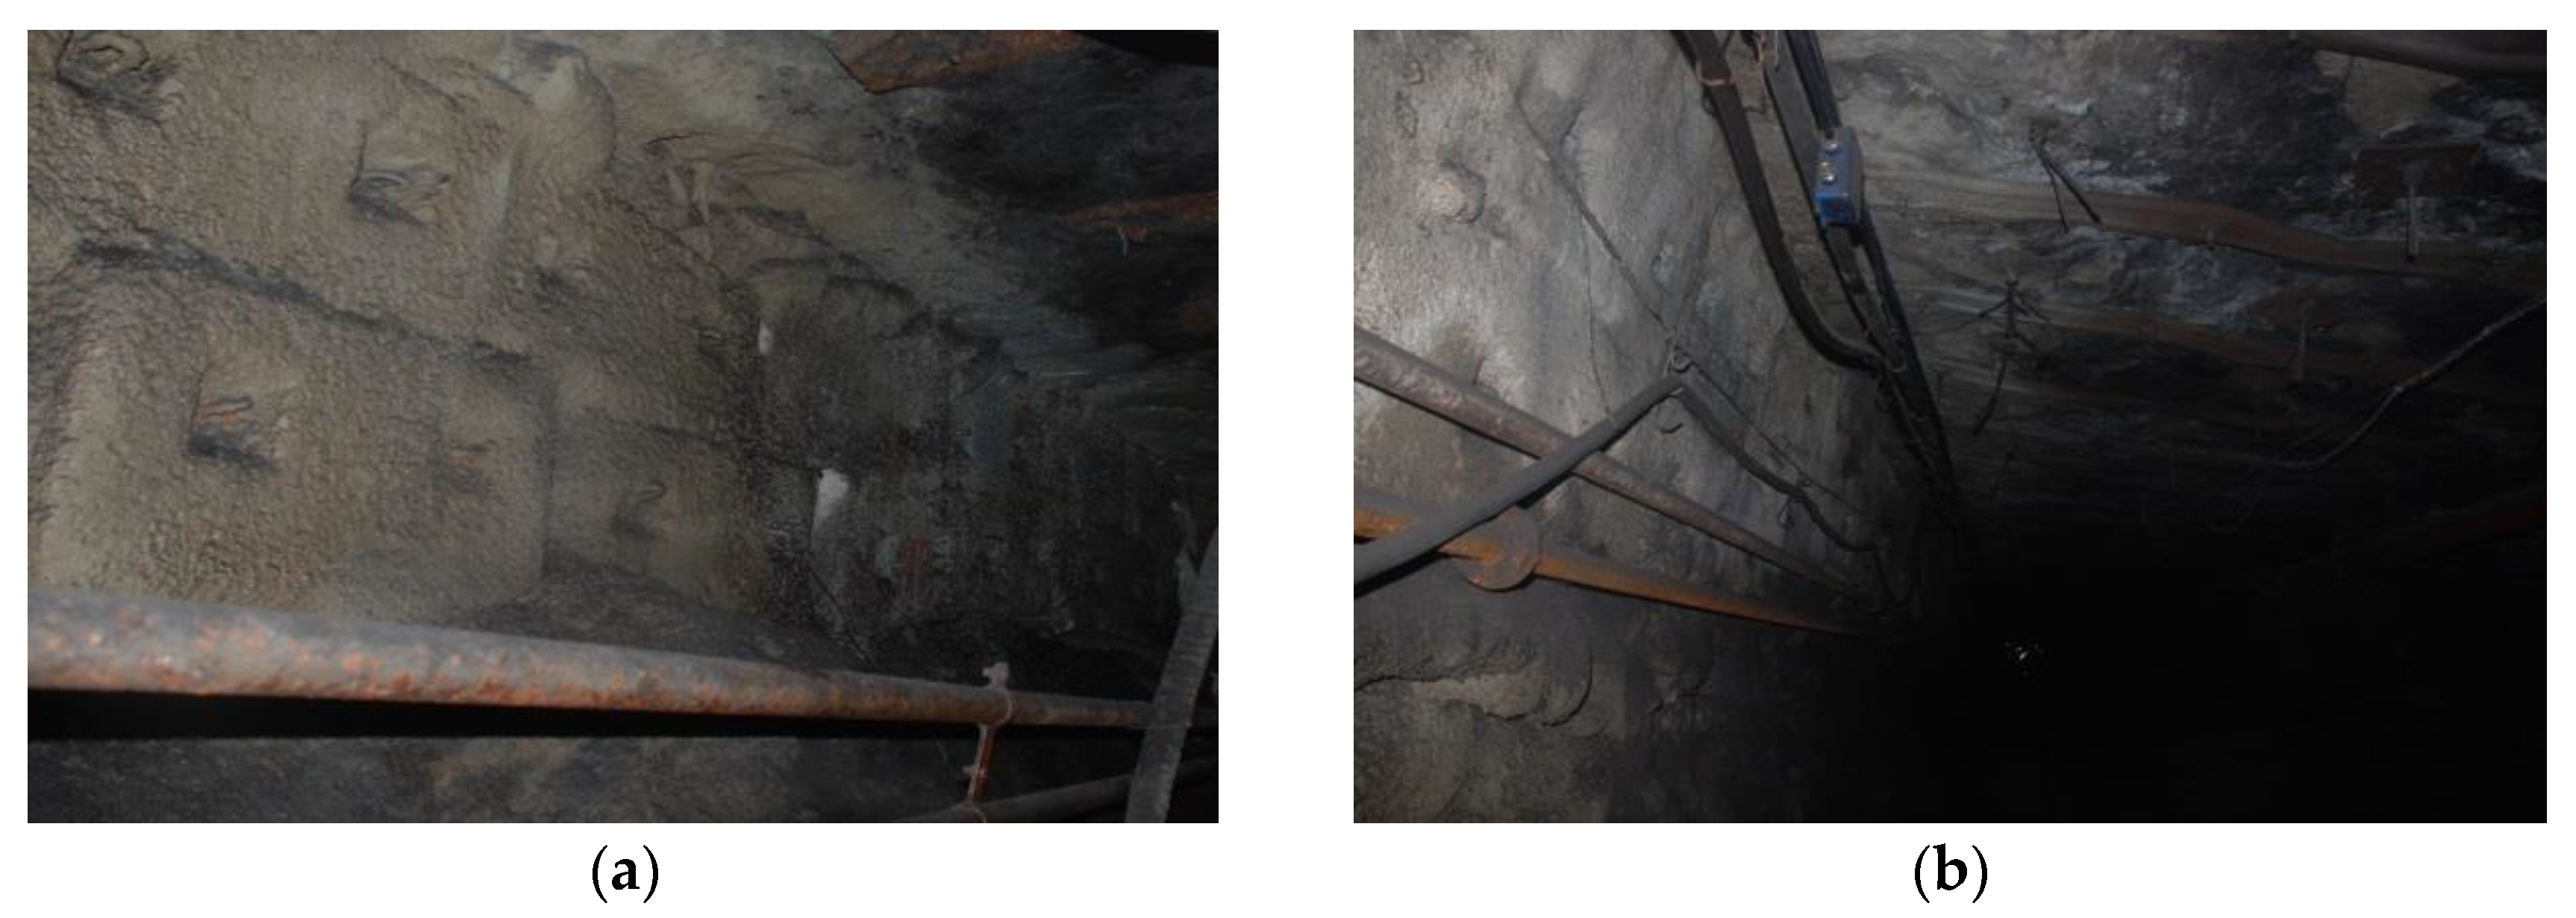
The second mining work started on 17 March 2014, at the Left No. 2 Working Face, and was finished recently. Even after the second mining process, the AS was well-preserved intact condition except for partial cracks that appeared in the shotcreting layer. The AS withstood the second mining influence. Deformation induced by the second mining is presented in
Figure 19.
5.5.3. Performance Evaluation
The AS was constructed and applied to the mining site to stabilize the entry. The AS with built-in anchor bar is still intact and has been stable for last three years, even after the two mining works. It can be seen that the anchor bar improved the load-carrying capacity of the AS and secured the stability of the working face.
6. Conclusions
An AS was introduced to stabilize the entry of a mining site and a failure criterion of AS was developed. A theoretical solution was derived to explain the failure mechanism, and a numerical study and experimental study were performed to validate the theoretical solution. An actual AS was installed at a mining site and its performance was validated.
An X-shaped failure pattern was found in the small and large-scale specimens. The X-shaped failure pattern obtained from experimental testing shows good agreement with the numerical simulation result. The failure pattern was clearly explained with a combination of two sets of principal shear stresses. Therefore, it can be concluded that the distribution of the maximum shear stress determines the failure pattern, regardless of specimen size.
Bolt-type reinforcement was introduced to enhance the load-carrying and anti-deformation capacity of artificial side. When the AS is stable, bolt-type reinforcement constrains the lateral deformation and improves the internal friction angle, cohesion c, and enhances the shear strength of the artificial side. When the AS is unstable due to damage, the constraining effect induced by bolt-type reinforcement can prevent a broken block from sliding along the shear failure plane and improve the residual strength of AS so that the load-carrying capacity can be sustained. In the field application, the reinforced AS was still stable even after mining operations for the last three years. It can be concluded that the anchor bar improved the load-carrying capacity of the AS and secured the stability of the working face.
Acknowledgments
This research was supported by the National Basic Research Development Program (973 Program) of China (No. 2015CB251600), the National Natural Science Foundation of China (No. 51504182), the Natural Science Basic Research Plan of Shaanxi Province of China (No. 2015JQ5187), the Scientific Research Program funded by the Shaanxi Provincial Education Department (No. 15JK1466), the Project funded by China Postdoctoral Science Foundation (No. 2015M582685), and the Xi’an University of Science and Technology Research Fund Program for Young Scholars (No. 2014-NY-018). This research was also supported by INHA UNIVERSITY research grant.
Author Contributions
Hong-sheng Wang and Dong-sheng Zhang conceived of the research. Hong-sheng Wang analyzed the data and wrote the paper. Lang Liu, Wei-bin Guo, Gang-wei Fan, KI-IL Song and Xu-feng Wang participated in the design of the study and verified the results. All authors have read and approved the final manuscript.
Conflicts of Interest
The authors declare no conflict of interest.
References
- Wang, H. Research on the Creep Property and Its Stability Control Technology of Gob-side Entry’s Narrow Side; China University of Mining and Technology: Xuzhou, China, 2011. (In Chinese) [Google Scholar]
- Wang, H.; Zhang, D. Study on the Mechanisms and Application on Controlling the Creep Failure in Narrow Side of Gob-side Entry; China University of Mining and Technology Press: Xuzhou, China, 2015. (In Chinese) [Google Scholar]
- Hu, X.; Yu, M. Research on triple-shear yield criterion for materials. Eng. Mech. 2006, 23, 6–11. [Google Scholar]
- Zhang, L.; Gao, S.; Wang, Z.; Kong, L. Analysis of yield functions of marble under different loading and unloading stress paths. Chin. J. Rock Mech. Eng. 2014, 33, 2497–2503. [Google Scholar]
- Niu, J.; Liu, G.; Tian, J.; Meng, L.-P. Comparison of yield strength theories with experimental results. Eng. Mech. 2014, 31, 181–187. [Google Scholar]
- Yu, M. Twin shear stress yield criterion. Int. J. Mech. Sci. 1983, 25, 71–74. [Google Scholar] [CrossRef]
- Yu, M.; He, L.; Song, L. Twin shear stress strength theory and its promotion. Sci. China 1985, 28, 1113–1120. [Google Scholar]
- Yu, M. Twin-Shear Theory and Its Applications; Science Press: Beijing, China, 1998. (In Chinese) [Google Scholar]
- Yu, M.; Ma, G.; Li, J. Structural Plasticity; Zhejiang University Press: Hangzhou, China, 2009. (In Chinese) [Google Scholar]
- Chen, L.; Sheng, G.; Chen, G. Investigation of impact dynamics of roof bolting with passive friction control. Int. J. Rock Mech. Min. Sci. 2014, 70, 559–568. [Google Scholar] [CrossRef]
- Chen, G.; Huang, L.; Chen, L.B.; Chang, J.-Y. Intelligent diagnosis of bolting systems under uncertain/dynamic impact. Microsyst. Technol. 2014, 20, 1733–1737. [Google Scholar] [CrossRef]
- Chen, G.S.; Chen, G.; Chen, L. Characterization of Dynamic Properties of Roof Bolts and their Applications. Adv. Mater. Res. 2014, 875–877, 599–604. [Google Scholar]
- Wang, H.; Zhang, D.; Yang, J. Analysis on the dynamic effect of main roof’s fracture and rotation and its application. Coalmine Saf. 2011, 42, 153–156. [Google Scholar]
- China Academy of Building Research. JGJ 55-2011, Specification for Mix Proportion Design of Ordinary Concrete; China Architecture & Building Press: Beijing, China, 2011. (In Chinese) [Google Scholar]
- Wang, H.; Zhang, D.; Fan, G. Structure effect of a soft-hard backfill wall in gob-side roadway. Min. Sci. Technol. 2011, 21, 313–318. [Google Scholar]
Figure 1.
Schematic diagram of gob-side entry (GSE).
Figure 1.
Schematic diagram of gob-side entry (GSE).
Figure 2.
Structural model of the artificial side. a: width, b: height, θ: rotating angle of main roof, p: load.
Figure 2.
Structural model of the artificial side. a: width, b: height, θ: rotating angle of main roof, p: load.
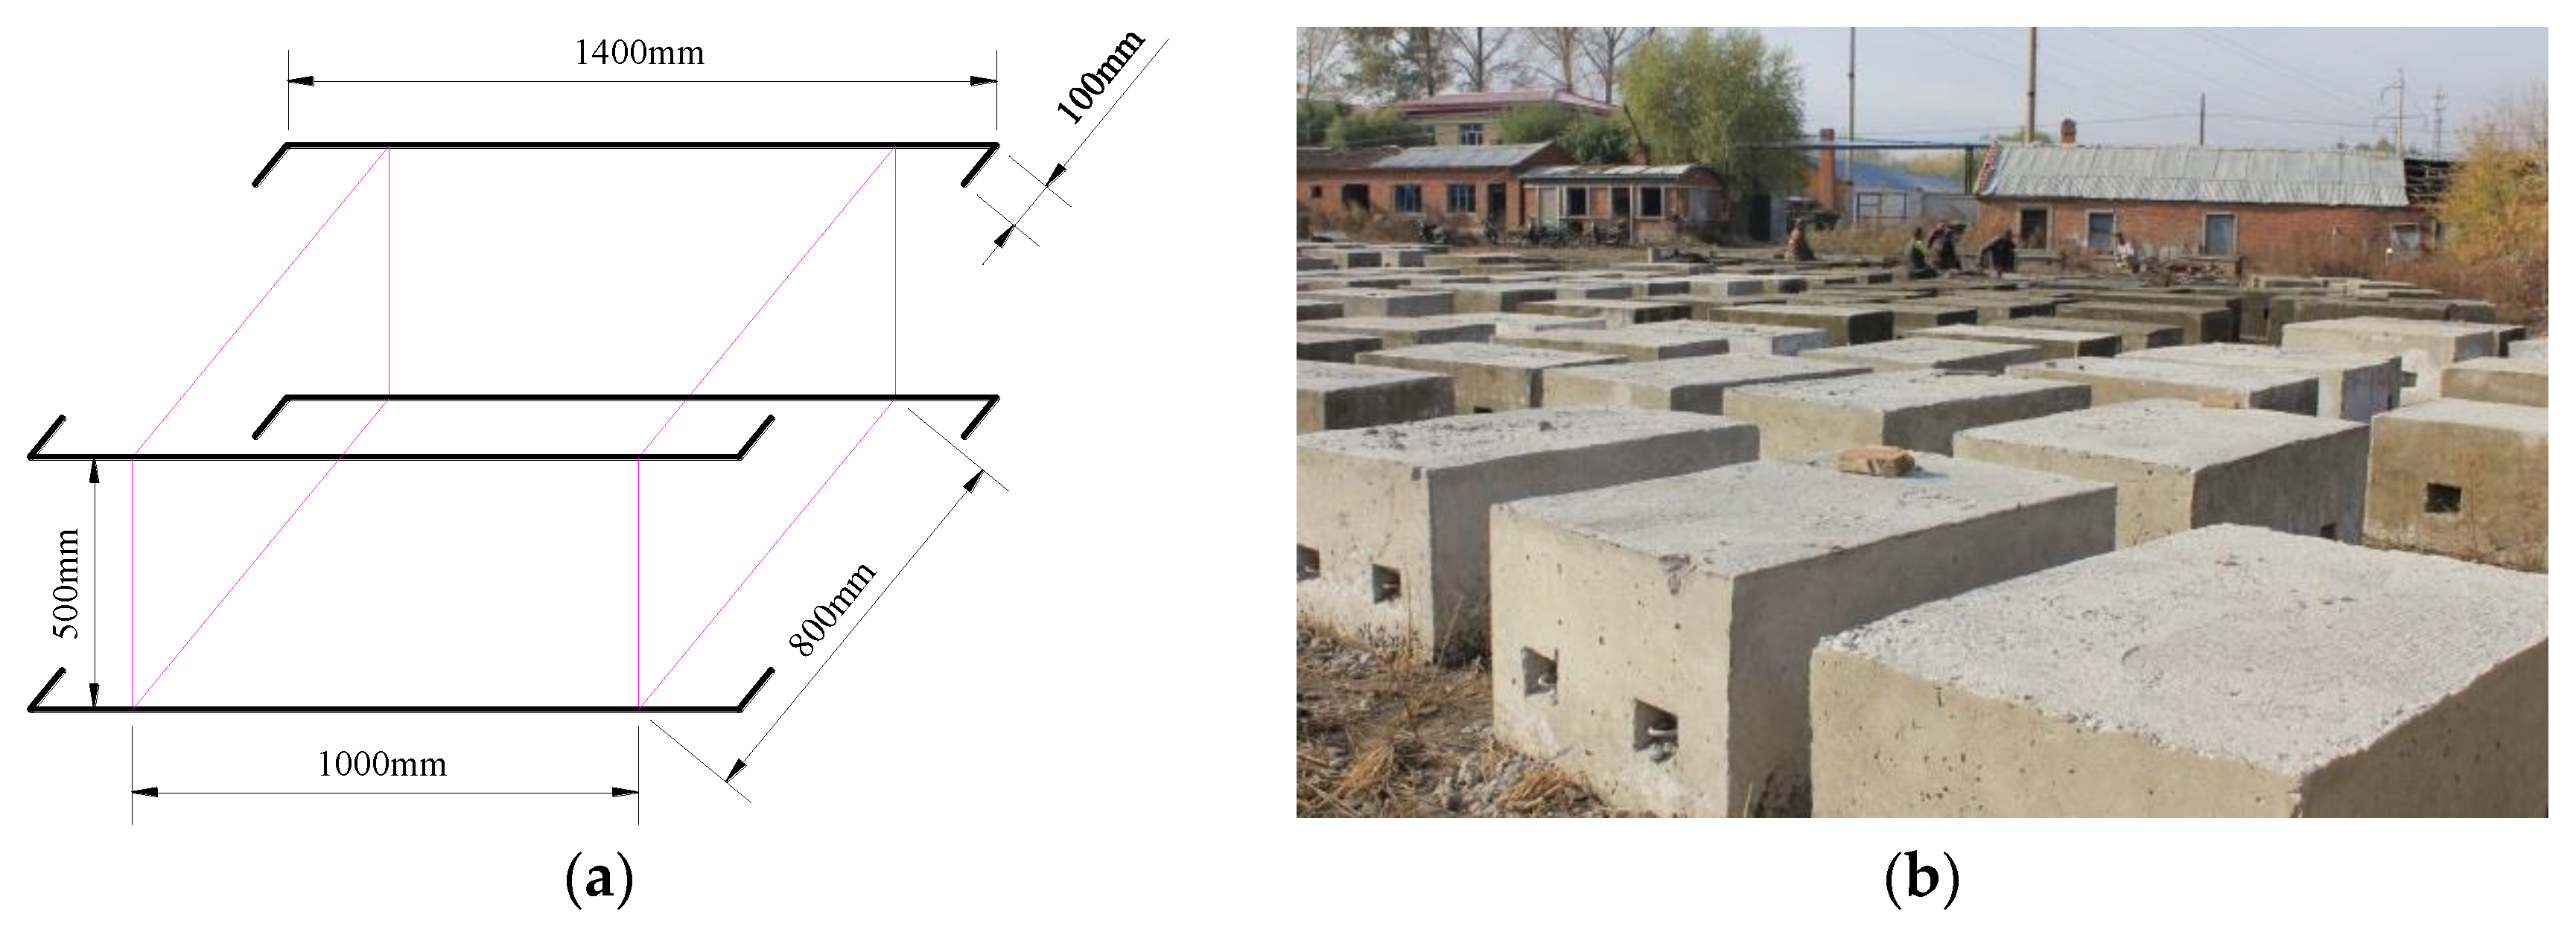
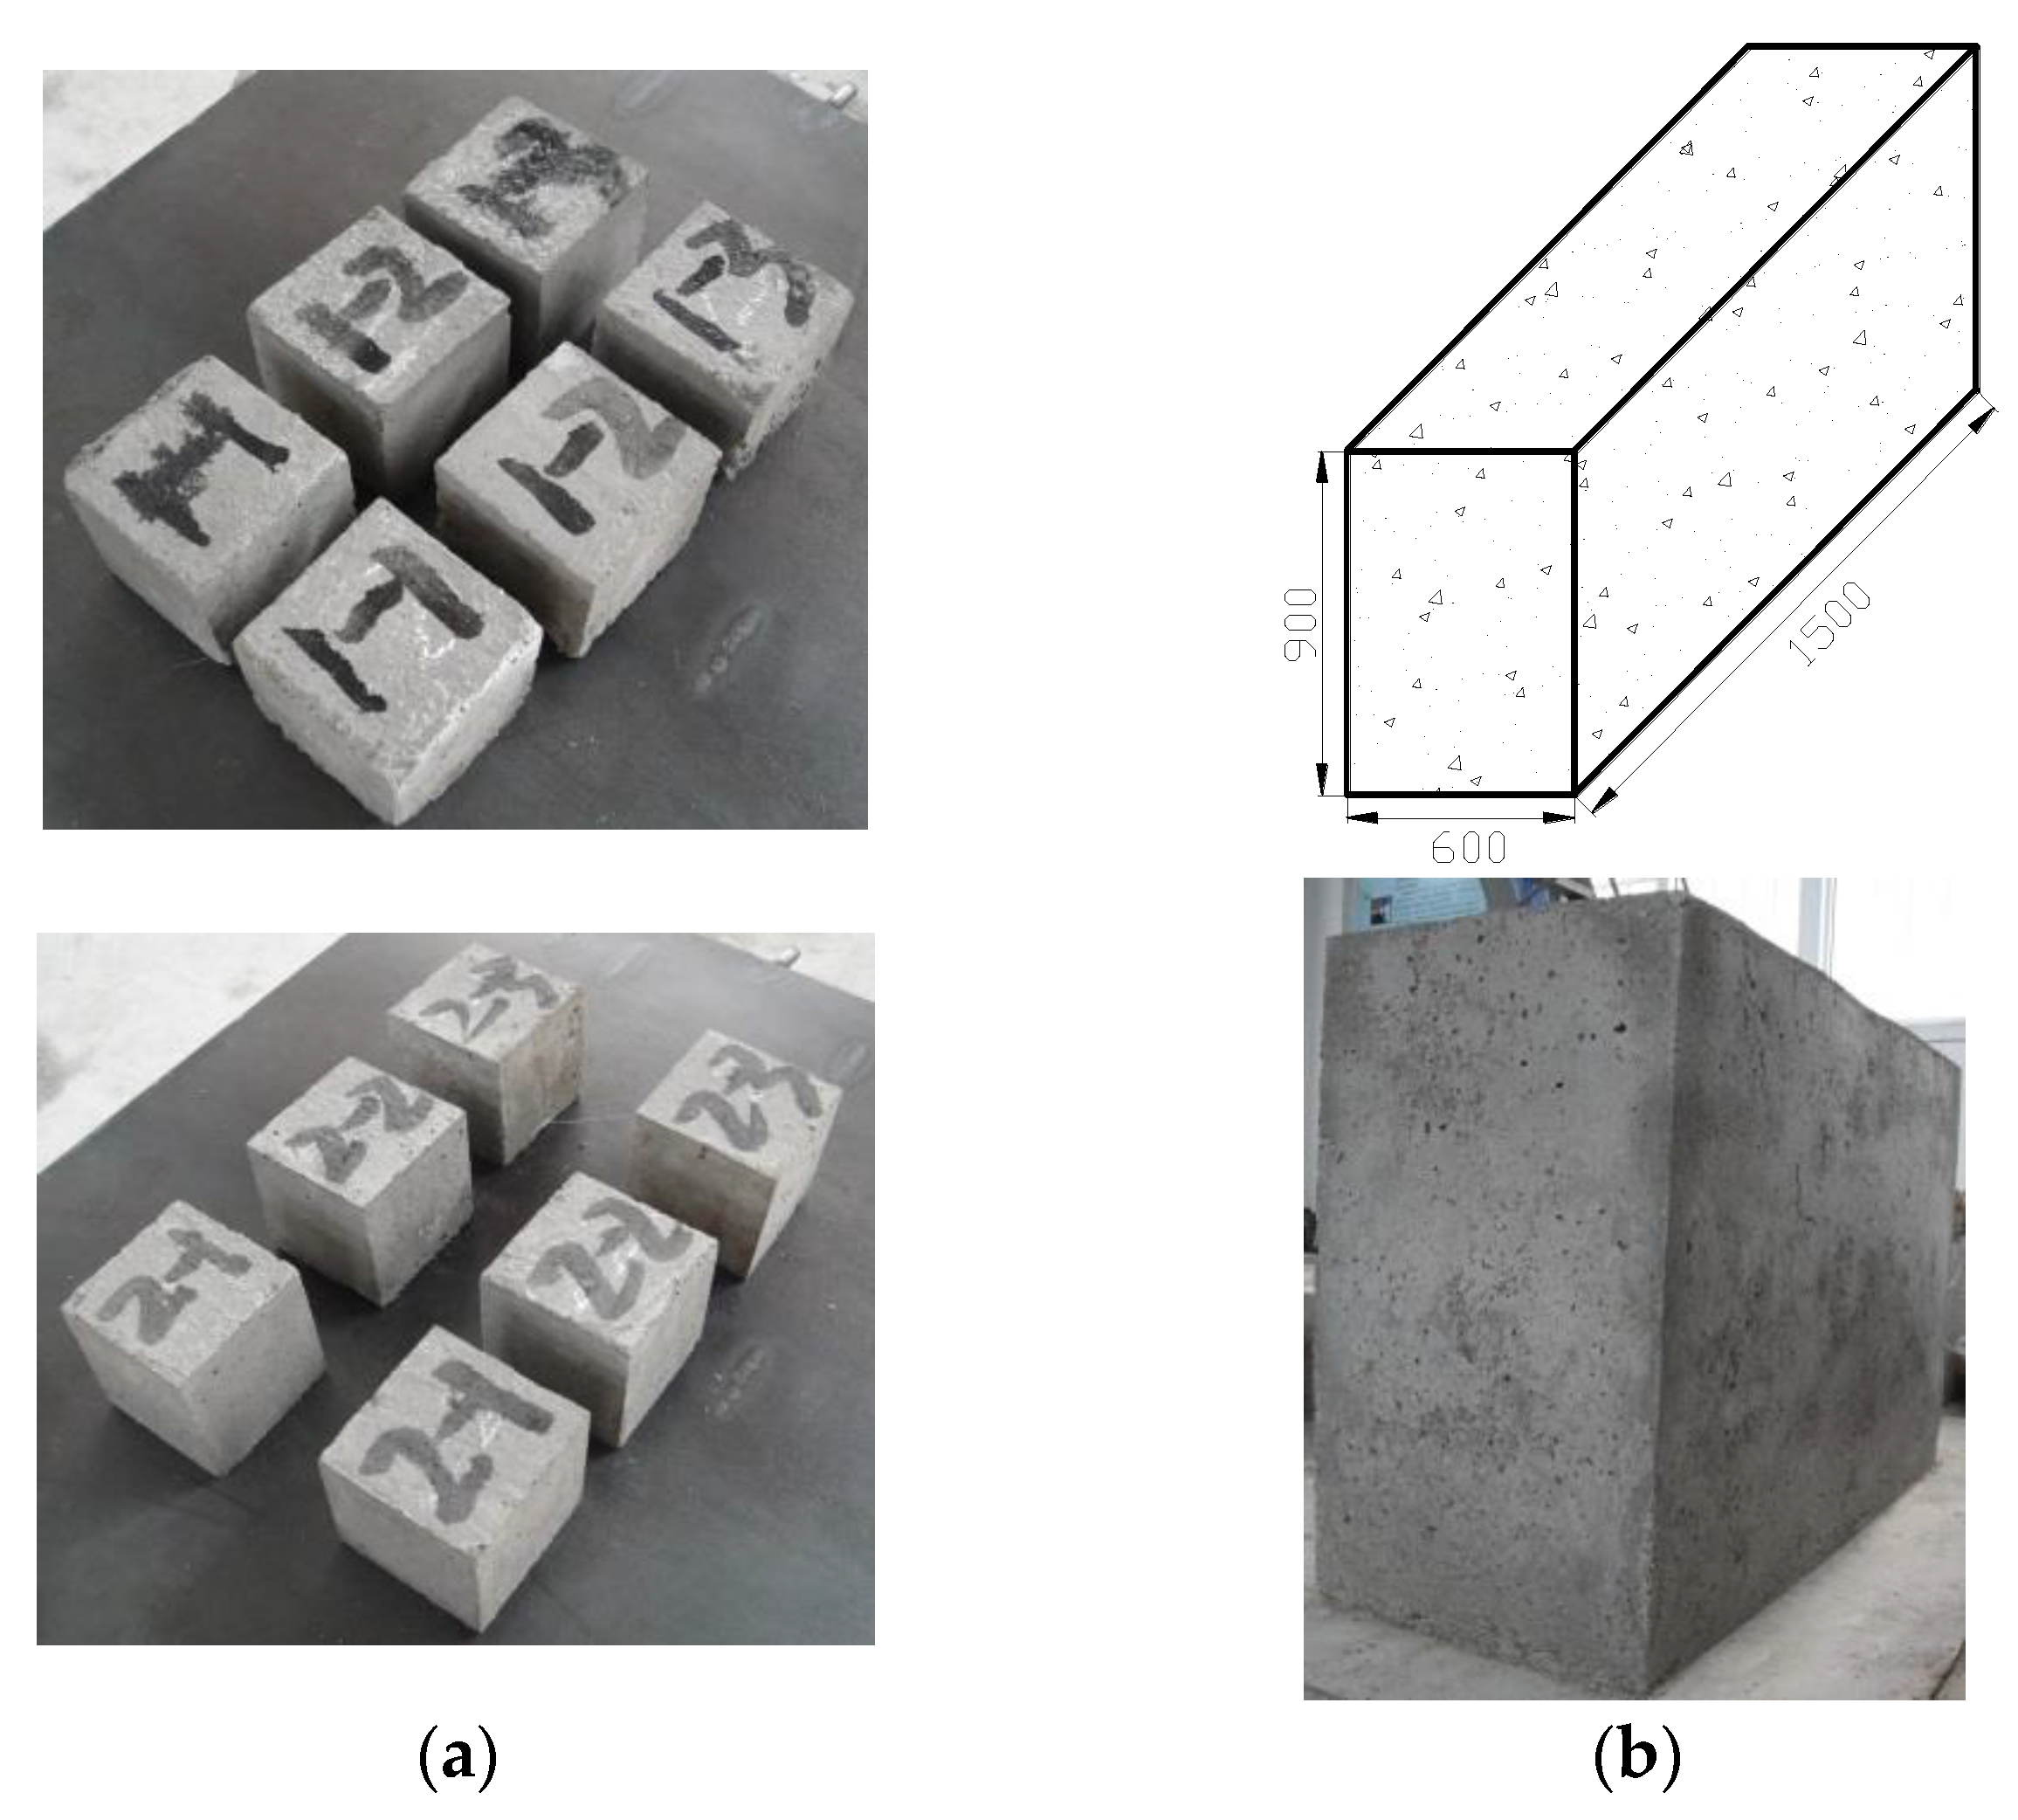
Figure 3.
Concrete specimens: (a) small-scale specimen; (b) large-scale specimen.
Figure 3.
Concrete specimens: (a) small-scale specimen; (b) large-scale specimen.
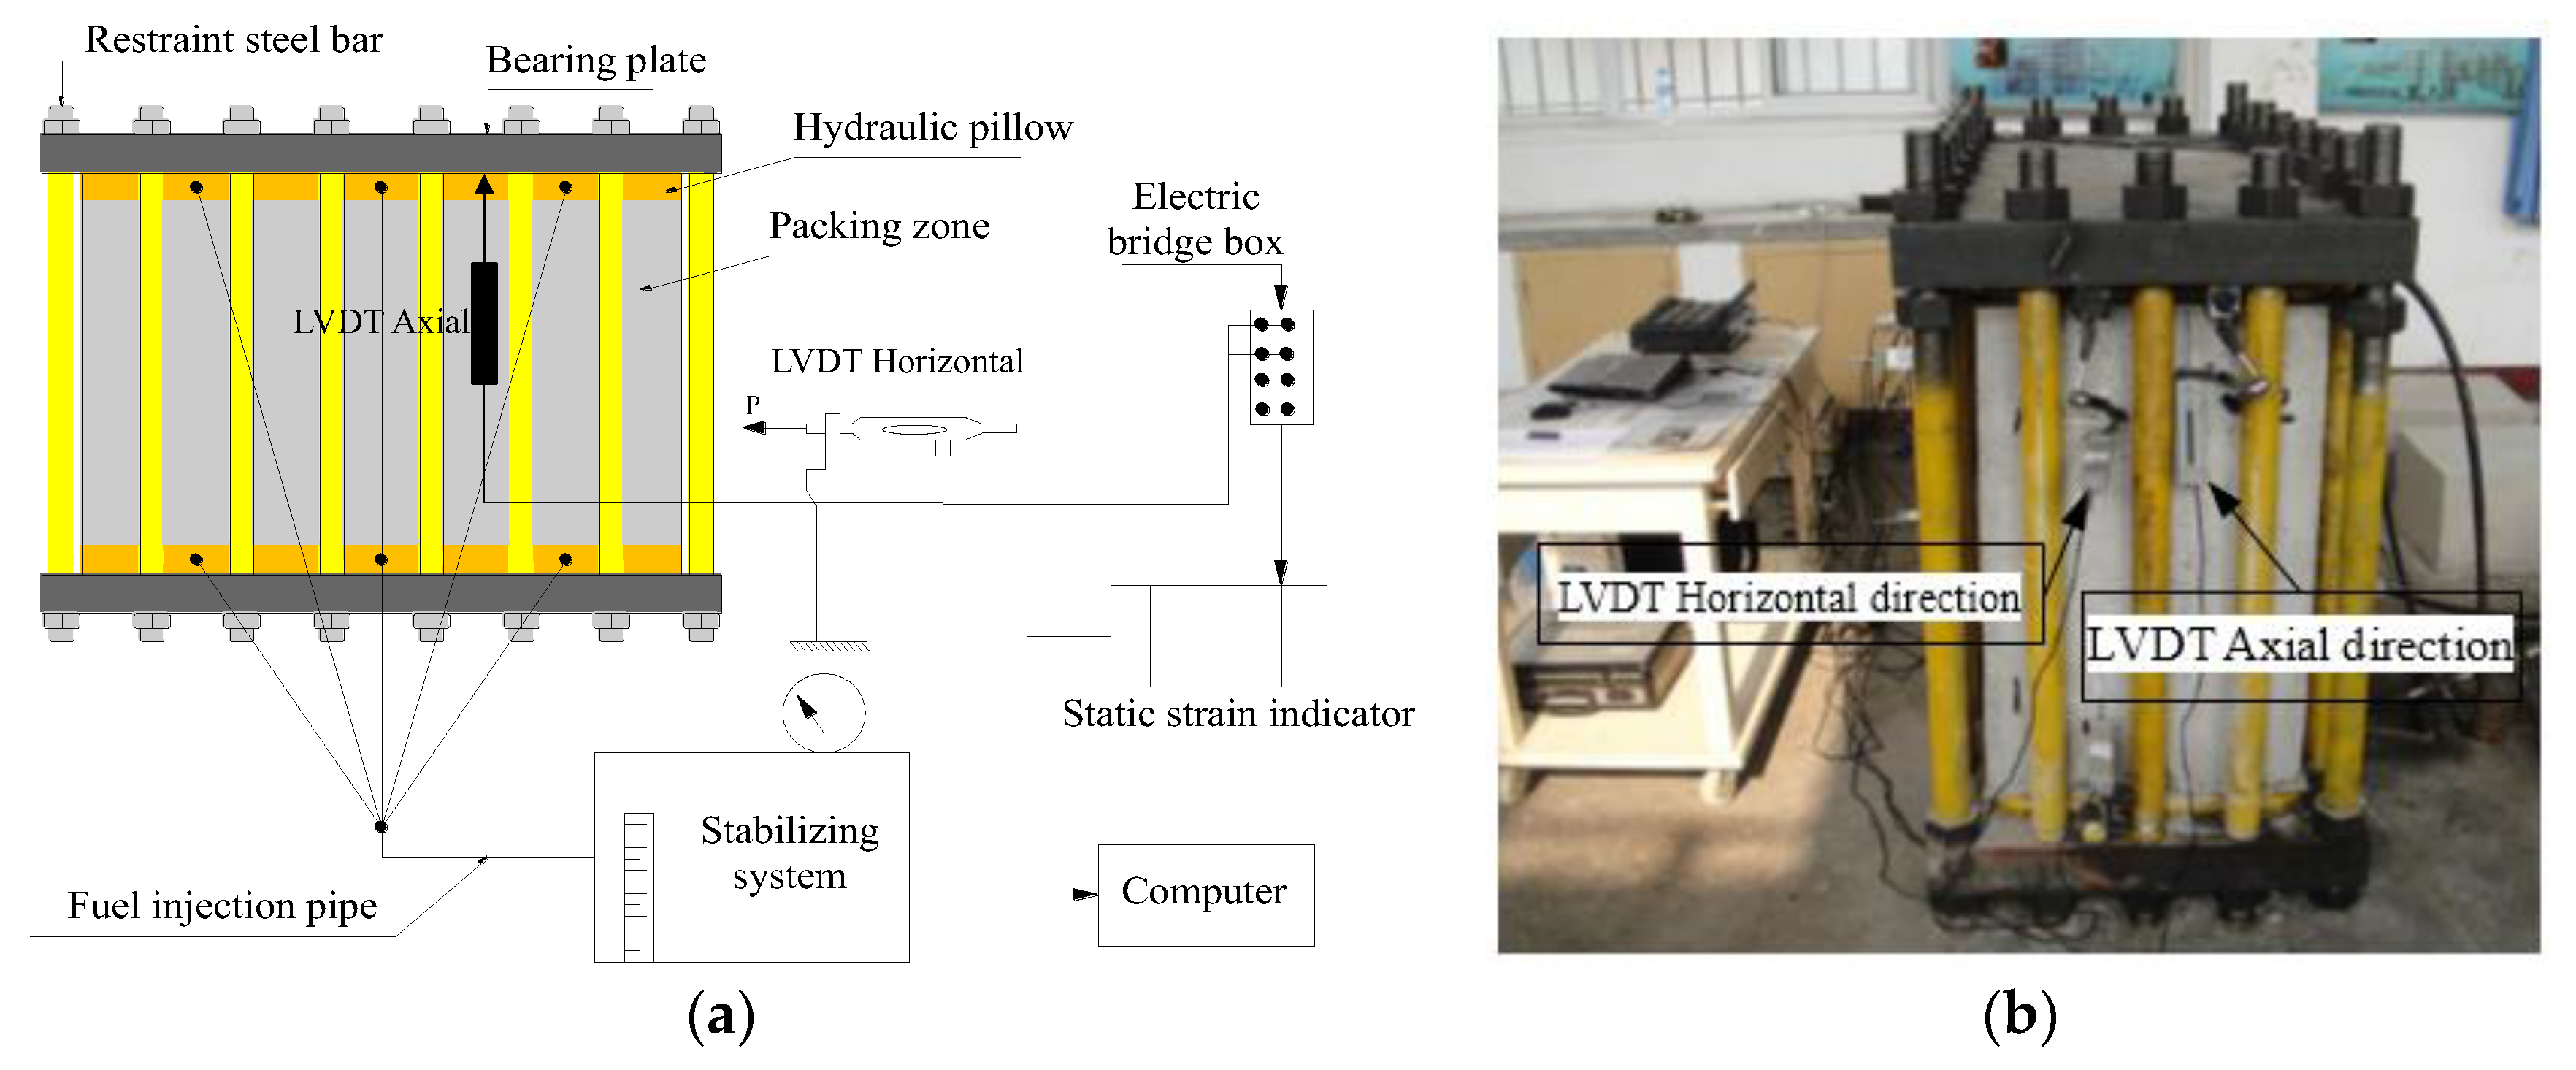
Figure 4.
The uniaxial compression failure experiment system. (a) Schematic diagram of experiment system; (b) Material object of experiment system.
Figure 4.
The uniaxial compression failure experiment system. (a) Schematic diagram of experiment system; (b) Material object of experiment system.
Figure 5.
X-shaped failure pattern of small-scale specimen.
Figure 5.
X-shaped failure pattern of small-scale specimen.
Figure 6.
Failure characteristics of large-scale specimen.
Figure 6.
Failure characteristics of large-scale specimen.
Figure 7.
Failure characteristics of a test specimen.
Figure 7.
Failure characteristics of a test specimen.
Figure 8.
Variation of maximum shear stress of small-scale specimen. (a) loading step 1; (b) loading step 3; (c) loading step 5; (d) loading step 7; (e) loading step 9; (f) loading step 11.
Figure 8.
Variation of maximum shear stress of small-scale specimen. (a) loading step 1; (b) loading step 3; (c) loading step 5; (d) loading step 7; (e) loading step 9; (f) loading step 11.
Figure 9.
Variation of maximum shear stress of large-scale specimen. (a) loading step 1; (b) loading step 3; (c) loading step 5; (d) loading step 7; (e) loading step 9; (f) loading step 11.
Figure 9.
Variation of maximum shear stress of large-scale specimen. (a) loading step 1; (b) loading step 3; (c) loading step 5; (d) loading step 7; (e) loading step 9; (f) loading step 11.
Figure 10.
Stereogram of the iso-surface of large-scale specimen. (a) Maximum shear stress; (b) Maximum principal stress.
Figure 10.
Stereogram of the iso-surface of large-scale specimen. (a) Maximum shear stress; (b) Maximum principal stress.
Figure 11.
Stress analysis of the specimen.
Figure 11.
Stress analysis of the specimen.
Figure 12.
Space aliquot body. (a) Cube unit; (b) Unit body of maximum shear stress; (c) Orthogonal octahedron.
Figure 12.
Space aliquot body. (a) Cube unit; (b) Unit body of maximum shear stress; (c) Orthogonal octahedron.
Figure 13.
Bolt-type reinforcements of the artificial side. (a) Anchor bolt; (b) Bolt; (c) Anchor bar.
Figure 13.
Bolt-type reinforcements of the artificial side. (a) Anchor bolt; (b) Bolt; (c) Anchor bar.
Figure 14.
Stereogram of the stress distribution in reinforced large-scale specimen. (a) Maximum shear stress; (b) Maximum principal stress.
Figure 14.
Stereogram of the stress distribution in reinforced large-scale specimen. (a) Maximum shear stress; (b) Maximum principal stress.
Figure 15.
Layout of the working face.
Figure 15.
Layout of the working face.
Figure 16.
Section of the GSE.
Figure 16.
Section of the GSE.
Figure 17.
Build-up of artificial side. (a) Anchor bar framework; (b) Large concrete blocks.
Figure 17.
Build-up of artificial side. (a) Anchor bar framework; (b) Large concrete blocks.
Figure 18.
Deformation due to the first mining. (a) Large deformation at 180 m behind working face; (b) Stabilization with shotcreting.
Figure 18.
Deformation due to the first mining. (a) Large deformation at 180 m behind working face; (b) Stabilization with shotcreting.
Figure 19.
Deformation due to the second mining. (a) Partial roadway; (b) Whole roadway.
Figure 19.
Deformation due to the second mining. (a) Partial roadway; (b) Whole roadway.
Table 1.
Concrete mixture ratio scheme.
Table 1.
Concrete mixture ratio scheme.
| Strength (MPa) | Density of Materials (kg·m−3) | Water-Cement Ratio |
|---|
| Water | Cement | Sand | Pebble |
|---|
| 10 | 180 | 230 | 780 | 1240 | 0.78 |
Table 2.
Mechanical parameters for numerical analysis.
Table 2.
Mechanical parameters for numerical analysis.
| Bulk Modulus (GPa) | Poisson Ratio | Shear Modulus (GPa) | Density (kN/m3) | Internal Friction Angle (°) | Cohesion (MPa) |
|---|
| 35 | 0.23 | 23 | 24 | 40 | 22 |
© 2016 by the authors; licensee MDPI, Basel, Switzerland. This article is an open access article distributed under the terms and conditions of the Creative Commons Attribution (CC-BY) license (http://creativecommons.org/licenses/by/4.0/).


 and
and 


