1. Introduction
Concrete is a major construction material that emits a large amount of substances with environmental impacts during its entire life cycle (production process, construction, maintenance, dismantlement, and scrapping).
Accordingly, technologies for the assessment of and reduction in environmental impacts of concrete from the perspective of life cycle assessment (LCA) must be developed. At present, the studies on LCA of greenhouse gas emission from concrete are being carried out globally as a countermeasure against climate change. However, the studies on the impact of the substances emitted in the concrete production process on acidification and eutrophication are insufficient. The substances emitted into the air and water during concrete production have impacts not only on global warming, but also on acidification and eutrophication [
1]. Acidification is an environmental problem caused by acidified rivers/streams and soil due to anthropogenic air pollutants such as SO
2, NH
3, and NO
x. Acidification increases mobilization and leaching behavior of heavy metals in soil and exerts adverse impacts on aquatic and terrestrial animals and plants by disturbing the food web. Eutrophication is a phenomenon in which inland waters are heavily loaded with excess nutrients due to chemical fertilizers or discharged wastewater, triggering rapid algal growth and red tides.
Such acidification and eutrophication are the main causes of air pollution, red tide phenomena, and deterioration of reinforced concrete structures. Emissions such as NO
x and SO
2 come down to the ground as acid rain, mist, or snow to be absorbed into lakes, rivers, and soil. As a result, surface water, ground water, and soil are acidified in ways that cause devastation of forests and many shelled animals. The increasing damage to reinforced concrete structures, which are highly resistant to alkali, is the result of chemical attack by nitrogen oxide (NO
x) and sulfite gas (SO
2) contained in acid rain and snow. More specifically, the water pollution caused by the very large amount of concrete used for the four large river refurbishment projects in Korea, started in 2008 under the justification of river ecosystem restoration [
2], has become a serious social problem.
Accordingly, in this study, an LCA technique was proposed to assess the impact of the substances emitted during the concrete production process on acidification and eutrophication, in accordance with the standards of ISO 14044 [
3], 21930 [
4], and 13315 [
5].
The substances emitted during the concrete production process were analyzed. Derived through the analysis, the main substances that had an impact on acidification and eutrophication were determined. Acidification and eutrophication were analyzed for 24 MPa concrete using the main substances deduced to have such impacts. In addition, the analysis was carried out by evaluating acidification and eutrophication according to increase in the mixing ratios of ground-granulated blast-furnace slag (GGBS) and recycled aggregate (RA) during concrete mixing. Based on these findings, a way to reduce acidification and eutrophication from the concrete production process was developed and presented here.
2. Review of Environmental Impact According to Concrete Production
Concrete is a construction material comprised of normal cement, mixing water, and admixture. For normal cement (the main raw material) in particular, a large amount of energy is used during collection of limestone and clay and production of clinker, the processes during which environmental impact substances are emitted. Also, soil erosion and destruction of ecosystems is caused by collection (surface mining) of natural aggregate.
Substances with environmental impacts are also emitted due to the energy consumed by the equipment used in the process of transporting the raw materials (ordinary cement and aggregate) to a concrete factory. In particular, air pollution and water pollution may be caused by combustion of the energy sources used in batch plants and concrete manufacturing facilities, as well as by the discharged sludge waste and wastewater.
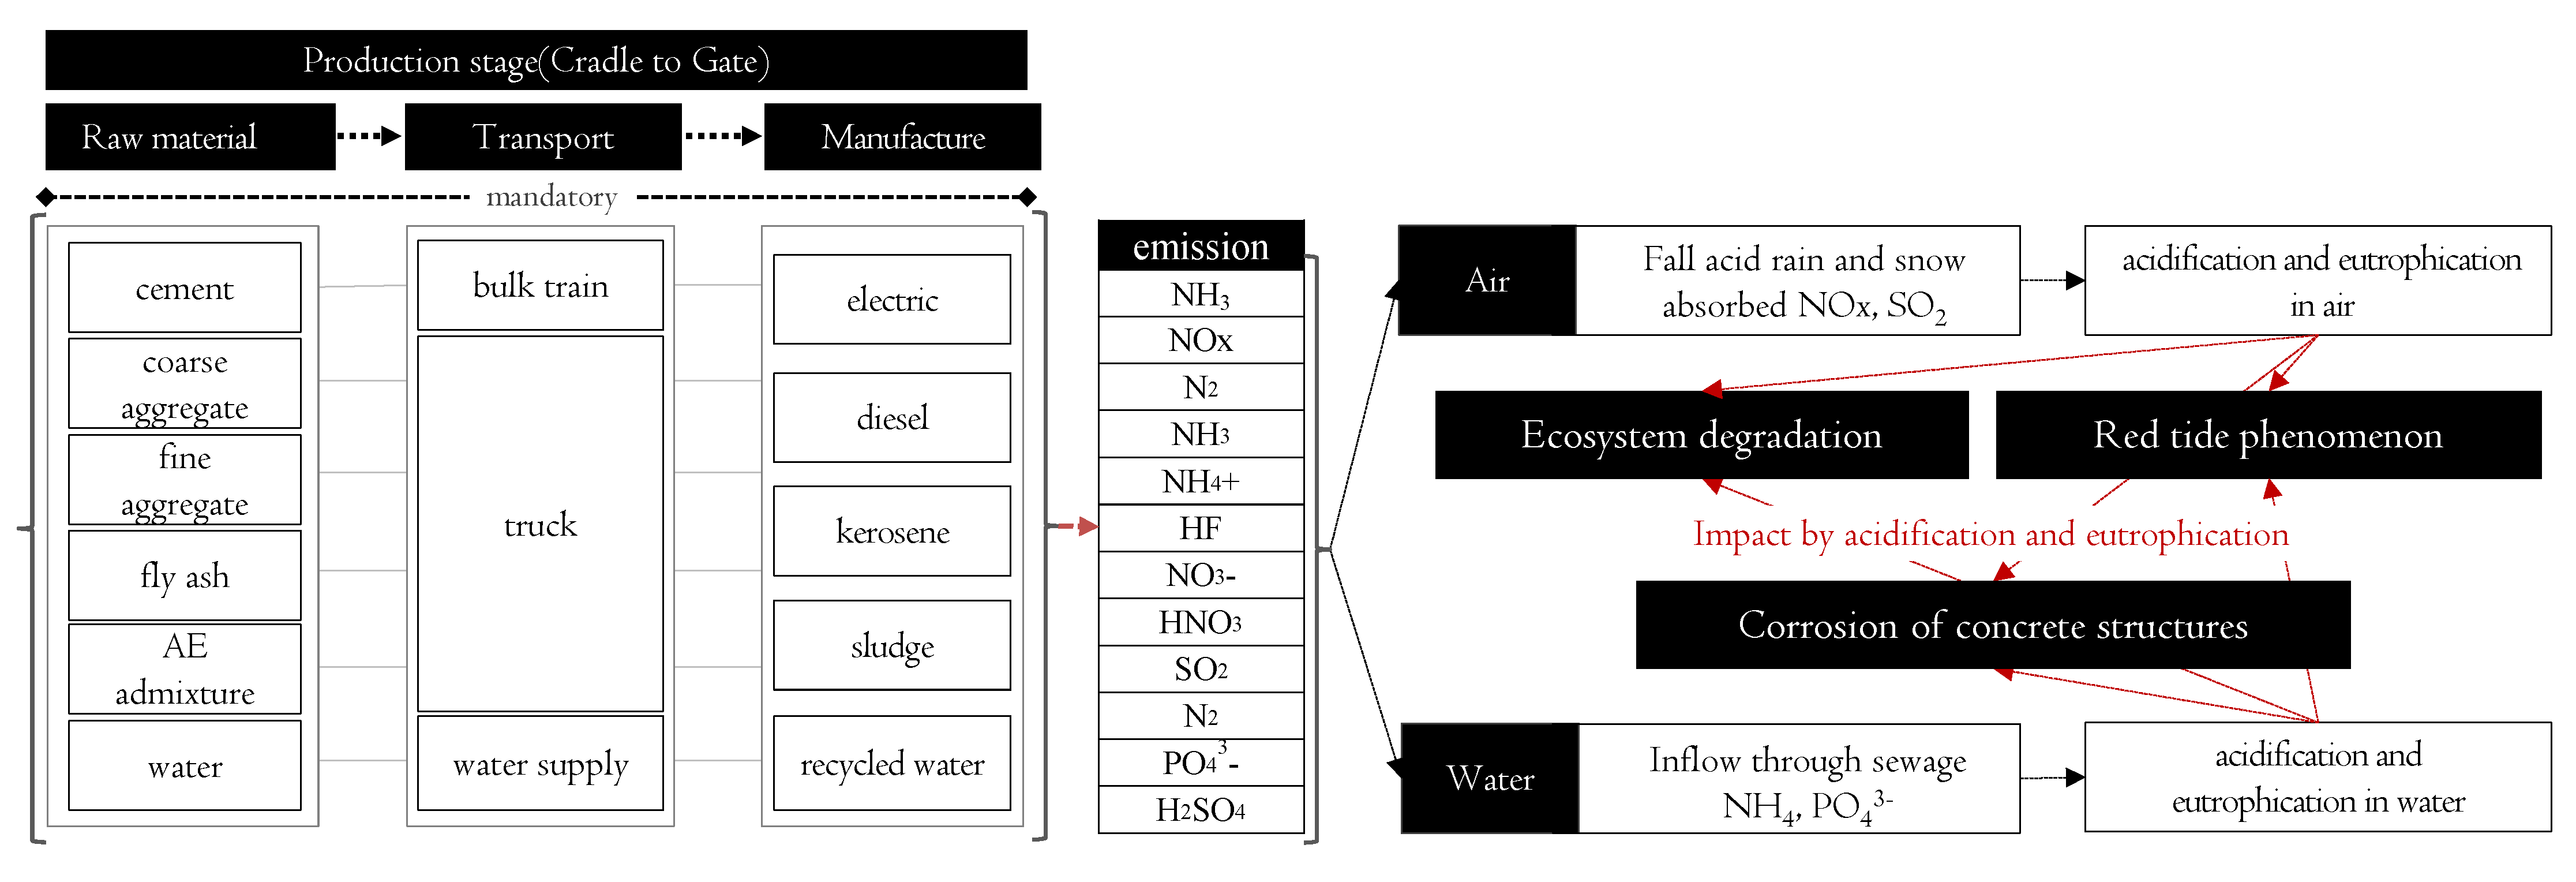
Figure 1 shows the mechanism for the impact of the substances emitted in the concrete production process on acidification and eutrophication. NO
x and SO
2 emitted into the atmosphere returns to the ground in precipitation (rain, snow, mist,
etc.). NO
x and SO
2 increase the hydrogen ion concentration in soil, streams, and oceans, and reduce their pH (they become more acidic). This increases leaching of heavy metals and adverse impacts on ecosystems, such as the food supply and nutrition of algae, plants, and fishes, and the body coverings (shells and exoskeletons) of many other animals. Moreover, NH
3 and PO
43− flow into ground water through the sewage systems of concrete factories. As NH
3 and PO
43− increase in an ecosystem, the activities of microorganisms also rise, causing increased consumption of oxygen. As a result, rapid spikes in nutritive substances in underwater ecosystems cause red tides due to rapid reproduction of algae.
Also, the nitric acid, sulfuric acid, ammonia, and phosphorus discharged into the air and water systems gradually generate calcium carbonate (CaCO3) by chemically reacting with the alkaline calcium hydroxide in concrete. As the pH falls due to neutralization, the normally alkaline concrete becomes neutral. This makes the alkaline passive state coating unstable and allows corrosion of the rebar. Corrosion of the rebar is accelerated by water and air, which flow into the concrete as cracks form. The weakening of the tensile strength of the rebar results in deterioration of the durability of the reinforced concrete structure. For concrete, a construction material that is sensitive to the substances emitted that have such environmental impacts, categories of environmental impact assessment need to be selected from diverse perspectives. Assessing a single environmental impact may cause a misunderstanding about the environmental friendliness of concrete. The substances emitted during the concrete production process have impacts on the environment that include air pollution, water pollution, and generation of waste. From these arise environmental problems that include not only global warming, but also acidification and eutrophication.
The designers are forced to make estimates of CO2 emissions for concrete in ESD (environmentally sustainable design) based on conjecture rather than data.
Flower
et al. presented hard data collected from a number of quarries and concrete manufacturing plants so that accurate estimates can be made for concretes in ESD [
6].
Tait
et al. analyzed the overall environmental impact, with a particular focus on carbon dioxide (CO
2) emissions of three concrete mix designs: CEM I (100% PC content), CEM II/B-V (65% PC content, 35% Fly Ash (FA) content) and CEM III/B (30% PC content, 70 % ground-granulated blast-furnace slag (GGBS) content) [
7].
Huntzinger
et al. evaluated the environmental impact of four cement manufacturing processes: (1) the production of traditional Portland cement, (2) blended cement (natural pozzolans), (3) cement where 100% of waste cement kiln dust is recycled into the kiln process, and (4) Portland cement produced when cement kiln dust (CKD) is used to sequester a portion of the process-related CO
2 emissions. Also, Huntzinger
et al. presented a cradle-to-gate life cycle assessment of several cement products [
8].
To make clear the environmental damages and potential improvements of the Chinese cement industry, Chen
et al. conducted the detailed life cycle inventory (LCI) of cement manufacture with direct input and output in the boundary of the cement plant as well as corresponding transport [
9].
Chen
et al. proposed a hybrid life cycle assessment method based on national and provincial statistics to study pollutants generated by the cement industry in China, the impacts of these pollutants, and the potential for environmental improvement. Results showed that the key factors that contribute to overall environmental burden are the direct emissions of nitrogen oxides (NO
x), particulates, and carbon dioxide (CO
2) into the atmosphere, as well as the use of coal during cement production [
10].
Scott
et al. presented a cradle-to-gate framework for design engineers and concrete ready-mix producers to implement in an effort to optimize mixture designs across economic, environmental, and mechanical performance criteria. The framework was assessed through the examination of a newly constructed highway in South Georgia [
11].
Serres
et al. analyzed environmental impacts associated with mixing compositions of concrete made of waste materials by using LCA. Environmental performances of natural, recycled and mixed 20 mm concrete samples, formulated with the same mechanical strength regarding the functional unit, were evaluated. The LCA results are presented using various impact assessment methods, according to both EN 15804 and NF P 01-010 standards. Recycled samples present good environmental behavior, even if recycled materials (sand and aggregates) involve different operations (crushing against extraction,
etc.) [
12].
3. Methodology of Life Cycle Acidification and Eutrophication for Concrete
3.1. Goal and Scope Definition
This study proposed a concrete LCA (life cycle assessment) method including the definition of the goal and scope of concrete, inventory analysis, and impact analysis in compliance with the LCA method meeting the ISO standards. For the life cycle impact assessment (LCIA), the environmental impact categories of acidification potential (AP) and eutrophication potential (EP) were selected.
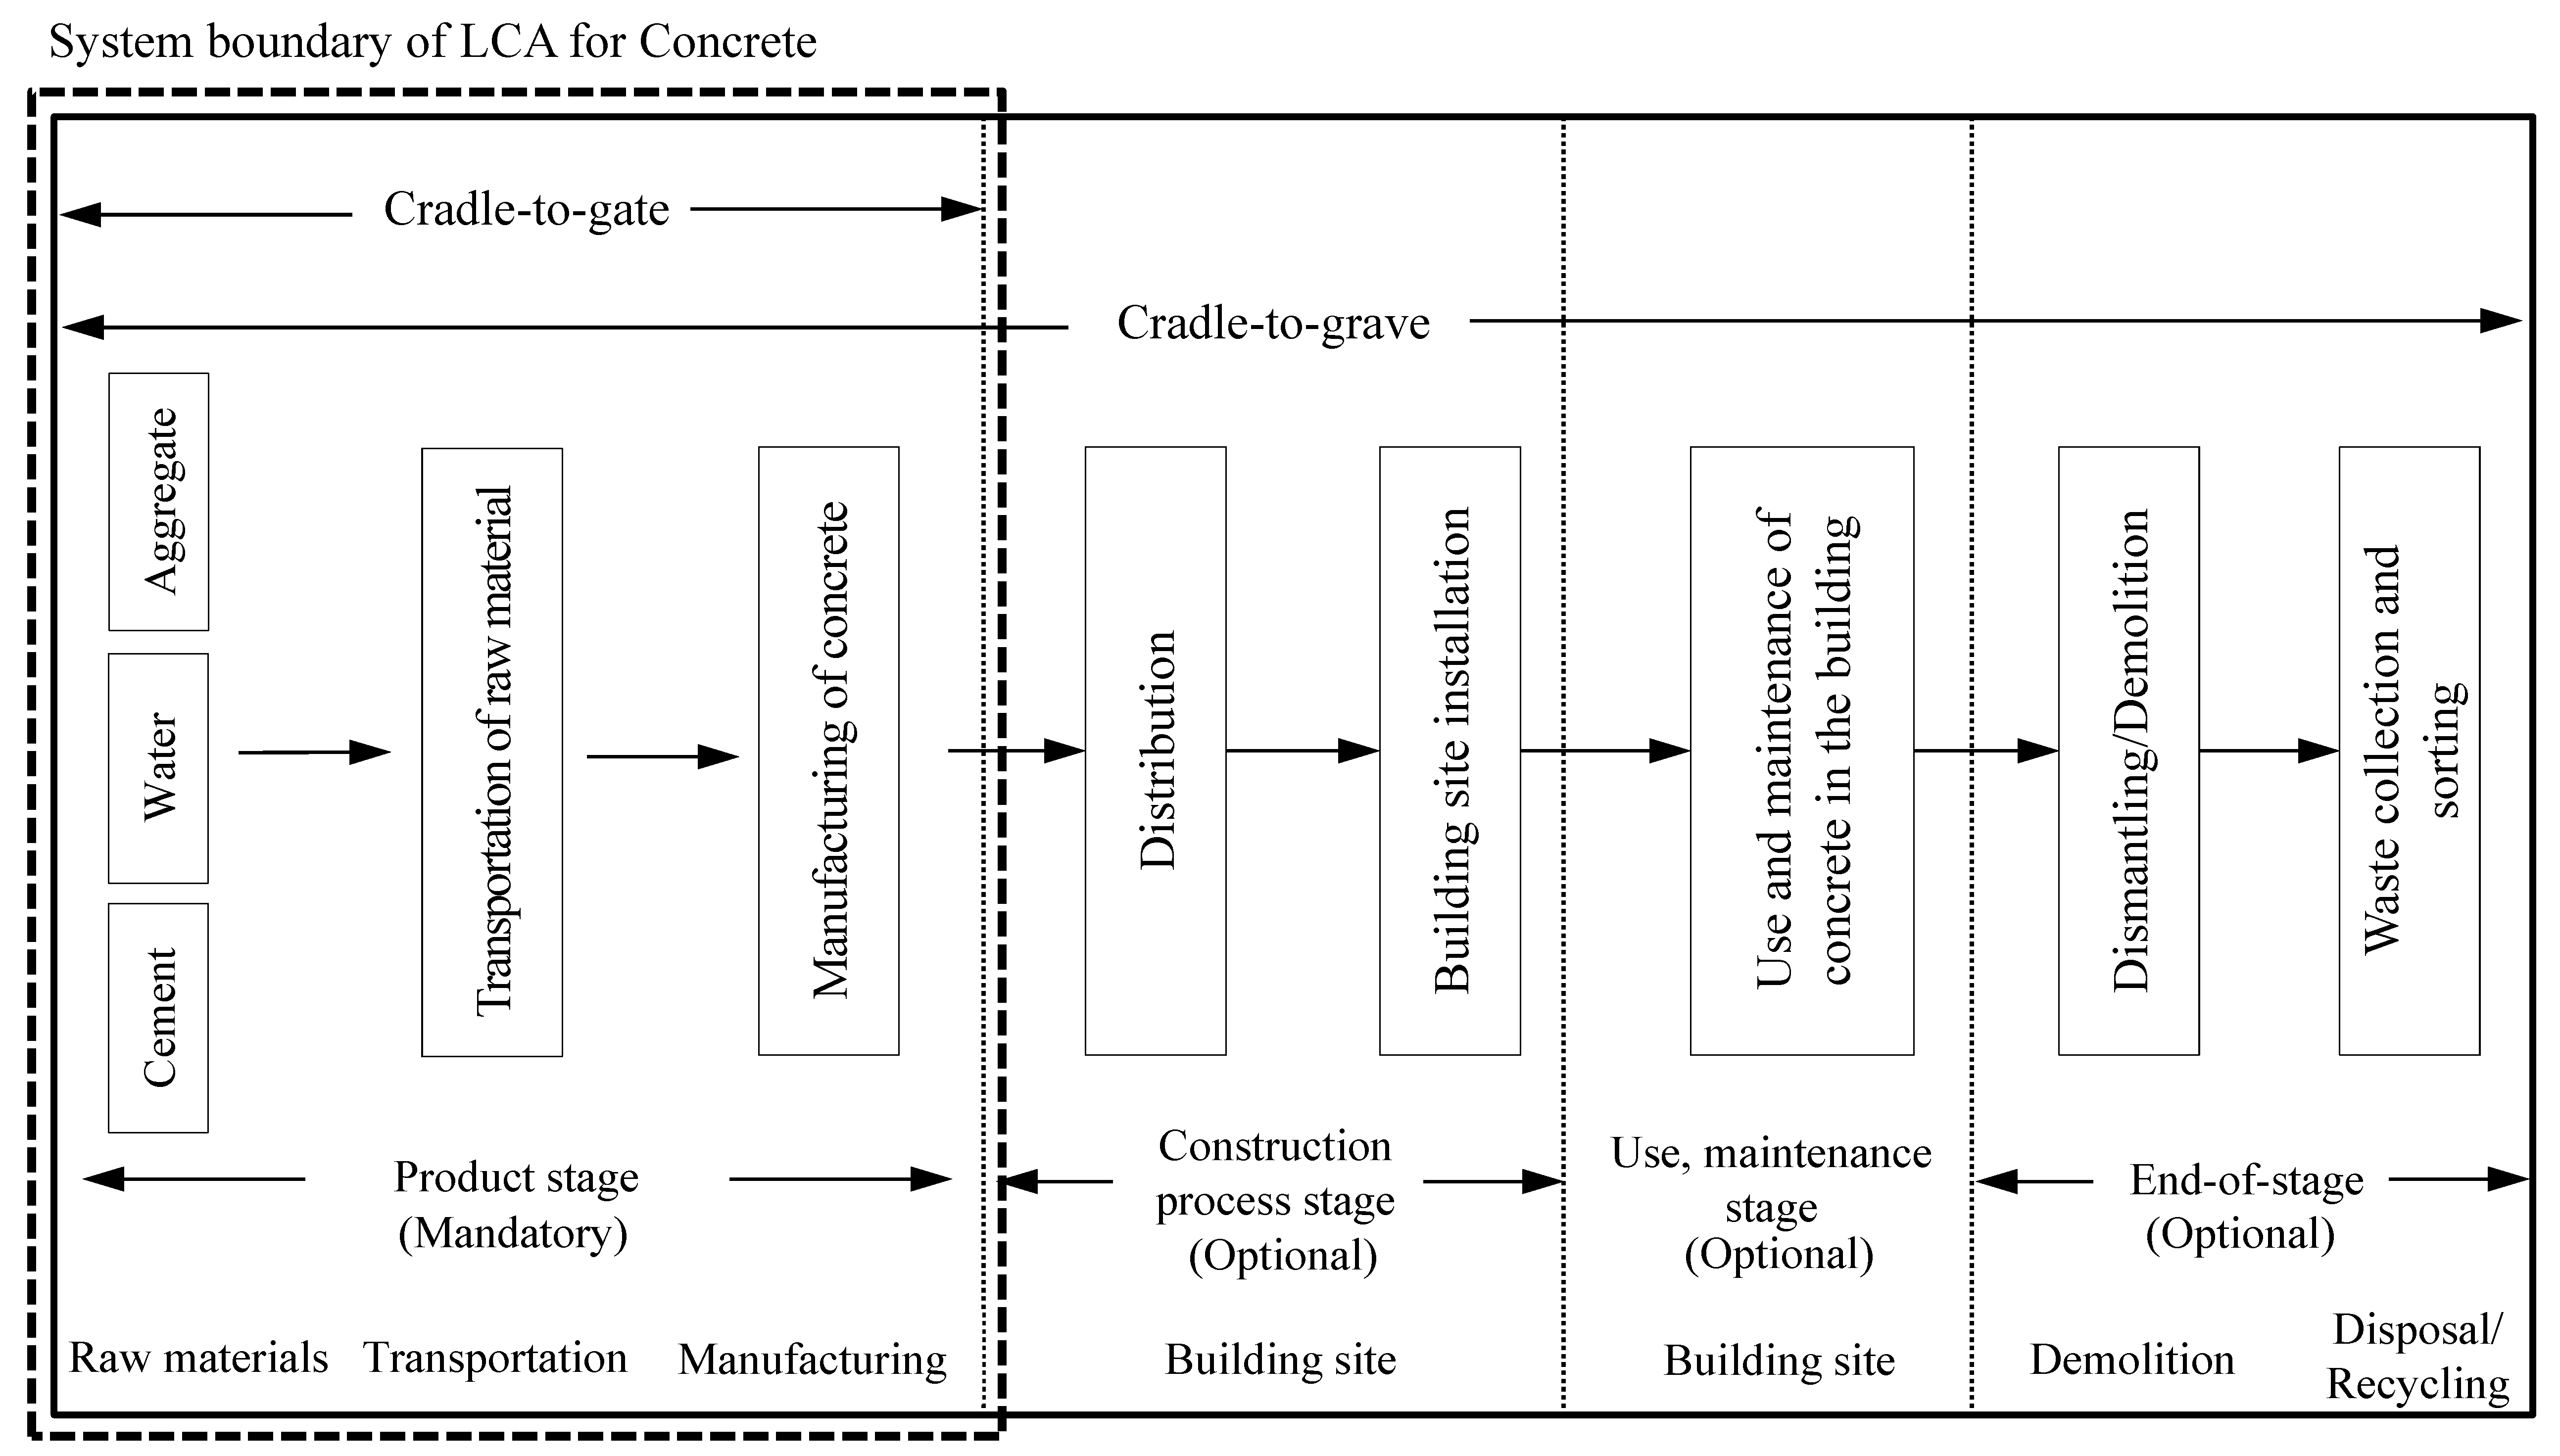
The 1 m
3 concrete was set as the functional unit on the basis of the main function to facilitate data management and application. As the system boundary for the concrete LCA, the product stage of concrete was selected, as shown in
Figure 2. In addition, concrete production steps were divided into raw material extraction, transportation, and manufacturing steps, and environmental impacts of the elements involved in each step on air and water systems were assessed [
13].
3.2. Inventory Analysis
Based on the life cycle assessment ranges (system boundary) of concrete, input factors and output factors such as energy, raw material, product, and waste were analyzed. To this end, as can be seen from
Table 1, LCI DB (life cycle index database) on each of the input materials and energy sources in concrete production was investigated.
LCI DB on the input materials and energy sources used in this life cycle assessment utilized the existing data of Korea’s Ministry of Land, Infrastructure, and Transport [
14] and Ministry of Environment [
15]. As LCI DB is different for each country, DB offered in one’s own country should be used. However, LCI DB on ground-granulated blast-furnace slag, fly ash, and admixture in Korea’s LCI DB has not been established yet. Therefore, the DB of ecoinvent [
16], an overseas LCI DB, was used.
3.3. Life Cycle Impact Assessment
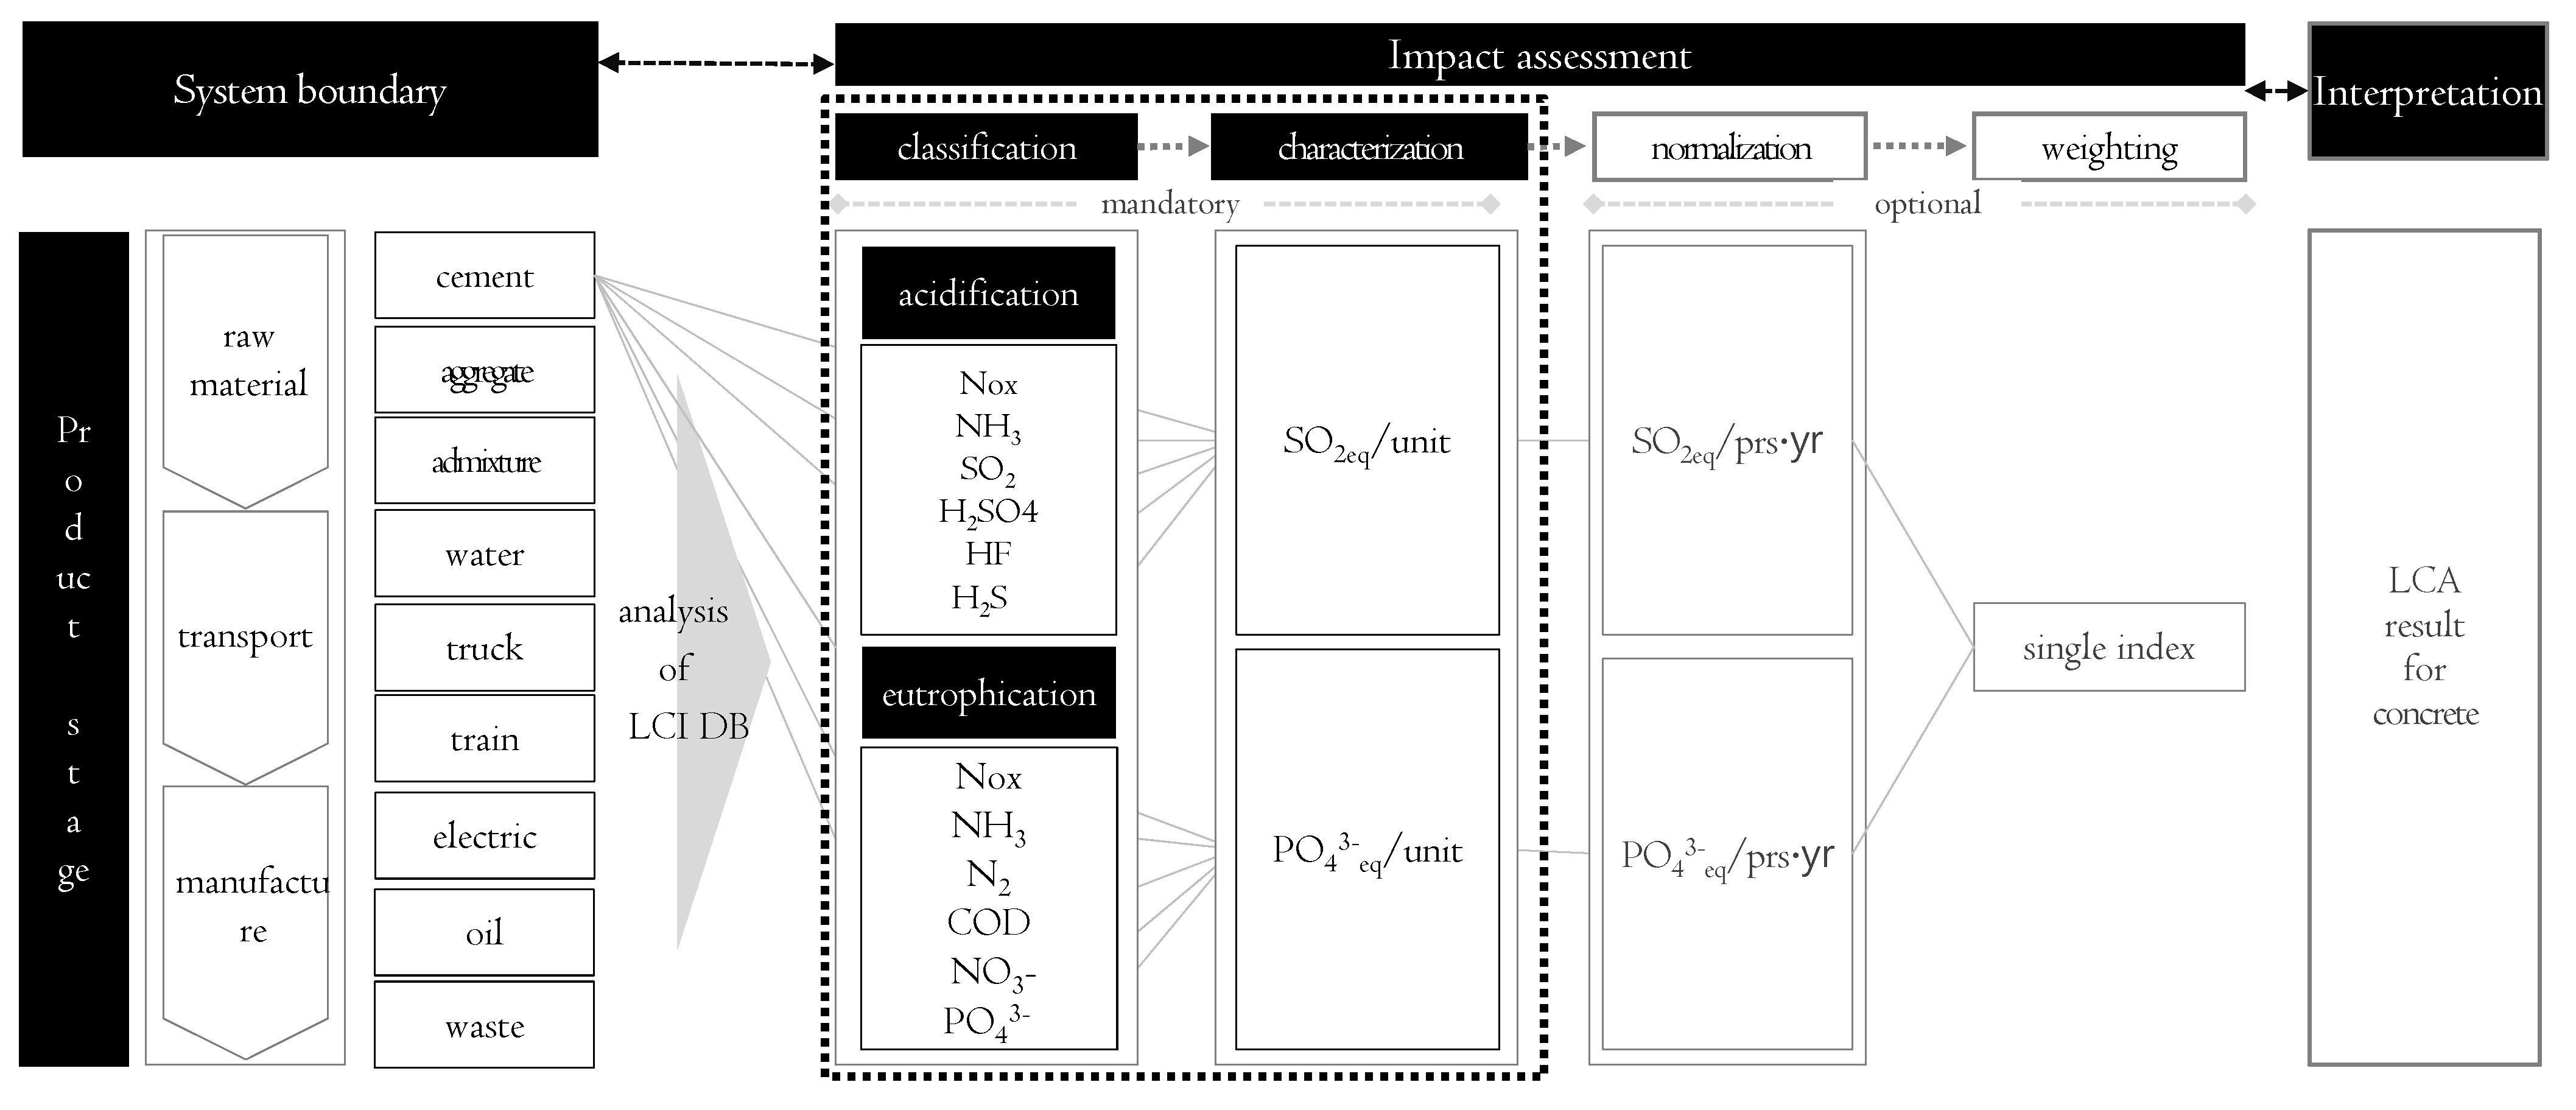
This paper presented the input and output elements of the energy, raw materials, products, and waste to the scope of concrete LCA as shown in
Figure 3.
According to ISO 14044, the classification and characterization steps are mandatory assessment steps, and the normalization and weighting steps may be optionally assessed depending on the assessment purpose. In this study, assessment was performed for the classification and characterization steps because concrete-related normalization and weighting factor for Korea are yet to be developed.
Classification is done by categorizing and compiling the inventory items according to the environmental impact categories. By linking the inventory items derived from the LCI database to the environmental impact categories and integrating them by category, the environmental impact of each inventory item can be clearly identified. For example, inventory items for AP are nitrogen oxide (NO
x), ammonia (NH
3), and hydrogen fluoride (HF), sulfuric acid (H
2SO
4), with sulfur dioxide (SO
2) as the standard substance, and their respective classifications based on the Korean LCI database for OPC are 7.18 × 10
−4 kg-NO
x/kg, 1.81 × 10
−8 kg-NH
3/kg, 1.33 × 10
−8 kg-HF/kg, 1.78 × 10
−7 kg-H
2S/kg, 5.64 × 10
−4 kg-SO
2/kg, 5.69 × 10
−14 kg-H
2SO
4/kg [
17].
Table 1 shows example classifications for OPC, coarse aggregate, diesel fuel among the LCI database classification items.
Acidification potential (AP) varies widely according to regional characteristics and atmospheric environments, and this research was applied to the AP index presented by Heijung
et al. and Hauschild
et al. [
18] and is applicable to all regional types. A total of inventory items linked to the acidification category, including sulfur dioxide (SO
2), hydrogen sulfide (H
2S), and hydrogen fluoride (HF), are expressed in terms of their standard substance SO
2. Likewise, the index proposed by Heijung
et al. and Hauschild
et al. was applied for the classification of the eutrophication potential (EP), with phosphate (PO
43−) used as the standard substance for a total of 11 inventory items including phosphate (PO
43−), ammonia (NH
3), and nitrogen oxides (NO
x) [
19].
Characterization is a process of quantifying the environmental loads of inventory items itemized for each category in the classification step.
In the classification step, inventory items are assigned to their respective environmental impact categories, but there is a limitation in quantifying the potential impacts of inventory items in common metrics due to different impact potentials. Category indicator results, i.e. characterization values, are calculated in the characterization step where the environmental load (=inventory data) of each inventory item is multiplied with the characterization factor (=impact potential) unique to the impact category concerned, and the resulting environmental loads thus converted into impacts are aggregated within each impact category to yield the overall environmental impact of that category. Equation (1) expresses this process:
Taking the acidification category of OPC as an example, which involves three inventory items in addition to SO2 (standard substance)—H2SO4, HF, and NH3—the acidification potential (AP) of H2SO4, HF, and NH3 are 1 kg-SO2/kg-SO2, 0.65 kg-SO2/kg-H2SO4, 1.6 kg-SO2/kg-HF, 1.88 kg-SO2/kg-NH3, respectively, as calculated by multiplying their environmental loads (index data) with the characterization factor of the acidification category of OPC.
The total environmental impacts (=category indicator) on the acidification of OPC can be then obtained by adding the AP of the inventory items involved.
Here, CI
i is the size of impact that all the list items (j) included in the impact category i have, on the impact category that they are included in. CI
i,j is the size of impact that the list item j has on impact category i, Load
j is the environmental load of the j
th list item, and eqv
i,j is the characterization coefficient value of j
th list item within impact category i.
The standard substance for assessing AP is SO
2. The category indicator of AP is expressed by Equation (2):
where Load(i) is the experimental load of the acidification inventory item (i) and AP(i) is the characterization factor of inventory item (i) of the acidification category.
The standard substance for EP is PO
43−. The category indicator of EP is expressed by Equation (3):
where Load(i) is the environmental load of the EP inventory item (i) and EP(i) is the characterization factor for the EP inventory item (i).
4. Deduction of Major Impact Substance
To determine which major substances in the concrete production process have impacts related to acidification and eutrophication, the LCI DB (life cycle index database) of the raw materials and energy used (e.g., normal cement, aggregate, admixture, oil, and electric power) were analyzed as shown in
Table 2 and
Table 3.
Also, the characterized values calculated were divided into those affecting ecological systems (air and water). The major substances with impacts that corresponded to 90% or more of the cut-off of the total value were determined.
The major substances with impacts on eutrophication were found to be NOx, NH3, N2, and NO3 in the case of air, and NH3, NH4+, COD, NO3−, HNO3, N2, PO43−, and NO2 in the case of water systems. The major substances with impacts on acidification were found to be NOx, NH3, HF, H2S, SO2, H2SO4, HCL, and SO3 in the case of air, and HF, H2S, H2SO4, and HCL in the case of water systems.
The major substances in cement (the main raw material of concrete) that impact eutrophication were found to be NOx, NH4, COD, NO3−, and PO43−, and those that impact acidification were found to be NOx, SO2, and H2SO4. The major substances in natural aggregate and recycled aggregate that have an impact on eutrophication were found to be NOx, NH4+, COD, and PO43−, and NOx was found to have an impact on acidification. The major substances in GGBS and fly ash that impact eutrophication were found to be NOx, NH4+, and PO43−, and those that impact acidification were found to be NOx and H2S.
The major substances in the mixing water and admixture that impact eutrophication were found to be NO
x, NO
3−, and PO
43−, and those that impact acidification were found to be NO
x, SO
2, and H
2S. The major substances in the energy sources related to electric power (e.g., diesel and kerosene) that impact eutrophication were found to be NO
x, NH
4+, COD, and PO
43−, and those that have an impact on acidification were found to be NO
x and SO
2 [
20].
Through this process, the major substances that impact eutrophication during the entire process of concrete production were deduced to be NOx and NH3 in the case of the air and NH4+, COD, NO3−, and PO43− in the case of water systems. The environmental emission load of each substance was 4.59 × 10⁻¹ kg NOx/kg, 4.23 × 10⁻⁵ kg NH3/kg, 3.33 × 10⁻⁴ kg NH4+/kg, 1.11 × 10⁻⁴ kg COD/kg, 7.17 × 10⁻⁵ kg NO3−/kg, and 9.6 × 10⁻³ kg PO43−/kg. These were found to be mostly attributable to oil, fly ash, and coarse aggregate.
The major substances impacting acidification were deduced to be NO
x and SO
2 in the case of the air, and H
2S and H
2SO
4 in the case of water systems [
21]. The environmental load emission of each substance was 3.15 kg NO
x/kg, 2.31 kg SO
2/kg, 3.49 × 10
−6 kg H
2S/kg, and 3.94 × 10
−9 kg H
2SO
4/kg, and these were found to be mostly attributable to oil, fly ash, and cement. In particular, NO
x was found to be a major impact substance that corresponded to the 90% cutoff (or higher) in relation to acidification and eutrophication for all the items analyzed, such as raw materials and energy sources.
5. Analysis of Life Cycle Acidification and Eutrophication
5.1. Method
Evaluation of 1 m
3 of concrete with a strength of 24 MPa produced by Concrete Manufacturer A (in Korea), was carried out using the acidification and eutrophication assessment technique for the entire life cycle of concrete. The production stage (cradle to gate) was selected as the scope of the LCA and the assessment information shown in
Table 4 was investigated. Also, the quantities of normal cement and natural aggregate usually mixed into the concrete were substituted with GGBS and recycled aggregate. The acidification and eutrophication impacts before and after substitution were compared in
Table 5. The mixing ratios of GGBS tested were 0, 10, 20, and 30%, and those of recycled aggregate were 0%, 20%, 30% and 40%, taking into consideration the law setting a mandatory amount of recycled aggregate that might be used [
22].
However, the energy consumption during transportation and manufacturing stages were assumed to be the same. As shown in
Table 6, the Korean and overseas LCI DBs were applied to concrete raw materials, energy, and transportation.
5.2. Result
Acidification and eutrophication were assessed for the entire life cycle of the concrete, as shown in
Table 7 and
Table 8. In addition, acidification and eutrophication results were compared according to the mixing ratio of admixture (%) and the mixing ratio of recycled aggregate (%).
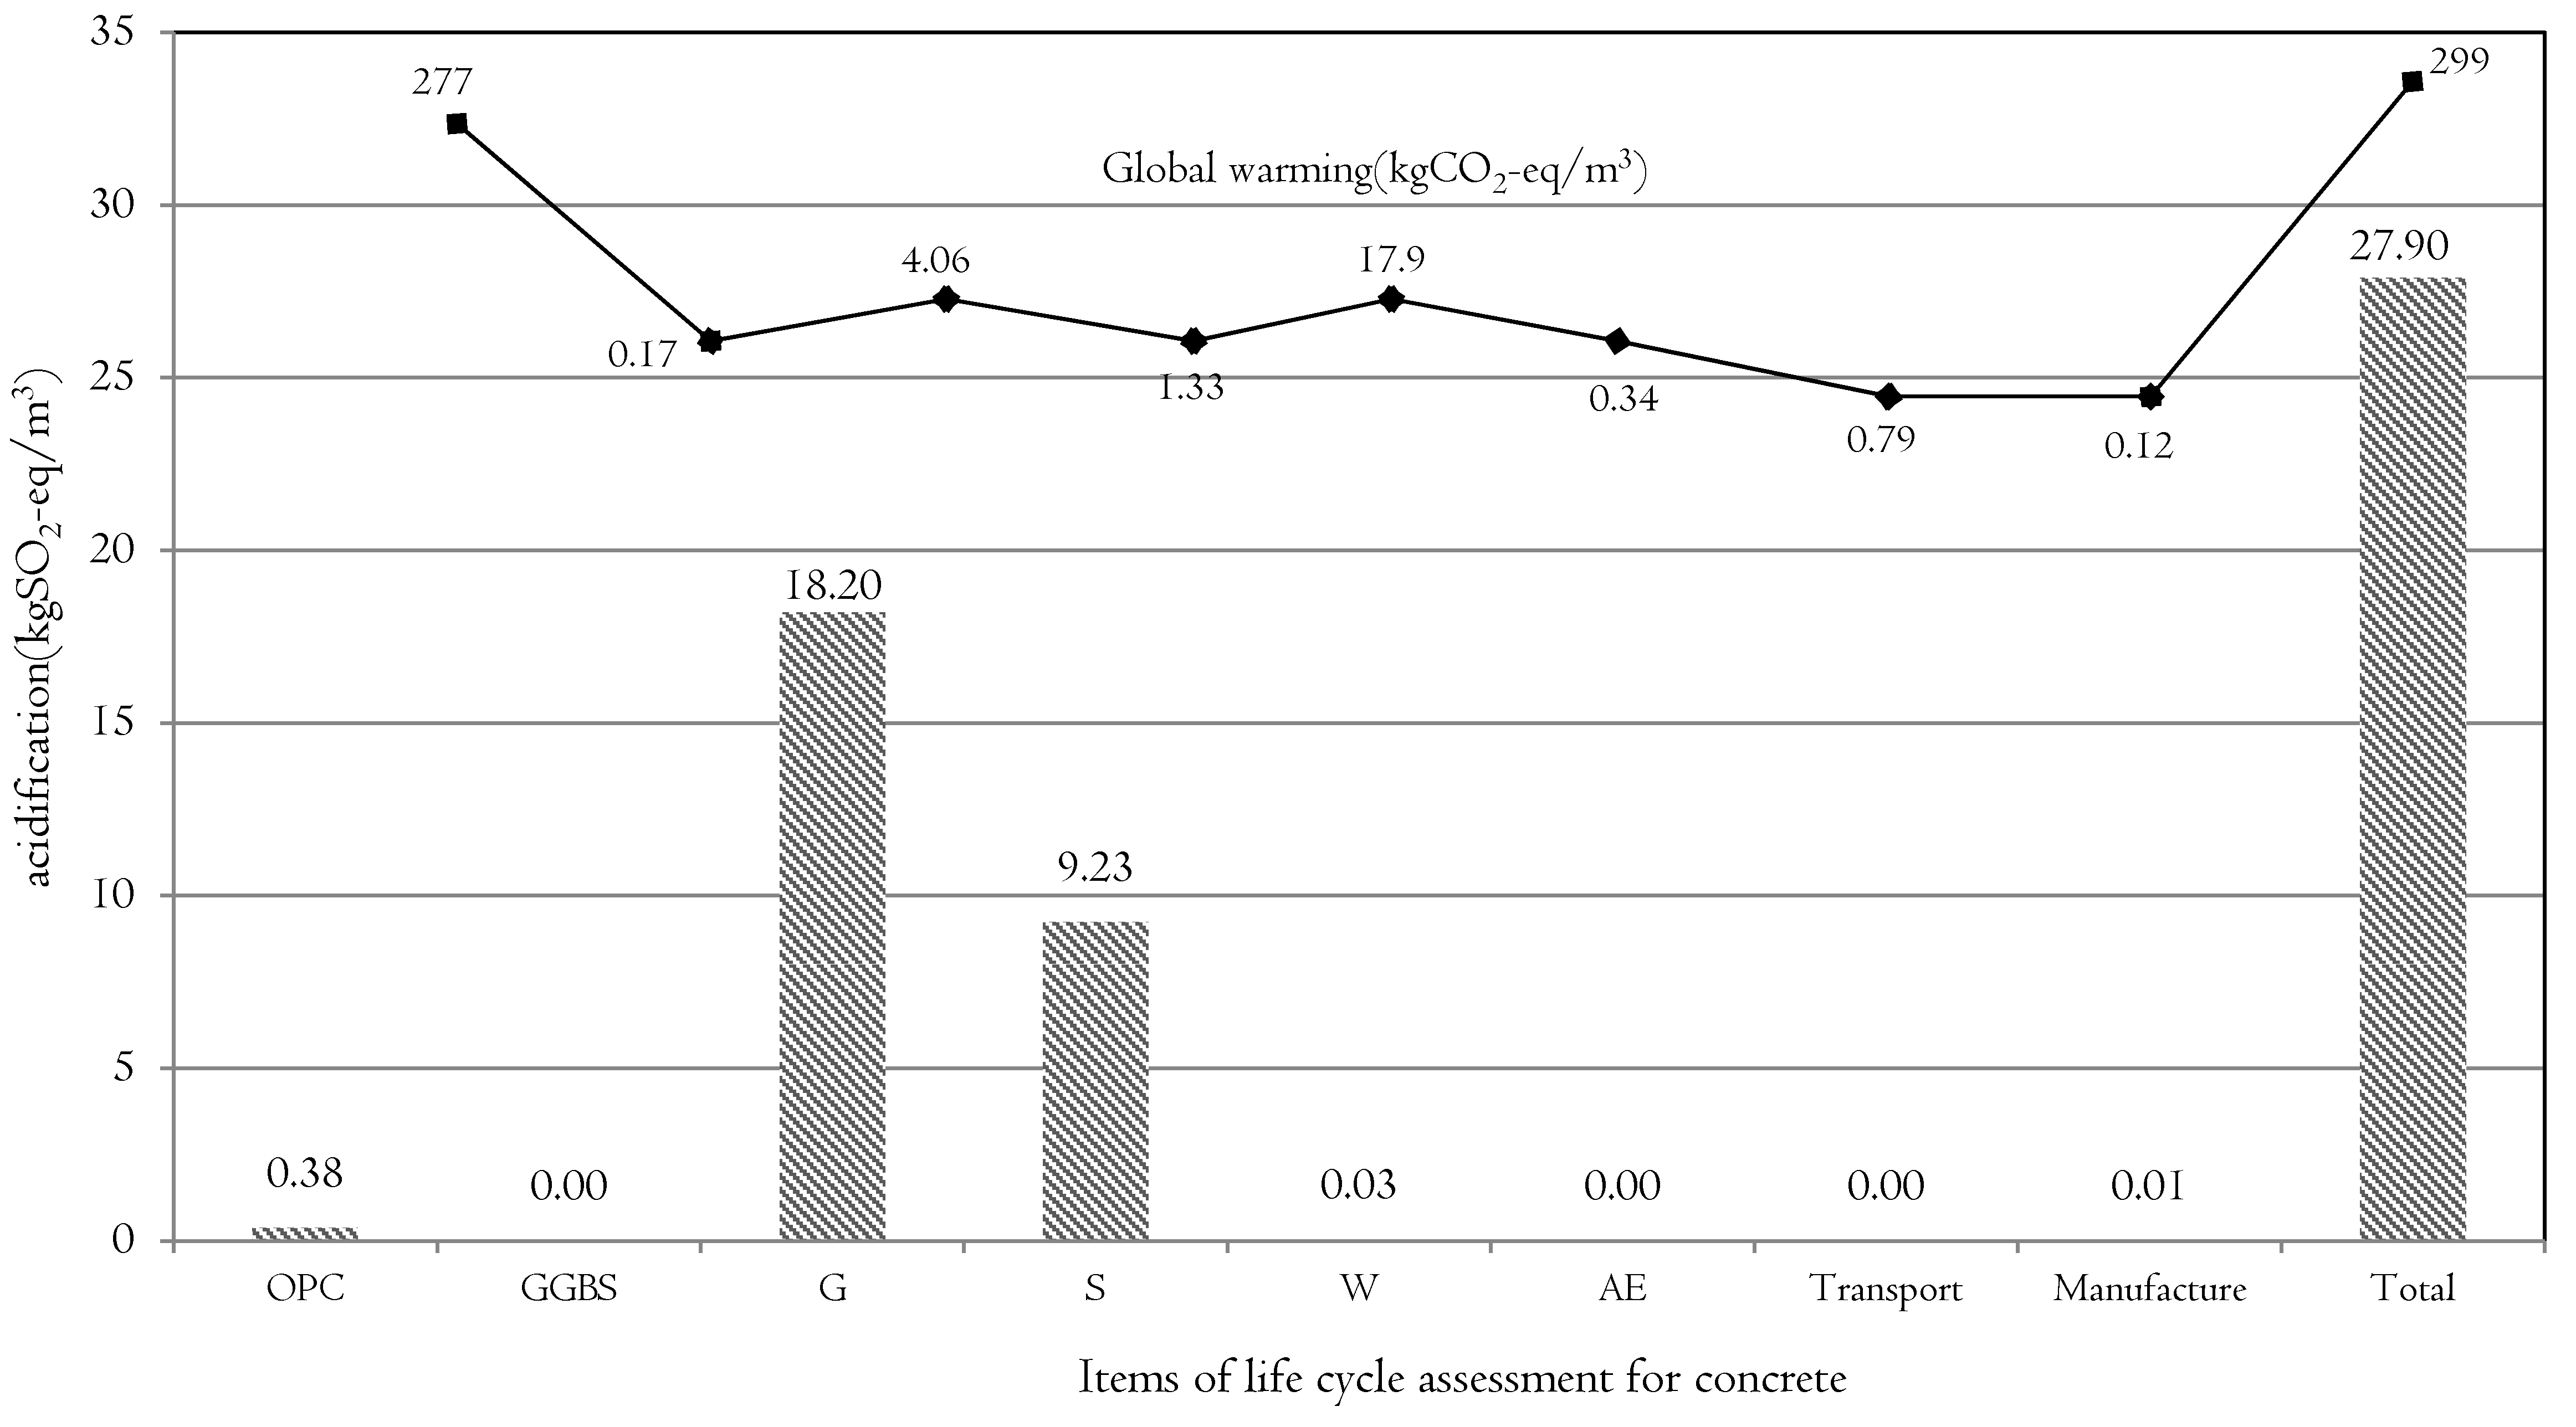
The contribution to acidification and eutrophication of the test concrete was shown to be 27.9 kg SO
2-eq/m
3 and 5.21 kg PO
43−eq/m
3, respectively. The material that had the biggest impact on acidification and eutrophication was found to be aggregate. As shown in
Figure 4, coarse aggregate was found to contribute acidification of 18.2 kg SO
2-eq/m
3, which accounted for about 70% of the total. Fine aggregate acidification was 9.23 kg SO
2-eq/m
3, which accounted for about 30% of the total. As shown in
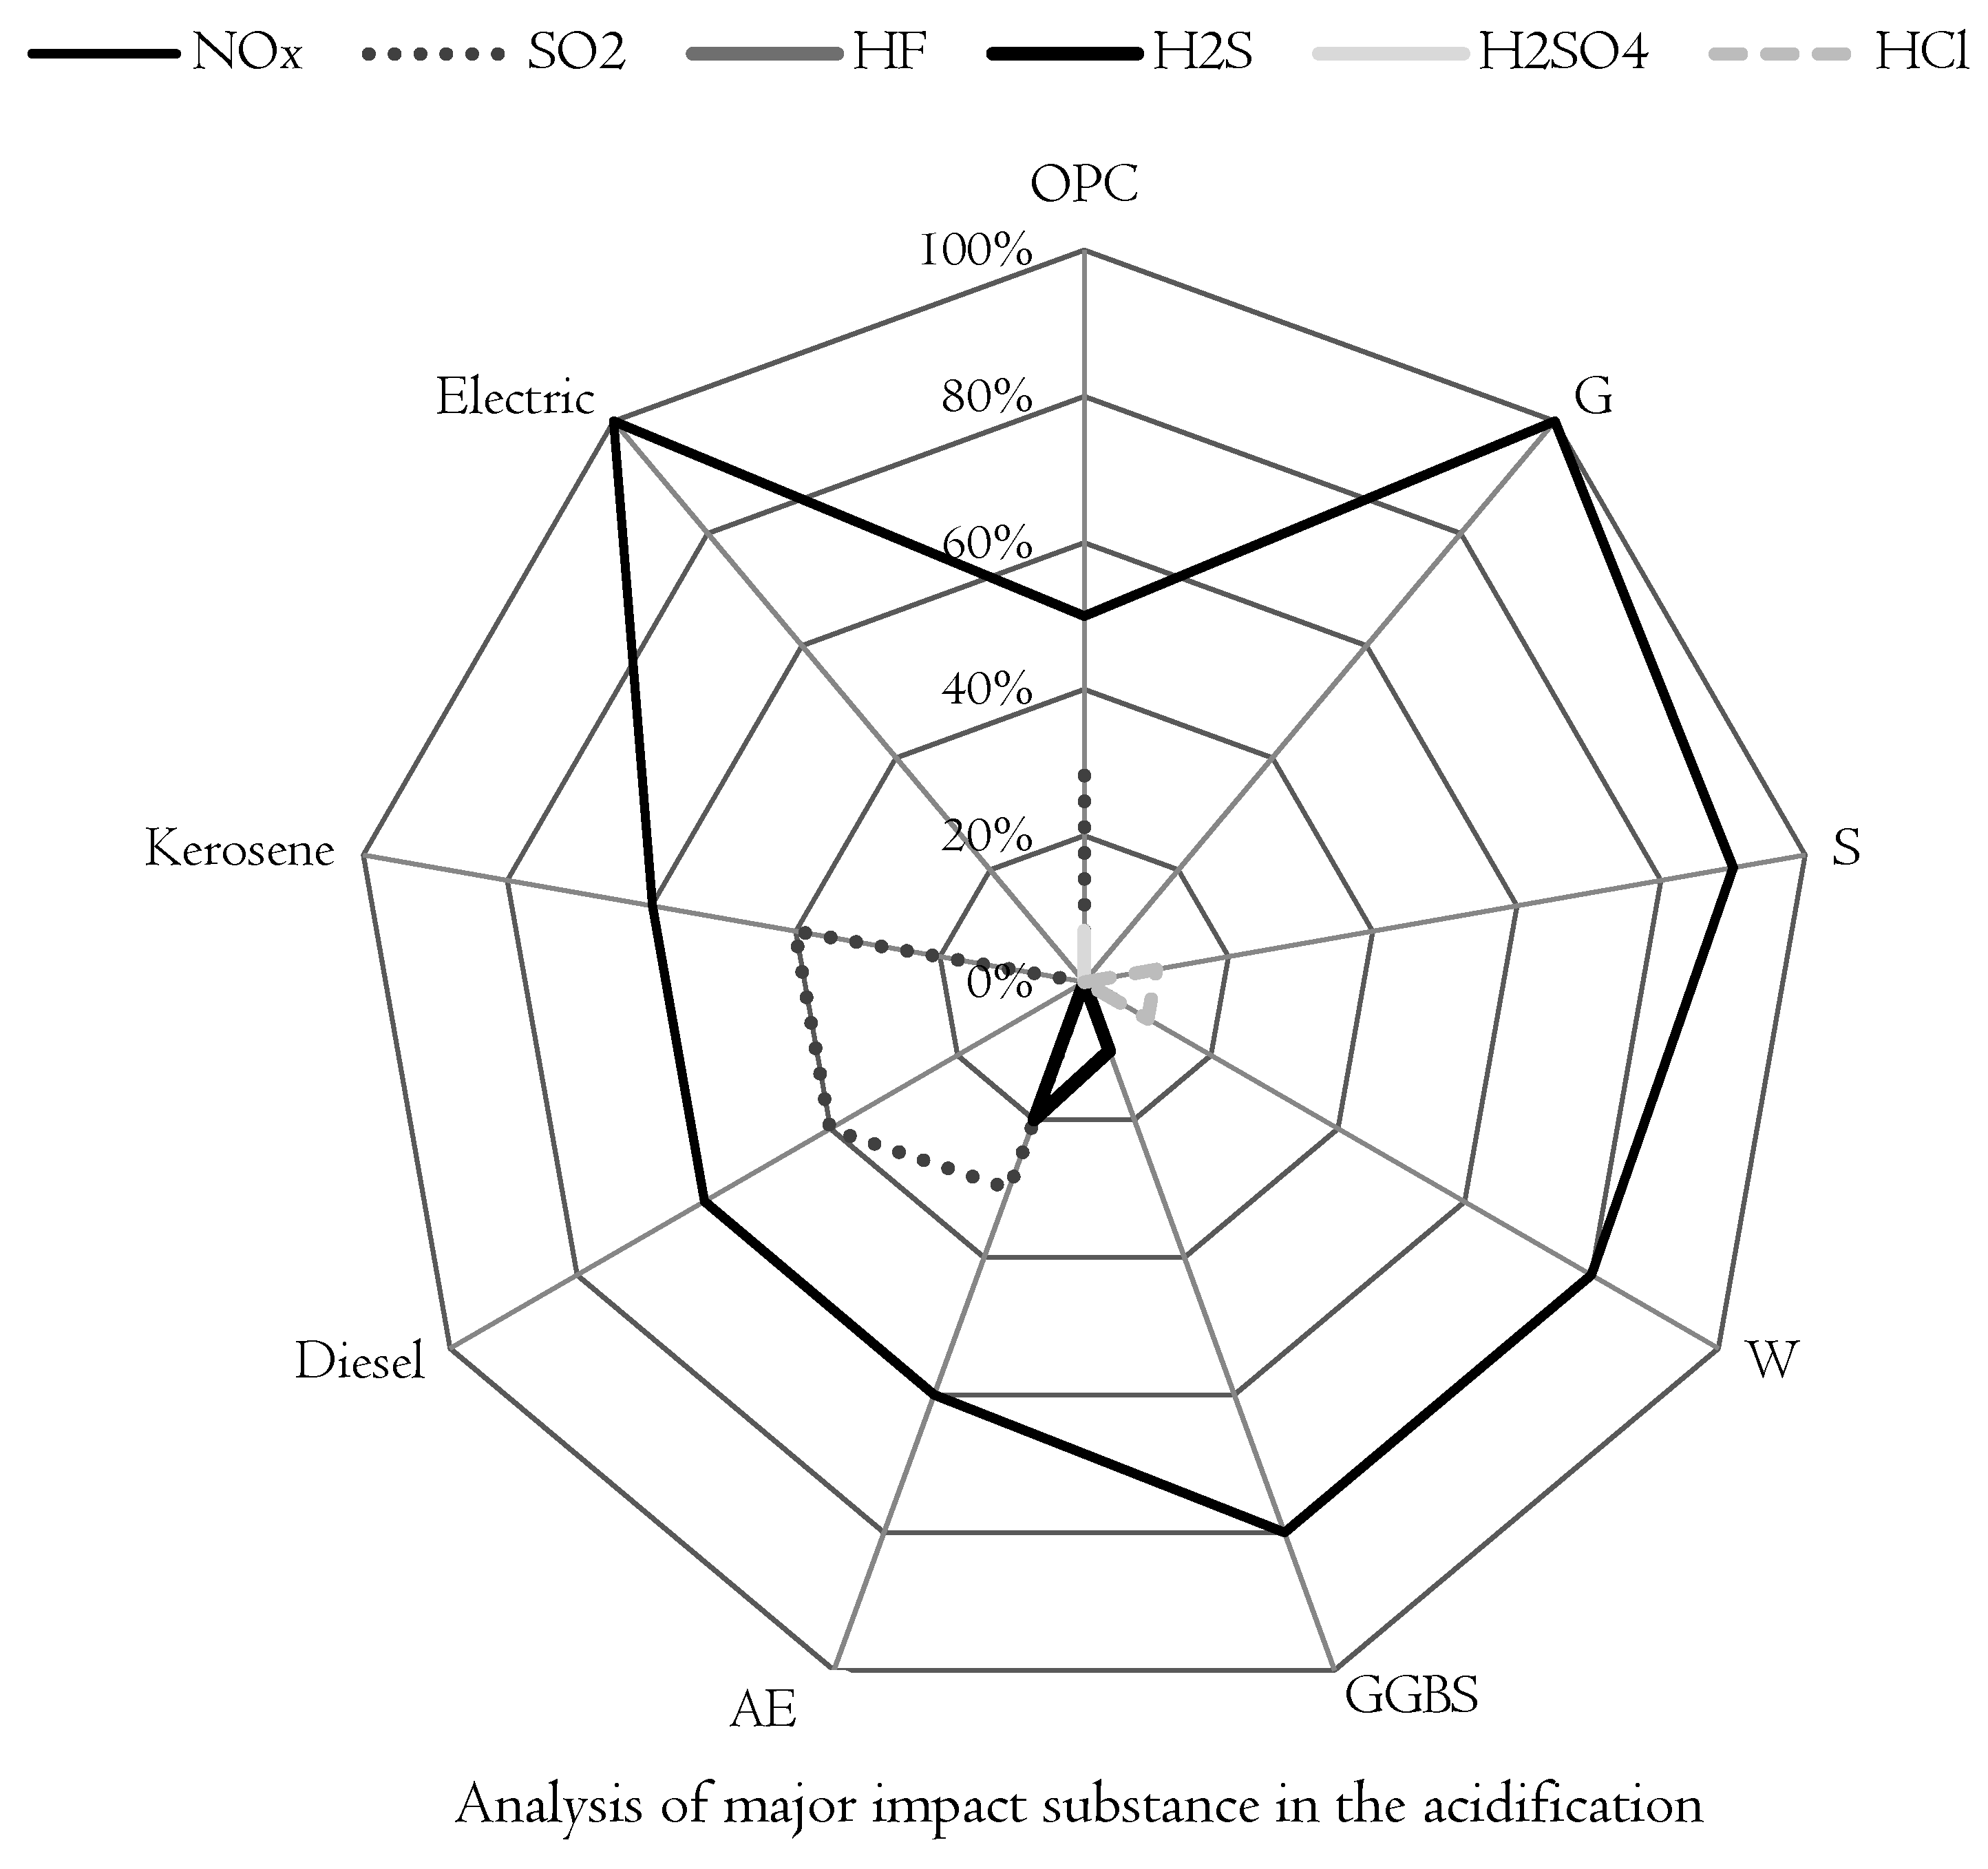
Figure 5, NO
x accounted for most of the coarse aggregate acidification, and NO
x and HCl accounted for 90 and 10% of the fine aggregate acidification, respectively.
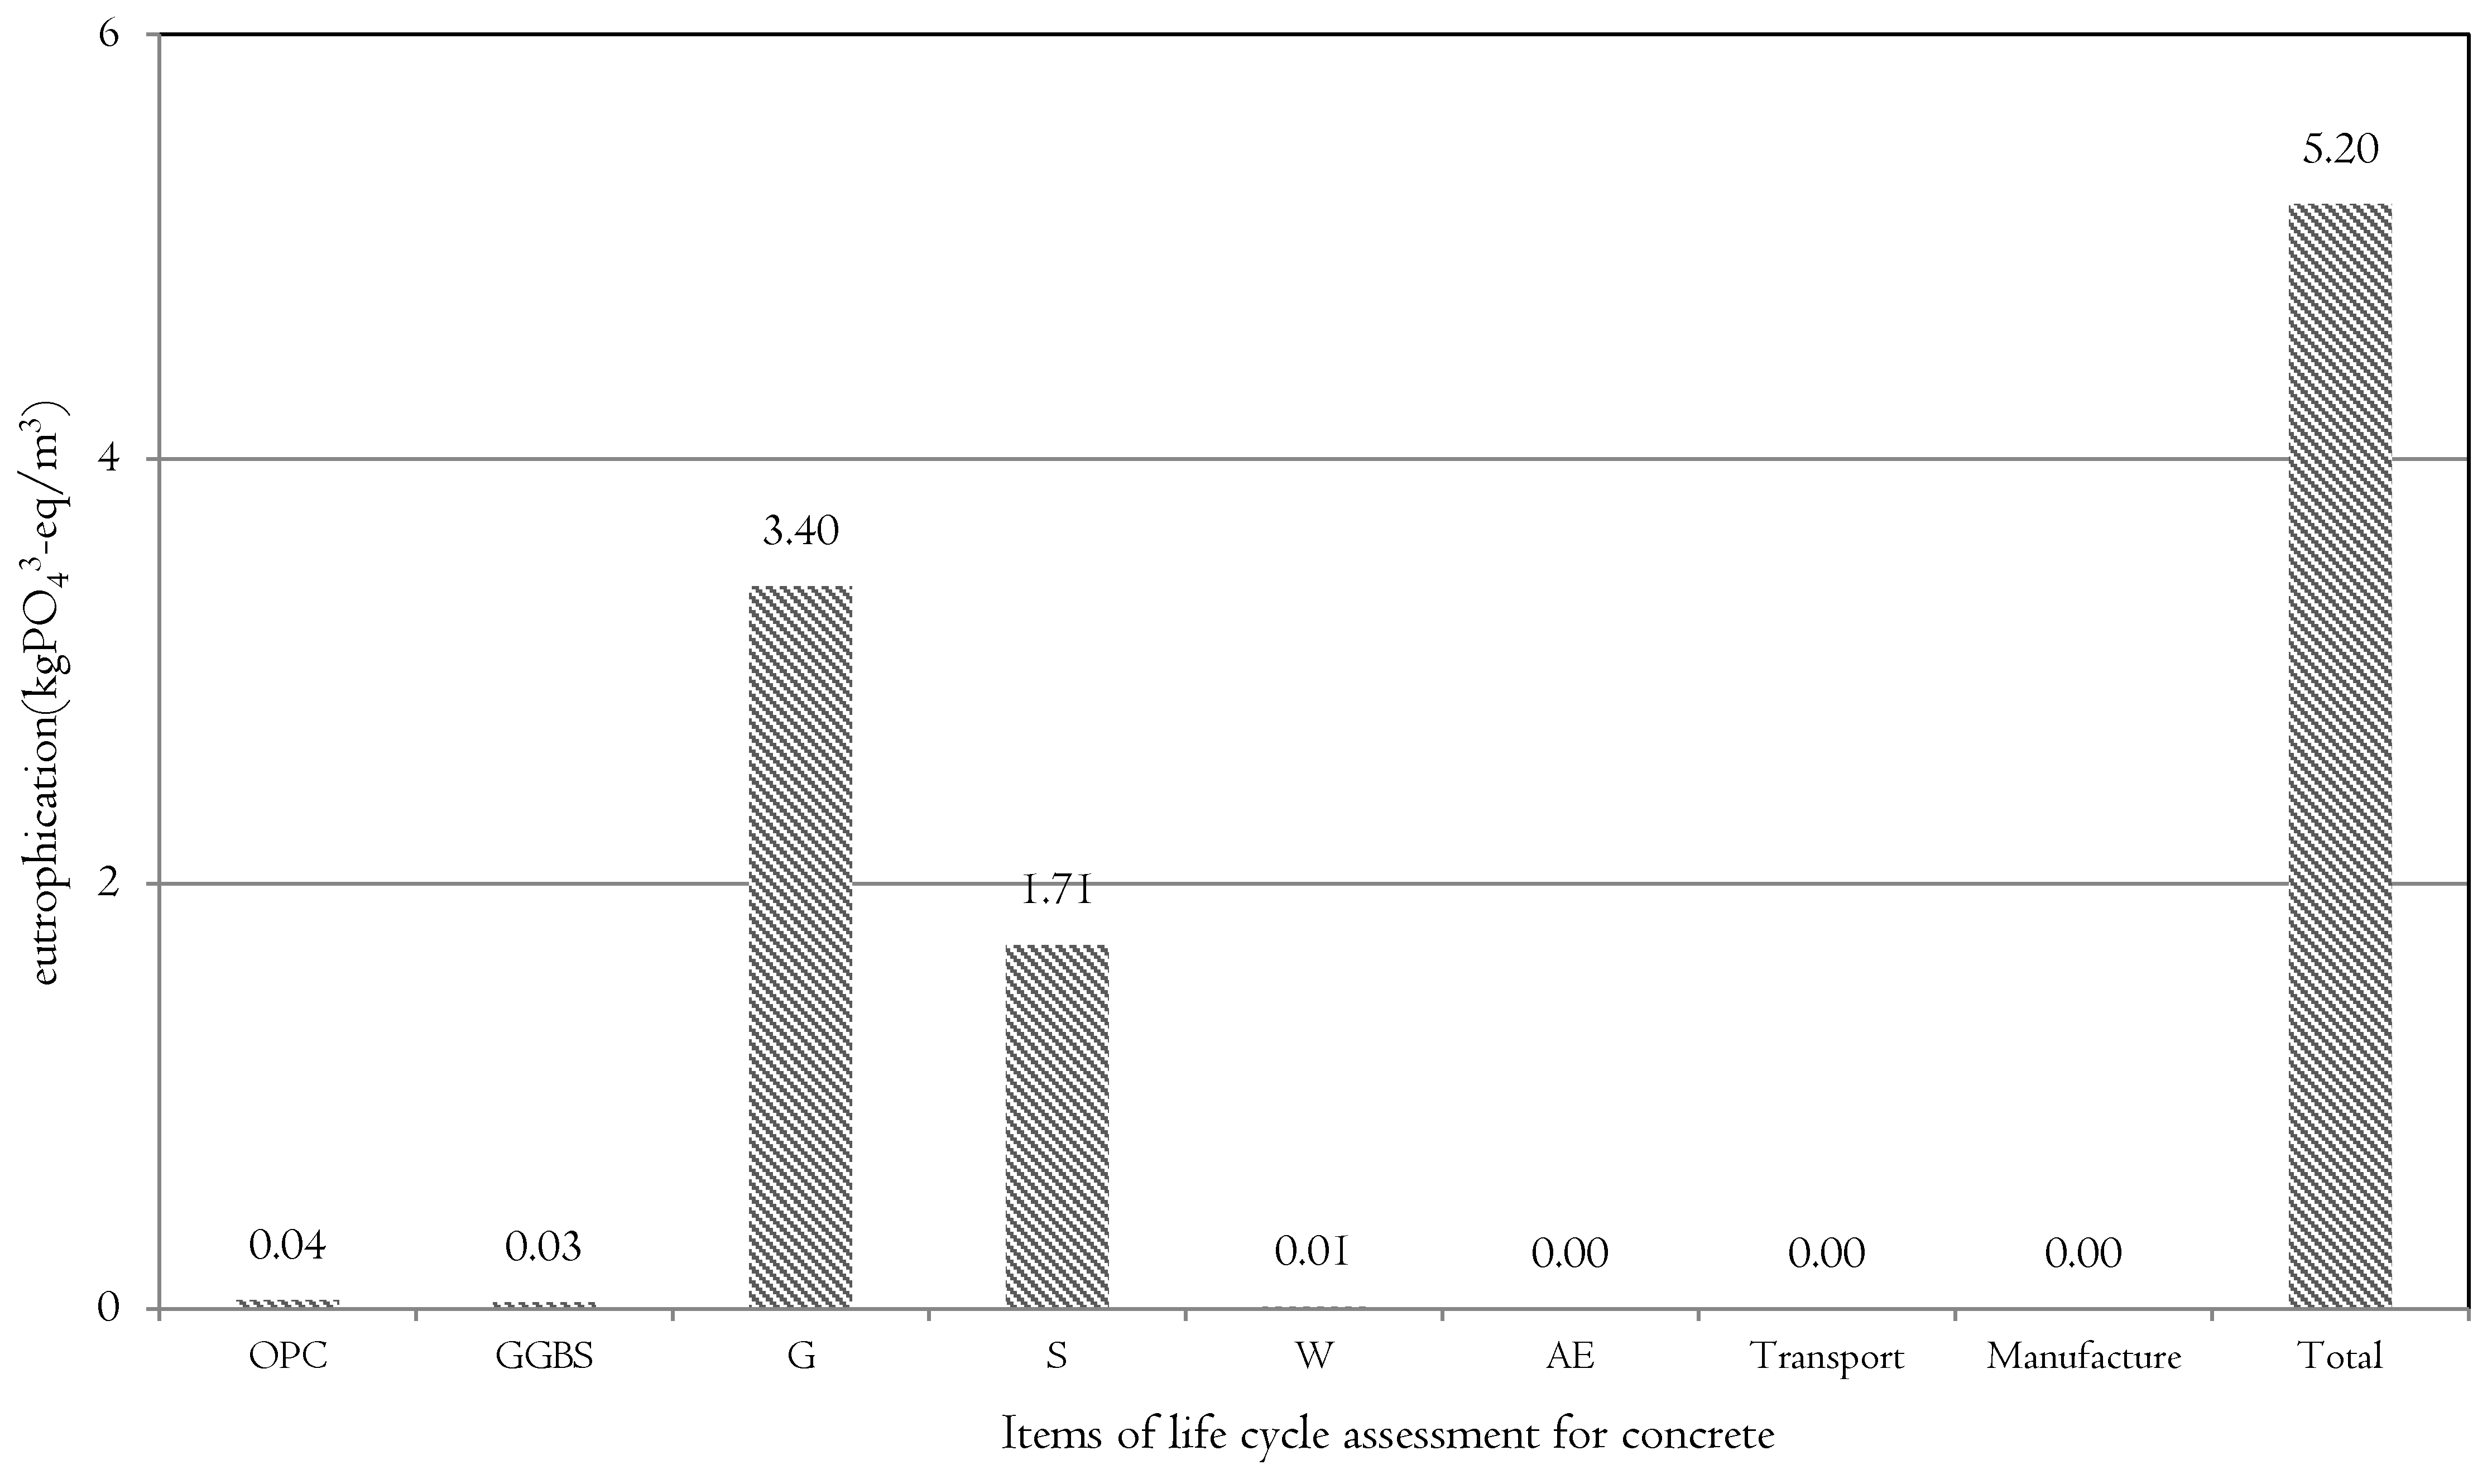
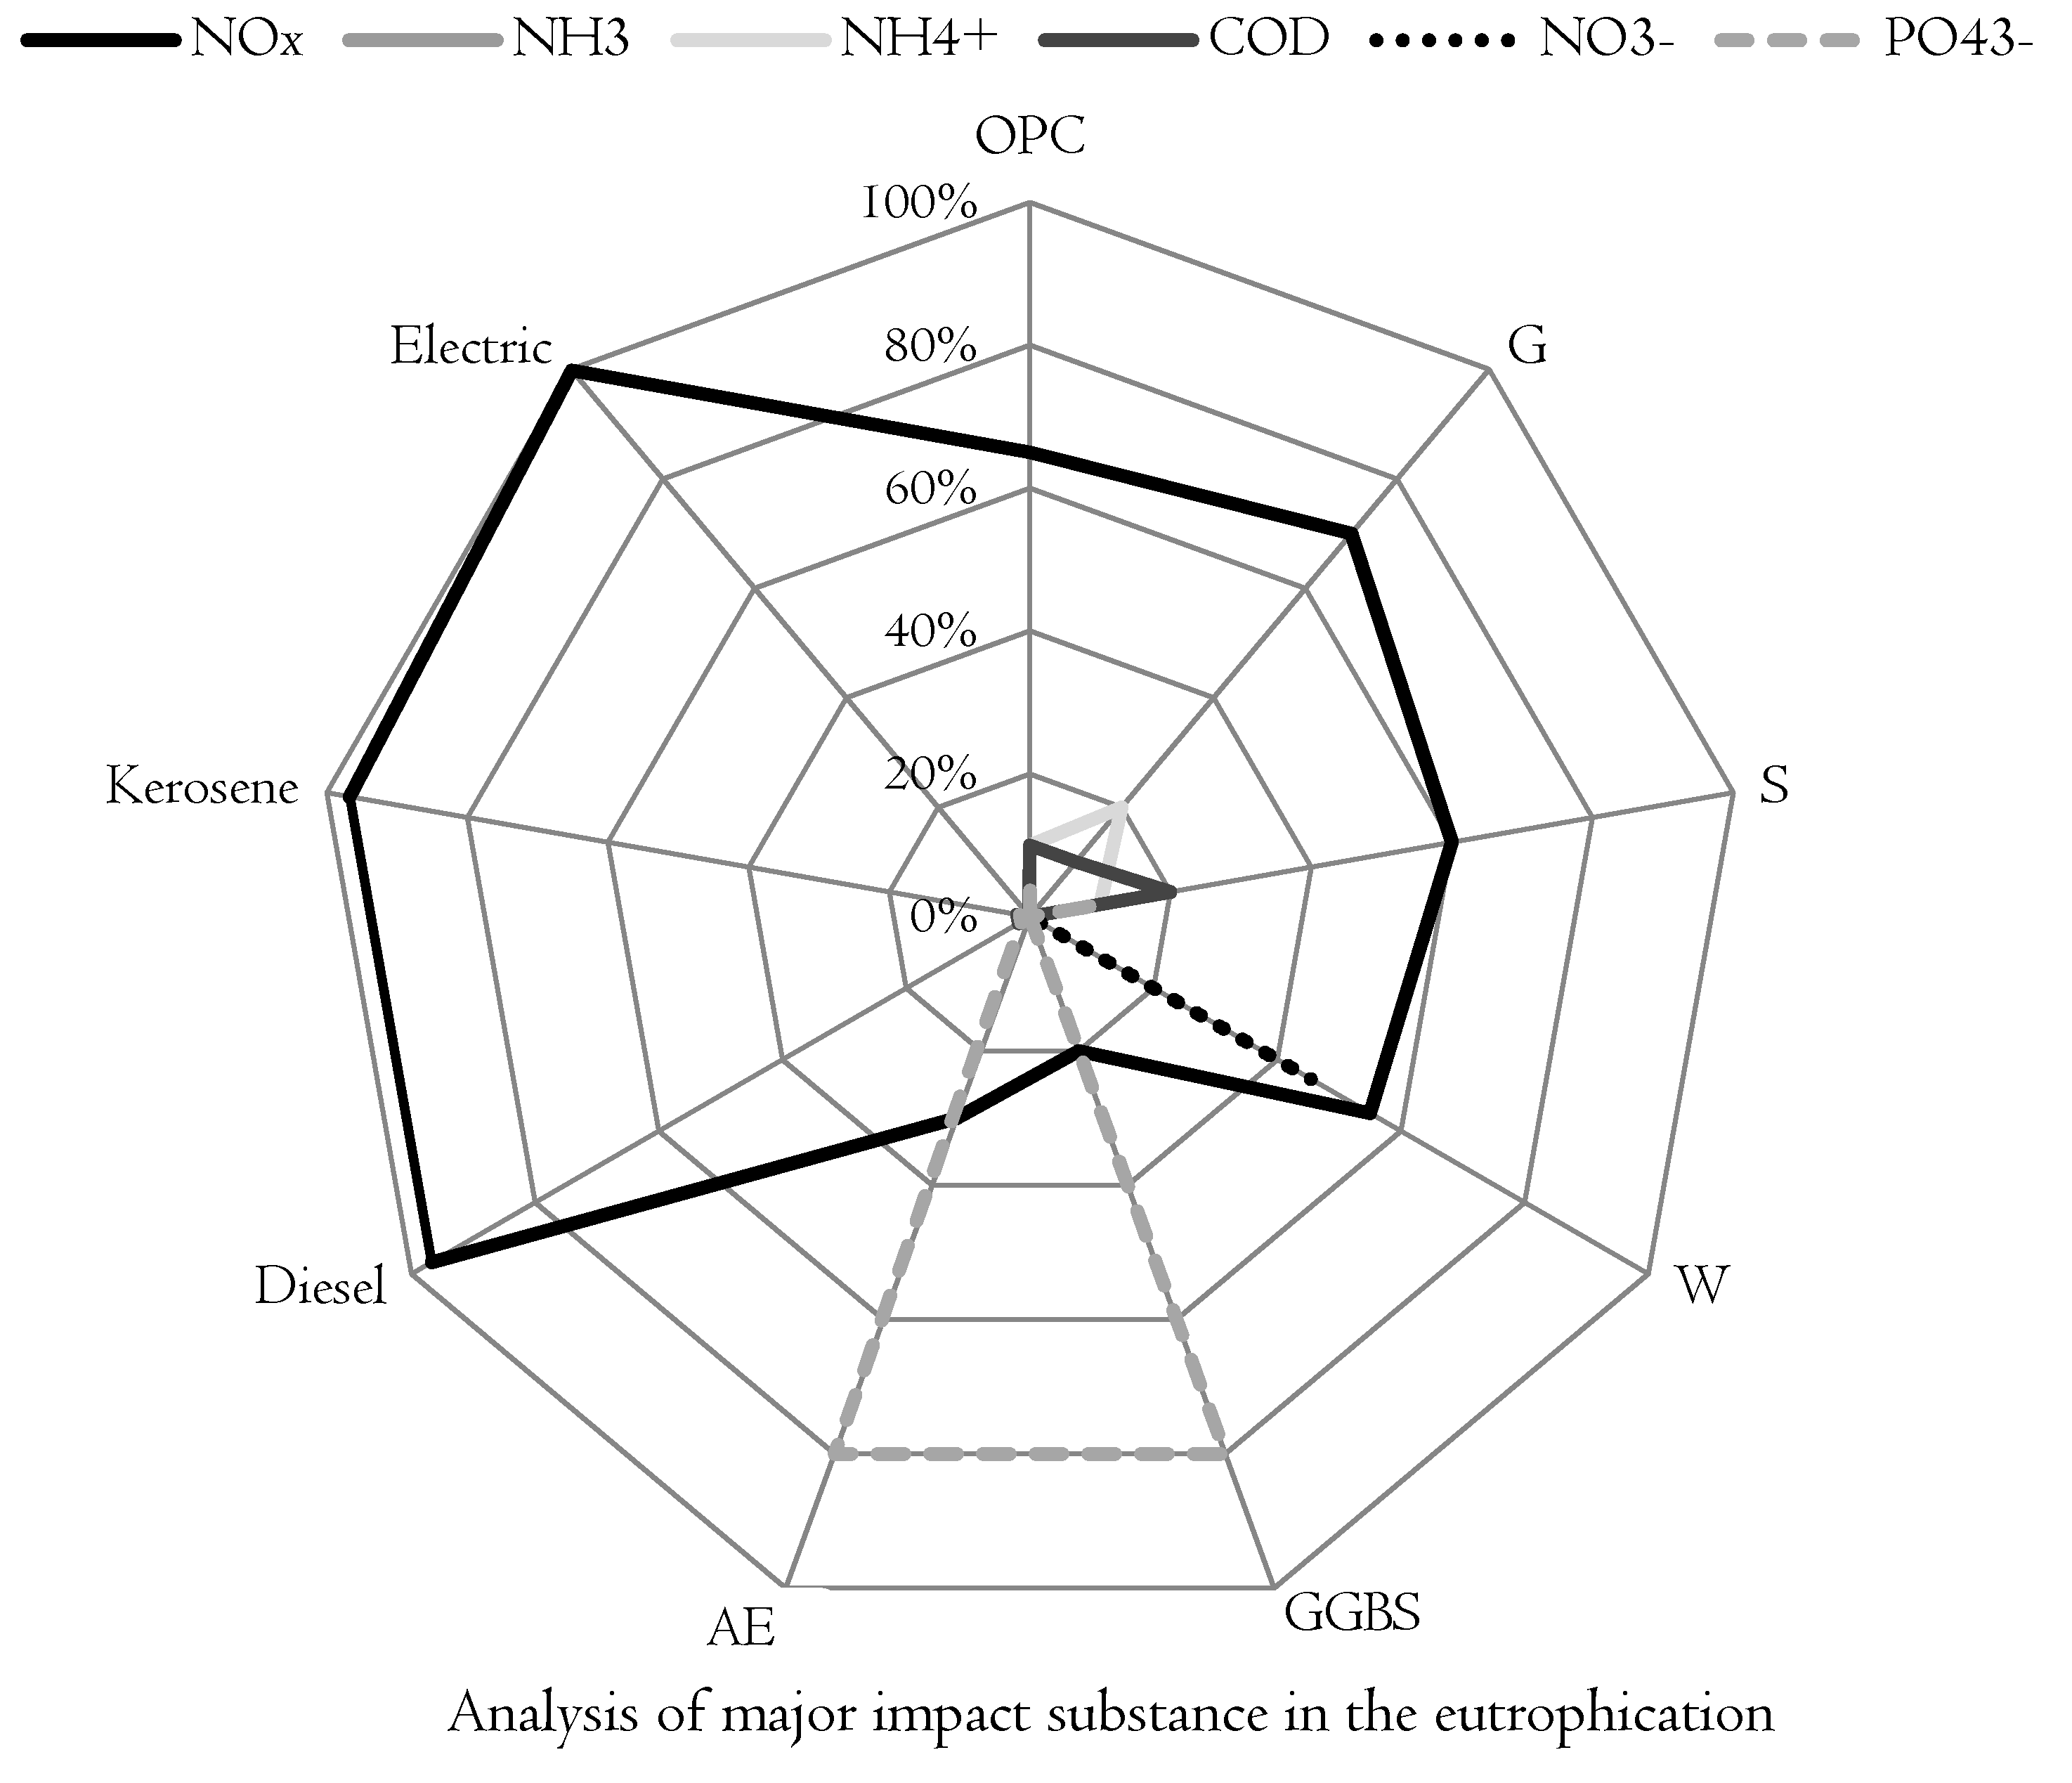
As shown in
Figure 6, coarse aggregate eutrophication was found to be 3.42 kg PO
43−-eq/m
3, which accounted for about 65% of the total. Fine aggregate eutrophication was found to be 1.71 kg SO
2-eq/m
3, which accounted for about 30% of the total eutrophication. As shown in
Figure 7, NO
x and NH4
+ were determined to contribute 70% and 30% of coarse aggregate eutrophication, respectively, and NO
x, NH
4, and PO
43− accounted for 60%, 20%, and 10% of fine aggregate eutrophication, respectively.
Figure 4 shows the contribution of concrete to global warming, acidification, and eutrophication.
As to global warming, the content based on a study of the author was described [
23]. In the LCA of concrete, the material that had the biggest impact on global warming during the production process was found to be normal cement, and the impact of coarse aggregate and fine aggregate on global warming was very small.
The reason why coarse aggregate and fine aggregate, which have almost no impact on global warming, have big impacts on acidification and eutrophication is because of major emissions such as NO
x, SO
2, and H
2SO
4. It is because of the major emissions of aggregates that impacts on acidification and eutrophication are greater than that of normal cement, as analyzed in
Table 2 and
Table 3. As a result of analyzing the major emissions of aggregate, it was found to have greater emissions of NO
x (to air), NH
4 (to water systems), and PO
43− (to water systems) than the major emissions of normal cement.
The impacts of the cement (the raw material of the concrete with strength of 24 MPa) on acidification and eutrophication were very small, with values of 0.38 kg SO
2-eq/m
3 and 0.04 kg PO
43−-eq/m
3, respectively. The emissions from cement that could have an impact on acidification of ecosystems were found to be NO
x, SO
2, and H
2SO
4, which accounted for about 50, 30, and 20%, respectively. Also, the emissions that have an impact on eutrophication were NO
x, NH
4, NO
3−, and PO
43−, which accounted for 70%, 10%, 10%, and 10%, respectively [
24].
5.2.1. Analysis According to Ground-Granulated Blast-Furnace Slag (GGBS) Mixing
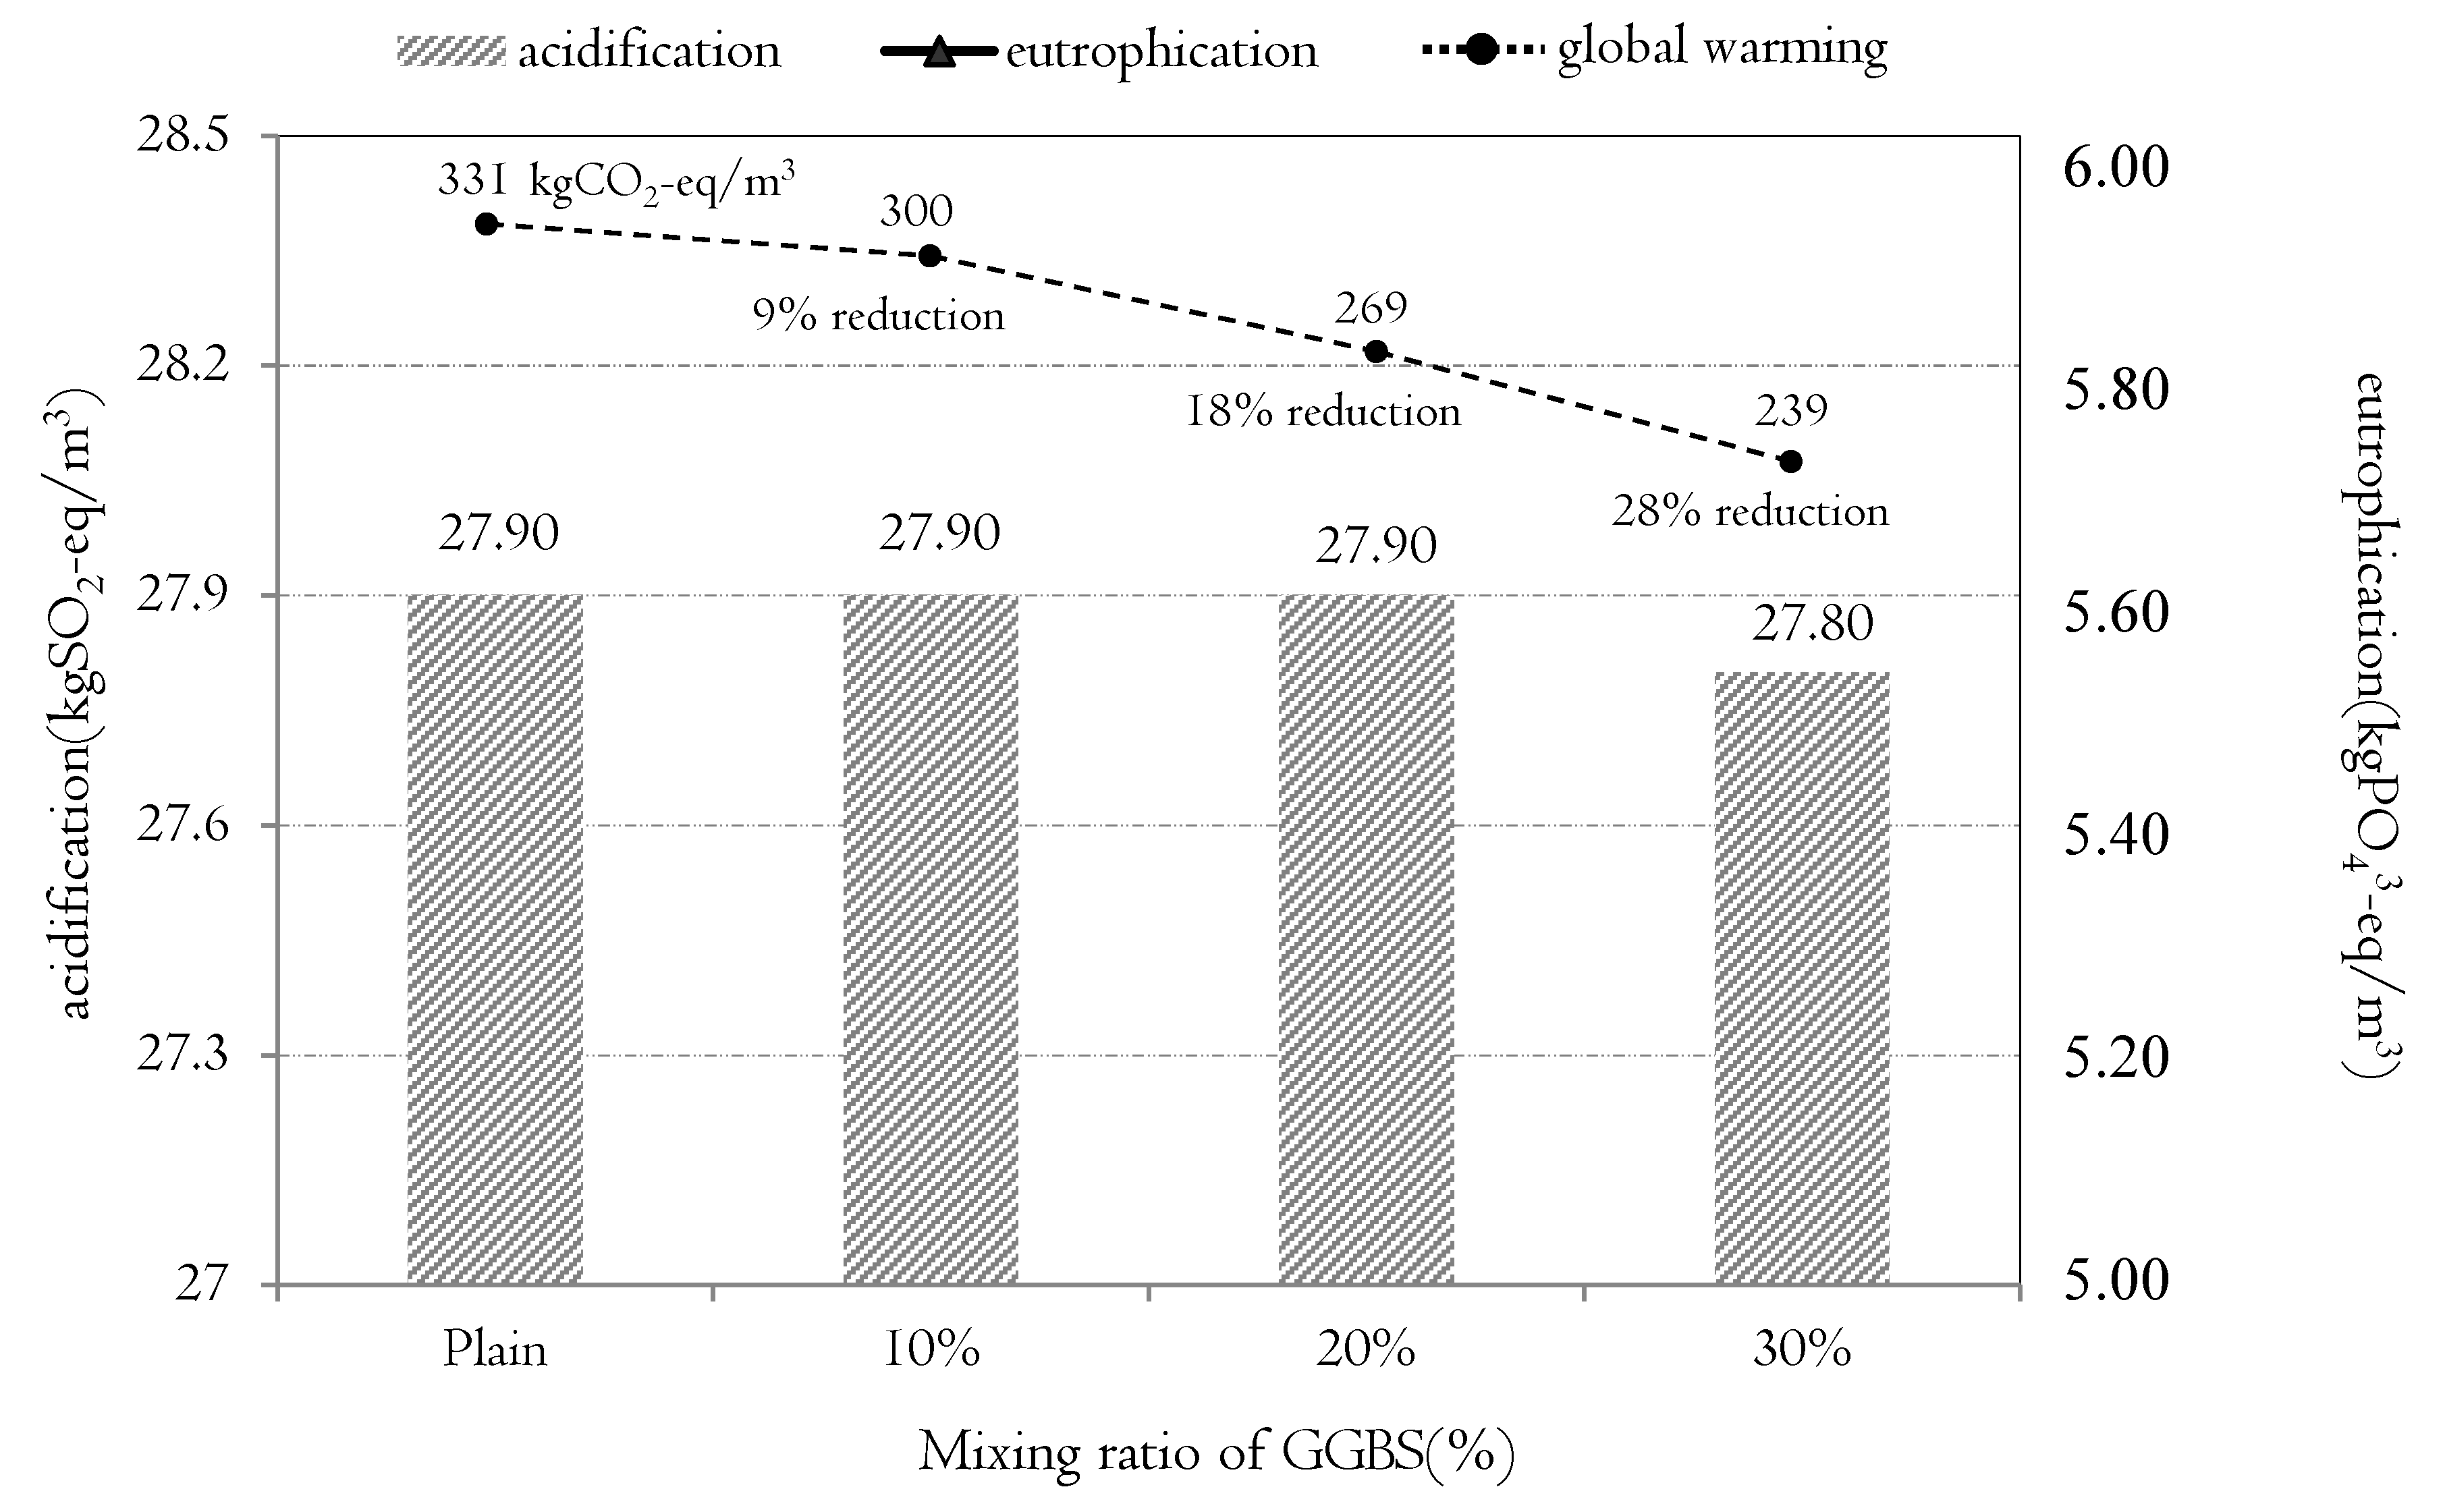
As shown in
Figure 8, acidification and eutrophication resulting from mixing of GGBS with 24 MPa concrete were assessed. There was almost no change in acidification and eutrophication even when the mixing ratio of GGBS was increased. This is because the amount of GGBS or normal mixed cement does not have any impact because the aggregate accounts for 95% of the impacts of concrete production on acidification and eutrophication. The impacts on acidification and eutrophication were analyzed in two sectors: air (atmospheric) and water (hydrologic) systems. As the mixing ratio of GGBS increased, the acidification and eutrophication in the atmospheric sector decreased.
The main reason for this is because GGBS has less impact on acidification and eutrophication via the air than normal cement does. As shown in
Figure 9, sulfur dioxide and sulfuric acid are discharged due to the use of dynamite (which comprises sulfuric acid, nitric acid, and sulfur) during mining of limestone and iron ore, the main raw materials of normal cement. NO
x and PO
43− are emitted by energy sources used for the electric power used in the pulverization of the mined ore and clinker. Sintering is the process into which the greatest amount of energy is input. Thus, the greatest amounts of substances with environmental impacts are emitted during production of normal cement.
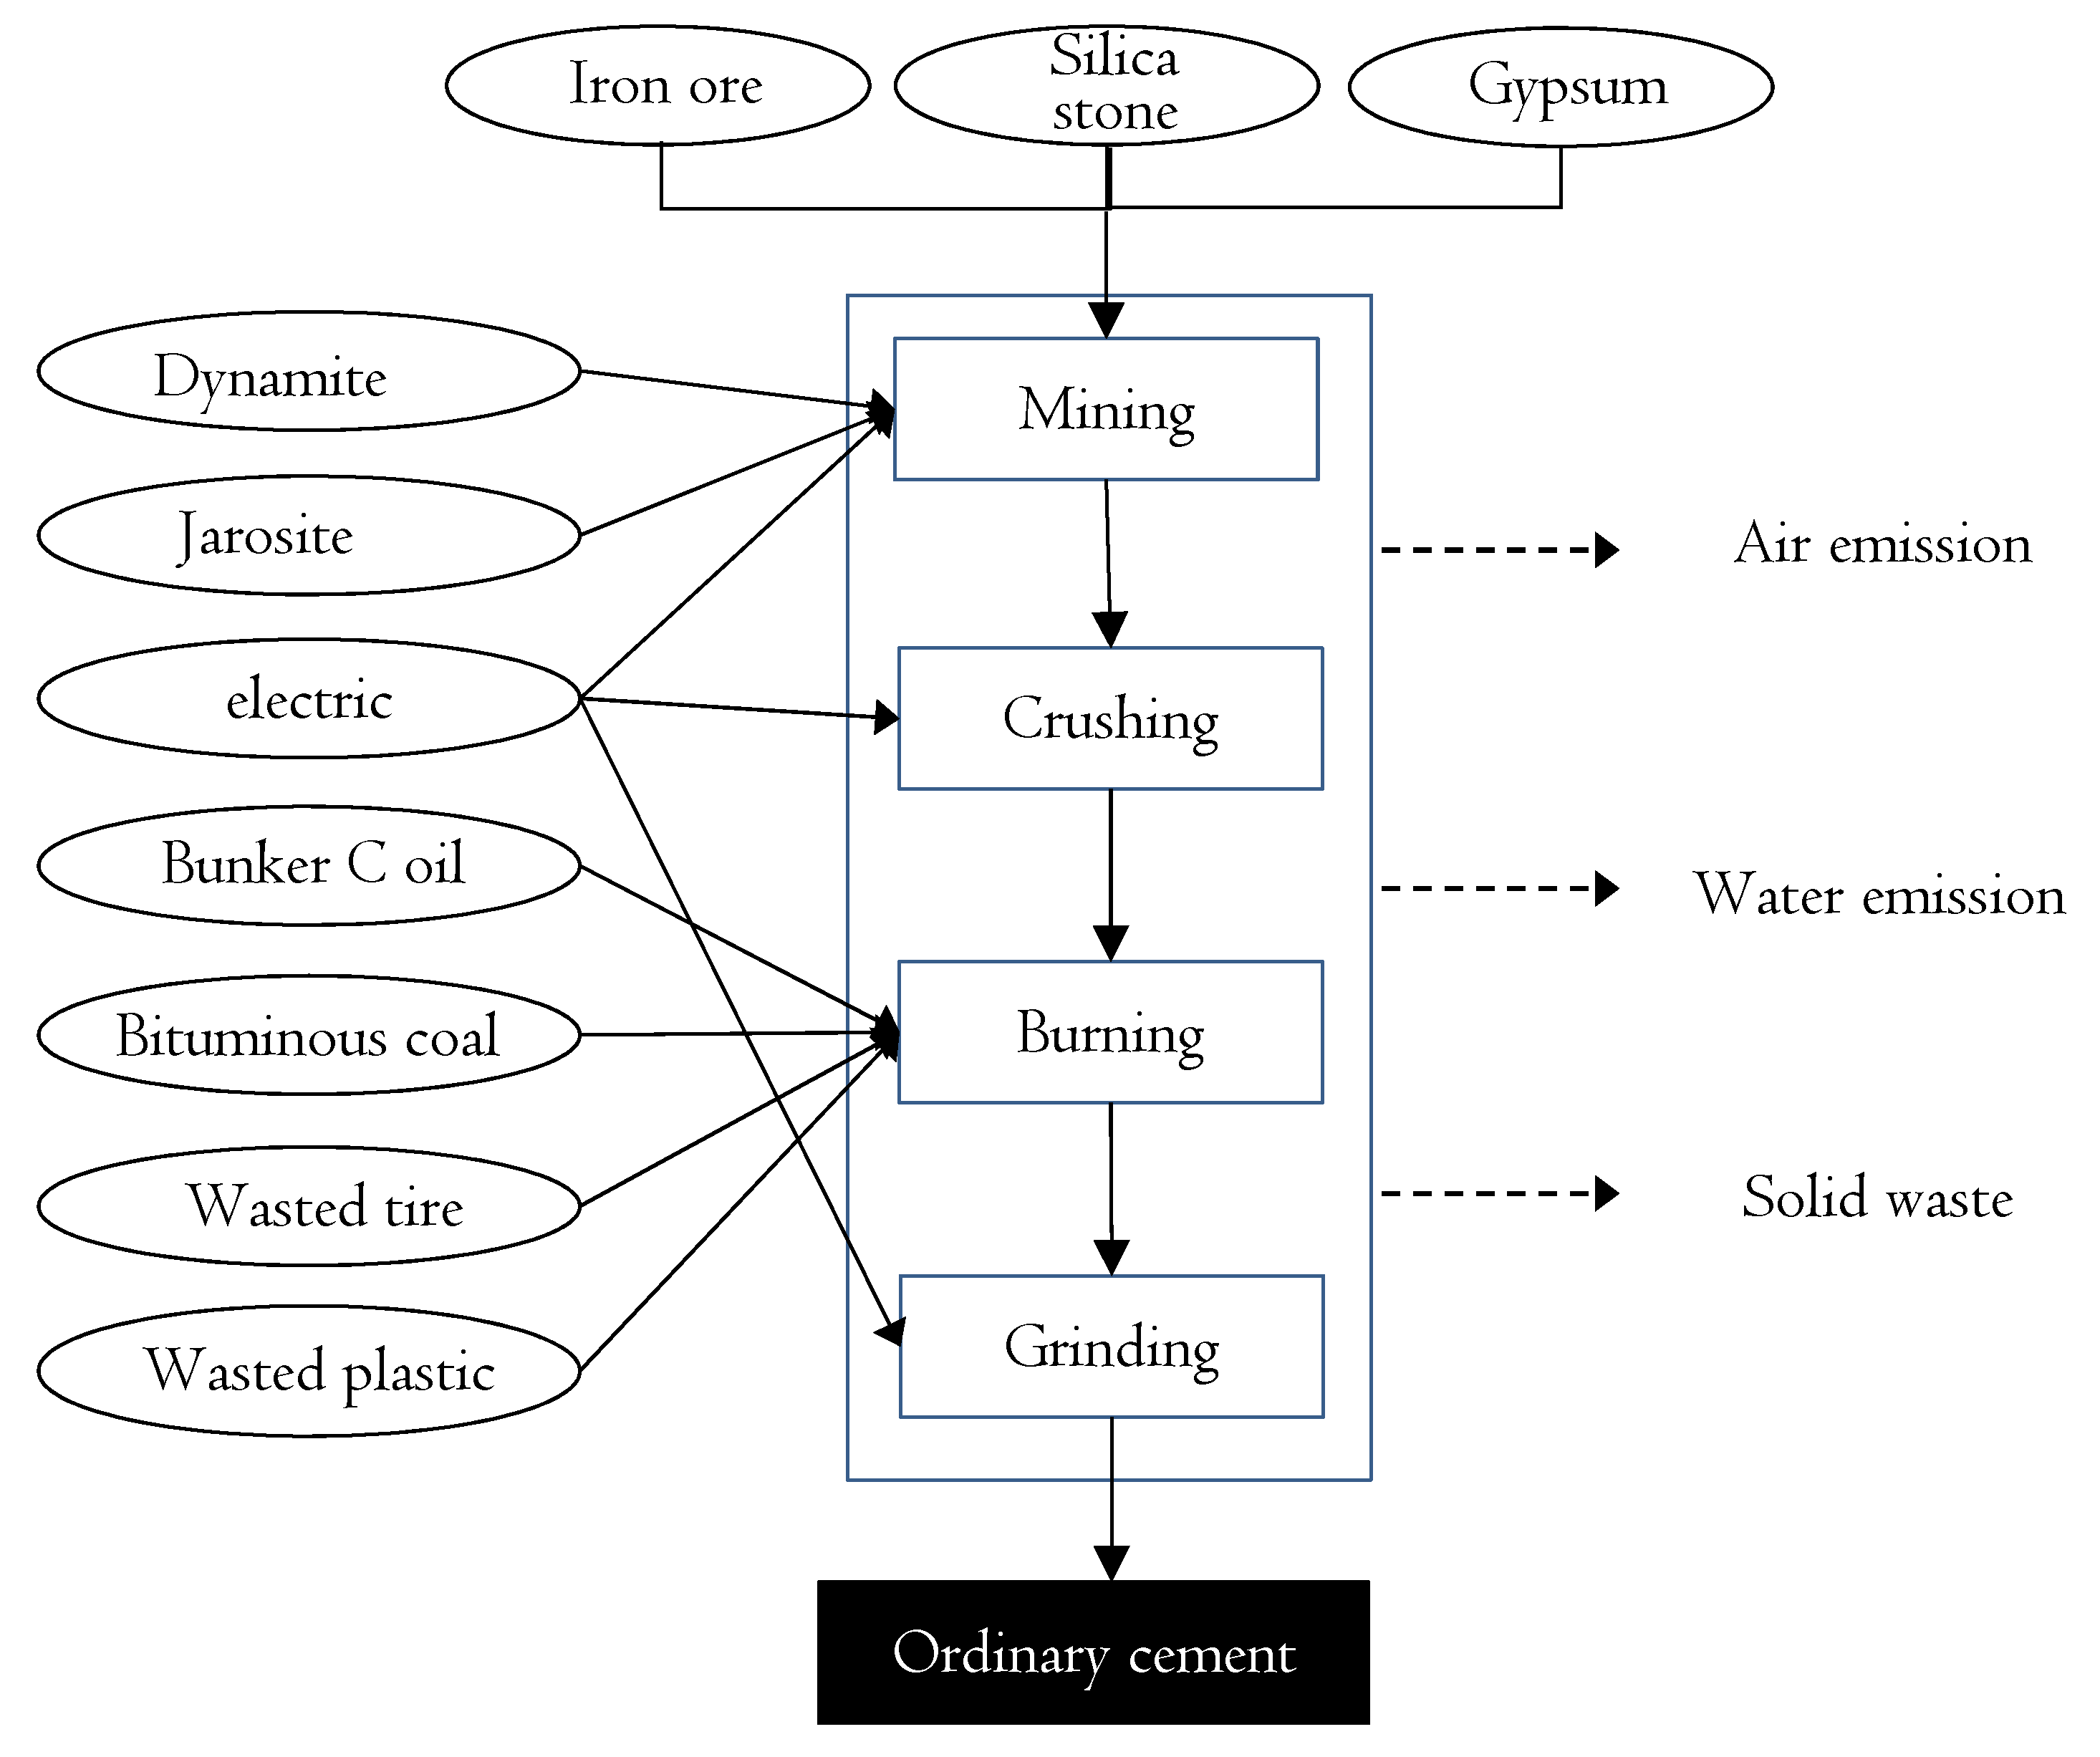
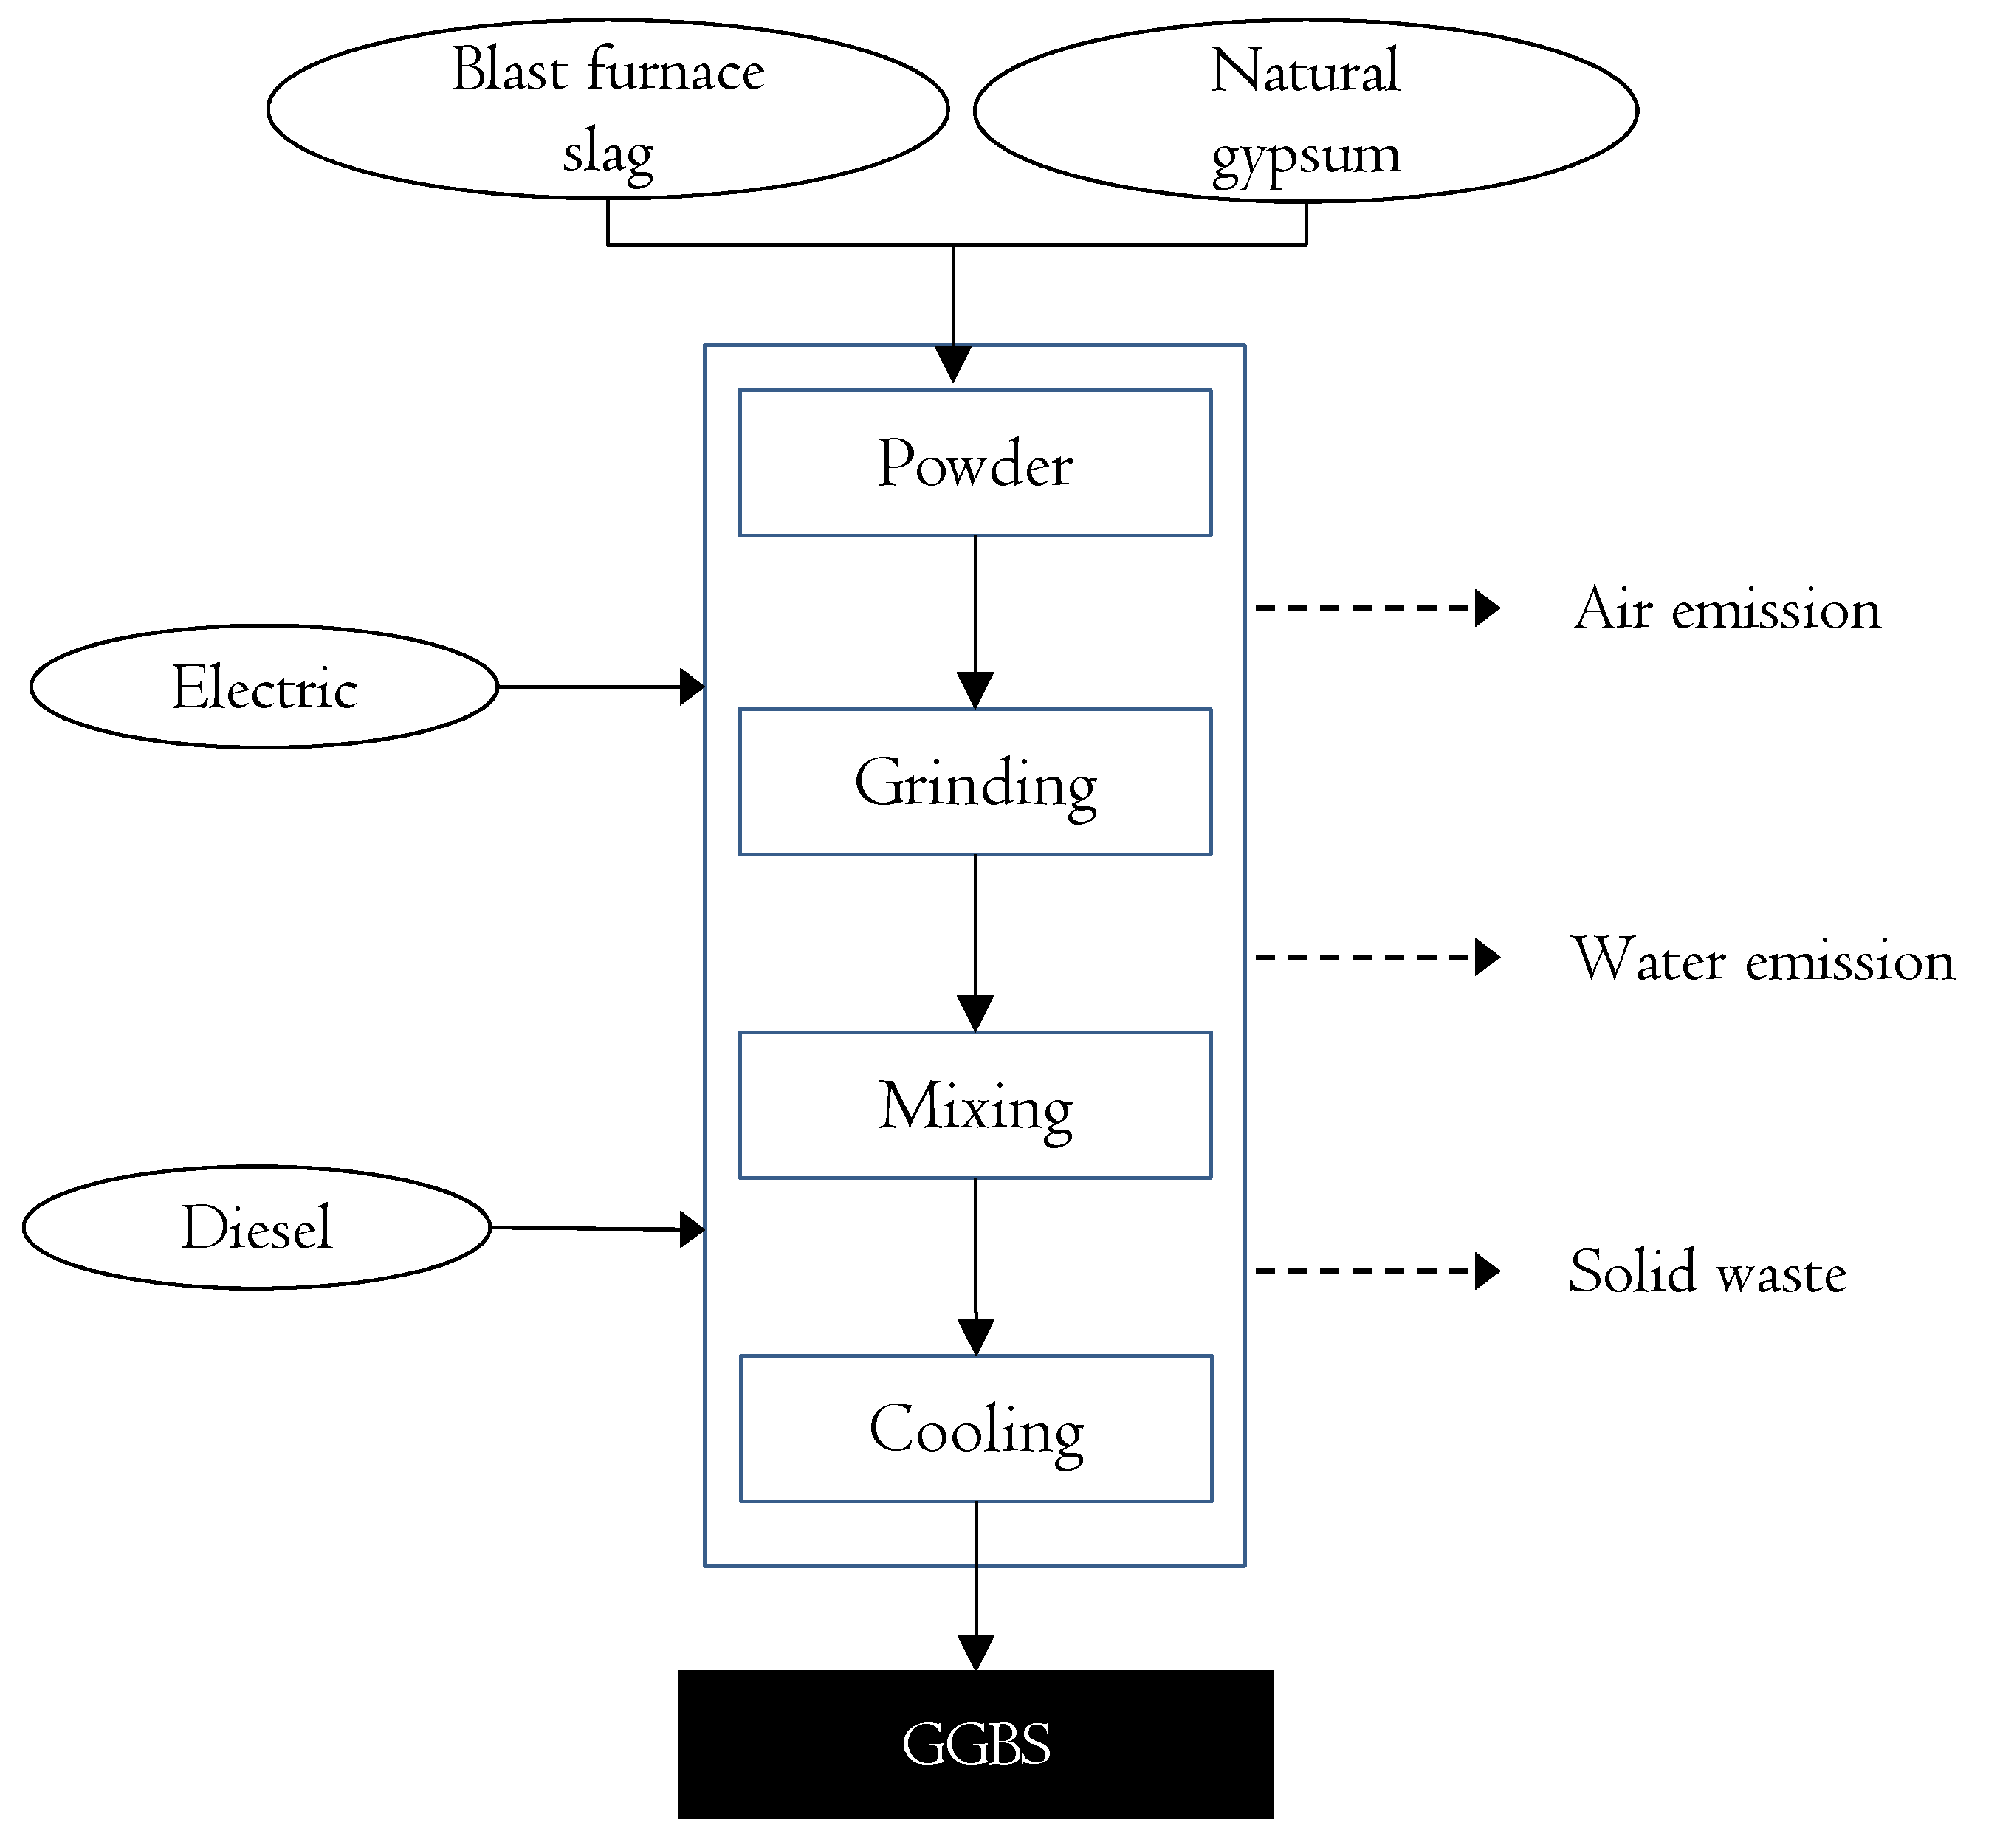
To increase the temperature of the rotary kiln to the range 1000–1450 °C for production of clinker, fuels such as B-C (Bunker C) oil, bituminous coal, waste tires, and waste plastic are burned. During combustion of these fuels, substances such as ammonia, nitrate, sulfuric acid, and phosphorus are emitted in large amounts. In the case of GGBS, electric power and diesel fuel are used in the pulverizing and mixing process related to blast-furnace slag and natural gypsum. These are the main raw materials, as shown in
Figure 10. Ammonia (NH
3), ammonium (NH
4+), phosphate (PO
43−), nitrogen oxide (NO
x),
etc., are emitted as a result of using the diesel and electricity. The difference between the emissions of NO
x and PO
43− in the production processes of normal cement and GGBS was found to be the major cause of reduction in acidification and eutrophication.
Moreover, as the GGBS mixing ratio increased, acidification in the hydrologic sector decreased whereas eutrophication increased. The reason why acidification in water systems decreased was because the amount of H2SO4 (the major emission that has an impact on acidification) from normal cement was much smaller than that of H2S (the major emission from GGBS). The reason why eutrophication in water systems increased was because the amount of PO43− (the major emission that has an impact on eutrophication) from GGBS was bigger than the emissions of NH4+, NO3−, and PO43− (the major emissions from normal cement).
However, such increase/decrease phenomena failed to change the total acidification and eutrophication results for the concrete with which GGBS was mixed. This is because the impact of aggregate on acidification and eutrophication is large, as explained earlier. As shown in
Figure 8, although global warming (kg CO
2-eq) was shown to decrease by up to 28% as the mixing ratio of GGBS increased, the increase or decrease in acidification or eutrophication was insignificant [
25,
26].
5.2.2. Analysis According to Recycled Aggregate Mixing
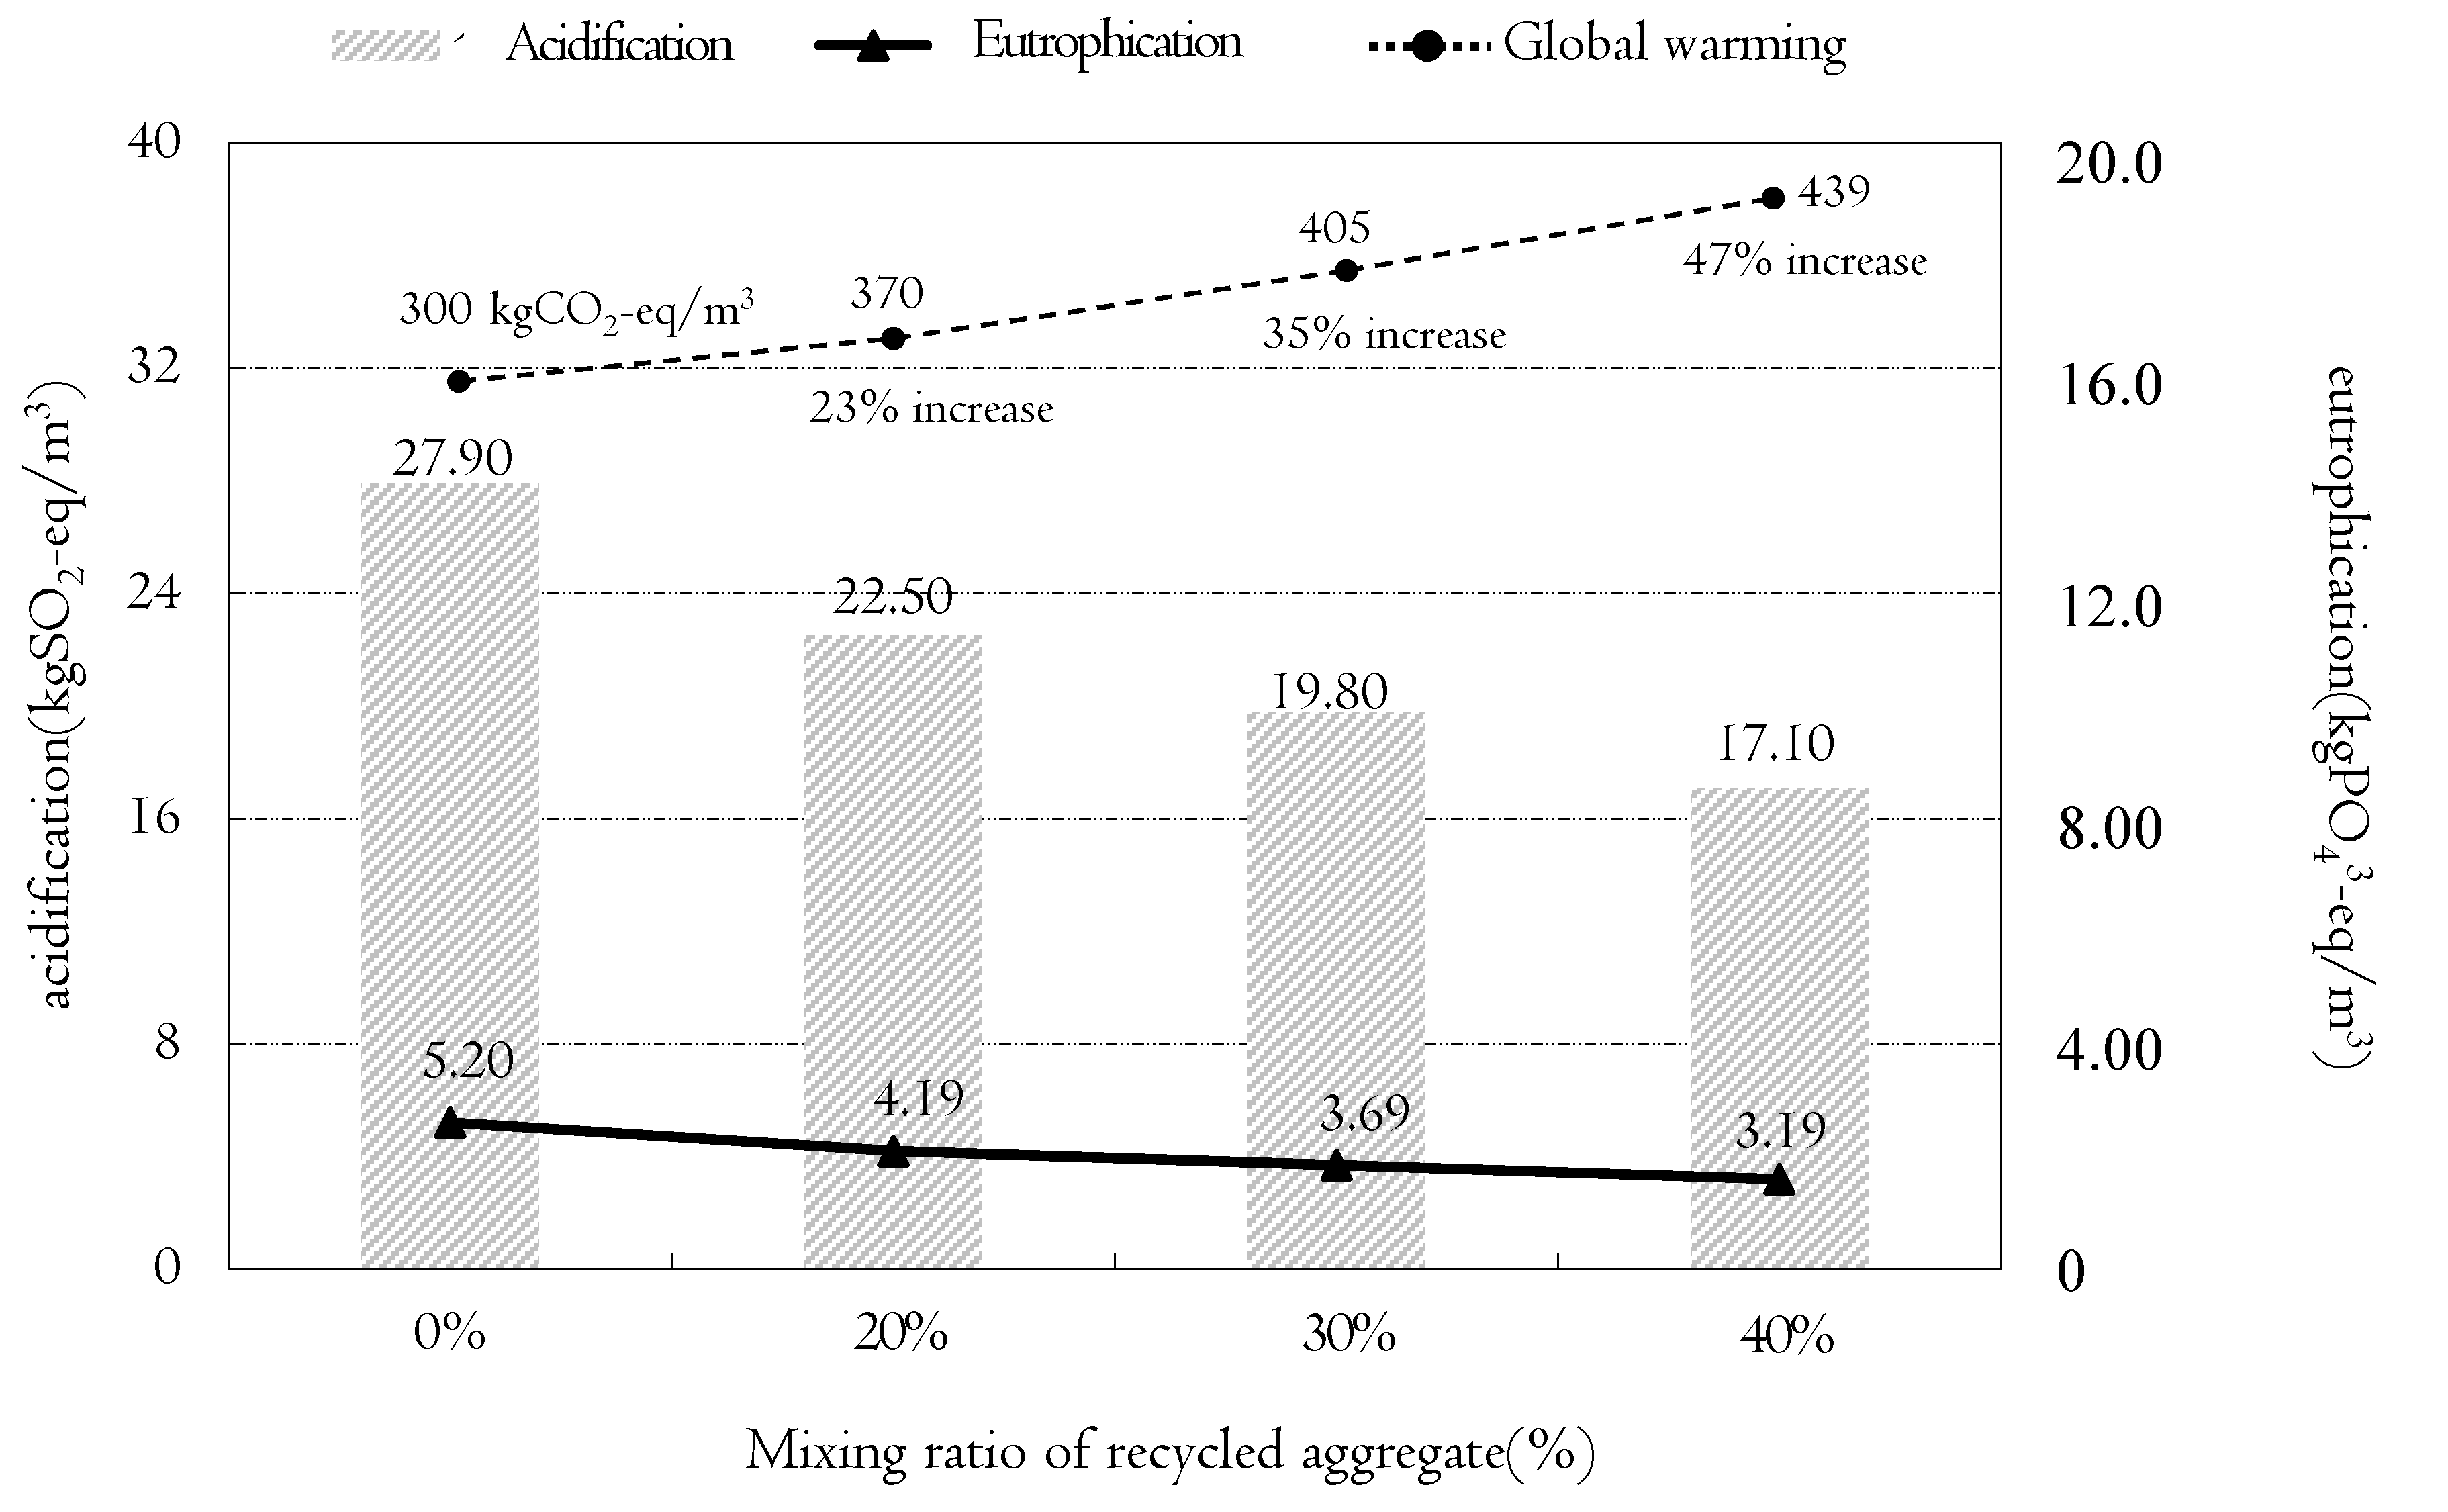
As shown in
Figure 11, acidification and eutrophication were assessed according to the mixing ratio of recycled aggregate with 24 MPa concrete. The results of the analysis showed that, as the mixing ratio of recycled aggregate increased, acidification and eutrophication decreased. When up to 40% of natural aggregate was replaced with recycled aggregate during concrete mixing, acidification and eutrophication were decreased by about 38%. Changes in acidification and eutrophication in the ecosystem resulting from mixing of recycled aggregate were analyzed in two sectors: atmospheric and hydrologic. When recycled aggregate was mixed in, there was no big impact on acidification and eutrophication of water systems, but the impact on the atmospheric sector was greatly reduced.
The reason why acidification and eutrophication in the atmospheric sector was reduced was determined to be because NO
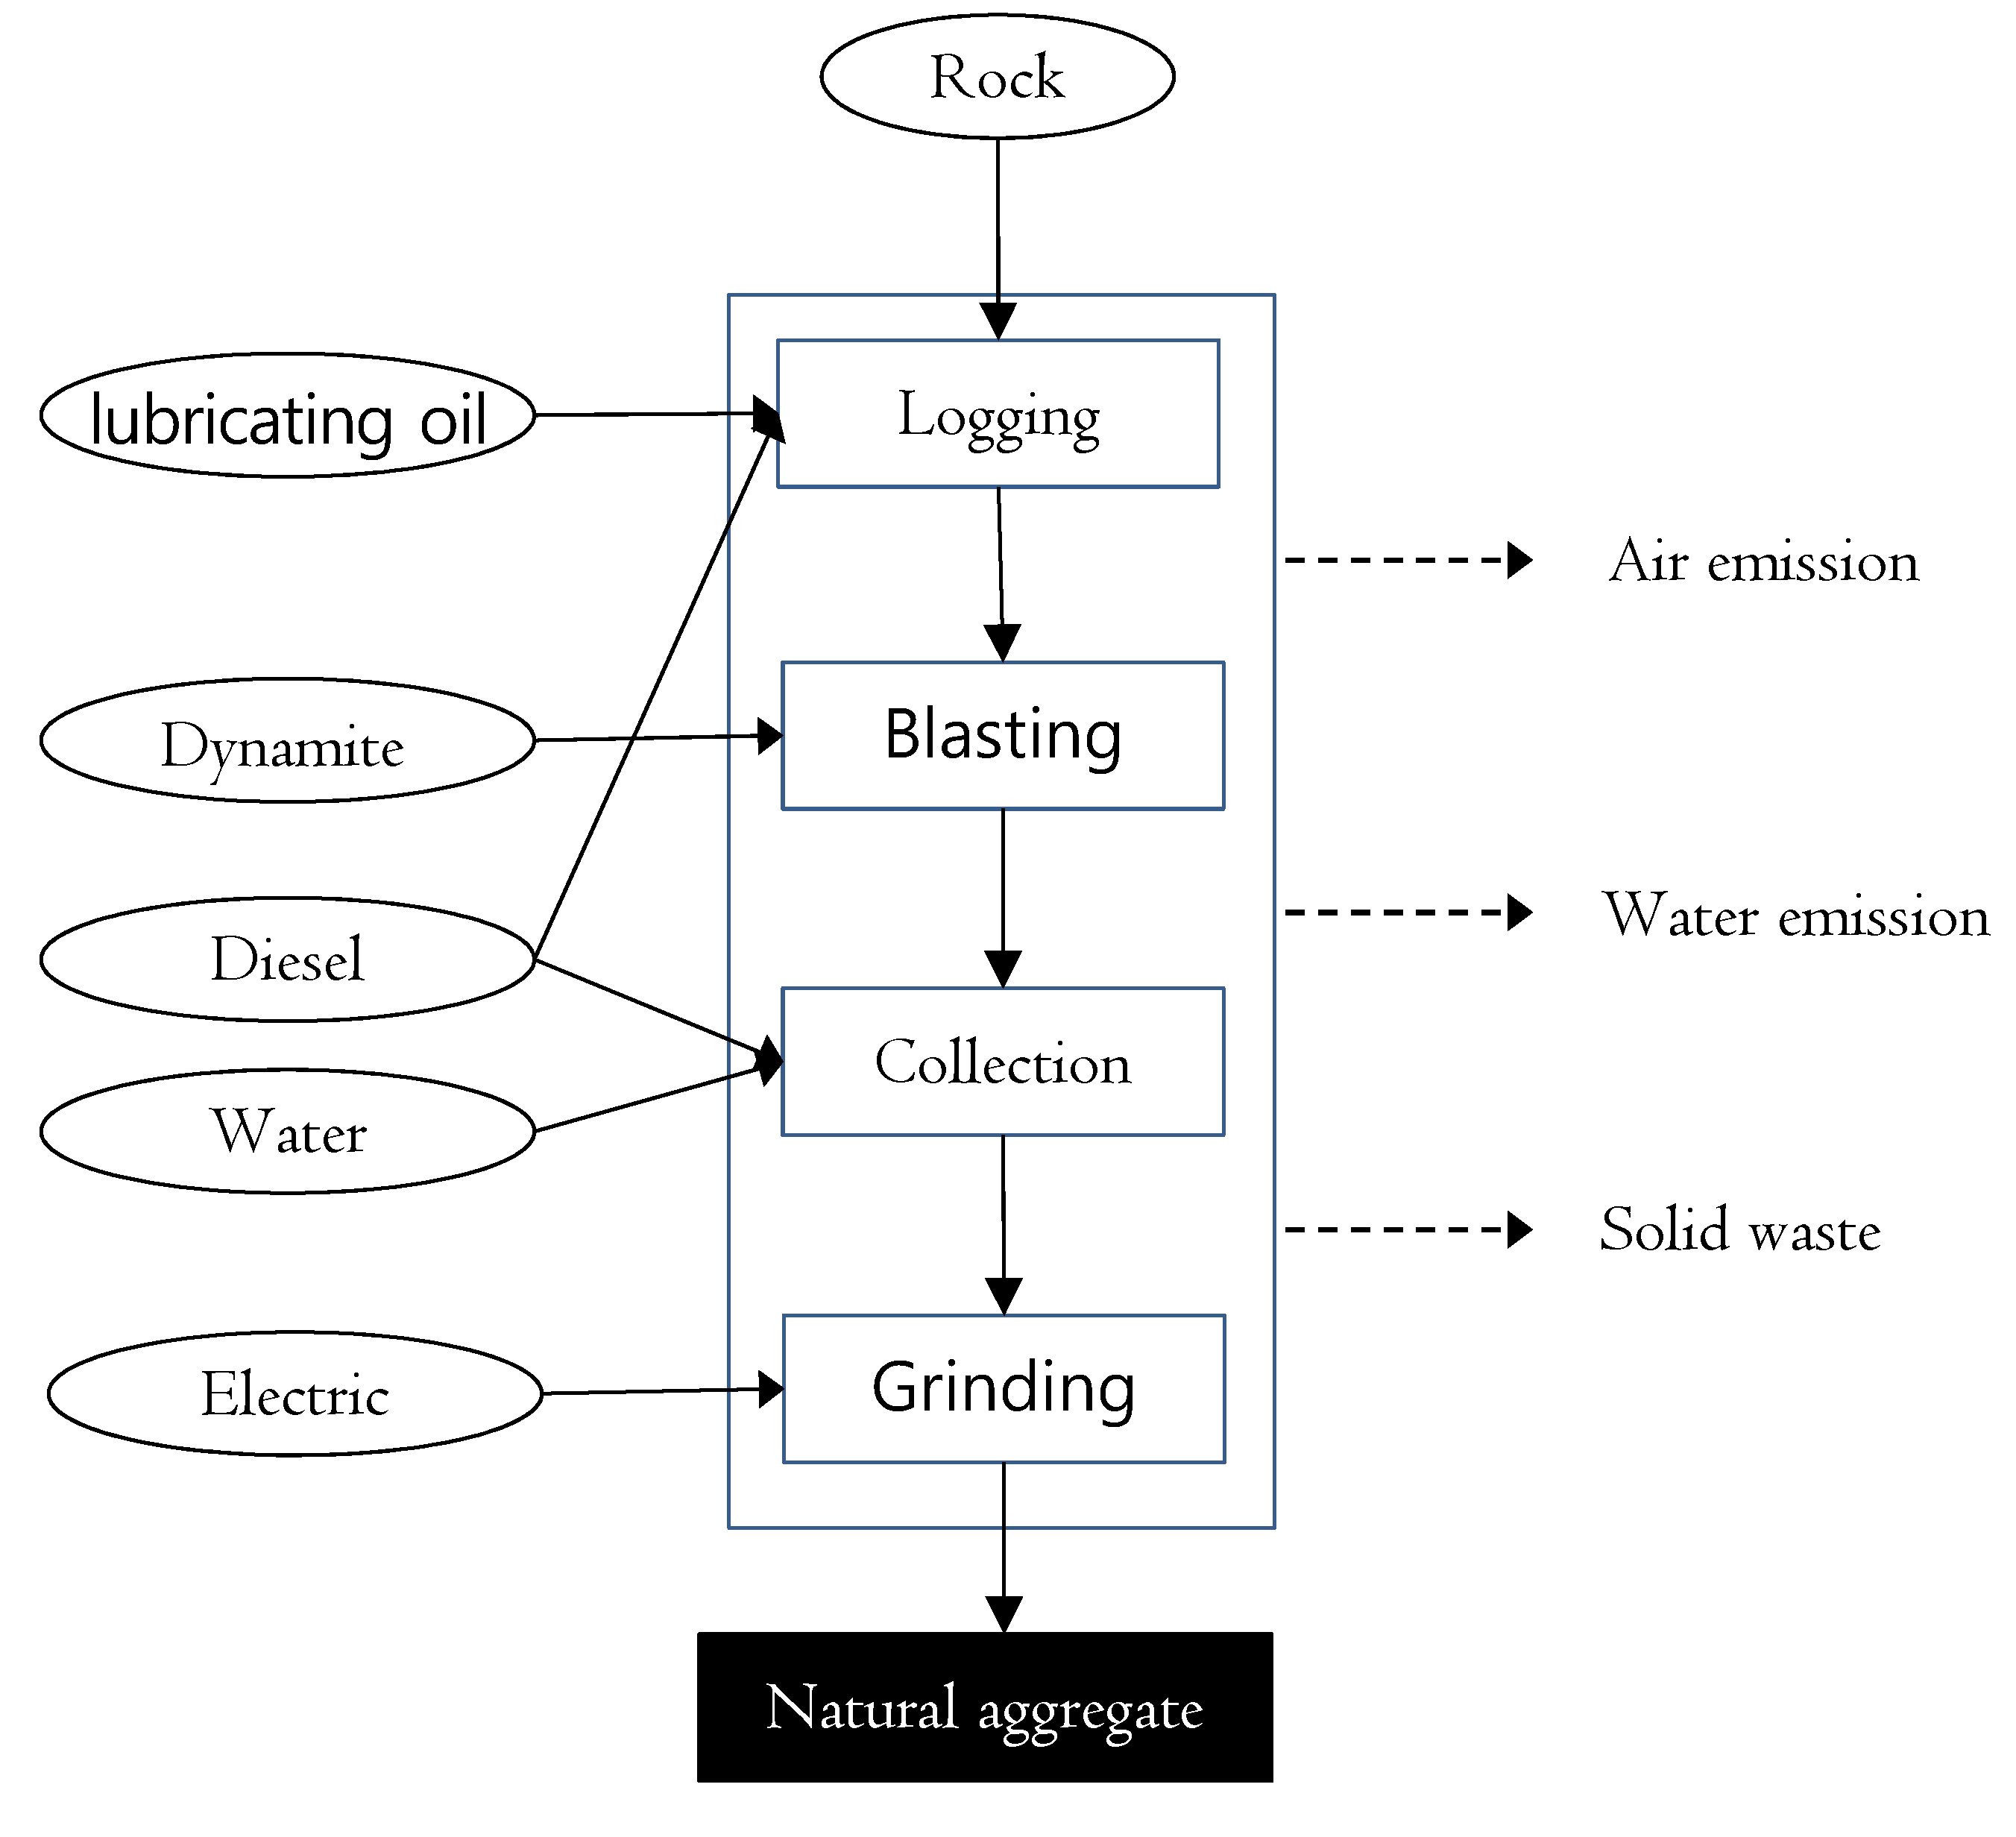
x emission was reduced more by mixing in recycled aggregate, than by using natural aggregate. The processes such as logging and pressure blasting are carried out first to produce natural aggregate, as shown in
Figure 12. The main ingredients of the lubricant and dynamite, aside from the energy used to carry out these processes, are coal-based minerals and sulfuric acid, respectively.
For this reason, substances that have an impact on acidification and eutrophication, including SO2 (sulfur dioxide), H2SO4 (sulfuric acid), and NO3− (nitrate), are emitted. Also, when pulverizing blasted rocks after collecting them, energy such as diesel and electricity is used. The substances emitted as a result of using diesel and electric energy are ammonia (NH3), ammonium (NH4+), phosphate (PO43−), and nitrogen oxide (NOx). In comparison to this, the amount of energy input into the production process of recycled aggregate is very small.
Therefore, the emission of the substances that impact acidification and eutrophication of ecosystems via the atmosphere is smaller when producing recycled aggregate than when producing natural aggregate. As the mixing ratio of recycled aggregate is increased, no change in acidification of water systems occurred; eutrophication was reduced a little but there was no significant impact on overall eutrophication.
While global warming (kg CO
2-eq) increased to a maximum of 47% as the mixing ratio of recycled aggregate increased, acidification and eutrophication were shown to decrease [
27,
28].
6. Discussion and Limitation
This study attempted to analyze the effects of the matters produced during concrete production on the acidification and eutrophication of ecosystems. Then, it proposed a method to reduce concrete causing acidification and eutrophication.
However, this study has limitations in a reliability test.
There are diverse life cycle assessment (LCA) methodologies such as the conventional process LCA, EIO-LCA and hybrid LCA. This study adopted the process LCA.
Under the process LCA, this study assessed acidification (AP) and eutrophication (EP) during concrete production. However, the results were less reliable because they were not compared to the results of the other LCA method. Therefore, there should be additional studies and analyses.
In this study, the effects were assessed by concrete strength, mix rate of admixtures and mix rate of recycled aggregate, and the results found the following:
As the GGBS mix rate increased at the mix design of concrete, GWP decreased while AP and EP remained almost unchanged because the increase or decrease in the mixing amount of cement and GGBS hardly had any influence on AP and EP.
As the mix rate of recycled aggregate increased, GWP increased while AP and EP decreased because recycled aggregate is lower than natural aggregate in terms of NOx emissions. Therefore, it would be good for the reduction of concrete AP and EP.
However, this study failed to analyze sensitivity on input and output while deriving the results.
This limitation should be overcome in future studies.
7. Conclusions
The objective of this study was to analyze the impact of the substances emitted during the concrete production process on environmental acidification and eutrophication.
In this study, a Korean model of the life cycle assessment (LCA) technique for assessing the impact of concrete on acidification and eutrophication was proposed, in accordance with the international standard. The major substances emitted during concrete production, with environmental impacts related to acidification and eutrophication, were determined.
The major substances impacting eutrophication were found to be NOx and NH3 in the case of air, and NH4+, COD, NO3−, and PO43− in the case of water systems. The major substances impacting acidification were found to be NOx, and SO2 in the case of air, and H2S and H2SO4 in the case of water systems.
As a result of carrying out an LCA of concrete, the mixing ratio of normal concrete was shown to have almost no impact on the increase or decrease of acidification and eutrophication, which was different from the result for global warming. On the other hand, the mixing ratio of aggregate, which had little impact on global warming, was found to have substantial impacts on acidification and eutrophication.
Also, when the mixing ratio of ground-granulated blast-furnace slag (GGBS) (in place of ordinary Portland cement) in concrete mixing was increased by 30%, there was almost no impact on the increase or decrease of acidification and eutrophication. This is because the amount of GGBS or normal mixed cement had little relative impact because acidification and eutrophication caused by aggregate accounted for about 85% of the total.
However, when the mixing ratio of recycled aggregate was increased in the place of natural aggregate, the acidification and eutrophication indices were found to be reduced by a maximum of about 40%. The major reason for this was found to be because the NOx emission during the production of recycled aggregate is much less than that for the production of natural aggregate.
This paper proposed a concrete design in which recycled aggregate is mixed into the concrete as a way to reduce acidification and eutrophication.
Many studies have already reported that concrete accounts for a large portion of the greenhouse gas emitted during the construction of a structure, and technologies to reduce this have been developed. Even though many analyses have been carried out on global warming using the LCA of greenhouse gas emission resulting from concrete, this is the only study focused on acidification and eutrophication.
However, the study was limited by the assessment values calculated for acidification and eutrophication in the current analysis not clearly encompassing the impacts on all compartments of the ecosystem, such as air, soil, and water. Accordingly, it is believed that future studies will need to consider application of an end-point technique that shows the impact of environmental impacts that include not only global warming, but also acidification and eutrophication, on human health, social properties, and the extinction of living things.


