3.2. Quantitative Analysis
The qualitative methodology applied previously allowed the exploration of an initially unknown reality, but showed a lack of the generalization of the data collected, and these were too aggregated (they had been obtained marketplace to marketplace). For this reason, a quantitative transversal research was undertaken on the set of Asturian marketplaces studied and focused on the traders of the different food shops located in those marketplaces. The manager of each marketplace is generally responsible for making available the resources and public administration, usually local, for planning the management needs and for waste control and management [
34]. However, traders, as the main generators of waste, should be aware of their important role in the adoption of measures to help improve waste management without losing the quality service they provide [
21]. They have the current problems of the massive increase in food waste, so the role of marketplaces in the appropriated channeling of these surpluses must be analyzed in detail.
Then, the next step of the research was justified by the deepening of the topics covered in the qualitative analysis, extending the approach to hybrid logic,
i.e., qualitative-quantitative [
41].
In this second step, we extended the research to the food sale shops in each marketplace to obtain information from the point of view of traders on infrastructure, services and management, their current status and operation, also describing their overview with a focus on daily logistics management of waste and investigating aspects that had remained unclear in the qualitative analysis, such as food donations.
Surveys were conducted in nine of the 14 Asturian marketplaces (
Table 4) belonging to seven different councils. The confidence level refers to the percentage of all possible samples that can be expected to include the true population parameter [
42]. In our sampling, the confidence level is 95%, which implies that the 95% of the confidence intervals would include the true population parameters. The sample error refers to the precision of the statistical estimate [
43].
The sample is considered representative because, as shown in
Table 5, the five marketplaces not studied (
i.e., those whose managers had not been able to be interviewed in the qualitative study) have a relatively low number of food shops (only 14.30%). The survey is also the most appropriate research methodology because the target population is relatively large (
Table 5). Therefore, we pursue now in detail and in depth the information that confirms the need for a quantitative technique [
44].
The research team at the University of Oviedo designed the questionnaire after meeting with experts where a brainstorming session was undertaken based on information and considerations obtained in the literature review and the previous qualitative study. A subsequent pre-test was conducted in two food marketplaces belonging to the same council. This pre-test suggested some additional amendments to the draft. The final survey is divided into the blocks shown in
Table 6.
The first block refers to general data about every stall. An important fact in this section is the activity of the marketplaces, traditionally engaged in selling fresh products with extra quality [
34]. For this reason, marketplaces occupy a strong position in the distribution of fruit, vegetables, fish, meat and charcuterie [
30].
With respect to the surface area of each shop, many marketplaces require a minimum for this figure. In the case of fresh food stalls, the optimal dimensions can be set between 15 and 20 square meters of retail space, depending on the size and type of marketplace where they are located [
32].
To achieve successful results in this research and due to the fact that the marketplaces develop a commercialization of perishable goods [
33], the availability of cold systems to preserve the products is relevant information to obtain. As they are proposed to be fresh food donations, we must ensure that they have been properly preserved at the required temperature by maintaining the cold chain [
36].
Nowadays, it is necessary to introduce certain changes to the marketplaces to compete with more modern commercial formulae. One of these changes is a broader timetable adapted to the new needs of customers [
30].
The second block in
Table 6 is relatively short and focuses on the kinds of customers that attend this type of point of sale (individuals, restaurants or others), because they will affect sales and billing. The most common commercial business is to attend to the final consumer [
34]. Generally, housewives are the biggest group of shoppers in municipal marketplaces (52%), followed by employed (27%) and retired people (16%), unemployed people (4%) and students (1%), being the smallest group of buyers in the marketplaces [
33].
The third section deals with questions related to waste generated. The aim is to know in detail the type of waste from each type of stall in the marketplace and the reasons for it. As already discussed in the previous qualitative analysis (see
Section 3.1), in a marketplace, the greatest amount of waste is composed of the organic waste, followed by cardboard [
21].
Surpluses are generated, and food is thrown away. In order to reduce waste at its source, it is important to know the reasons why food is thrown away in marketplaces: defects in packaging, poor appearance of the item, expiry date or overproduction [
36].
The fourth and last block of questions deals with waste management. Marketplaces are one of the main purchase channels for fresh items, and traders who develop their activity in them have to take the necessary measures to improve the quality of their services and simultaneously to protect the environment [
29]. Recently, domestic waste has increased significantly in cities, becoming a concern for society. Therefore, affordable and simple solutions based on habit changes and infrastructure collection and treatment must be considered [
21]. Then, each trader’s decision to carry out proper waste separation is really crucial.
A study undertaken in 2007 on the improvement of marketplaces’ management [
32] shows that information and education campaigns aimed at traders and market managers were very efficient. Therefore, it is necessary to know if these types of campaigns have been conducted in the marketplaces studied.
Butchers and fishmongers in marketplaces must manage their waste through companies that transform it into other usable products, which will be an indicator of the degree of commitment to waste management in each marketplace. In these stalls, it is also important to throw away organic waste into the container (the right way is in bags), because they can stain the container and produce bad odors. A clean look of all spaces commonly used in the marketplace is an essential factor to make the action of buying a pleasant one [
32].
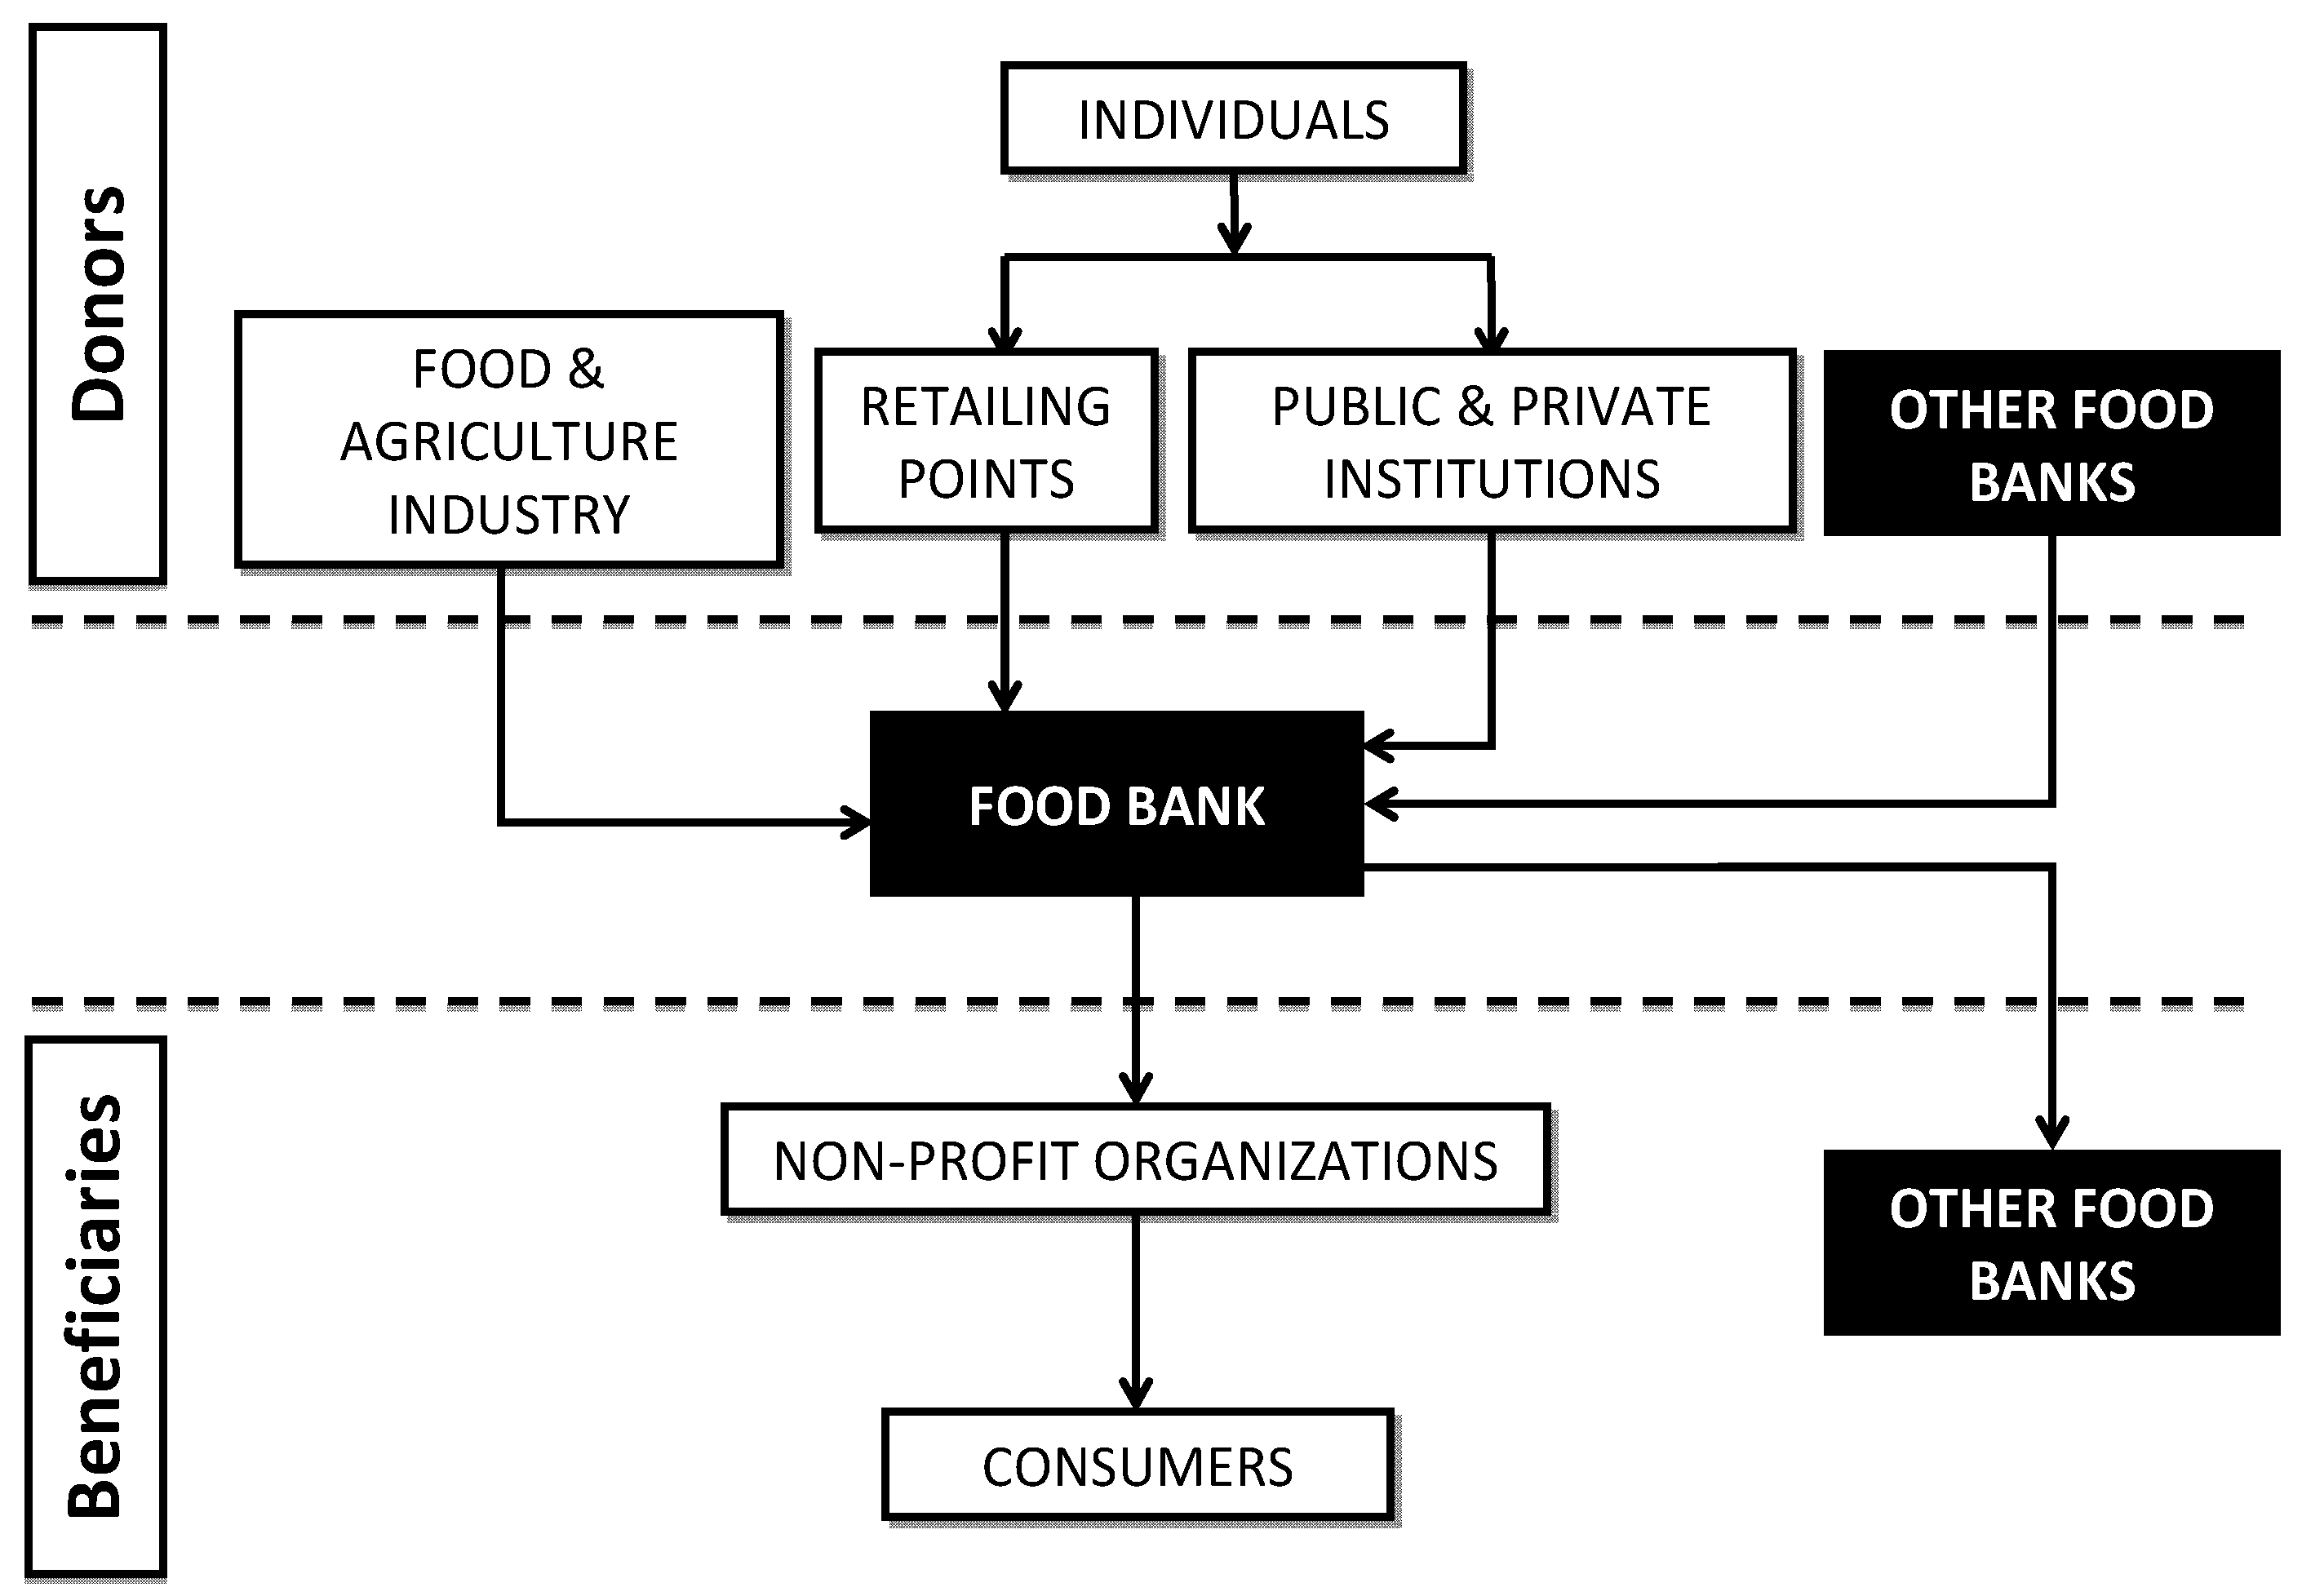
Surplus food channeling is an opportunity for waste prevention with a strong social impact that has an increasing implantation [
22]. Then, creating pathways for the use of food surplus that cannot be offered for sale due to different reasons could be the right way to solve this social problem [
8]. One of these pathways could be food banks. Apart from the environmental and economic benefits (due to the reduced requirements of collection and treatment), this performance incorporates social added value. The issue of donations was not entirely clear in the qualitative analysis, so it will be analyzed in depth by means of the quantitative study. The collection of surplus from different stalls and their subsequent storage in the refrigerator may be the best way to keep food in good condition [
22] to achieve such social goals.
Face to face surveys were carried out in all of the marketplaces studied before. From the 172 shops that are presently open in these 10 marketplaces, only 150 are food sellers.
Surveys took place from 14 November 2014–21 April 2015. At the end of the interviews with the managers of marketplaces, the need for surveying to fulfill the research was considered and explained. Therefore, in most cases, the interviewed managers were the link to contacting people in charge of each shop.
3.2.1. Descriptive Analysis of Data Collected in Food Shops
The shops dedicated to meat selling represent 30.8% of total shops in Asturian marketplaces, fish 17.4%, fruit and vegetables 14.5% and cooked meats 11.6%; 7.6% are bakeries; 4.7% other food shops; and 0.6% are frozen foods. Regarding the surface area of each facility, the average is 18.82 m2. The shops are open an average of 45 h per week, serving the public about seven hours a day, and 94% of shops have cold storage facilities to preserve products.
An average of 74 customers come to each facility per day, although the data vary widely (the maximum is 500 customers a day).
Eighty one percent of shops generate paper and cardboard waste, and 78% is the organic fraction (meat or fish is 60%, fruit and vegetables 18%). The percentage of organic waste does not reach 100% because some shops, such as delicatessens, bakeries or others, say they do not generate this type of waste, or they do so in insignificant amounts, or surpluses are collected by the supplier.
The daily amounts of waste that are generated at each shop allow us to estimate the distribution in weight by each kind of waste (see
Table 7), which is directly related to the activity. On the one hand, the line “average” refers to the average value obtained with the sample data; on the other hand, the sum of the same data is represented in the line named “total”. Meat and fish waste are the most abundant, as almost two-thirds of surveyed shops (65%) were butchers, delicatessens or fishmongers.
Table 8 and
Table 9 show the total generation of daily waste for different types of shop, allowing the identification of waste generated by activity and the activities that generate the most waste. Fishmongers are the highest (45.68% total waste), followed by butchers (28.26%) and greengrocers (19.00%).
In 57% of shops, organic waste is thrown away because it is not required when a product has been made/prepared, i.e., in the case of a butcher, skins, bones, fat or offal, and that of a fishmonger, skins, guts and heads. More than half (54%) of stallholders surveyed said that this is the main reason why they throw away their waste. Twenty six percent throw away organic waste because it is made up of damaged products that cannot be consumed. Twenty percent dispose of waste because it is composed of surplus products that have failed to sell.
Thirty six percent produce mixed waste and put all of it in the same container, due to the fact that 95% of shops do not have separate containers that allow for the separation of waste (the remaining 5% recognize that although there are containers in the marketplace to separate waste, it is easier or faster to dispose of it all in the same place). With respect to how organic waste is deposited in the container, in 88% of cases, it is inside disposal bags, and only 11% is done in bulk.
As for the possibility of donating food, in 17% of shops, food waste is thrown away; in 40%, food surpluses are donated somehow; and in 70% of cases, they are handled differently, such as to feed animals or to produce other products, such as breadcrumbs. If a classification is carried out by type of activity, 44% of the food surplus from greengrocers is donated, followed by fishmongers (33%) and butchers and delicatessens (27%). The shops where most surpluses are thrown away are the fishmongers (18%). Many traders claim not to have a daily surplus, because what they are not able to sell they can preserve due to the food characteristics (this is the case in delicatessens) or they can preserve food under refrigeration for several additional days (as in butchers or fishmongers).
In none of the cases in which donations are made is this done in a coordinated way by the marketplace. Most of the donations are made once a week (41%). Thirty seven percent of donations are made more than once a week and 22% sporadically. The annual average of donations by shops stands at 329.33 kg, the maximum being 1080 kg.
Considering only the shops that do not make donations, 49% are interested in starting to donate food, 37% would deliver fish and 32% meat. To a lesser extent, there are delicatessens (21%), greengrocers (11%) and bakeries (11%) that would donate; 68% of shops that are interested in donating could do it sporadically.
Finally, 61% said that a food pickup system, shop by shop, would be the best practice, and 27% consider that food donated should be kept cold. The possibility of providing a shared container or space in the marketplace in which to deposit donations only convinced 15% of traders.
3.2.2. Cluster Analysis of Results
When the descriptive analysis was completed, we tried to better classify the shops of Asturian marketplaces in order to adjust the proposals for improvements that would increase donations. Therefore, we decided to carry out a cluster analysis where the only classification variable used is the total amount of organic waste generated by each shop, which is justified because the aim is to recover the food surpluses of this economic activity and, thus, to reduce the organic waste stream.
After checking the normality of the classification variable chosen (using a Lilliefors test) and the prerequisite of sample representativeness (that is met by the high response rate, over 70% of the target population according to
Table 4), the suitable number of clusters to obtain was determined, and the result was two (according to the method of hierarchical clusters). When analyzing the dendrogram (or the distance matrix), the existence of two different clusters with different sizes of grouping of shops in Asturian marketplaces was detected. Then, a new cluster analysis using the algorithm k-means confirmed the previous result. To ensure the validity of the previous classification, a discriminant analysis (employing the Wilks lambda method) was conducted, including the classification variable. This test allowed the rejection of the null hypothesis of equality in the averages of the discriminant function between the two groups identified as commercial shops.
In
Table 10, shops belonging to each group are described. In Cluster A, there are 13 commercial shops that generate in their daily activities eight-times more organic waste than businesses in Cluster B. In addition, in Cluster A, all organic waste comes from meat and fish, while Cluster B also generates waste from fruit and vegetables, although on average, slightly lower amounts. Shops in Cluster A also belong to marketplaces privately managed under administrative concessions.
Shops in marketplace Type A could potentially offer more donations (each one generates much more organic waste than shops of Type B, about eight-times more by weight as seen in
Table 10), and they are located in marketplaces where donations would be easily coordinated, because they are better managed (public ownership and private management, which is embodied in a clear and customized command unit integrated for specific management positions).
In Cluster B, there is the largest number of shops, a total of 96, with more diverse activities. Most of the marketplaces where these facilities are located are managed directly by the local public administration, which is also who owns them. Each shop of Type B generates an eighth of the waste, compared to the other cluster, which was partially balanced by the amount (the number of shops is more than seven times that of Cluster A) and its greater propensity to donate (more than double in frequency, more than triple in quantity). However, they are located in the worst managed marketplaces (dispersion among various public offices, lack of specific management positions, slow political decisions, etc.).
In light of these data, it seems advisable that information campaigns about organic waste management and promotion of altruistic donations of food surplus are refereed differently for each cluster, taking into account both the type of majority activity and the management model in its marketplace.
Food banks are non-profit organizations, and they have scarce resources (especially economic ones). Attending to the cluster analysis results, the food bank in the region studied must focus on the sensibilization campaigns to shops and marketplaces belonging to Cluster A for the following reasons:
As Cluster A only has 13 shops, the food bank does not need too many resources to inform/make contact with them.
These few shops are the greatest generators of food waste. If they are properly managed, the flow of food donations could be increased considerably.
These shops are dedicated mainly to selling meat and fish, which are basic items for a nutritional and balanced diet.
These shops belong to privately-managed marketplaces, so the presence of an administrator could help to begin organizing the food donations.
3.2.3. Estimations of Potential Food Recovery
Once the potential of food donations from marketplaces is clear, the next research step is estimating the quantities that could be recovered.
Firstly, depending on the type of property/management, it has been found that marketplaces differ from one another. Therefore, they can be classified into three types (
Table 11): Group I (integration of two marketplaces municipally owned, but privately run through an administrative concession), Group II (in which there are six marketplaces with municipal property and management) and Group III (that consists of a single marketplace privately owned and operated). This first step has shown a better understanding by the two managers belonging to marketplaces in Group I; in Groups II and III, the absence of a central manager made it difficult to obtain information in some cases, and it was necessary to contact several people from different departments or areas involved.
The total daily generation of organic waste in all of the Asturian marketplaces was estimated at 1797 kg (
Table 12), which means about 561 tons per year. In addition, these marketplaces could recover annually for social purposes at least 36 tons of food (
Table 13), a figure that cannot be considered really high compared to that of the more than 858 tons per year recovered by the food bank in the region during 2014 [
18]. The study should now be revised and extended to other types of commercial shops or food waste producing entities. However, donations of fresh food that are highly demanded by the final recipients can be observed.
Furthermore the greatest quantities of fresh food waste in marketplaces are produced by fishmongers; this result is not exactly equal to the food losses in the distribution and sales in the USA, Canada, Australia and New Zealand, for which seafood was in second place after fruit and vegetables [
5].
3.3. Suggestions for Guidelines to Improve Recovery and Donation of Food
In more detail, the cluster analysis provided a division of the shops into two groups. Cluster A, nearly eight-times smaller than B, is integrated mainly by private management marketplaces. They are shops formed by butchers and fishmongers with an average generation of organic waste much higher and with fewer tendencies to donate than Cluster B. Cluster B is also formed by greengrocers and other food shops that generate less waste and donate more. These results promote a more initial intensive awareness campaign from food banks to shops belonging to Cluster A due to the fact that they produce greater quantities of food waste, but they are a smaller number of shops (so it is easier and less expensive to carry out donations successfully).
Looking at the results obtained, three groups of recommendations and improvements are suggested considering both the type of management and the cluster to which it belongs (
Table 14).
The role of the different stakeholders in the organic waste supply chain is crucial for successful results. Therefore, recommendations for future improvement actions are focused directly on the different players involved in each marketplace: town hall, manager and sellers.
In Group I, the proposals are different for Clusters A and B, but similar in Marketplaces 1 and 2, due to the fact that they have the same management model, and in both, the figure of the manager is clear. For instance, Cluster A shops belong to butchers and fishmongers that generate large quantities of organic waste, where more than half are not recoverable, being bones, skins and fish heads, all of them coming from product preparation; they have to be informed of the correct disposal methods for these kinds of waste. The Cluster B shops have to be made aware of the new rule for putting organic waste into a separate dustbin.
In Group II there are also different proposals, but both for Cluster B, because only two shops of this group belong to Cluster A (
Table 11), and it is not worth making differentiated efforts for them. On the one hand, an action plan has been devised for Marketplaces 3 and 4.1, because they have the same management model and the same number of shops (16). On the other hand, proposals and improvements are made for Marketplaces 4.2, 5, 6.1 and 6.2, which have a local management and a low number of shops open.
Group III is only integrated for Marketplace 7, which has a great number of active shops. Two different action plans for sellers, one for shops in Cluster A and another one for Cluster B, are elaborated with reference to the special features of this marketplace.
Table 11 and
Table 14 are the combination of the classification obtained from the qualitative study (Groups I, II and III according to management) and the quantitative study using cluster analysis (Clusters A and B). As expressed in the previous paragraphs, this classification determines how improvement proposals would be applied in practice, because the number and type of shops and the management model in each marketplace must be taken into account. These proposals, which are then expressed as a list of general recommendations, are aimed at the key stakeholders: managers, administrators and traders. Then, as a first general measure, a basic recommendation is made to the marketplaces belonging to Group II (public administration): the management should be centralized in a person belonging to a specific department within the council (environment, works contracts, heritage,
etc.).
Following the results and once all marketplaces have a person in charge, either a manager, administrator, president or similar, the following guidelines for these people are proposed:
Establishing a fluid relationship between the waste manager and the Food Bank of Asturias, through frequent meetings on the requirements for collection, monitoring, etc.
Training for traders on bio-waste and awareness, through information and motivation sessions, as well as posters or other local/inexpensive broadcasting media.
Providing appropriate resources for separate collection and donations. Managers of marketplaces should supply traders with waste containers and adequate space for them.
Control of the new collection: the manager must be aware of the degree of daily filling of organic waste containers and what shops are donating or are interested in donating.
Dissemination and marketing of good performance towards customers, through display panels and leaflets in the collaborator shops and other similar means.
All of these improvement proposals, firstly for managers and later for traders, could have a general interest in order to be extrapolated to any marketplace.
As for the specific proposals to traders, several measures can be identified:
Control of the amounts of waste generated: Traders should be knowledgeable about the quantities of waste from their shops and the economic value of these.
Minimization of bio-waste: Managing organic waste is meaningless if the reduction of its production has not been previously tried by protecting products adequately.
Awareness campaigns on the situation of certain disadvantaged collectives in order to prioritize the surplus as donations for human consumption.
Collaboration agreement between beneficiary entities and donor shops to quickly co-manage edible food for human consumption.
Traceability guarantee of food donated by invoices delivered by traders to the recipient entities.


