
Evidence of Absolute Decoupling from Real World Policy Mixes in Europe

Abstract
:1. Introduction
- -
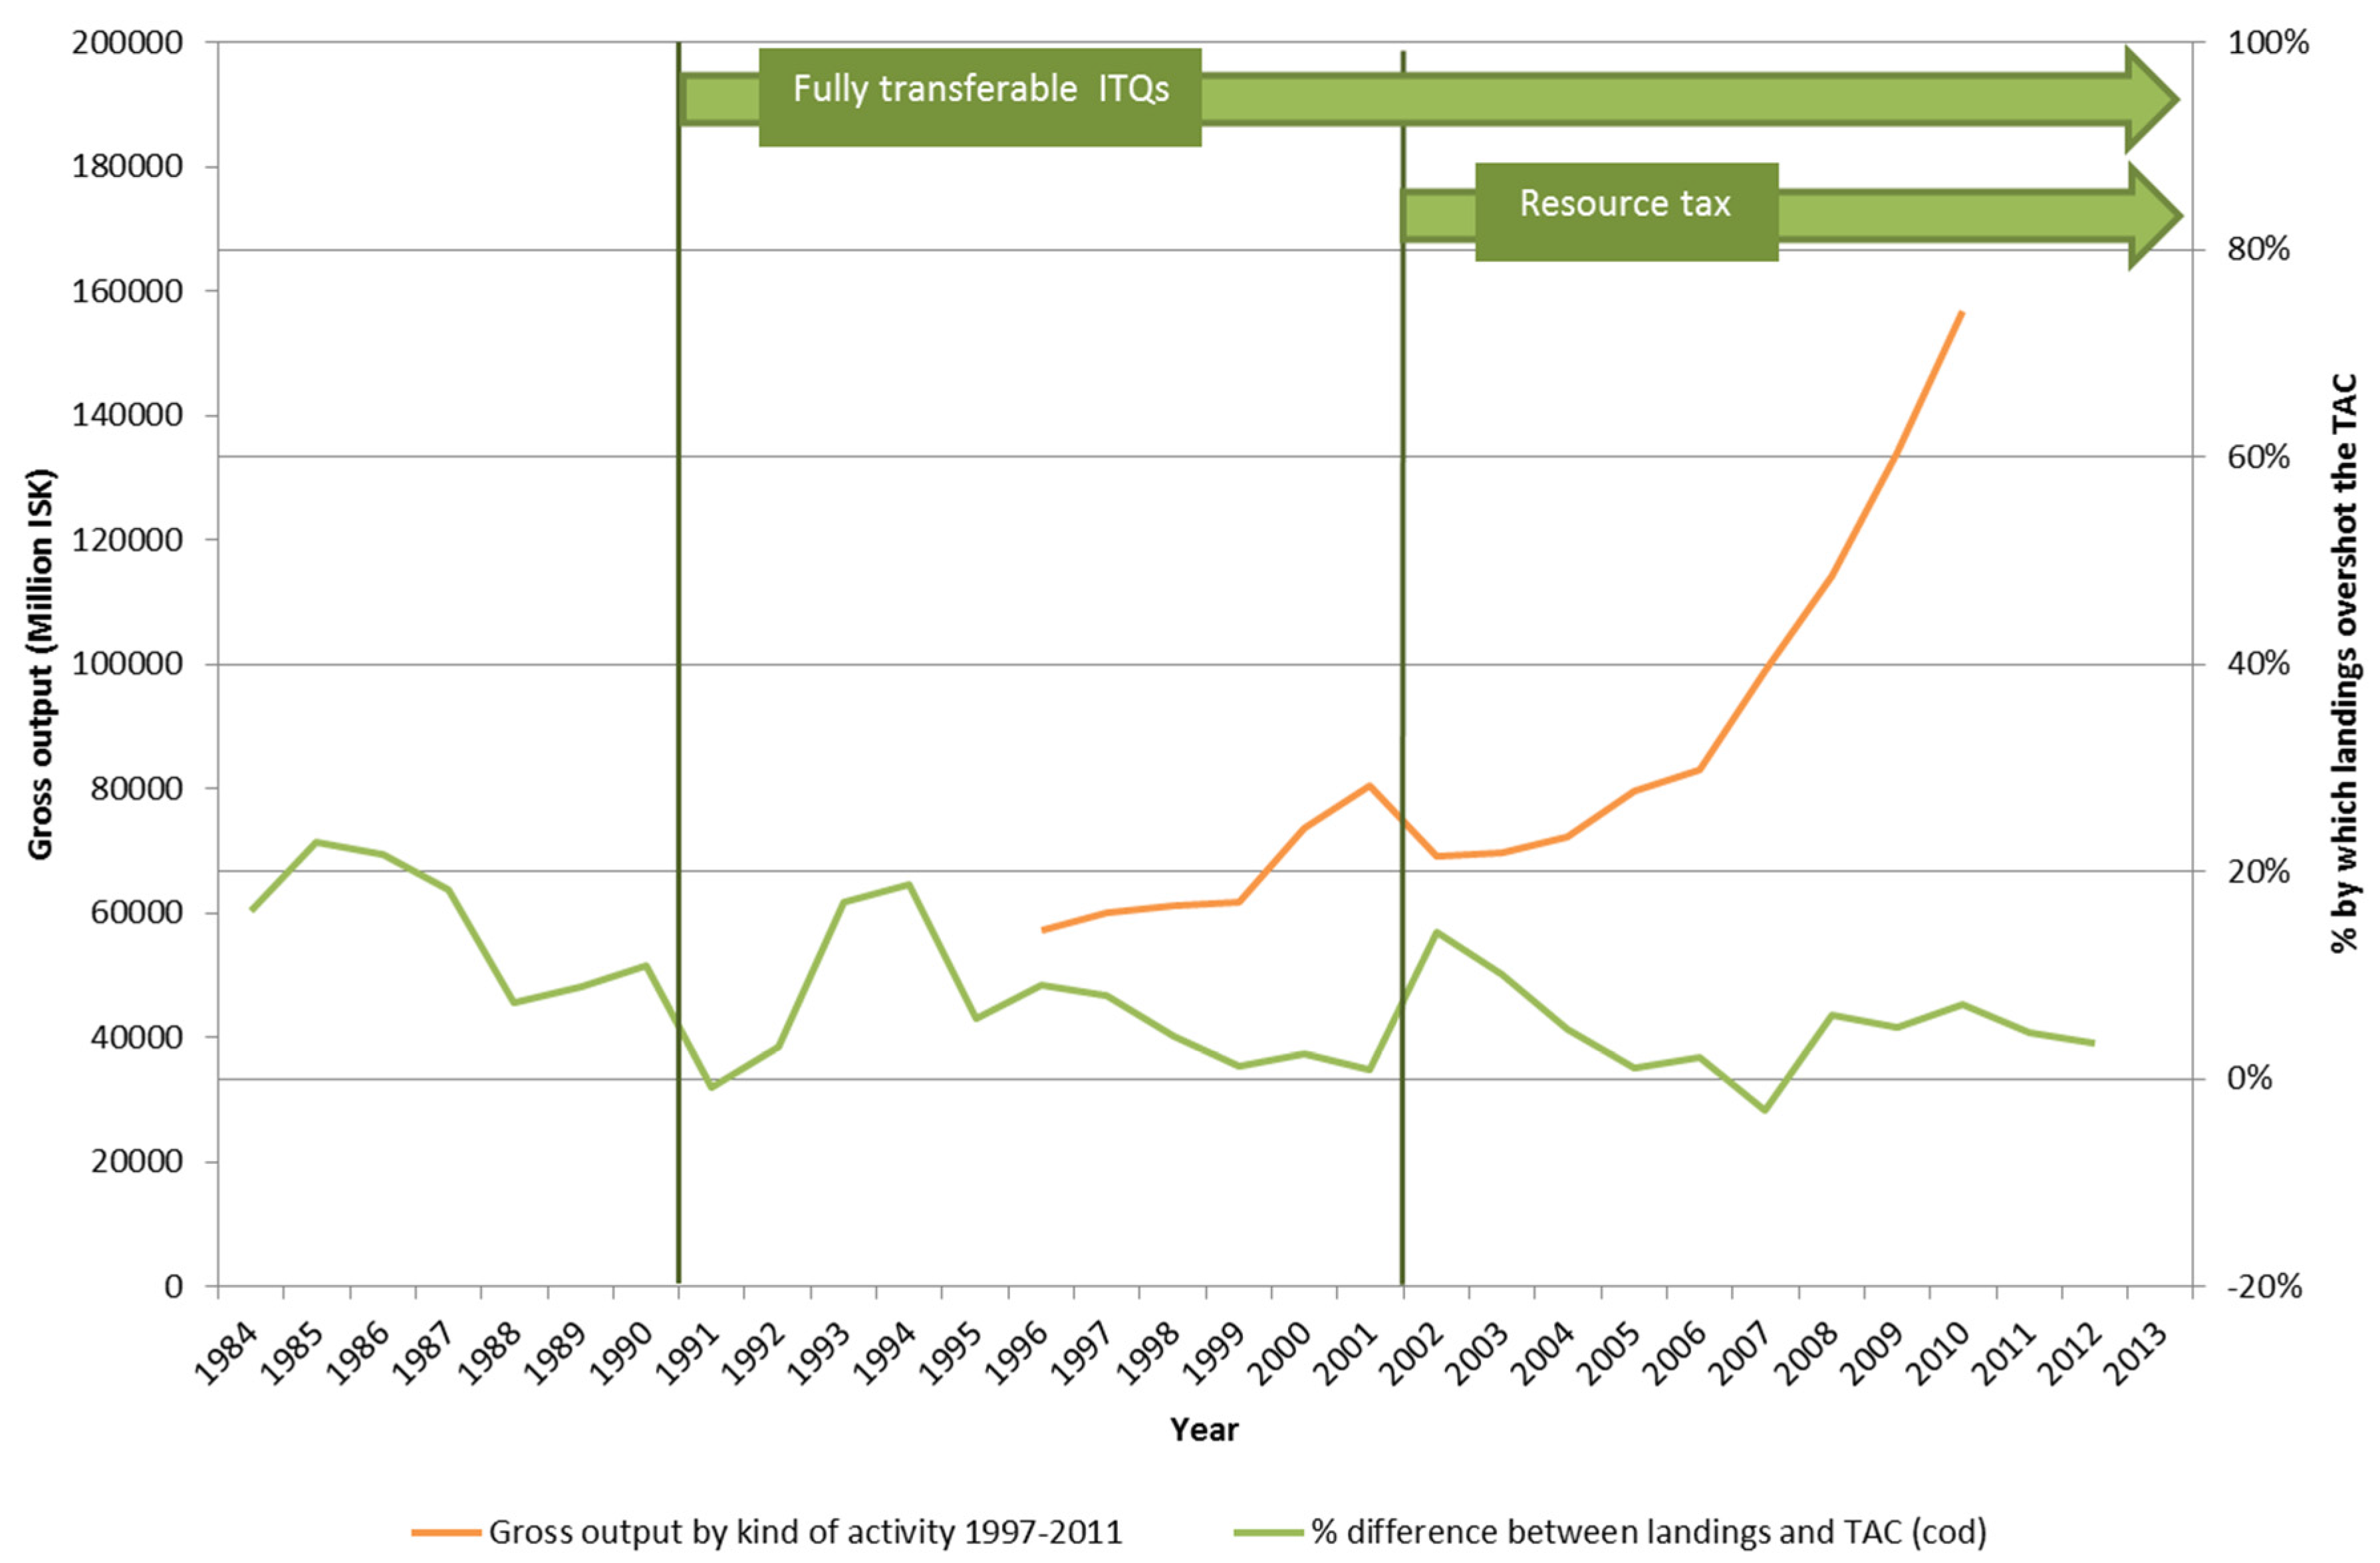
- Sustainable levels of fishing in Iceland
- -
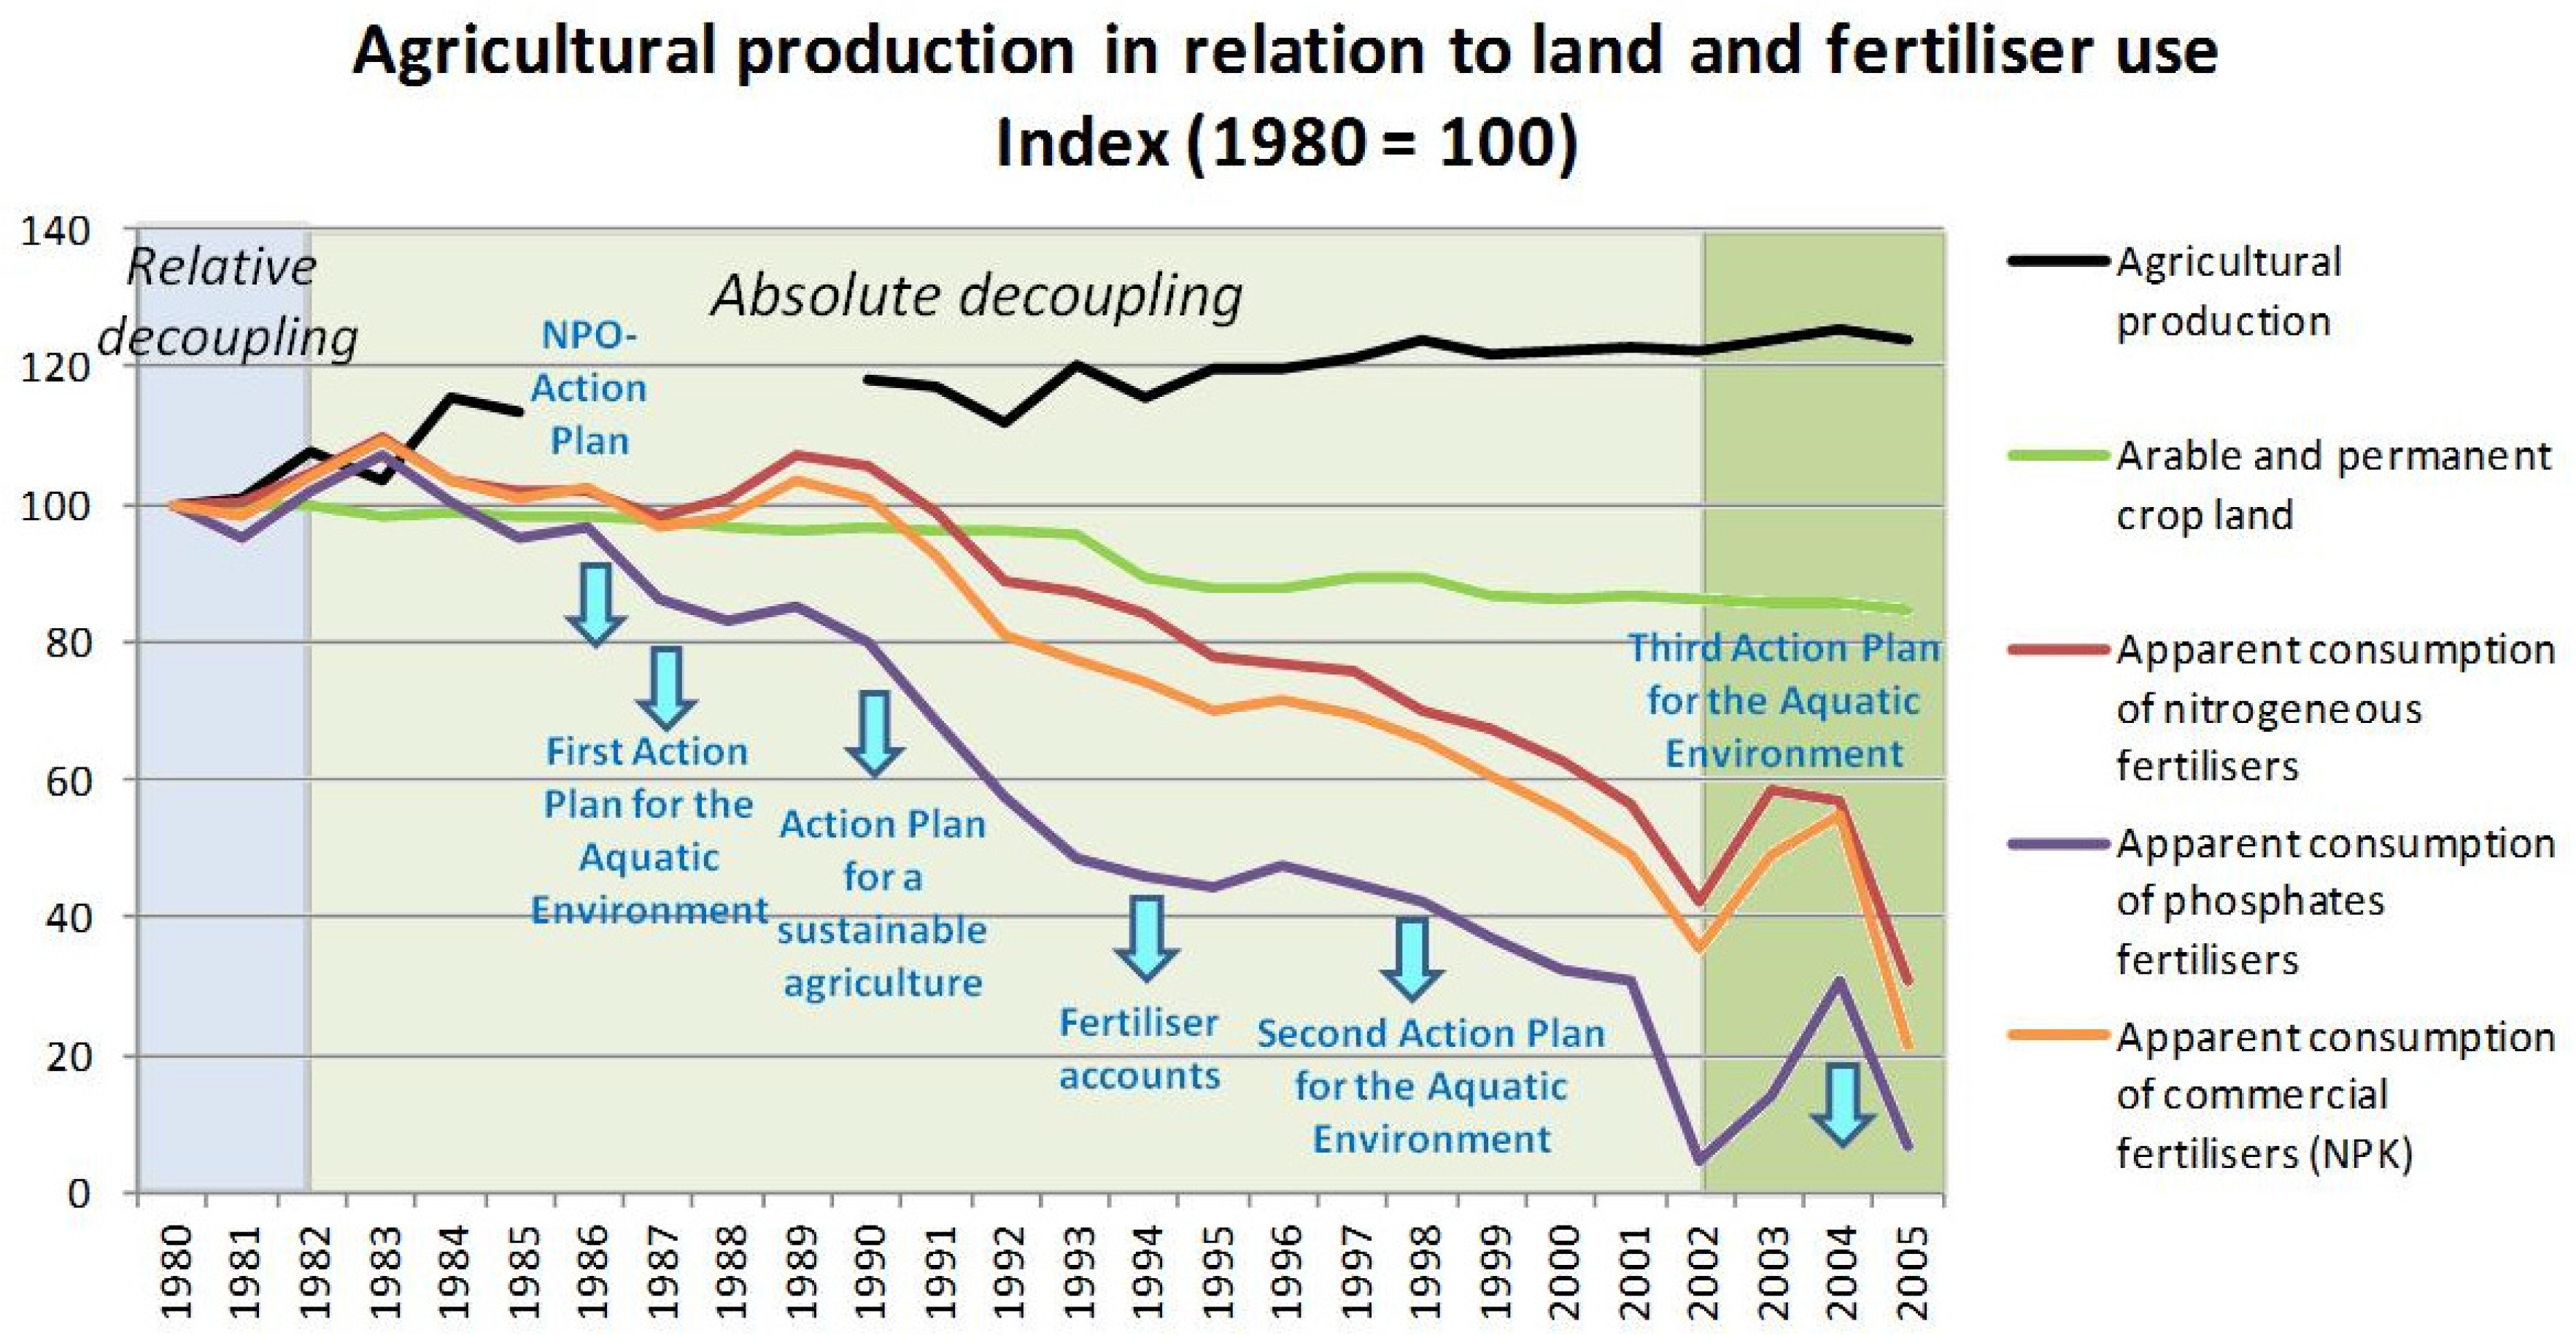
- Reducing fertiliser use in Denmark
- -
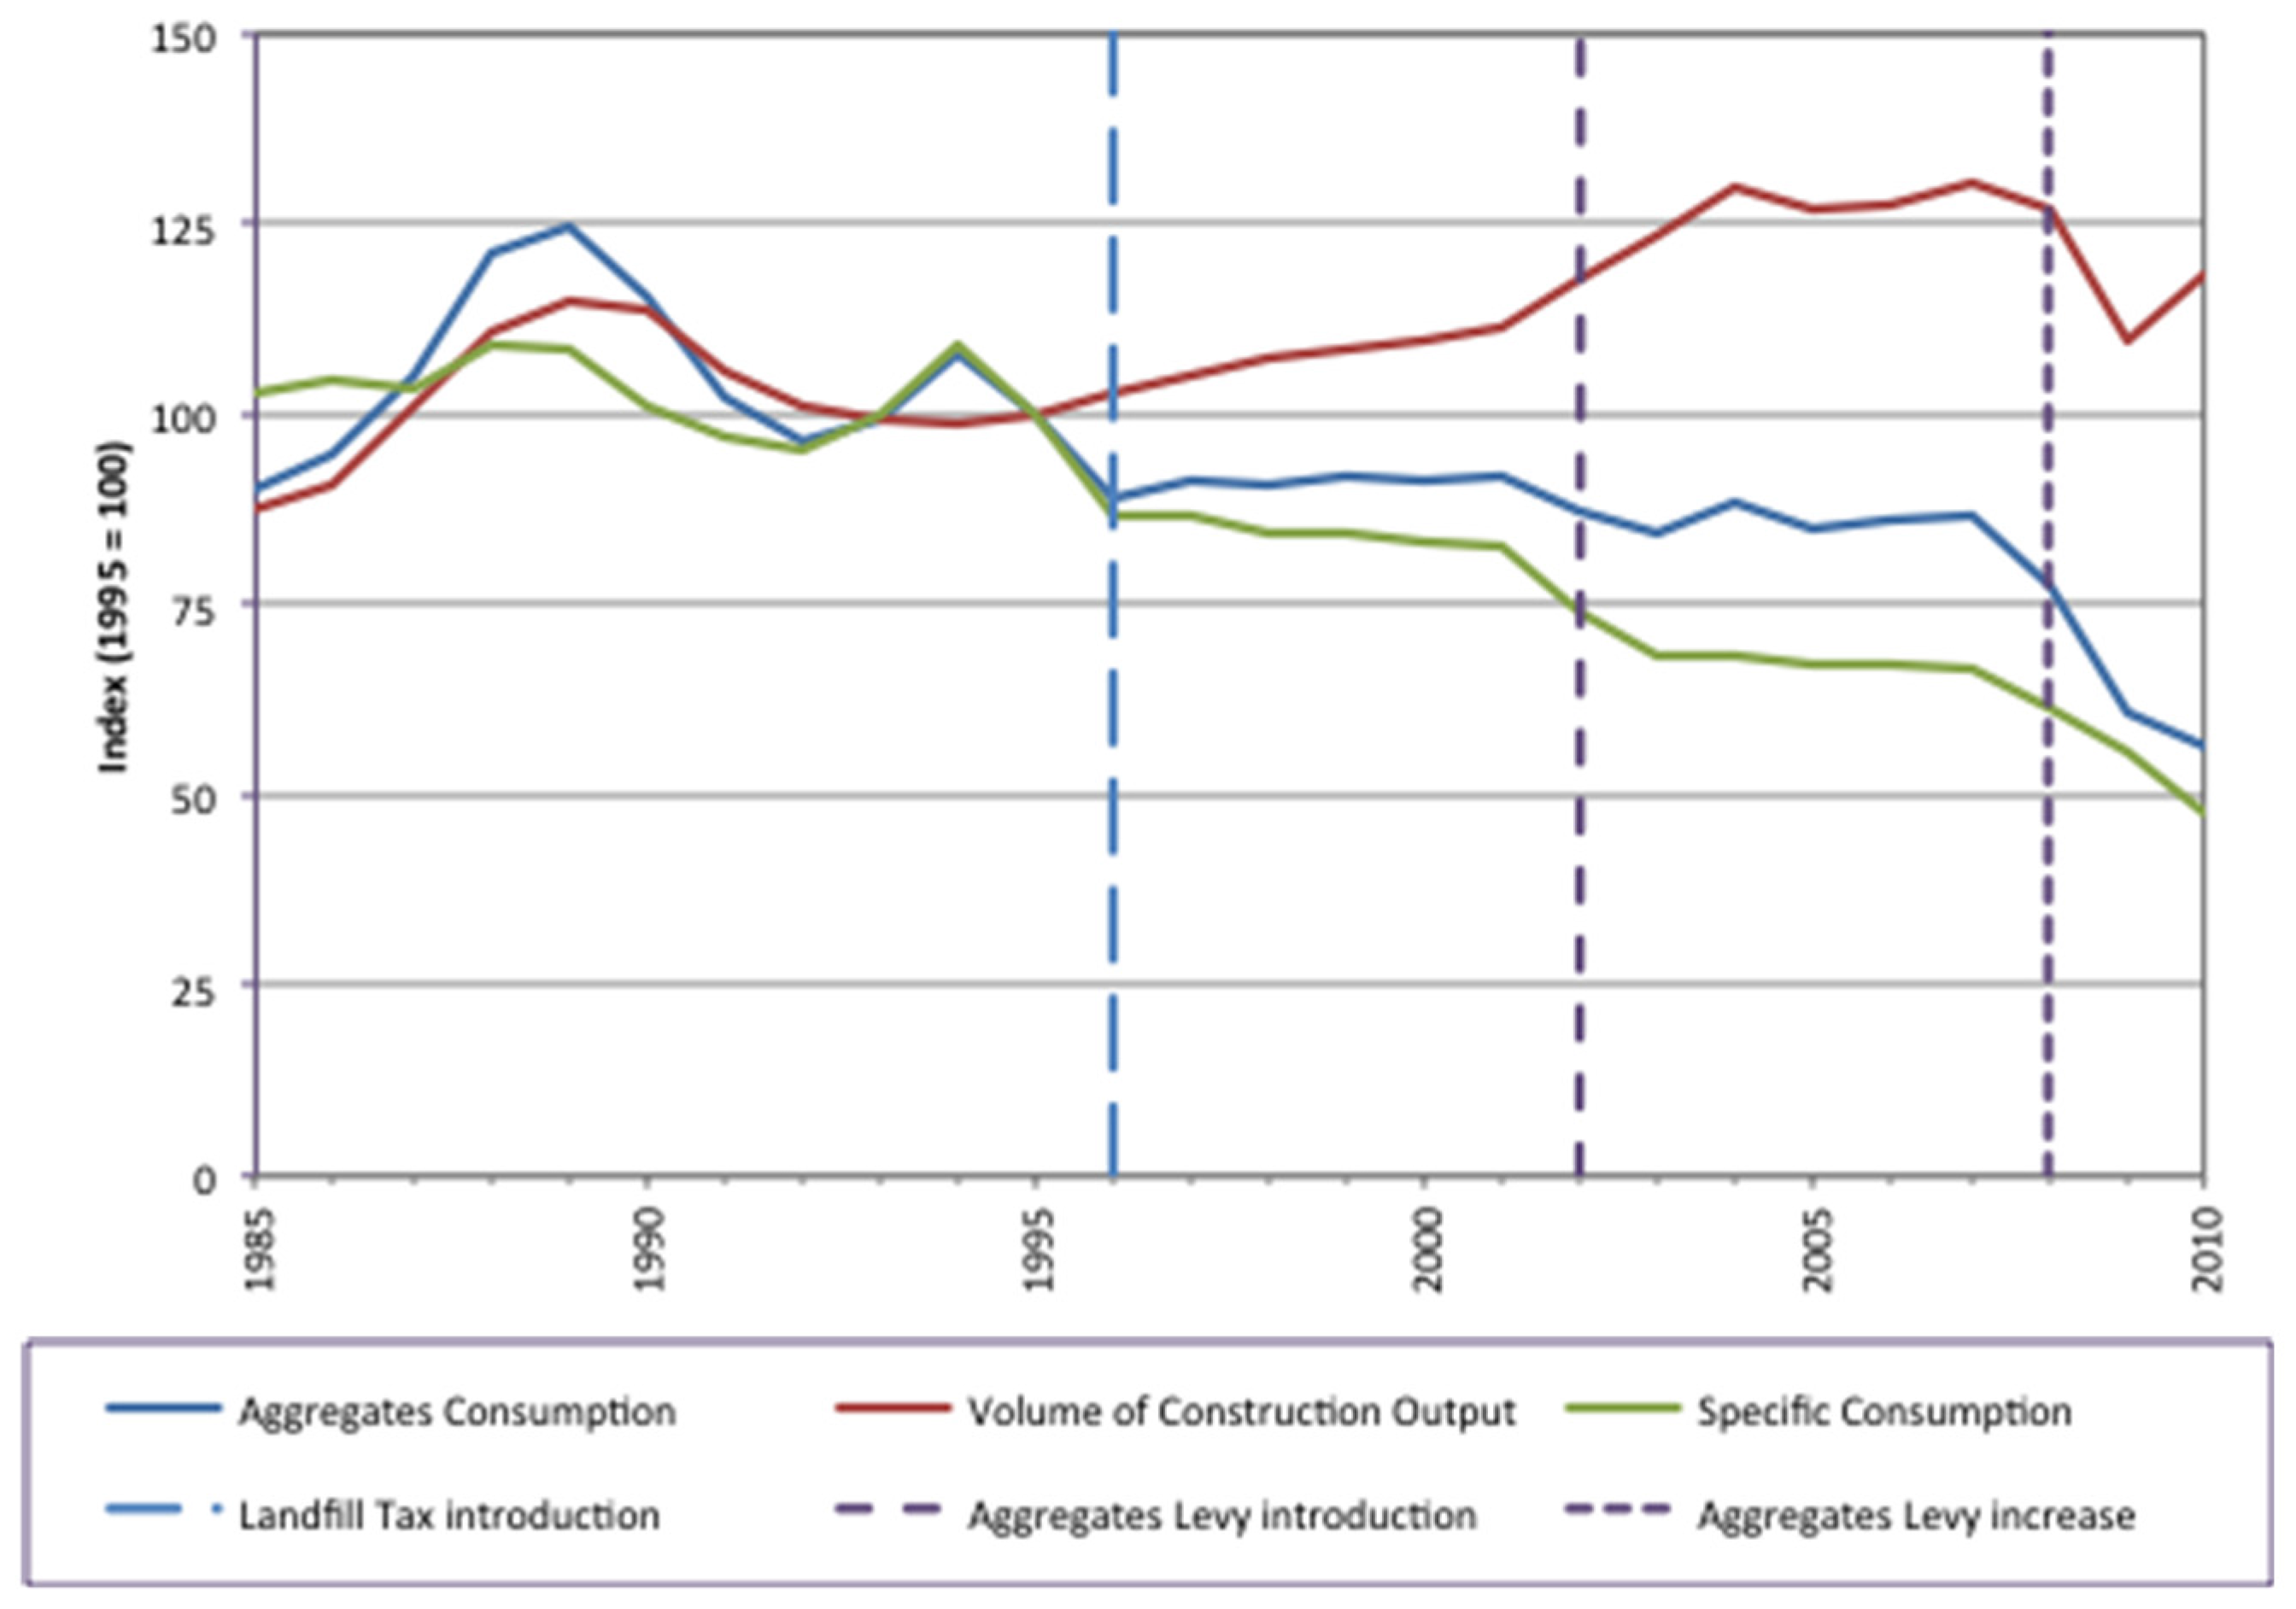
- Increasing efficiency in aggregate use in the UK
- -
- Reducing plastic bag use in Ireland
- -
- Improving industrial energy efficiency in Portugal
- -
- Sustainable use of forests and wood in Finland.
2. The Need for Absolute Decoupling within Planetary Boundaries
2.1. Existing Research in the Field of Decoupling
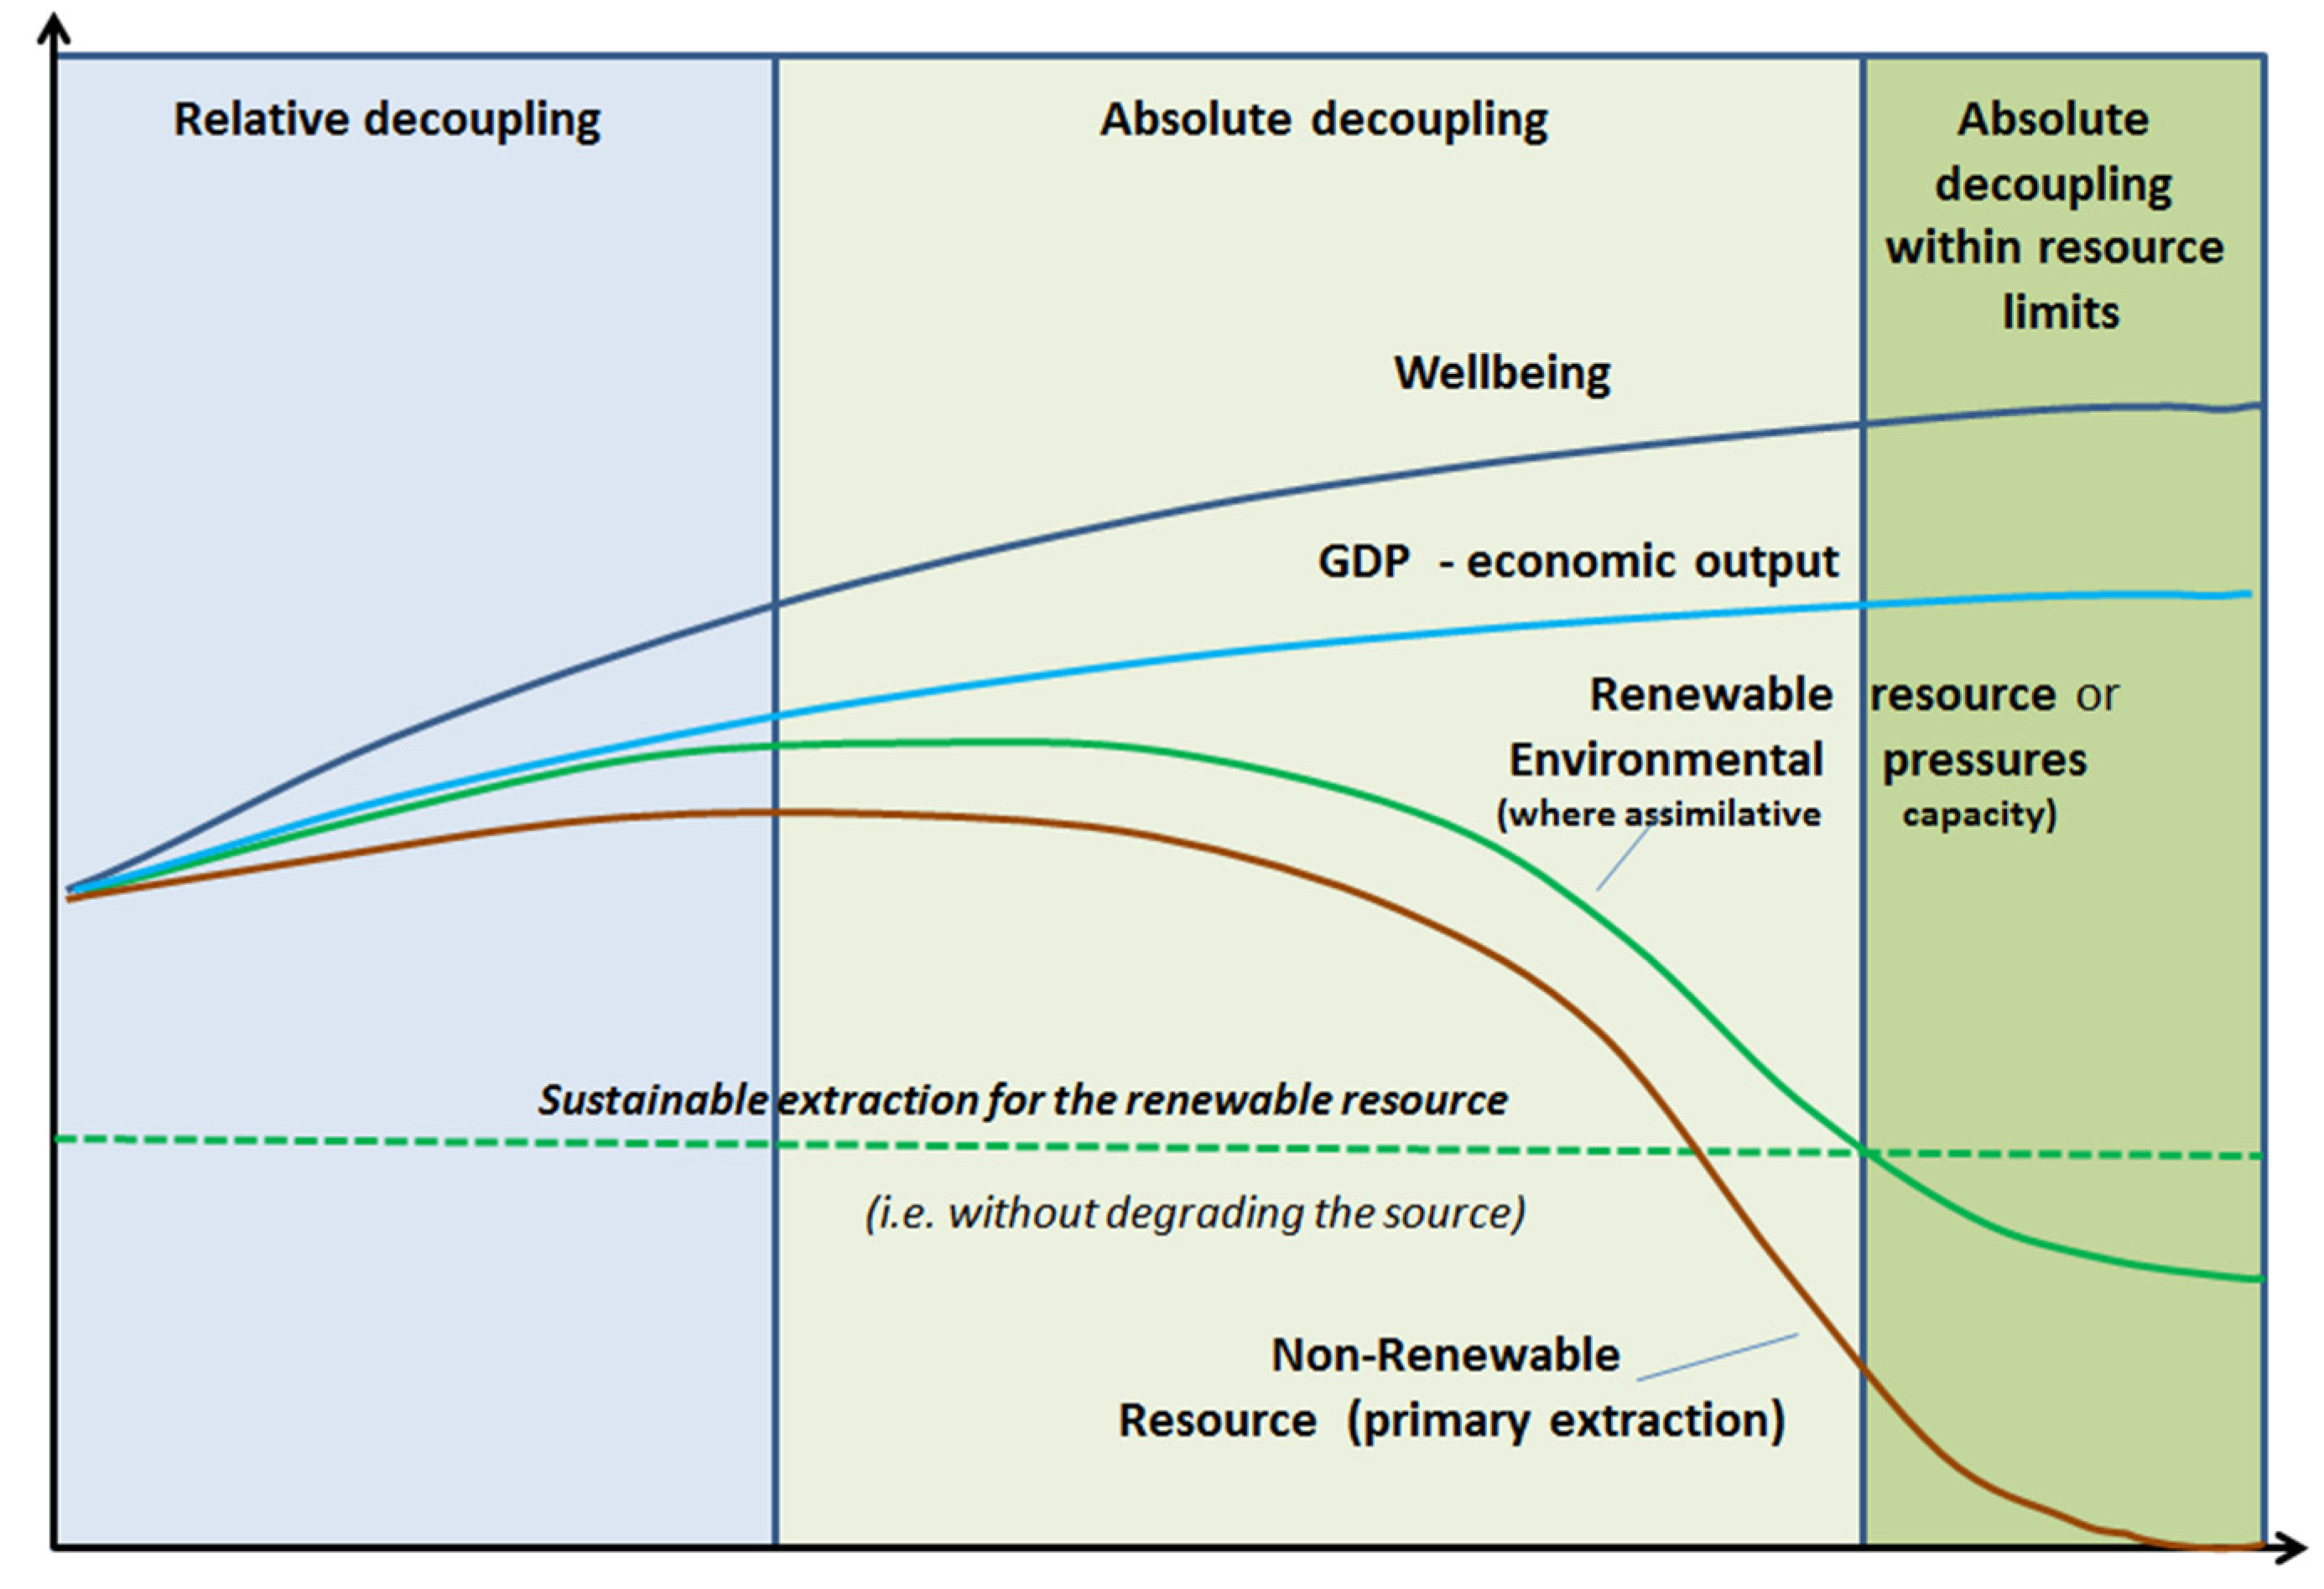
2.2. Absolute Decoupling within Planetary Boundaries
- (1)
- Resource limits relating to the finite availability of non-renewable resources (e.g., availability of bauxite);
- (2)
- Resource limits relating to ecological limits, defined by the generative capacity of ecosystems (e.g., provision of fish or clean water) or absorptive capacity (e.g., capacity of a river for biological oxygen demand loadings);
- (3)
- Ecological limits relating to ecological thresholds such as pollution pressures (e.g., atmospheric ozone);
- (4)
- Environmental limits defined by health impacts on species (e.g., ambient air quality for respiratory health).
3. Collecting Real World Policy Mix Evidence of Absolute Decoupling
3.1. Methodology
3.1.1. Case Study Selection
3.1.2. Case Study Evaluation
- -
- Does/did the policy mix result in a positive environmental outcome?
- -
- Were its stated objective(s) met? Were the instruments used sufficient to meet the objectives?
- -
- Were these objectives set at a level to meet environmental needs such as avoiding crossing environmental thresholds/tipping points or achieve more sustainable levels of resource use/extraction (e.g., maximum sustainable yield (MSY) in fisheries)?
- -
- What has been the level of impact on resource use of the policy mix (the effect)?
- -
- How was relative/absolute decoupling achieved?
- -
- Were resource limits or other thresholds taken into account and how were they addressed?
3.2. Case Studies—Real World Policy Mixes in Europe
3.2.1. Evidence of Success
3.2.2. Learning from Less or Not Yet Successful Experience
4. Insights from Real World Policy Mixes—Absolute and Relative Decoupling or Current No Decoupling
- Ecological thresholds and absolute limits on resources are difficult to assess and it may not be evident how they can be applied to specific sectors at a local level. Research on planetary boundaries as the namesake suggests, is a theory for global limits; and disaggregating these to sub-global levels will always be complex and political, as is touched upon in existing research on the subject [71]. The nature of economic practices determines the appropriate thresholds to observe but in many areas these are not easy to define. Decoupling should consider the whole lifecycle of products and economic processes. For example, in relation in the case of plastic bags in Ireland, core issues relate to end-of life inefficiencies and wasted material. Marine litter remains a key impact of single-use bags but research on the subject is relatively underdeveloped and there is a lack of comprehensive understanding of impacts or appropriate limits [59]. Often thresholds will need to be determined indirectly by processes, rather than resources themselves i.e., impact decoupling. This is the case for aggregates, which as a resource are in practice not scarce but the impacts of extraction can be disruptive on multiple levels and thus require limits. In this way, defining limits requires careful consideration of appropriate scales, resources and their impacts which are generally complex and diverse.
- Focusing on a specific resource or sector is more likely to achieve absolute decoupling. Such focus increases the likelihood of the policy mix being effective, particularly by allowing different instruments in the policy mix to provide enhancing support to each other (e.g., recycling revenue from a tax to fund activities to achieve policy mix objectives, cap and trade tools). In Ireland for example, the proceeds from the plastic bags tax were paid into an environmental fund used to finance recycling centres and the cleaning up of illegal landfill sites; also ensuring greater coherence within the policy mix.
- The complexity of the policy mix is highly dependent on the complexity of the resource through the economy. Complexity can be due to different uses of the resource (and therefore potentially numerous market failures needing to be addressed) and/or a high number of users. Hence the UK’s aggregates and Ireland’s plastic bags policy mixes feature no more than 2–3 instruments (which had more or less immediate positive effects in achieving absolute decoupling), whereas Denmark’s fertiliser use policy mix includes more than 15 instruments (and has taken decades to achieve absolute decoupling, yet still not within ecological limits).
- The design of a policy mix needs to reflect the level and type of existing ‘lock-in’ to achieve transformation. The level of ease of transformation depends upon the level of (inter)dependency of economic and social systems in relation to the resource addressed by the policy mix, including whether substitutes are available or acceptable. Systems thinking can help to understand the range of inter-linkages and to identify which dependencies or market failures need to be addressed. Particularly in the case of economically deeply embedded resources (i.e., where there is a very strong link between the use of a resource and economic performance) which run through the economy in a complex way (e.g., many users, resource forms and uses; wider knock-on effects). It is difficult to isolate specific elements of a wider policy mix to assess effectiveness of efforts on any one given aspect. An example is policy instruments focusing on industrial energy efficiency but which are part of overall CO2 emission reduction efforts, which can include increased use of renewables and other forms of reducing CO2. It is worth noting that two of the most progressive countries in the world in CO2 reduction efforts, Denmark and Sweden, have either only just begun to show trends towards absolute decoupling (Denmark) or have had periods of no, relative or absolute decoupling (Sweden), despite ambitious efforts since the 1960s and 1970s. Fossil fuels and subsequently CO2 emissions remain strongly correlated to economic performance.
- Absolute decoupling is more effectively achieved if a policy mix is based on identification and integration of limits and thresholds. This was particularly evident in Iceland’s fish policy mix where the setting of total allowable catches was central; and in Denmark’s fertiliser use policy mix which features clear targets for the estimated contribution of the various instruments.
- The availability of alternatives or substitutes is critical for absolute decoupling. The existence of alternatives to disposable plastic bags (multi-use bags) enabled the decoupling of plastic bag demand in Ireland.
- Policy mixes focusing on internationally traded resources need to address global impacts of resource use, particularly imports. The Finnish wood case study is a very good example of how domestic improvements can ‘falsely’ present a positive image while hiding potentially more significant negative impacts internationally through imports. Care is needed for domestic products being substituted by imports where these have environmental impacts that are at least as significant.
- Design of policy mixes to include targets and built-in monitoring, review and response mechanisms will better ensure effectiveness. This is particularly the case for more complex policy mixes addressing a higher number of market failures, such as the Danish fertiliser use case. A mid-term review of a central strategic document (Action Plan) resulted in introduction of further measures and revision of existing ones. This could also be the case for the Irish experience with plastic bags, where the tax was raised following analysis of per capita bag use.
- Engagement with affected stakeholders can help build a better balance between effectiveness and acceptance. Engagement depends on the specific stakeholder being addressed. For example, the general public can be better engaged through awareness-raising campaigns (as in the Irish plastic bag case), while industry sectors can be engaged through structured dialogue with industry (as in the UK’s aggregates case where studies and dialogue were undertaken for up to five years prior to the introduction of the levy). Information instruments play a key role in the development of natural resources policies, but when used in isolation or as the central instrument in a policy mix, they fail to deliver the change demanded for decoupling. Information-based instruments such as labels can improve company and product transparency, but too strong a focus on information will not address important market failures. Nonetheless information-based activities can help raise awareness of key issues and act as a precursor to more ambitious activities. For resources about which relatively less is known, the role of information plays a vital role in setting the scene for future activities, for example in the area of critical metals.
5. Discussion and Future Needs
Acknowledgments
Author Contributions
Conflicts of Interest
References and Notes
- Global Footprint Network. Earth Overshoot Day. Available online: http://www.overshootday.org/ (accessed on 3 February 2016).
- UNEP. Decoupling 2—Technologies, Opportunities and Policy Options; United Nations Environment Programme—International Resources Panel: Nairobi, Kenya, 2014. [Google Scholar]
- European Commission. A Resource-Efficient Europe—Flagship Initiative under the Europe 2020 Strategy; European Commission: Brussels, Belgium, 2011. [Google Scholar]
- Fischer-Kowalski, M.; Swilling, M.; von Weizsäcker, E.; Ren, Y.; Moriguchi, Y.; Crane, W.; Krausmann, K.; Eisenmenger, N.; Giljum, S.; Hennicke, P.; et al. Decoupling Natural Resource Use and Environmental Impacts from Economic Growth, A Report of the Working; United Nations Environment Programme: Geneva, Switzerland, 2011. [Google Scholar]
- Jackson, T. Prosperity without Growth; Earthscan: Abingdon, UK, 2009. [Google Scholar]
- Pearce, D.W.; Turner, R.K. Economics of Natural Resources and the Environment; Harvester Wheatsheaf: New York, NY, USA, 1990. [Google Scholar]
- Daly, H. Toward some operational principles of sustainable development. Ecol. Econ. 1990, 2, 1–6. [Google Scholar] [CrossRef]
- Max-Neef, M. Economic growth and quality of life: A threshold hypothesis. Ecol. Econ. 1995, 15, 115–118. [Google Scholar] [CrossRef]
- Antosiewicz, M.; Lewandowski, P.; Witajewski-Baltvilks, J. Input vs. Output Taxation—A DSGE Approach to Modelling Resource Decoupling. Sustainability 2016, 8, 352. [Google Scholar] [CrossRef]
- Ren, S.; Yin, H.; Chen, X. Using LMDI to analyze the decoupling of carbon dioxide emissions by China’s manufacturing industry. Environ. Dev. 2014, 9, 61–75. [Google Scholar] [CrossRef]
- Lin, S.-J.; Beidari, M.; Lewis, C. Energy Consumption Trends and Decoupling Effects between Carbon Dioxide and Gross Domestic Product in South Africa. Aerosol Air Qual. Res. 2015, 15, 2676–2687. [Google Scholar] [CrossRef]
- Jorgenson, A.K.; Clark, B. Are the Economy and the Environment Decoupling? A comparative International Study, 1960–2005. Am. J. Soc. 2012, 118, 1–44. [Google Scholar] [CrossRef]
- Chen, X.; Pang, J.; Zhang, Z.; Li, H. Sustainability Assessment of Solid Waste Management in China: A Decoupling and Decomposition Analysis. Sustainability 2014, 6, 9268–9281. [Google Scholar] [CrossRef]
- Diakoulaki, D.; Mandaraka, M. Decomposition analysis for assessing the progress in decoupling industrial growth from CO2 emissions in the EU manufacturing sector. Energy Econ. 2007, 29, 636–664. [Google Scholar] [CrossRef]
- De Freitas, L.C.; Kaneko, S. Decomposing the decoupling of CO2 emissions and economic growth in Brazil. Ecol. Econ. 2011, 70, 1459–1469. [Google Scholar] [CrossRef]
- Zhang, Y.; Yang, Q.S. Decoupling agricultural water consumption and environmental impact from crop production based on the water footprint method: A case study for the Heilongjiang land reclamation area, China. Ecol. Indic. 2014, 43, 29–35. [Google Scholar]
- Gilmont, M. Decoupling dependence on natural water: Reflexivity in the regulation and allocation of water in Israel. Water Policy 2014, 16, 79–101. [Google Scholar] [CrossRef]
- Muangthai, I.; Lewis, C.; Lin, S.J. Decoupling Effects and Decomposition Analysis of CO2 Emissions from Thailand’s Thermal Power Sector. Aerosol Air Qual. Res. 2014, 14, 1929–1938. [Google Scholar] [CrossRef]
- Tapio, P. Towards a theory of decoupling: Degrees of decoupling in the EU and the case of road traffic in Finland between 1970 and 2001. Transp. Policy 2005, 12, 137–151. [Google Scholar] [CrossRef]
- Zhang, L.; Xue, B.; Geng, B.; Ren, W.; Lu, C. Emergy-Based City’s Sustainability and Decoupling Assessment: Indicators, Features and Findings. Sustainability 2014, 6, 952–966. [Google Scholar] [CrossRef]
- Zhang, M.; Wang, W. Decouple indicators on the CO2 emission-economic growth linkage: The Jiangsu Province case. Ecol. Indic. 2013, 32, 239–244. [Google Scholar] [CrossRef]
- Zhang, Z.; Xue, B.; Pang, J.; Chen, X. The Decoupling of Resource Consumption and Environmental Impact from Economic Growth in China: Spatial Pattern and Temporal Trend. Sustainability 2016, 8, 222. [Google Scholar] [CrossRef]
- Luken, R.; Piras, S. A critical overview of industrial decoupling programs in six developing countries in Asia. Energy Policy 2011, 39, 3869–3872. [Google Scholar] [CrossRef]
- Giljum, S.; Lutz, C.; Jungnitz, A.; Bruckner, M.; Hinterberger, F. Global Dimensinos of European Natural Resource Use. Available online: http://seri.at/wp-content/uploads/2009/08/SERI-Working-Paper-7.pdf (accessed on 2 May 2016).
- Wang, W.; Kuang, Y.; Huang, N.; Zhao, D. Empirical Research on Decoupling Relationship between Energy-Related Carbon Emission and Economic Growth in Guangdong Province Based on Extended Kaya Identity. Sci. World J. 2014, 2014, 1–11. [Google Scholar] [CrossRef] [PubMed]
- Zhong, T.Y.; Huang, X.J.; Han, L.; Wang, B.Y. Review on the research of decoupling analysis in the field of environments and resource. J. Nat. Resour. 2010, 25, 1400–1412. [Google Scholar]
- Sorrell, S.; Lehtonen, M.; Stapleton, L.; Pujol, J.; Champion, T. Decoupling of Road Freight Energy Use from Economic Growth in the United Kingdom. Energy Policy 2012, 41, 84–97. [Google Scholar] [CrossRef]
- TEEB. The Economics of Ecosystems and Biodiversity: Ecological and Economic Foundations; Earthscan: London, UK; Washington, DC, USA, 2010. [Google Scholar]
- Rockström, J.; Steffen, W.L.; Noone, K.; Persson, Å.; Stuart Chapin, F., III; Lambin, E.; Lenton, T.M.; Scheffer, M.; Folke, C.; Schellnhuber, H.J.; et al. Planetary boundaries: Exploring the safe operating space for humanity. Ecol. Soc. 2009, 14, Article 32. [Google Scholar]
- Reyes Tirado, M.A. Phosphorus in Agriculture—Problems and Solutions (Greenpeace Research Laboratories Technical Report); Greenpeace: Amsterdam, The Netherlands, 2012. [Google Scholar]
- Odegard, I.; van der Voet, E. The future of food—Scenarios and the effect on natural resource use in agriculture in 2050. Ecol. Econ. 2014, 97, 51–59. [Google Scholar] [CrossRef]
- Van Ewijk, S.; Stegemann, J.A. Limitations of the waste hierarchy for achieving absolute reductions in material throughput. J. Clean. Prod. 2014, 8, 1–7. [Google Scholar] [CrossRef]
- De Bruyn, S. Dematerialization and rematerialization as two recurring phenomena of industrial ecology. In A Handbook of Industrial Ecology; Ayres, R.A., Ed.; Edward Elgar: Cheltenham, UK, 2002; pp. 209–222. [Google Scholar]
- Steinberger, J.; Timmons, R. Decoupling GDP from resource use, resource productivity and competitiveness: A cross-country comparison. In Sustainable Growth and Resource Productivity: Economic and Global Policy Issues; Bleischwitz, R., Ed.; Greenleaf Publishing: Sheffield, UK, 2009; pp. 172–193. [Google Scholar]
- IPCC. Climate Change 2014—Impacts, Adaptation, and Vulnerability (Working Group II); Cambridge University Press: Cambridge, UK, 2014. [Google Scholar]
- CBD. Global Biodiversity Outlook 4; Secretariat of the Convention on Biological Diversity: Montréal, QC, Canada, 2014. [Google Scholar]
- Decision No 1600/2002/EC of the European Parliament and of the Council of 22 July 2002 laying down the Sixth Community Environment Action Programme; 2002. O.J. L242/1.
- European Commission. Europe 2020: A Strategy for Smart, Sustainable and Inclusive Growth; European Commission: Brussels, Belgium, 2010. [Google Scholar]
- European Commission. Proposal for a Decision of the European Parliament and of the Council on a General Union Environment Action Programme to 2020: “Living Well, within the Limits of Our Planet’’; European Commission: Brussels, Belgium, 2012. [Google Scholar]
- OECD. OECD Environmental Strategy for the First Decade of the 21st century; OECD: Paris, France, 2011. [Google Scholar]
- UNEP. Assessing the Environmental Impacts of Consumption and Production: Priority Products and Materials; Hertwich, E., van der Voet, E., Suh, S., Tukker, A., Huijbregts, M., Kazmierczyk, P., Lenzen, M., McNeely, J., Moriguchi, Y., Eds.; UNEP: Nairobi, Kenya, 2010. [Google Scholar]
- The Individual Case Study Reports. Available online: www.dynamix-project.eu/results (accessed on 26 May 2016).
- Hamilton, L.; Otterstad, O.; Ögmundardóttir, H. Rise and fall of the herring towns: impacts of climate and human teleconnections. In Climate Change and the Economics of the World’s Fisheries; Edward Elgar Publishing: Northampton, MA, USA, 2005; pp. 100–125. [Google Scholar]
- Hamilton, L.; Jónsson, S.; Ögmundardóttir, H.; Belkin, I. Sea Changes Ashore: The Ocean and Iceland’s Herring Capital. Arctic 2004, 57, 325–355. [Google Scholar] [CrossRef]
- Haraldsson, G.; Carey, D. Ensuring a Sustainable and Efficient Fishery in Iceland; OECD Economics Department Working Papers, No. 891; OECD Publishing: Paris, France, 2011. [Google Scholar]
- International Council for the Exploration of the Sea. Advice June 2013: Version 2, 13-09-2013. Available online: www.ices.dk/sites/pub/Publication%20Reports/Advice/2013/2013/cod-iceg.pdf (accessed on 26 May 2016).
- Arnason, R. Iceland’s ITQ system creates new wealth. Electron. J. Sustain. Dev. 2008, 1, 35–41. [Google Scholar]
- Gissurarson, H. Overfishing: The Icelandic Solution; Institute of Economic Affairs: London, UK, 2000. [Google Scholar]
- Statistics Iceland, Catch of Iceland Vessels from All Fishing Areas 1945–2011 (unit tonnes). Available online: http://www.statice.is/statistics/business-sectors/fisheries/fishing-vessels/ (accessed on 2 May 2016).
- Christensen, P.; Bondo, O.; Schou, H.; Gunni, Æ.; Miljøundersøgelser, D. Iltsvind; Forlaget Hovedland: Gjern, Denmark, 2004. [Google Scholar]
- OECD. OECD Environmental Performance Reviews—Denmark; Organisation for Economic Co-operation and Development: Paris, France, 2007. [Google Scholar]
- OECD. OECD Environmental Data Compendium: Agriculture; OECD: Paris, France, 2008. [Google Scholar]
- OECD. Environmental Performance of Agriculture in OECD Countries since 1990; Organisation for Economic Co-operation and Development: Paris, France, 2008. [Google Scholar]
- DMU. Natur og miljø 2009—Fakta om natur og miljø. Del B; Danmarks Miljøundersøgelser (DMU) Aarhus University: Roskilde, Denmark, 2009. (In Danish) [Google Scholar]
- Bebbington, A.; Hinojosa, L.; Bebbington, D.H.; Burneo, M.L.; Warnaars, X. Contention and Ambiguity: Mining and the Possibilities of Development. Dev. Chang. 2008, 39, 887–914. [Google Scholar] [CrossRef]
- HMRC. Environmental Taxes, Reliefs and Schemes for Businesses, Aggregates Levy. Available online: https://www.gov.uk/green-taxes-and-reliefs/aggregates-levy (accessed on 8 February 2016).
- Idoine, N.E.; Bide, T.; Brown, T.J. United Kingdom Minerals Yearbook 2011; British Geological Survey: Nottingham, UK, 2012. [Google Scholar]
- Highley, D. The Role of Imports to UK Aggregates Supply; British Geological Survey: Nottingham, UK, 2005. [Google Scholar]
- Newman, S.; Watkins, E.; Farmer, A.; ten Brink, P.; Schweitzer, J.-P. The Economics of Marine Litter. In Marine Anthropogenic Litter; Bergmann, M., Klages, M., Gutow, L., Eds.; Springer: New York, NY, USA, 2015; pp. 367–394. [Google Scholar]
- Convery, F.; McDonnell, S.; Ferreira, S. The most popular tax in Europe? Lessons from the Irish plastic bags levy. Environ. Resour. Econ. 2007, 38, 1–11. [Google Scholar] [CrossRef]
- Tobin Consulting Engineers System Survey Results 2013. Available online: http://litter.ie/system_survey_results/index.shtml (accessed on 21 March 2016).
- Convery, F.; School of Geography, Planning and Environmental Policy, University College Dublin, Dublin, Ireland. Personal communication, 2013.
- Directive 2006/32/EC of the European Parliament and of the Council of 5 April 2006 on Energy End-Use Efficiency and Energy Services and Repealing Council Directive 93/76/EEC; 2006. O.J. L 114/64.
- ADENE. Energy Efficiency Policies and Measures in Portugal. Monitoring of EU and National Energy Efficiency Targets; Odyssee-Mure 2010; Agência Para a Energia: Lisbon, Portugal, 2012. [Google Scholar]
- Concerted Action for the Energy Efficiency Directive (CA EED). Good Practice Factsheet Energy Audits Portugal, 12-01-2013. Available online: http://www.ca-eed.eu/country-information/portugal (accessed on 26 May 2016).
- Enerdata. Odyssee-Mure. Final energy intensity (at purchasing power parities). Available online: http://www.indicators.odyssee-mure.eu/online-indicators.html (accessed on 26 May 2016).
- Bonan, G. Forests and Climate Change: Forcings, Feedbacks, and the Climate Benefits of Forests. Science 2008, 320, 1444–1449. [Google Scholar] [CrossRef] [PubMed]
- Metla. State of Finland’s Forests 2011. Based on the Criteria and Indicators of Sustainable Forest Management; The Finnish Forest Research Institute (Metla): Helsinki, Finland, 2011. [Google Scholar]
- FAOSTAT. ForesSTAT; FAOSTAT: Rome, Italy, 2013. [Google Scholar]
- WWF. Illegal Wood for the European Market. An Analysis of the EU Import and Export of Illegal Wood and Related Products; WWF: Vaud, Switzerland, 2008. [Google Scholar]
- Withana, S.; ten Brink, P.; Kretschmer, B.; Mazza, L.; Hjerp, P.; Sauter, R. Evaluation of Environmental Tax Reforms: International Experiences; The Institute for European Environmental Policy (IEEP): Brussels, Belgium, 2013. [Google Scholar]
- European Commission. Closing the Loop—An EU Action Plan for the Circular Economy; European Commission: Brussels, Belgium, 2015. [Google Scholar]
- Oosterhuis, F.; ten Brink, P. Paying the Polluter: Environmentally Harmful Subsidies and their Reform; Edward Elgar: Cheltenham, UK, 2014. [Google Scholar]
- Withana, S.; ten Brink, P.; Illes, A.; Nanni, S.; Watkins, E. Environmental Tax Reform in Europe: Opportunities for the Future; The Institute for European Environmental Policy (IEEP): Brussels, Belgium, 2014. [Google Scholar]


| Term | Definition | Necessary Indicators |
|---|---|---|
| Relative decoupling | The rate of resource use is lower than the growth rate of economic output | Economic indicator (e.g., agricultural output) and environmental indicator (e.g., fertiliser use) |
| Absolute decoupling | Resource use declines irrespective of the growth rate of economic drivers | Economic indicator (e.g., agricultural output) and environmental indicator (e.g., fertiliser use) |
| Impact decoupling | Increasing the economic output while reducing negative environmental impacts. (Can be both relative or absolute) | Economic indicator (e.g., agricultural output) and environmental indicators (e.g., fertiliser use, Biological Oxygen Demand of a waterway) |
| Resource decoupling | Reducing the rate of use of primary resources per unit of economic activity (dematerialisation). (Can be both relative or absolute) | Economic indicator (e.g., agricultural output) and environmental indicator (e.g., fertiliser use) |
| Absolute decoupling within limits | Resource use and its impacts decline in absolute terms, respecting earth as a closed system | Economic indicator (e.g., agricultural output) and environmental indicator (e.g., fertiliser use, Biological Oxygen Demand of a waterway + limit value ppm) |
| Criteria | Objective | Priority |
|---|---|---|
| 1. Objective of policy mix | Propose policy mixes to achieve absolute decoupling of resource use and its environmental impacts from economic growth | Prioritise policy mixes which include absolute decoupling as an explicit objective |
| 2. Geographical coverage | Focus on the EU member states. Although interesting third country policies can be included | A good coverage of EU member states |
| 3. Success/failure | The project should cover successful and failed policy mixes | Successful and ambitious policy mixes |
| 4. Level of focus | Screening should cover supranational, national and sub-national policy mixes. As well as a range of instruments (MBIs, regulation, information-based, and voluntary tools) | National policy mixes in the EU covering a range of instruments |
| 5. Timeline/age of policy mix | Identify resource input-, impact- and output-focused policy mixes | Policy mixes which cover a long time period providing evidence of impacts |
| 6. Data availability | Policy mixes should have sufficient data to carry out the study. But also focus on mixes which have already been assessed should be avoided. | Evaluate innovative policy mixes, with good data availability. Where necessary support with stakeholder interviews. |
| 7. Replicability to the EU | Identify policy mixes which can reduce resource use and its impacts across the EU | Prioritise policy mixes which can be developed in other EU member states. |
| Case Study | Issue to Address | Ecological Limits | Policy Mix | Type of Decoupling/Outcomes |
|---|---|---|---|---|
| Sustainable levels of fish catch in Iceland | Over-exploitation of fisheries in Iceland, leading to a collapse of fish stocks | Rate of biodiversity loss (fish stock) |
| Absolute (impact and resource) decoupling within limits
|
| Reducing fertiliser use in Denmark | Use of synthetic fertilisers disrupted marine ecosystems leading to lower levels of oxygen and the death of many fishes and other aquatic species | Interference with nitrogen cycle and phosphorus flows; Marine biodiversity loss |
| Absolute decoupling from resource use, not from impacts
|
| More efficient use of aggregates in the UK | Wasteful extraction of aggregates used in the construction sector disrupts ecosystems | Land and water resource use; Biodiversity loss |
| Absolute decoupling from resource use and impacts, but not within limits
|
| Reducing plastic bag use in Ireland | Single use plastic bags not effectively collected accumulate and threaten notably marine life, and other ecosystems | Ocean pollution; Marine biodiversity loss |
| Absolute decoupling from resource use and impacts, but without specific attention to limits
|
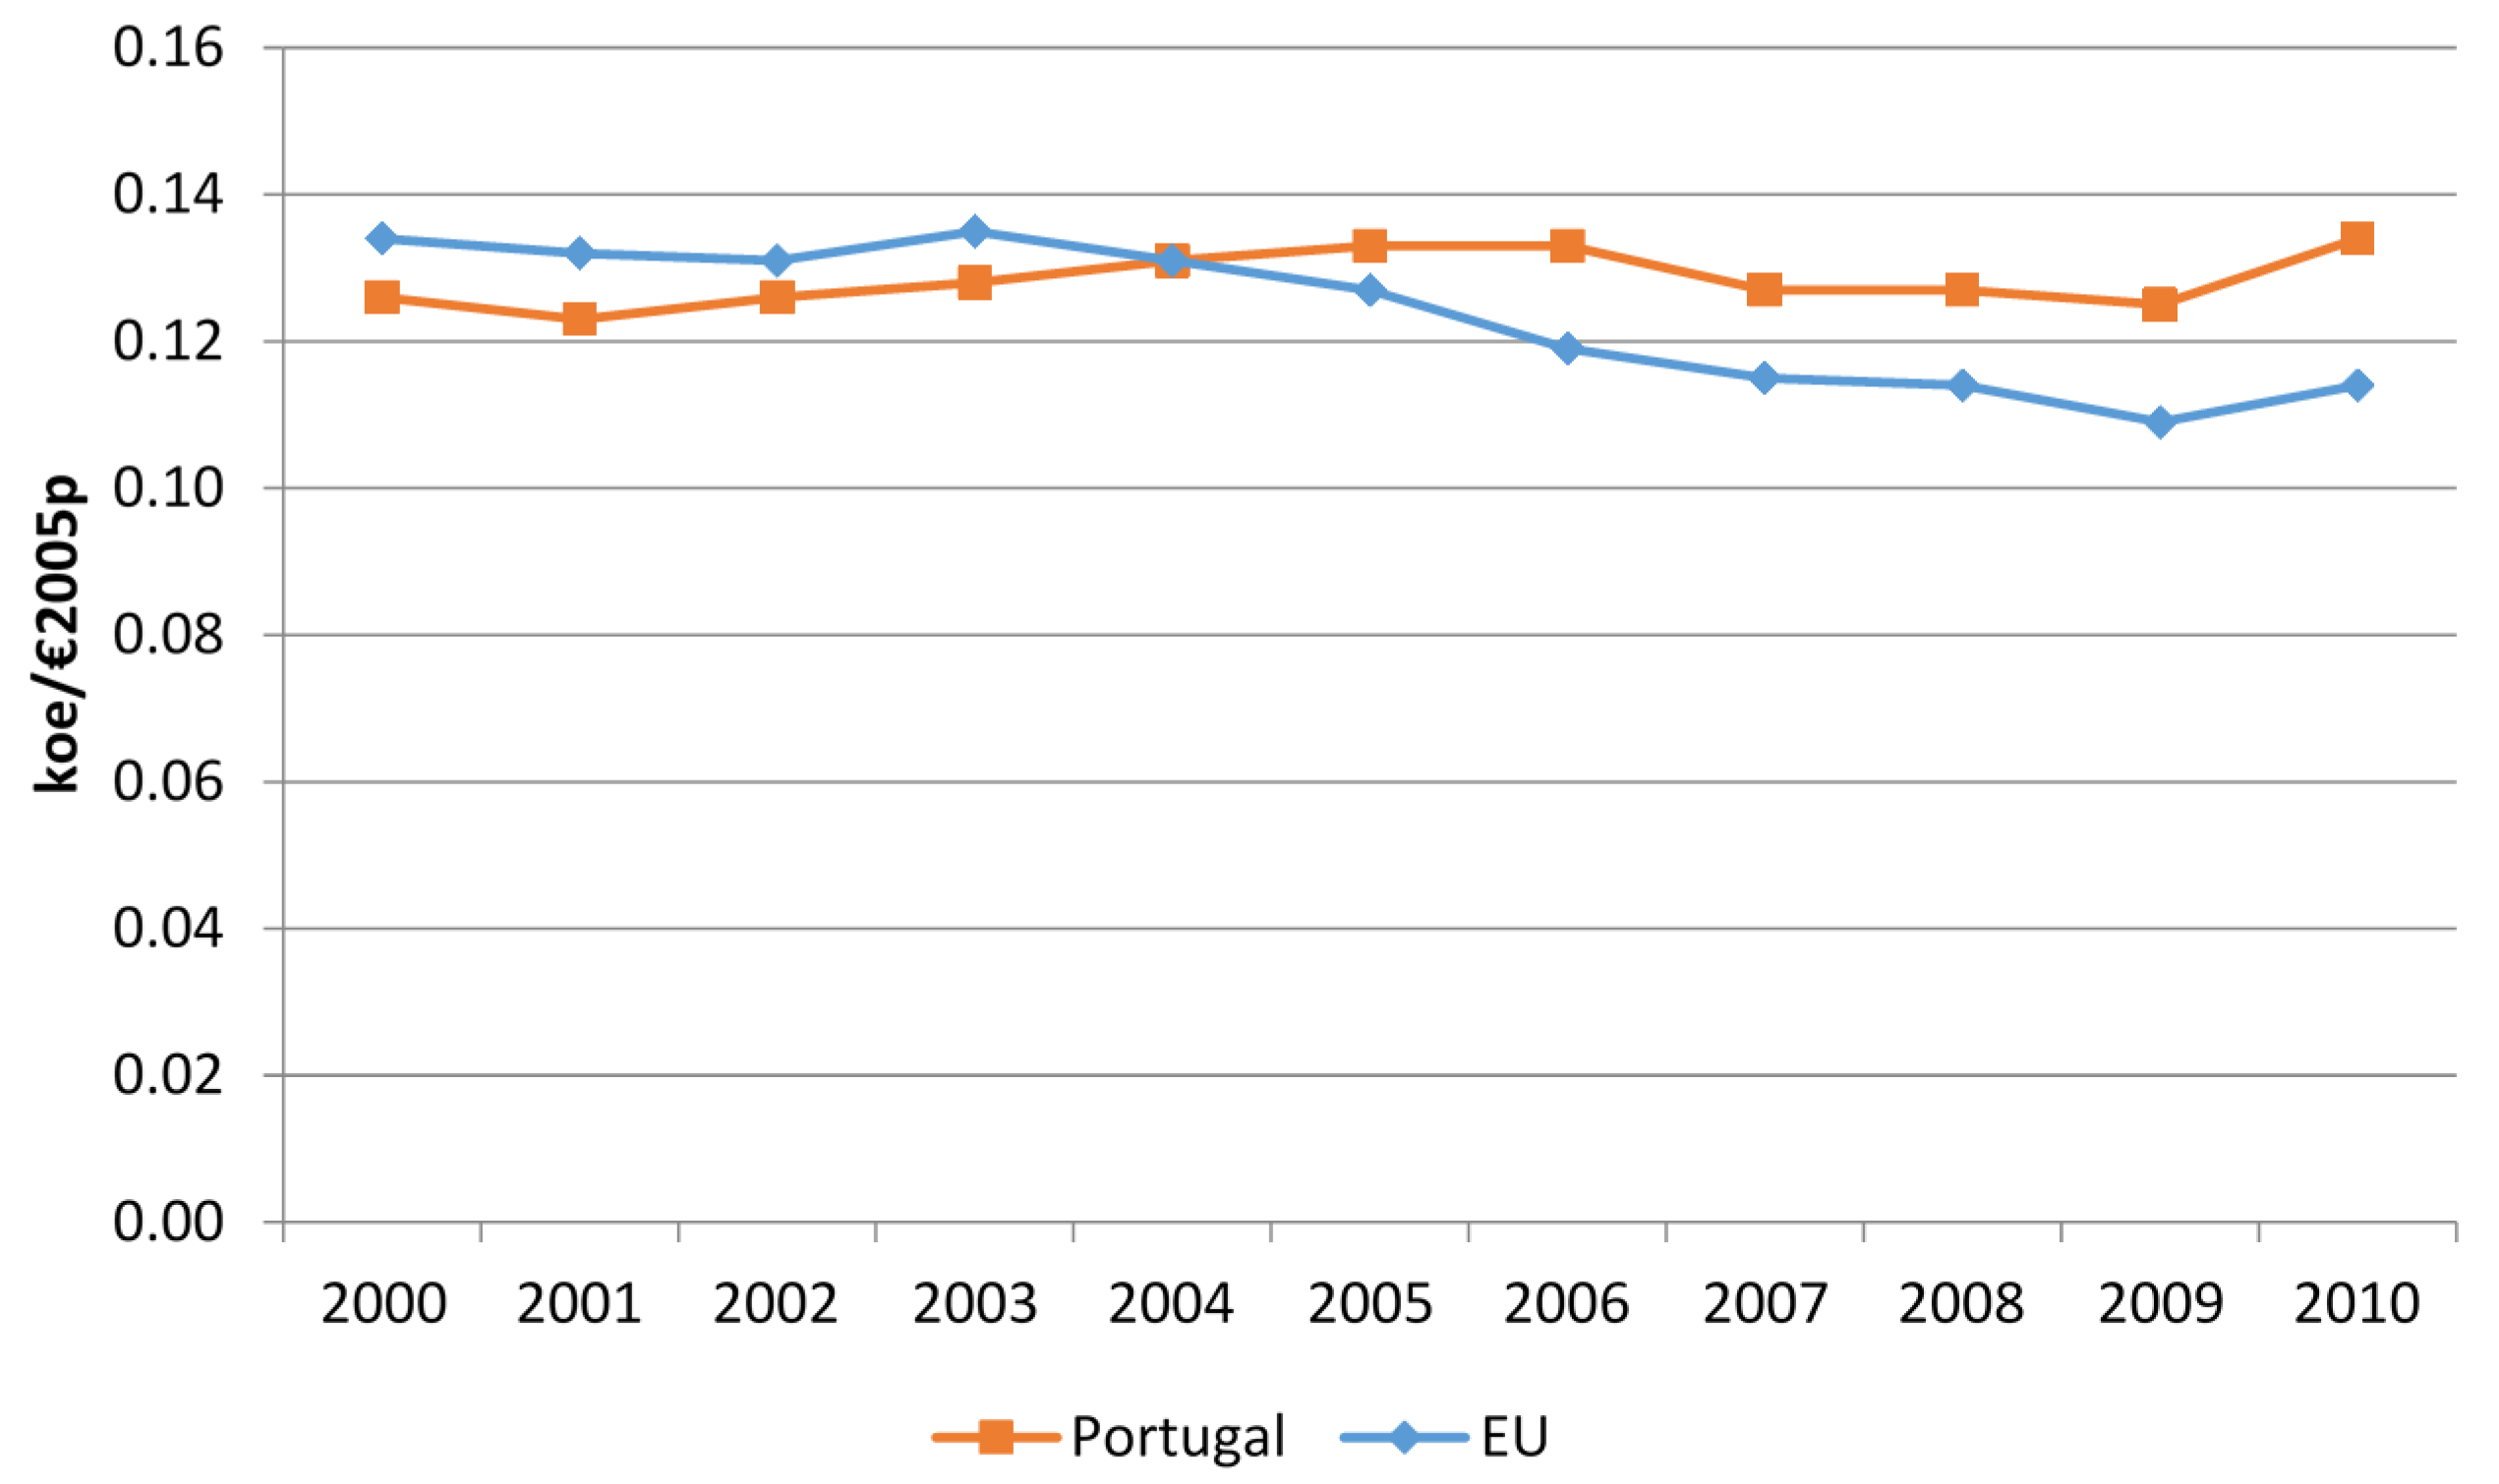
| Improving industrial energy efficiency in Portugal | The inefficient use of fossil-based energy in the industrial sector lead to high levels of CO2 emissions | Atmospheric CO2 concentration (climate change) |
| No decoupling
|
| Sustainable use of forests and wood in Finland | The mismanagement of forests and wood in Finland caused excessive deforestation, biodiversity loss, carbon emissions and soil degradation | Forests and land-use thresholds at national and global scales |
| Decoupling of forestry sector’s economic growth from wood removal within national, not planetary limits
|
© 2016 by the authors; licensee MDPI, Basel, Switzerland. This article is an open access article distributed under the terms and conditions of the Creative Commons Attribution (CC-BY) license (http://creativecommons.org/licenses/by/4.0/).
Share and Cite
Fedrigo-Fazio, D.; Schweitzer, J.-P.; Ten Brink, P.; Mazza, L.; Ratliff, A.; Watkins, E. Evidence of Absolute Decoupling from Real World Policy Mixes in Europe. Sustainability 2016, 8, 517. https://doi.org/10.3390/su8060517
Fedrigo-Fazio D, Schweitzer J-P, Ten Brink P, Mazza L, Ratliff A, Watkins E. Evidence of Absolute Decoupling from Real World Policy Mixes in Europe. Sustainability. 2016; 8(6):517. https://doi.org/10.3390/su8060517
Chicago/Turabian StyleFedrigo-Fazio, Doreen, Jean-Pierre Schweitzer, Patrick Ten Brink, Leonardo Mazza, Alison Ratliff, and Emma Watkins. 2016. "Evidence of Absolute Decoupling from Real World Policy Mixes in Europe" Sustainability 8, no. 6: 517. https://doi.org/10.3390/su8060517
APA StyleFedrigo-Fazio, D., Schweitzer, J.-P., Ten Brink, P., Mazza, L., Ratliff, A., & Watkins, E. (2016). Evidence of Absolute Decoupling from Real World Policy Mixes in Europe. Sustainability, 8(6), 517. https://doi.org/10.3390/su8060517