Article

Sustainability and Chinese Urban Settlements: Extending the Metabolism Model of Emergy Evaluation

1
Key Laboratory of Urban Environment and Health, Institute of Urban Environment, Chinese Academy of Sciences, 1799 Jimei Road, Xiamen 361021, China
2
University of Chinese Academy of Sciences, No. 19A Yuquan Road, Beijing 100049, China
3
Key lab of Xiamen City metabolism, Institute of Urban Environment, Chinese Academy of Sciences, 1799 Jimei Road, Xiamen 361021, China
4
Ningbo Urban Environment Observation and Research Station-NUEORS, Chinese Academy of Sciences, Ningbo 315800, China
*
Author to whom correspondence should be addressed.
Sustainability 2016, 8(5), 459; https://doi.org/10.3390/su8050459
Submission received: 6 March 2016 / Revised: 29 April 2016 / Accepted: 3 May 2016 / Published: 10 May 2016

Abstract

:
Anthropogenic activity interacts with urban form and inner metabolic processes, ultimately impacting urban sustainability. China’s cities have experienced many environmental issues and metabolic disturbances since the nation-wide market-oriented “reform and opening-up” policy was adopted in the 1980s. To analyze urban reform policy impacts and metabolism sustainability at a settlement scale, this study provides an integrated analysis to evaluate settlement metabolism and sustainability using a combination of emergy analysis and sustainability indicators based on scrutiny of two typical settlements (one pre- and one post-reform). The results reveal that housing reform policy stimulated better planning and construction, thereby improving built environmental quality, mixed functional land use, and residential livability. The pre-reform work-unit settlements are comparatively denser in per capita area but have less mixed land use. Housing reform has spatially changed the work–housing balance and increased commuting travel demand. However, short commuting distances in pre-reform settlements will not always decrease overall motor vehicle usage. Integrating non-commuting transport with local mixed land-use functional planning is a necessary foundation for sustainable urban design. Functional planning should provide convenient facilities and infrastructure, green space, and a suitable household density, and allow for short travel distances; these characteristics are all present in the post-reform settlement.

1. Introduction

Cities are the most complex forms of human settlements, and where the strongest interactions between human beings and the environment exist. With more than 50% of the world’s population living in cities [1], evidence of how urban metabolism and inward flows dramatically increase during urban expansion has emerged [2,3]. As self-regulating open systems, cities are usually compared to an ecosystem rather than an organism [4,5]: they draw in energy, food, and materials and produce waste, and by these processes produce welfare and a sustainable livelihood for human beings. The anthropogenic activities “to live and work” and “to transport and communicate” typically consume 80%–90% of the material and energy used by an urban system [6]. Such human activities, and the place or space within which these human activities take place (the anthroposphere), are significantly influenced by urban form (a composite of characteristics related to density, transport infrastructure, housing/building type, layout, and land use [7]).
A settlement is a microcosm of the urban system in which a group of people is accommodated, and serves the living, working, transporting, and communicating functions. The construction era, location, economic level of residents [8], policies, and other factors will influence a settlement’s metabolism and sustainability. Based on previous research on urban sustainability [9,10,11], settlement-level sustainability can be defined as a process that continually improves metabolic efficiency (effective use of materials and energy); increases resilience to external forces (renewability); reduces environmental loading, natural resources use, and waste production; and improves socioeconomic and environmental welfare.
To understand the metabolic impact of policy-induced urban form transition on the anthroposphere, it is necessary to fully investigate settlement-scale metabolism and conduct a sustainability assessment. First introduced by Wolman to analyze the fluxes of water and sewage wastes in a hypothetical city, the urban metabolism concept has provided an effective approach to identify unsustainable processes in cities; it helps track metabolic energy and resources flows, and allows the relationship between the natural urban system and anthropogenic processes to be visualized [12,13,14,15]. During recent years, the application of urban metabolism has been emerging in the fields of sustainability indicators, urban greenhouse gas emissions calculation, policy analysis, and sustainable urban planning and design [5,16]. Through the sustainability indicators approach, the changes in (increase or decrease) and degree (high or low) of sustainability can be evaluated based on the comparison of urban metabolism flows of different spatial units in different times. Measurable impacts are vital for effective management. In addition, being able to measure sustainability is crucial when checking the impact of a new policy [17]. Many studies in this field have highlighted the need to determine the impacts of built environment, buildings, and related activities, so as to integrate related strategies when making policy decisions [18,19,20,21]. Therefore, indicators of the sustainability of a settlement and its built environment may help track the influential factors of metabolism and find the balance between socioeconomic development and environmental protection [22].
Market-oriented housing reform policy since the late 1970s has significantly changed the urban form and spatial structure of present-day Chinese cities, and has resulted in many environmental problems and metabolic disturbances. While the relationship between this policy-motivated urban form transition, commuting, travel behavior, and energy consumed have been studied previously, few studies have addressed the influences from a metabolism view; moreover, settlement-scale sustainability [23,24,25,26], and, it is believed, the diminishing influence of traditional compact work-unit settlements during the last three decades, may have significantly changed the work–housing balance and increased travel demand in Chinese cities [24].
In this paper we first clarify the differences between the pre- and post-reform settlements. An urban metabolism conceptual framework is set up to describe the metabolism flows. Based on emergy analysis, a set of sustainability indices is selected to compare sustainability between the two settlements. Finally, we discuss the results and make recommendations.

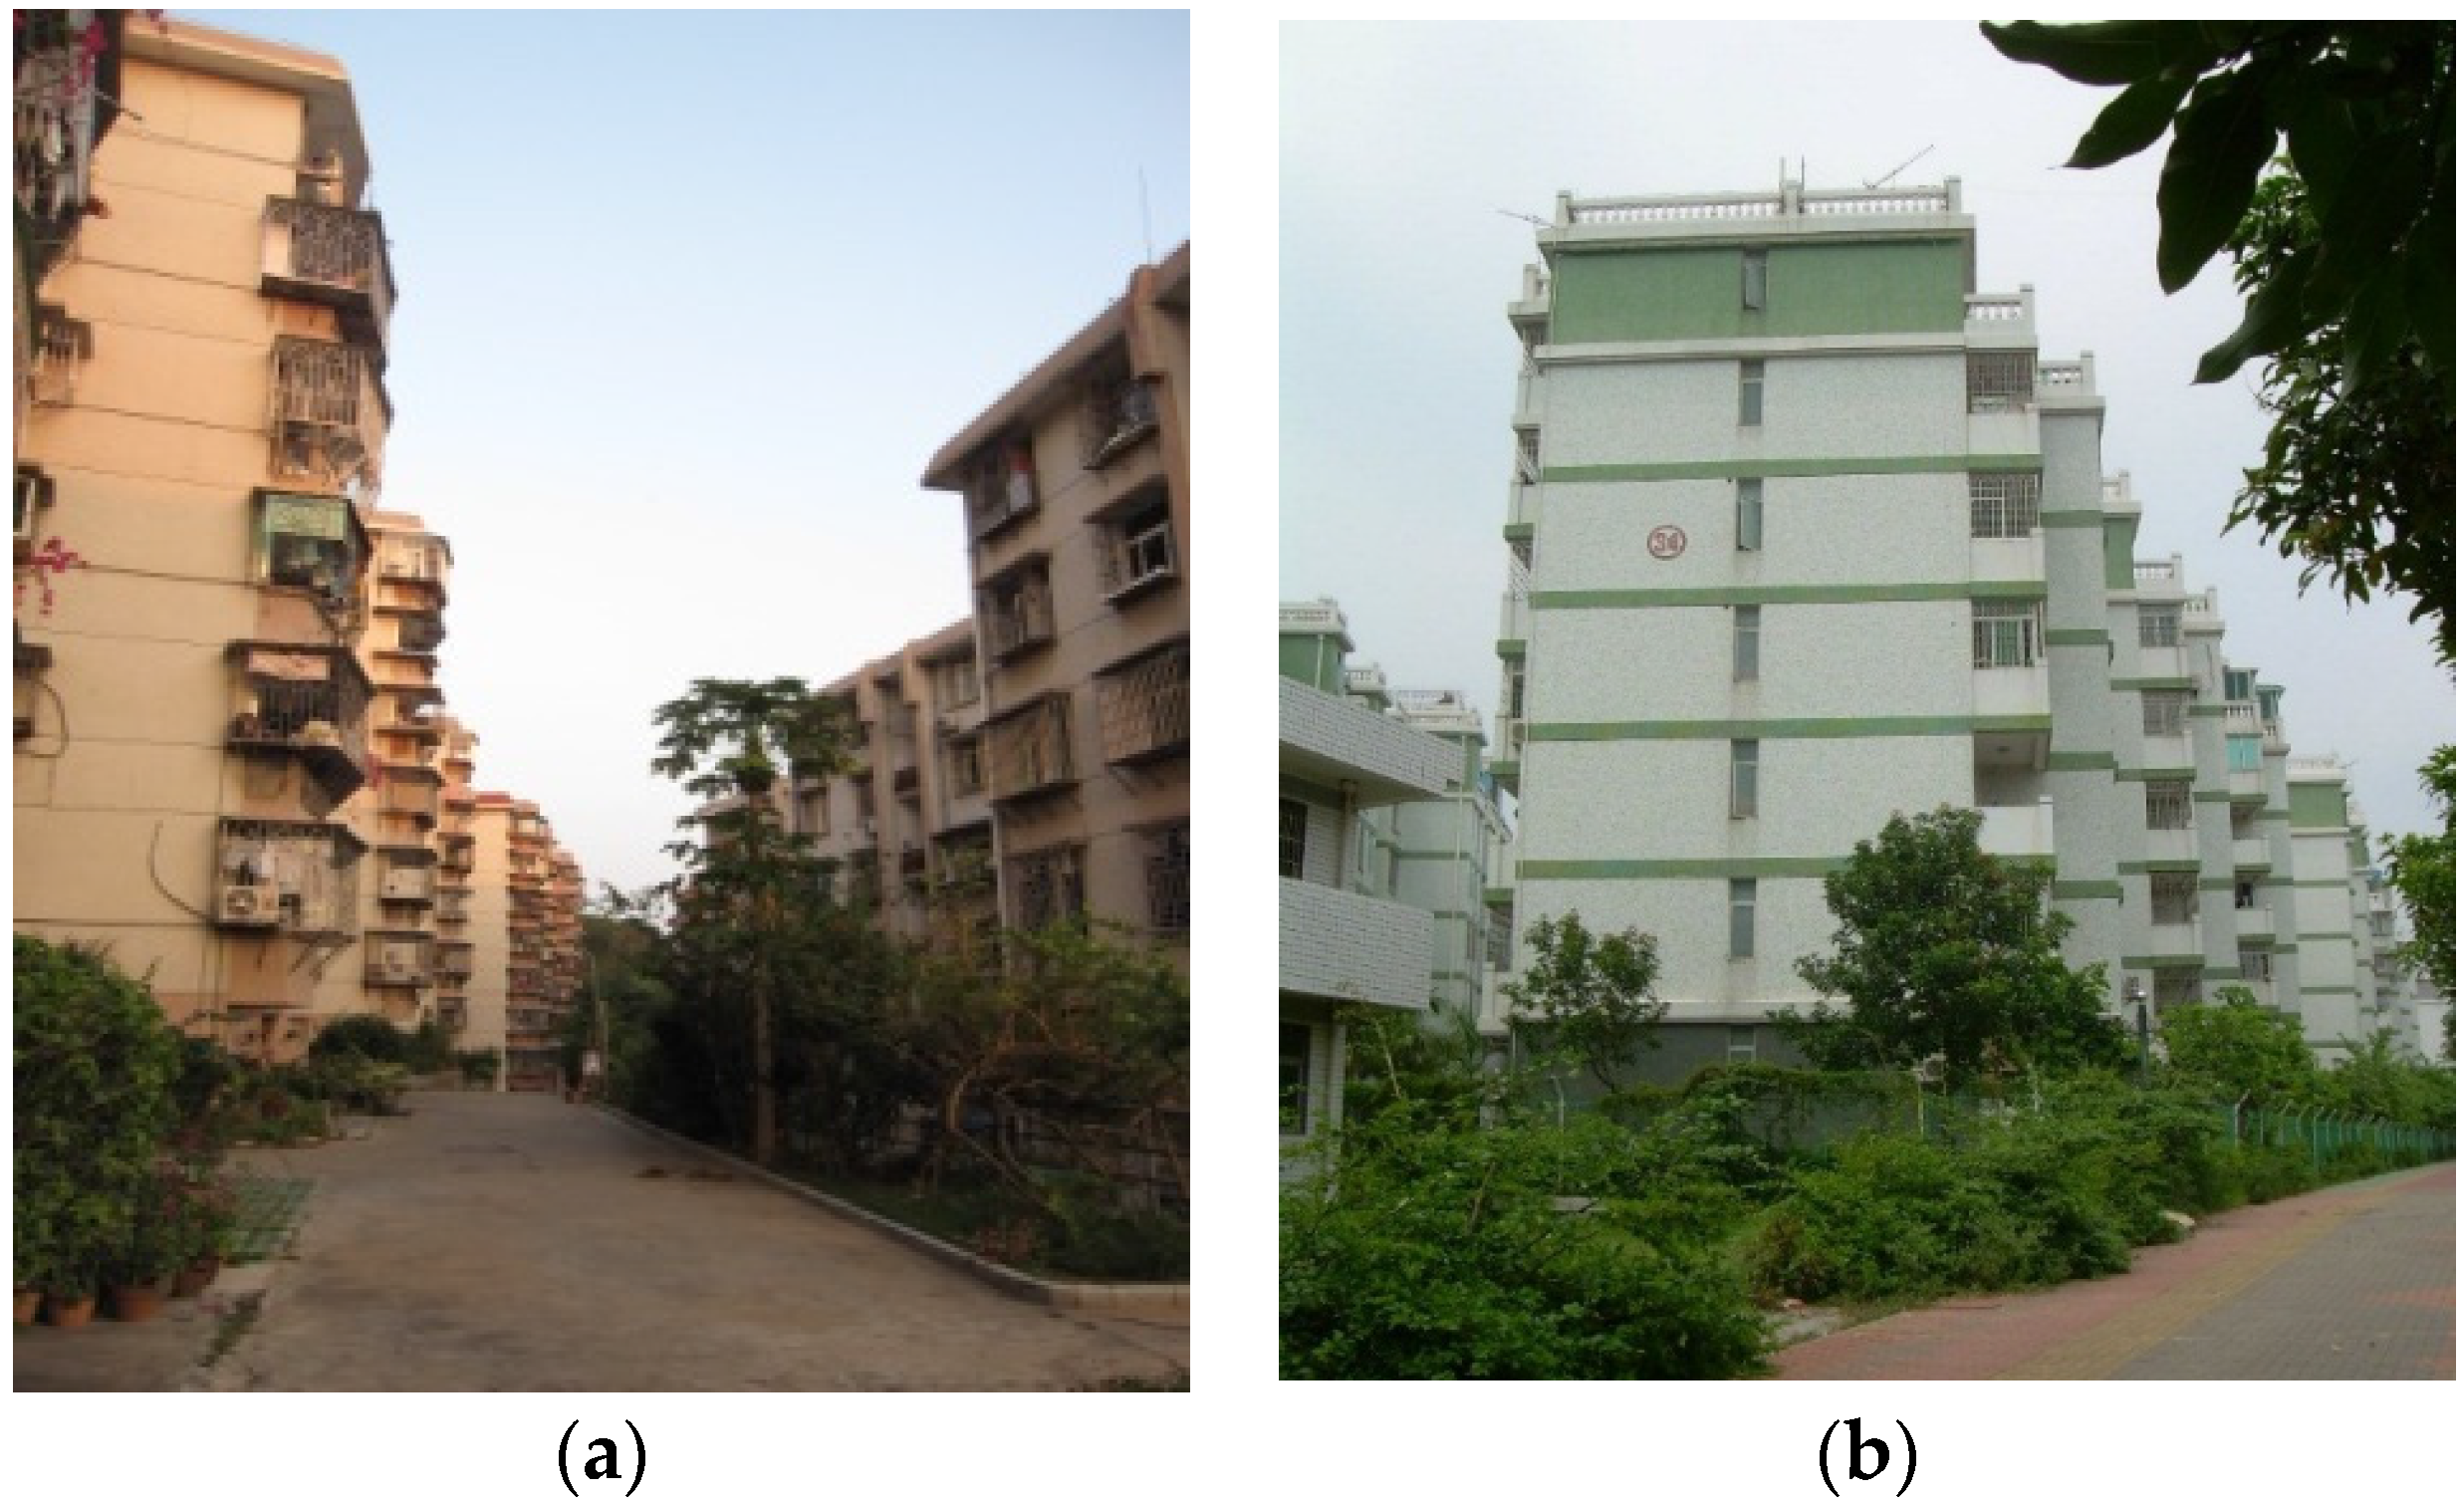
2. The Pre- and Post-Reform Settlements

Differences in the urban form of the two kinds of settlement include physical layout and density, construction type, and design philosophy. Dating from the 1950s, the pre-reform work-unit settlements were often built on relatively small areas of unit-owned land adjacent to the workplace, resulting in high-density work-unit settlements with very short commuting distances, which were convenient for pedestrians and/or cycling. The template of the pre-reform work-unit followed the Soviet architectural template, which dictated that the physical layout and building structure of the settlements were simple, and the housing layout often resembled a military camp with several rows of brick and concrete low-rise (less than seven stories) densely arranged buildings. The design focused on providing living space, and little attention was paid to planning the external environment [27].
Since the all-out enforcement of housing reform beginning in 1998, a mixed mechanism with market trading and government regulation has been established in the housing distribution system. People buying or renting a house now have more kinds of settlement type to choose from, based on their own preferences and economic level. Planning for newly-built commercial post-reform settlements sought to provide a reasonable floor area, a more attractive landscape with green coverage, and multi-functional open spaces for entertainment, parking, or other community functions. Commonly adopted construction techniques included shear wall and frame structure [28], and residents’ commuting distance usually increased [25].

3. Materials and Methods

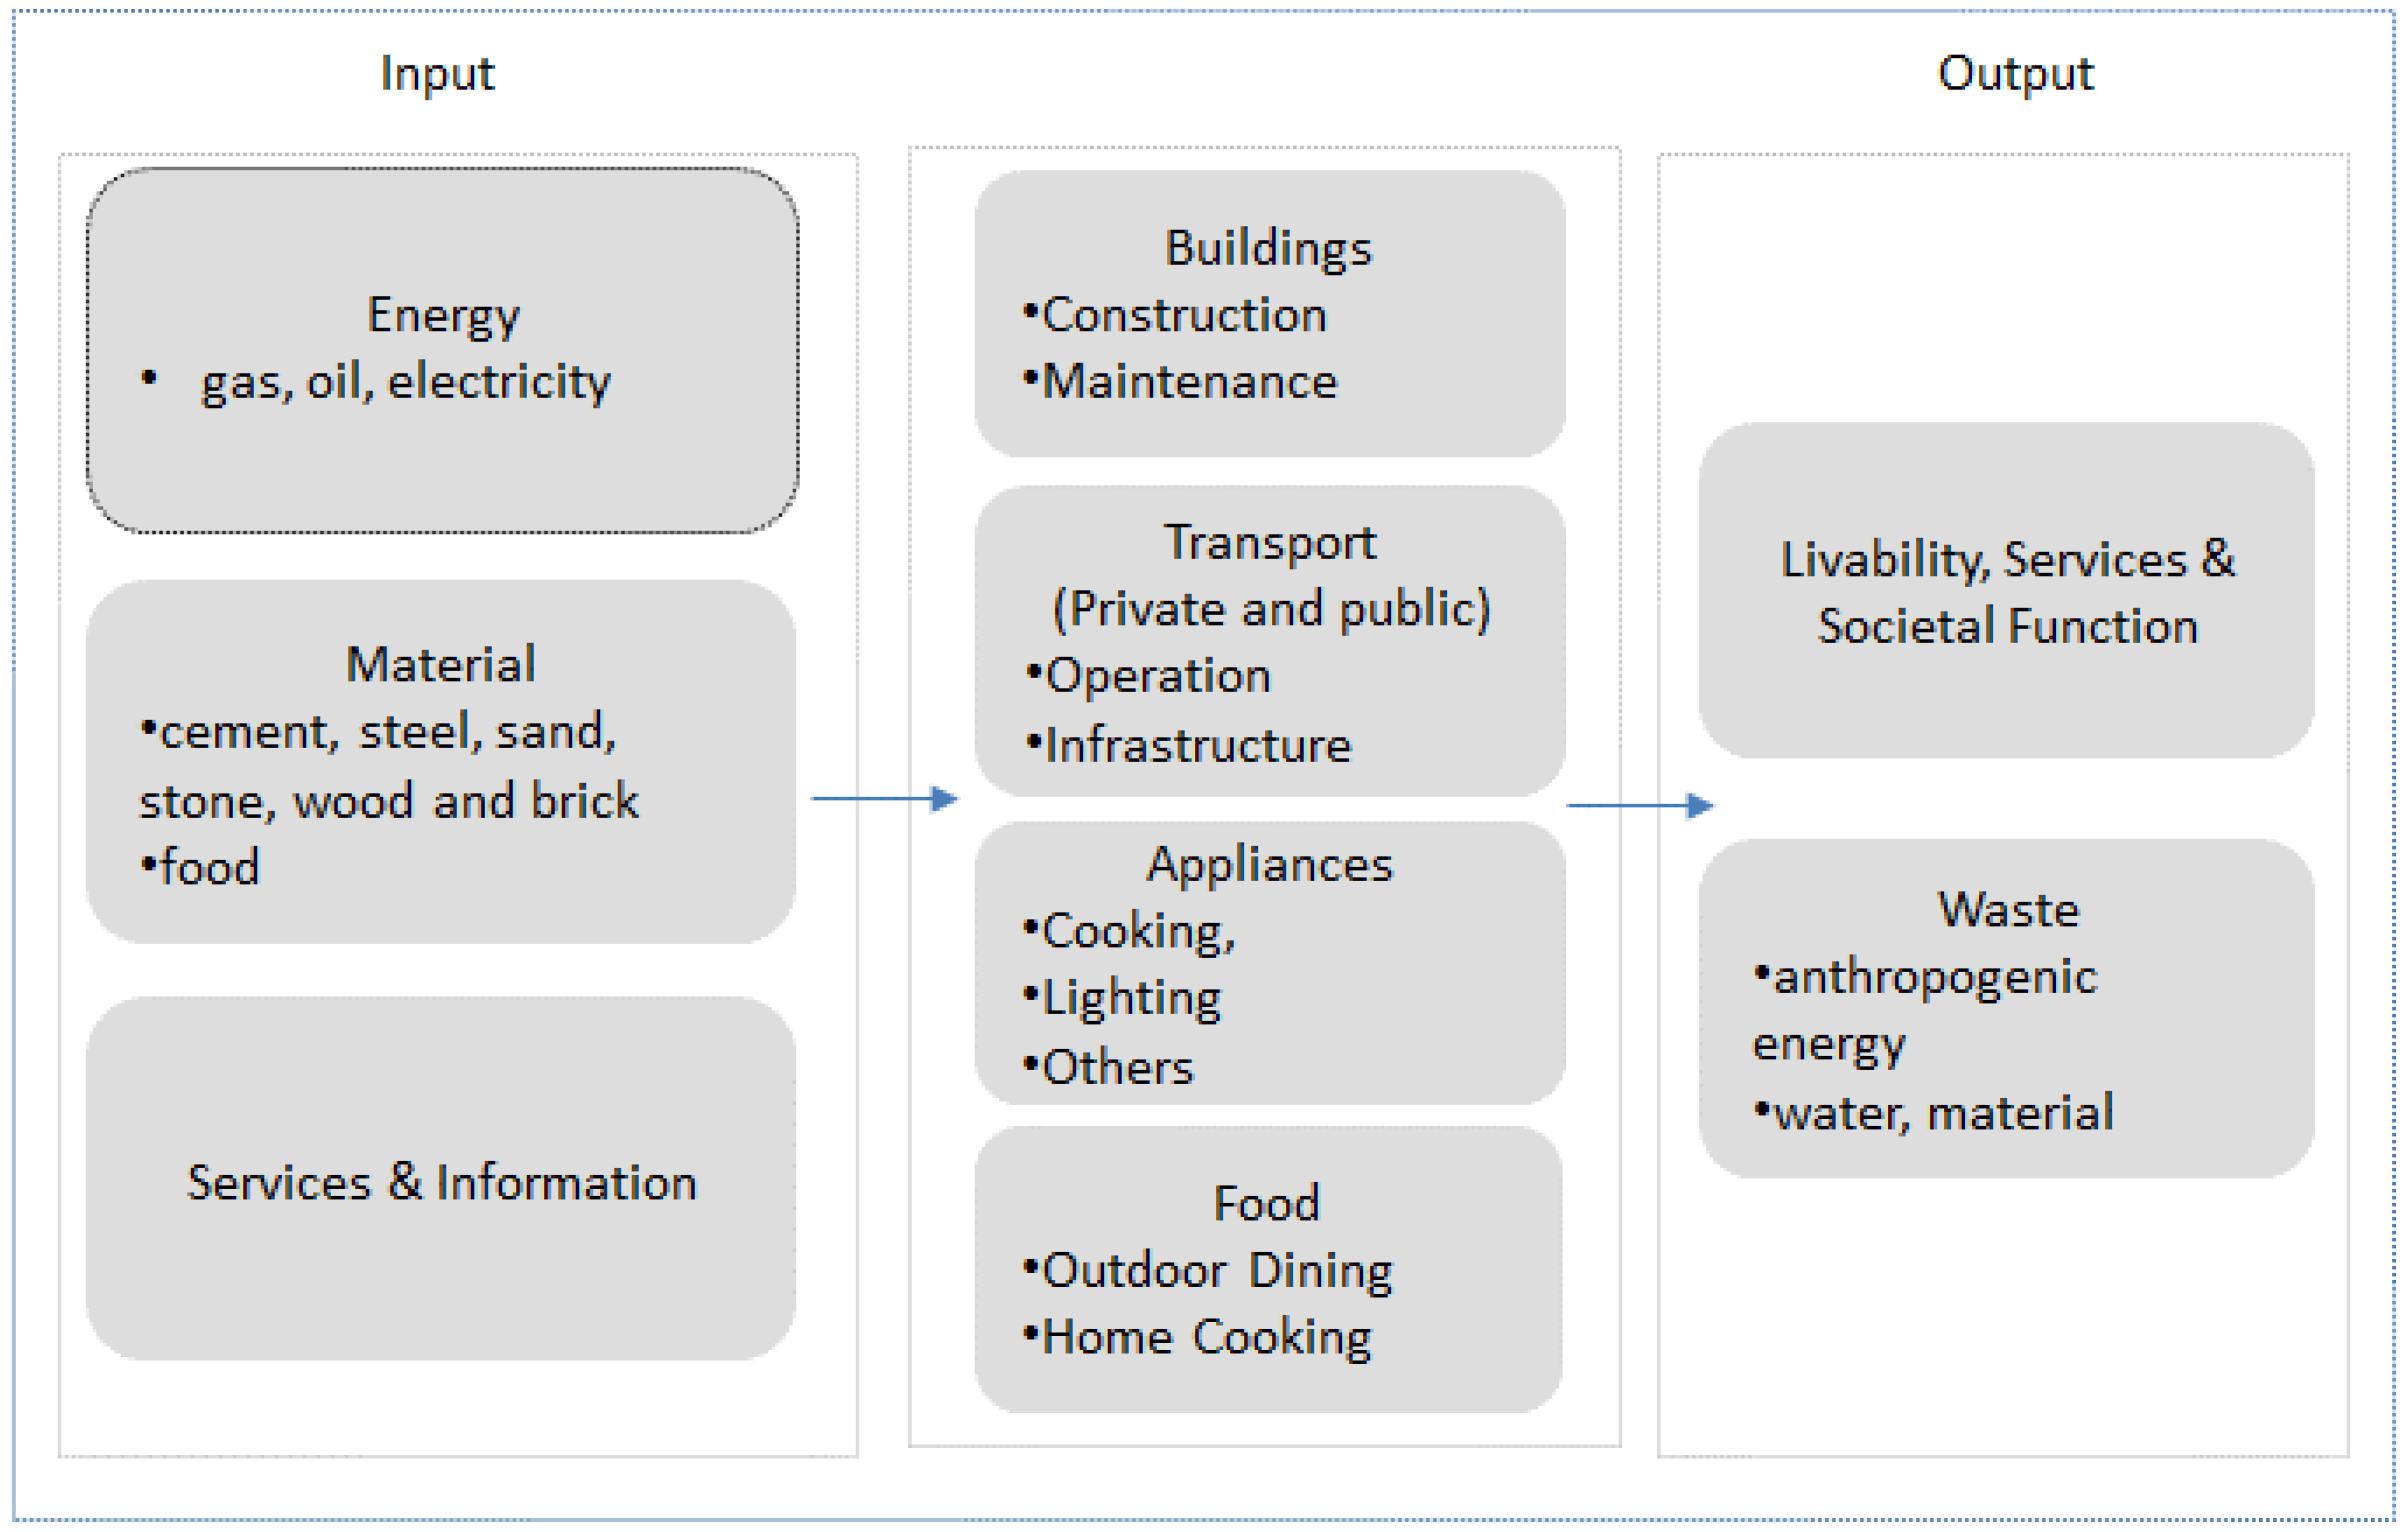
3.1. Urban Metabolism Framework and MFA Methodology

An urban metabolism conceptual framework is set up to describe the metabolism flows. The set of input and output flows, stocks, and processes, within a clearly defined settlement boundary, comprises the settlement system. Inputs and outputs at the settlement level are calculated by integrating all the potential system-driving factors, taking into account the elements of urban form that influence sustainability from a life-cycle perspective. Three major parts of the settlement system (buildings, appliances, and transportation) are studied separately and processes within each major part are identified. The neighborhood-scale consumption of three key daily necessity consumption processes is identified: buildings operation, preparation and consumption of meals and beverages, and the use of personal and public transportation [3]. System inputs include energy, materials (renewable and non-renewable), and services; materials used during building construction were also included to quantify the inputs that enabled the basic living functions of the settlement system. Outputs are livability, services and social functions, waste generated in the construction of buildings and transport infrastructure, household waste, scrapped appliances, and private cars (see Figure 1).
Methodology for MFA (Material Flow Analysis) was mostly developed by early urban metabolic studies [13,15]. In an attempt to tackle complex socioeconomic problems, some currency-based metabolic studies had been attempted by the late 1970s, and current economic evaluation of natural capital stocks was based on attempts to estimate individual “willingness-to-pay,” usually resulting in subjective evaluation [29]. Emergy and exergy analysis, rooted in the laws of thermodynamics, provides a more reliable approach for integrated urban metabolism studies [30,31]. Exergy identifies and quantifies the sources of irreversibility, and provides a clear indication of energy conversion and utilization effectiveness. However, emergy is at present the only method that directly accounts for the effects of non-commercial fluxes (rain, solar irradiation, wind, etc.) and non-material metabolic flows (information and culture) in the product “cost” [32]). In this research, the emergy analytical framework based on material flow analysis is used to analyze the interactions between human society and the natural environment.

3.2. Study Area and Data
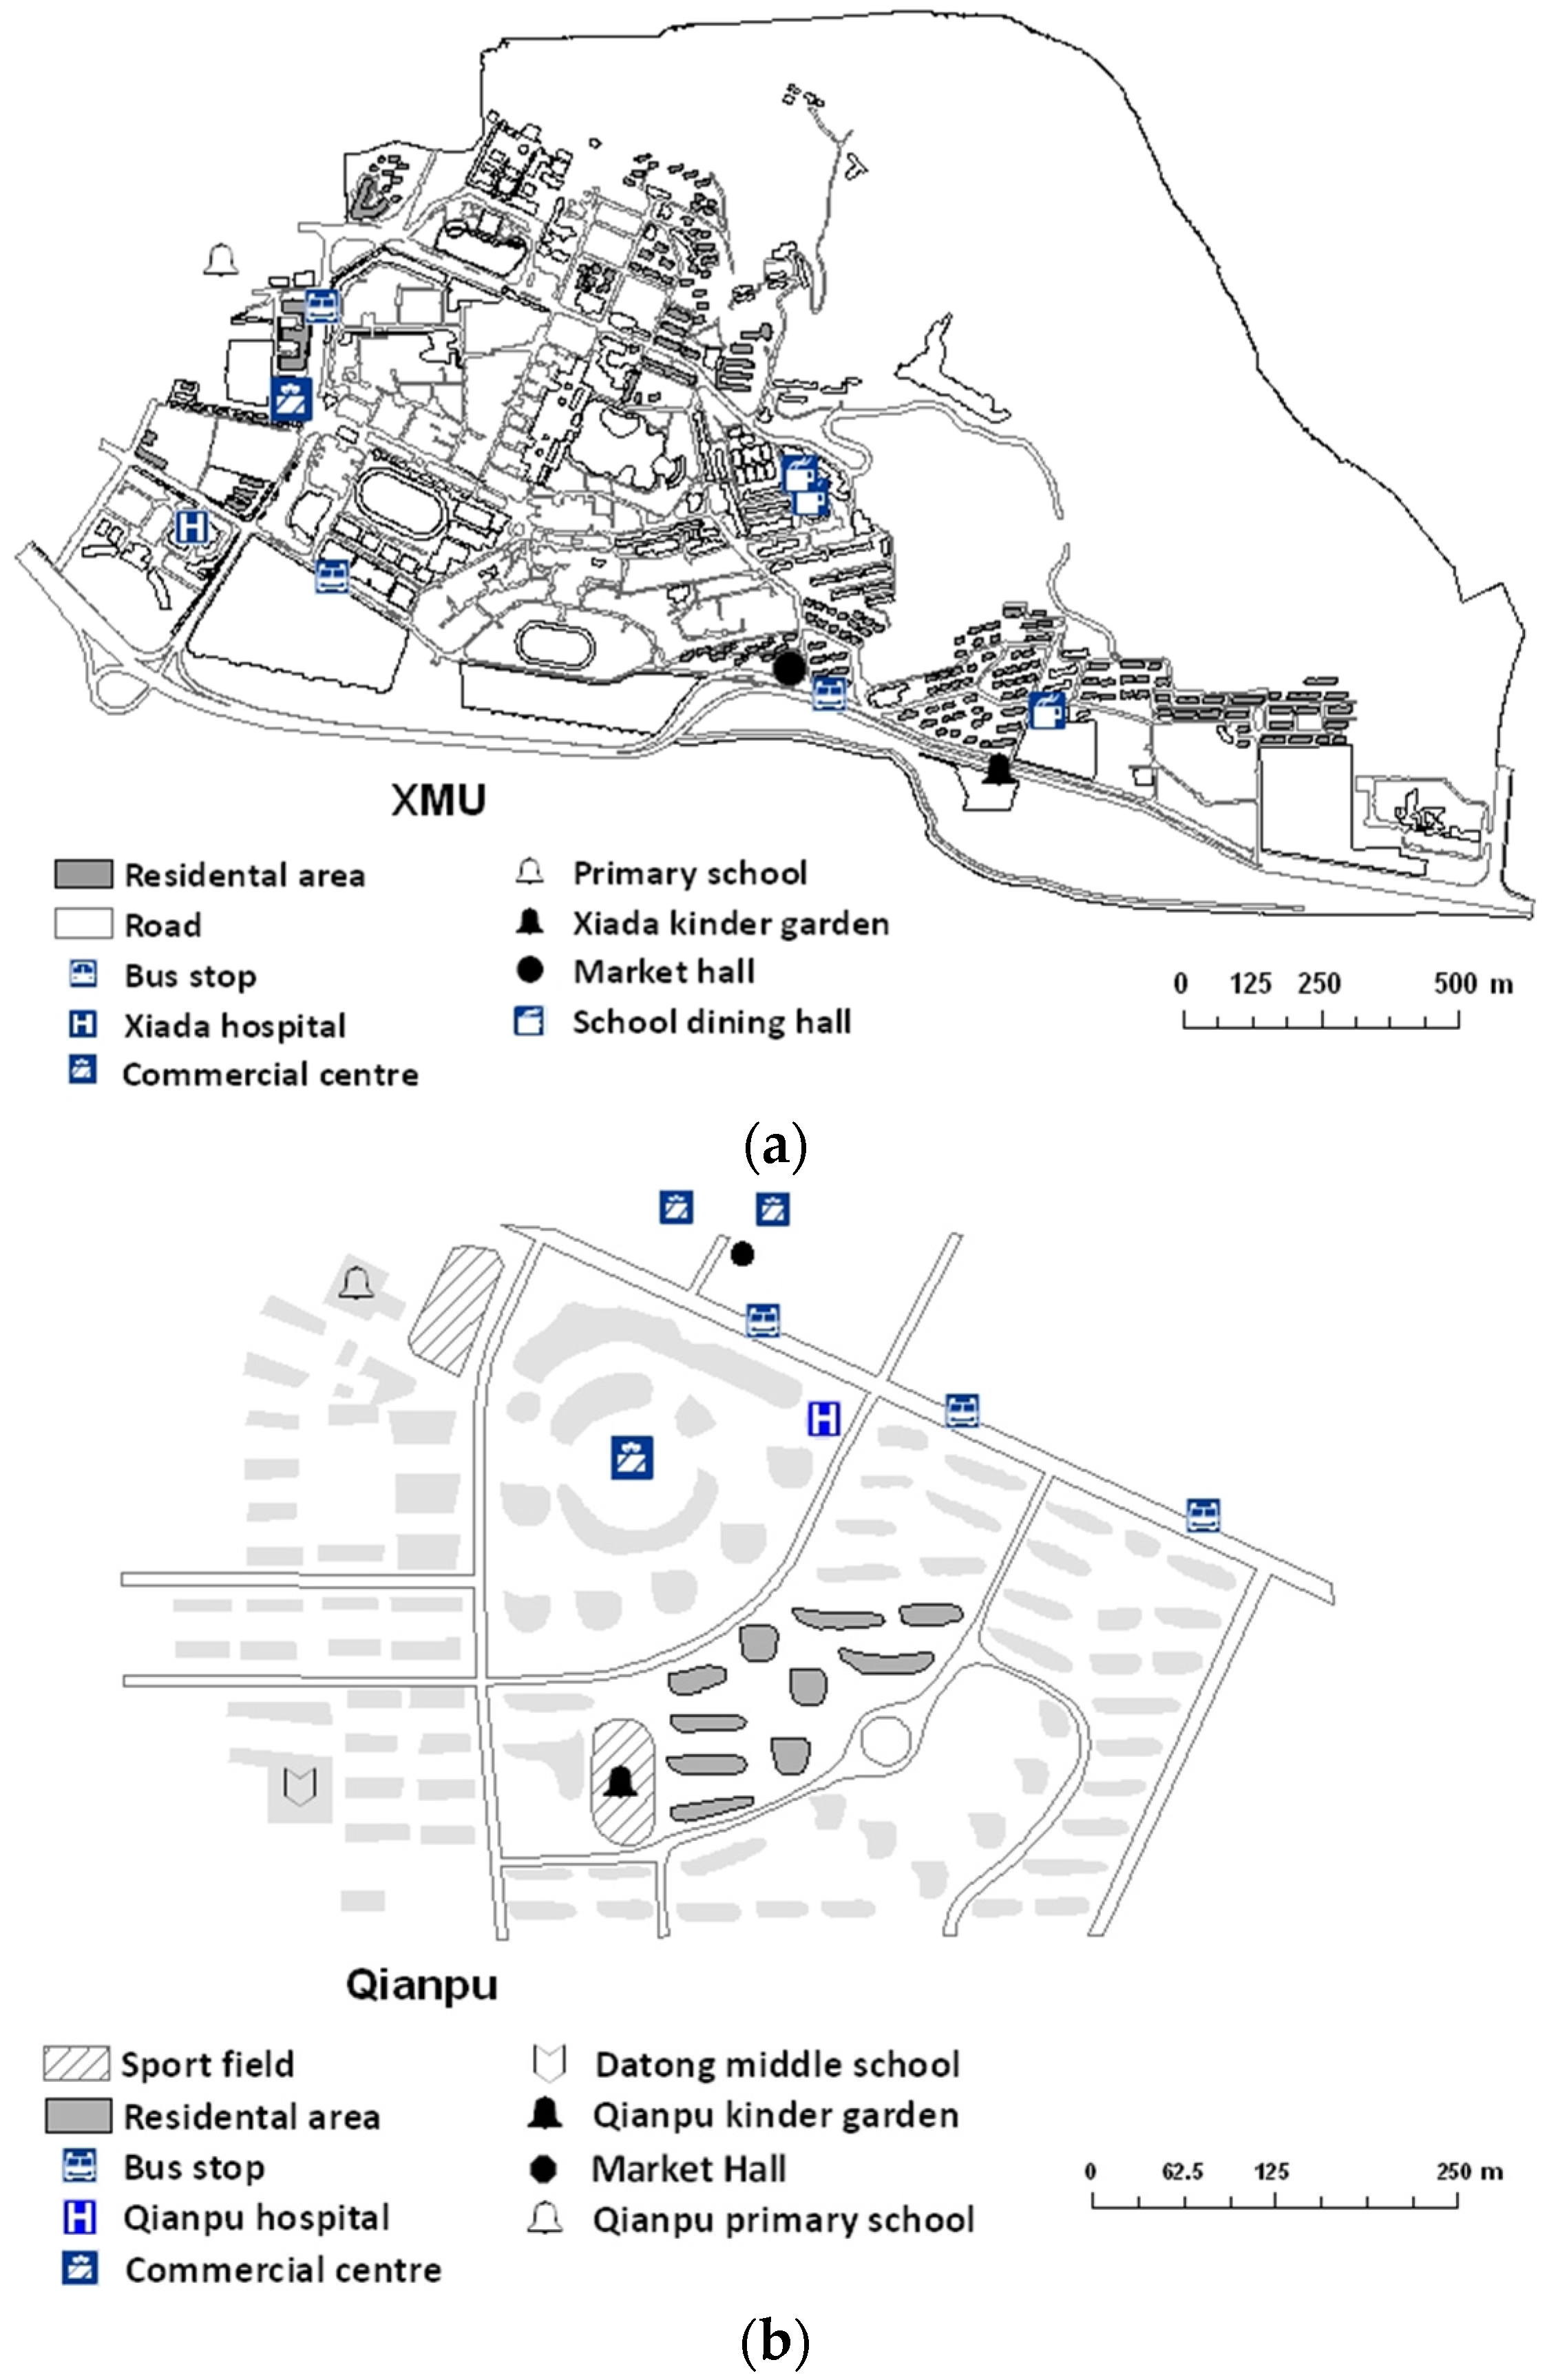
3.2.1. Study Area

As a designated “Special Economic Zone,” Xiamen was one of the first areas to implement the “opening-up” policy. The first phase of housing reform in Xiamen began in 1992, when a “Housing Provident Fund” system was first regulated. In 1999 a housing distribution monetization system was officially established, marking a fundamental turning point in local housing reform. The municipal government has also raised funds to build low-cost housing, with salaried public-sector employees being the major beneficiaries of this subsidized housing scheme. Nearly 900 work-units followed the new system and allocated housing by raising provident funds and monetizing subsidies [33].
In order to avoid socioeconomic factors influencing the results, in this study we only consider employees from the same work-unit. As a result of the homogeneous nature of the work-unit settlement, residential differentiation and socioeconomic impacts on settlement metabolism are relatively minor. Two typical and representative settlements connected to the “Xiamen University” work unit (Xiamen University settlement and Qianpu settlement) were selected to represent pre- and post-reform settlements.
As a state-owned work-unit, Xiamen University began construction on the Xiamen University settlement (XMU) in the early 1920s. The settlement was gradually reconstructed from the 1980s to the late 1990s (see Figure 2a). It consists of 159 buildings characterized with normally brick and concrete structure of pre-reform settlement in 10 subareas located around the campus (Baicheng, Haibing, Dongqu, Jingxian, Lingfeng, Qinye, Duxing, Da’nan, Guoguang, and Nan’guang). The original dormitory buildings were built before housing reform and allocated to employees without charge as housing welfare. After the housing distribution monetization system was established, they were sold to employees at low prices.
For employees who could not afford the high prices of commodity (non-welfare) housing, even with the help of the provident fund, the local government provided low-cost housing known as “settle down” (anju) projects. Qianpu settlement was built in 2000 as part of the “Xiamen affordable housing projects in Qianpu southern districts,” and was one of the first batches of anju projects to be constructed after housing reform. Based on the local government policy of attracting high-tech specialists (like employees from universities), nine buildings (including two high-rise (1–14 floors) and seven multistory (1–7 floors) buildings of shear wall) within the settlement were especially allocated for 250 households of Xiamen University employees (see Figure 2 and Figure 3).

3.2.2. Data Collection

Settlement data was largely obtained by door-to-door and face-to-face interview surveys conducted between October and November 2009. After consulting the literature [34] and pre-interviewing some professors from Xiamen University who are residents of Qianpu, the self-administered questionnaire contained 50 questions concerning socioeconomic characteristics and the four key processes of metabolic concern (see Table 1).
Surveys were conducted by graduate students from the Institute of Urban Environment, CAS and Xiamen University. Target households were the families of Xiamen University employees (or retired former employees), and the interviewee’s occupation was determined at the beginning of the interview. A multilevel probability proportion to size (PPS) sampling approach was used to equally sample across the two settlements. Two hundred thirty (XMU) and 30 (Qianpu) questionnaires, covering 10% of settlement households, were distributed to 1–3 households in every building in the two settlements. The survey successfully interviewed 198 XMU and 27 Qianpu households.

4. Results

4.1. Socioeconomic and Built-Environment Characteristics of the Two Settlements

Analysis of specific built environment variables, based on the questionnaire results (socioeconomic, housing, commuting, and appliances statistics) and other information summarized in Table 2, shows that XMU is a relatively high-density settlement located near the residents’ work unit. This conclusion is based on the larger scale of settlement area, lower per household living area, per capita living area, public road area, gross floor area, green area, and higher floor area ratio (2.1%).
Figure 3 shows the urban form of the two settlements, including the overlay, mixed land-use functions, and buildings. In XMU, built areas (the gray “Residential area”) are laid out around the campus and preserve the low-rise characteristic, and a variety of land use functions are scattered around the campus center. Short commuting distances (surveyed average: 1.5 km) increase the percentage commuting on foot or by electric bicycle (33.5% compared with 4.4% in Qianpu settlement). Apart from the significantly greater commuting distance, Qianpu settlement has a relatively condensed mixed functional form compared to XMU settlement: diverse mixed land-use functions including kindergarten, primary school, middle school, hospital, commercial center, and wet market are all within 500 m of each other, and relatively short distances away from bus stops.

4.2. Preliminary Analysis of Metabolism Processes through Flows Accounting

4.2.1. Fuels and Electricity Energy Flows

Based on average data acquired from the questionnaire, fuel and electricity energy used in household appliances was calculated from the average monthly electricity used. Building maintenance energy consumption was obtained from the money paid to the management services. Energy consumption of different vehicle types was calculated by multiplying the frequency of trips and distances/time/speed data; public transportation was estimated through the vehicle fuel consumption formulas given in the literature [34,37]. Dispersion energy was recognized but not calculated as it had a relatively minor influence on the system.

4.2.2. Material Flows

Per unit materials requirements for different type of construction and transport infrastructure, appliances, and vehicles are usually used in material flows calculation [11,34,38]. Building structure types (shear wall structure, brick–concrete structure, and frame structure) requirements can be obtained from materials (cement, steel, sand, stone, wood, and brick) consumption factors per unit residential area (hundred m2). Liu (2006) sampled 100 Beijing buildings dating from the 1950s to 2000s, and his results show an average level of material consumption in three major structural types (brick–concrete, shear wall, and frame) [39]. Transportation infrastructure material analysis was estimated from the average per capita road area in Xiamen and settlements, multiplied by factors of material consumed per m2 road construction [37]. Calculations for appliances and vehicles significant in per capita material consumption were performed using related parameters obtained from the literature [34,38,40,41], and respective depreciation was calculated over the average life span. According to the Xiamen residential food consumption [42], the contents of 12 food categories were set and calculated from average prices (statistical data) and the average retail prices reported by the Xiamen Municipal Prices Bureau (2009). Other necessary calculation data were obtained from the literature and Xiamen Road Transportation Bureau (2009), Xiamen Jimei District Government Affairs Service Centre (2009), Xiamen Statistical Bureau (2009), Xiamen Golden Dragon Corporation, and Xiamen BRT Management Corporation [43,44,45].
Building and transport infrastructure waste was calculated based on the average per capita residential area and public road area. Factors from previous literature indicate that 500–600 t of construction waste is produced per 10,000 m2 of floor space built, and 1 t of waste is produced per 1 m2 of old building demolished [46]. Scrapped appliances and private car waste was calculated from rate of return and per unit waste [40,41]. Seventeen categories of household waste were quantified based on average weights and composition [47].

4.2.3. Non-Material Flows

Non-material flows inputs include services and information. Services flows were calculated according to the respective service fee standard of the two settlements. External information inputs are calculated from per capita seminars and conference hours in 2009 [48].

4.2.4. Outputs

Services provided by the XMU faculty can be measured through course hours, scientific research tasks, and average salaries per year. Employees provide a certain number of course hours each year, and are required to raise an average amount of research project funding [49]. As consumers of services and information, graduating students possess embodied energy in the form of increased experience and knowledge, most of which comes from information given by the XMU faculty. Therefore, information outputs can be calculated through the energy differences between graduating and first-year students, based on the average time spent in class and calories consumed per hour [50].

4.3. Analysis Based on Emergy Synthesis

In this study, an emergy evaluation approach is used to estimate the contribution of different flows and processes to the settlement system, therefore comparing the sustainability of the two settlements. By definition, “emergy” is a certain kind of available energy that has been directly and indirectly used to make a product or service [51], and transformity is derived by considering all the processes that were needed to produce a material, expressing them in unit values. Emergy in the form of energy content (e.g., joule) or mass of a flow (energy, matter, information, etc.) can be multiplied by its solar transformity (unit emergy) [52]. Since the 1980s, emergy analysis has been widely used to analyze ecological, industrial, economic, and astronomical systems. At the city scale, emergy analysis case studies have evaluated single buildings [50,53] and settlement metabolism [34]. Emergy indices can be calculated to illustrate the relative worth of material flows and sustainability [54,55]. The emergy synthesis usually contains three stages: formulation of an emergy system diagram; establishment of an emergy analysis table with key flows; and evaluation of emergy indices to assess system performance [30,51,56,57].

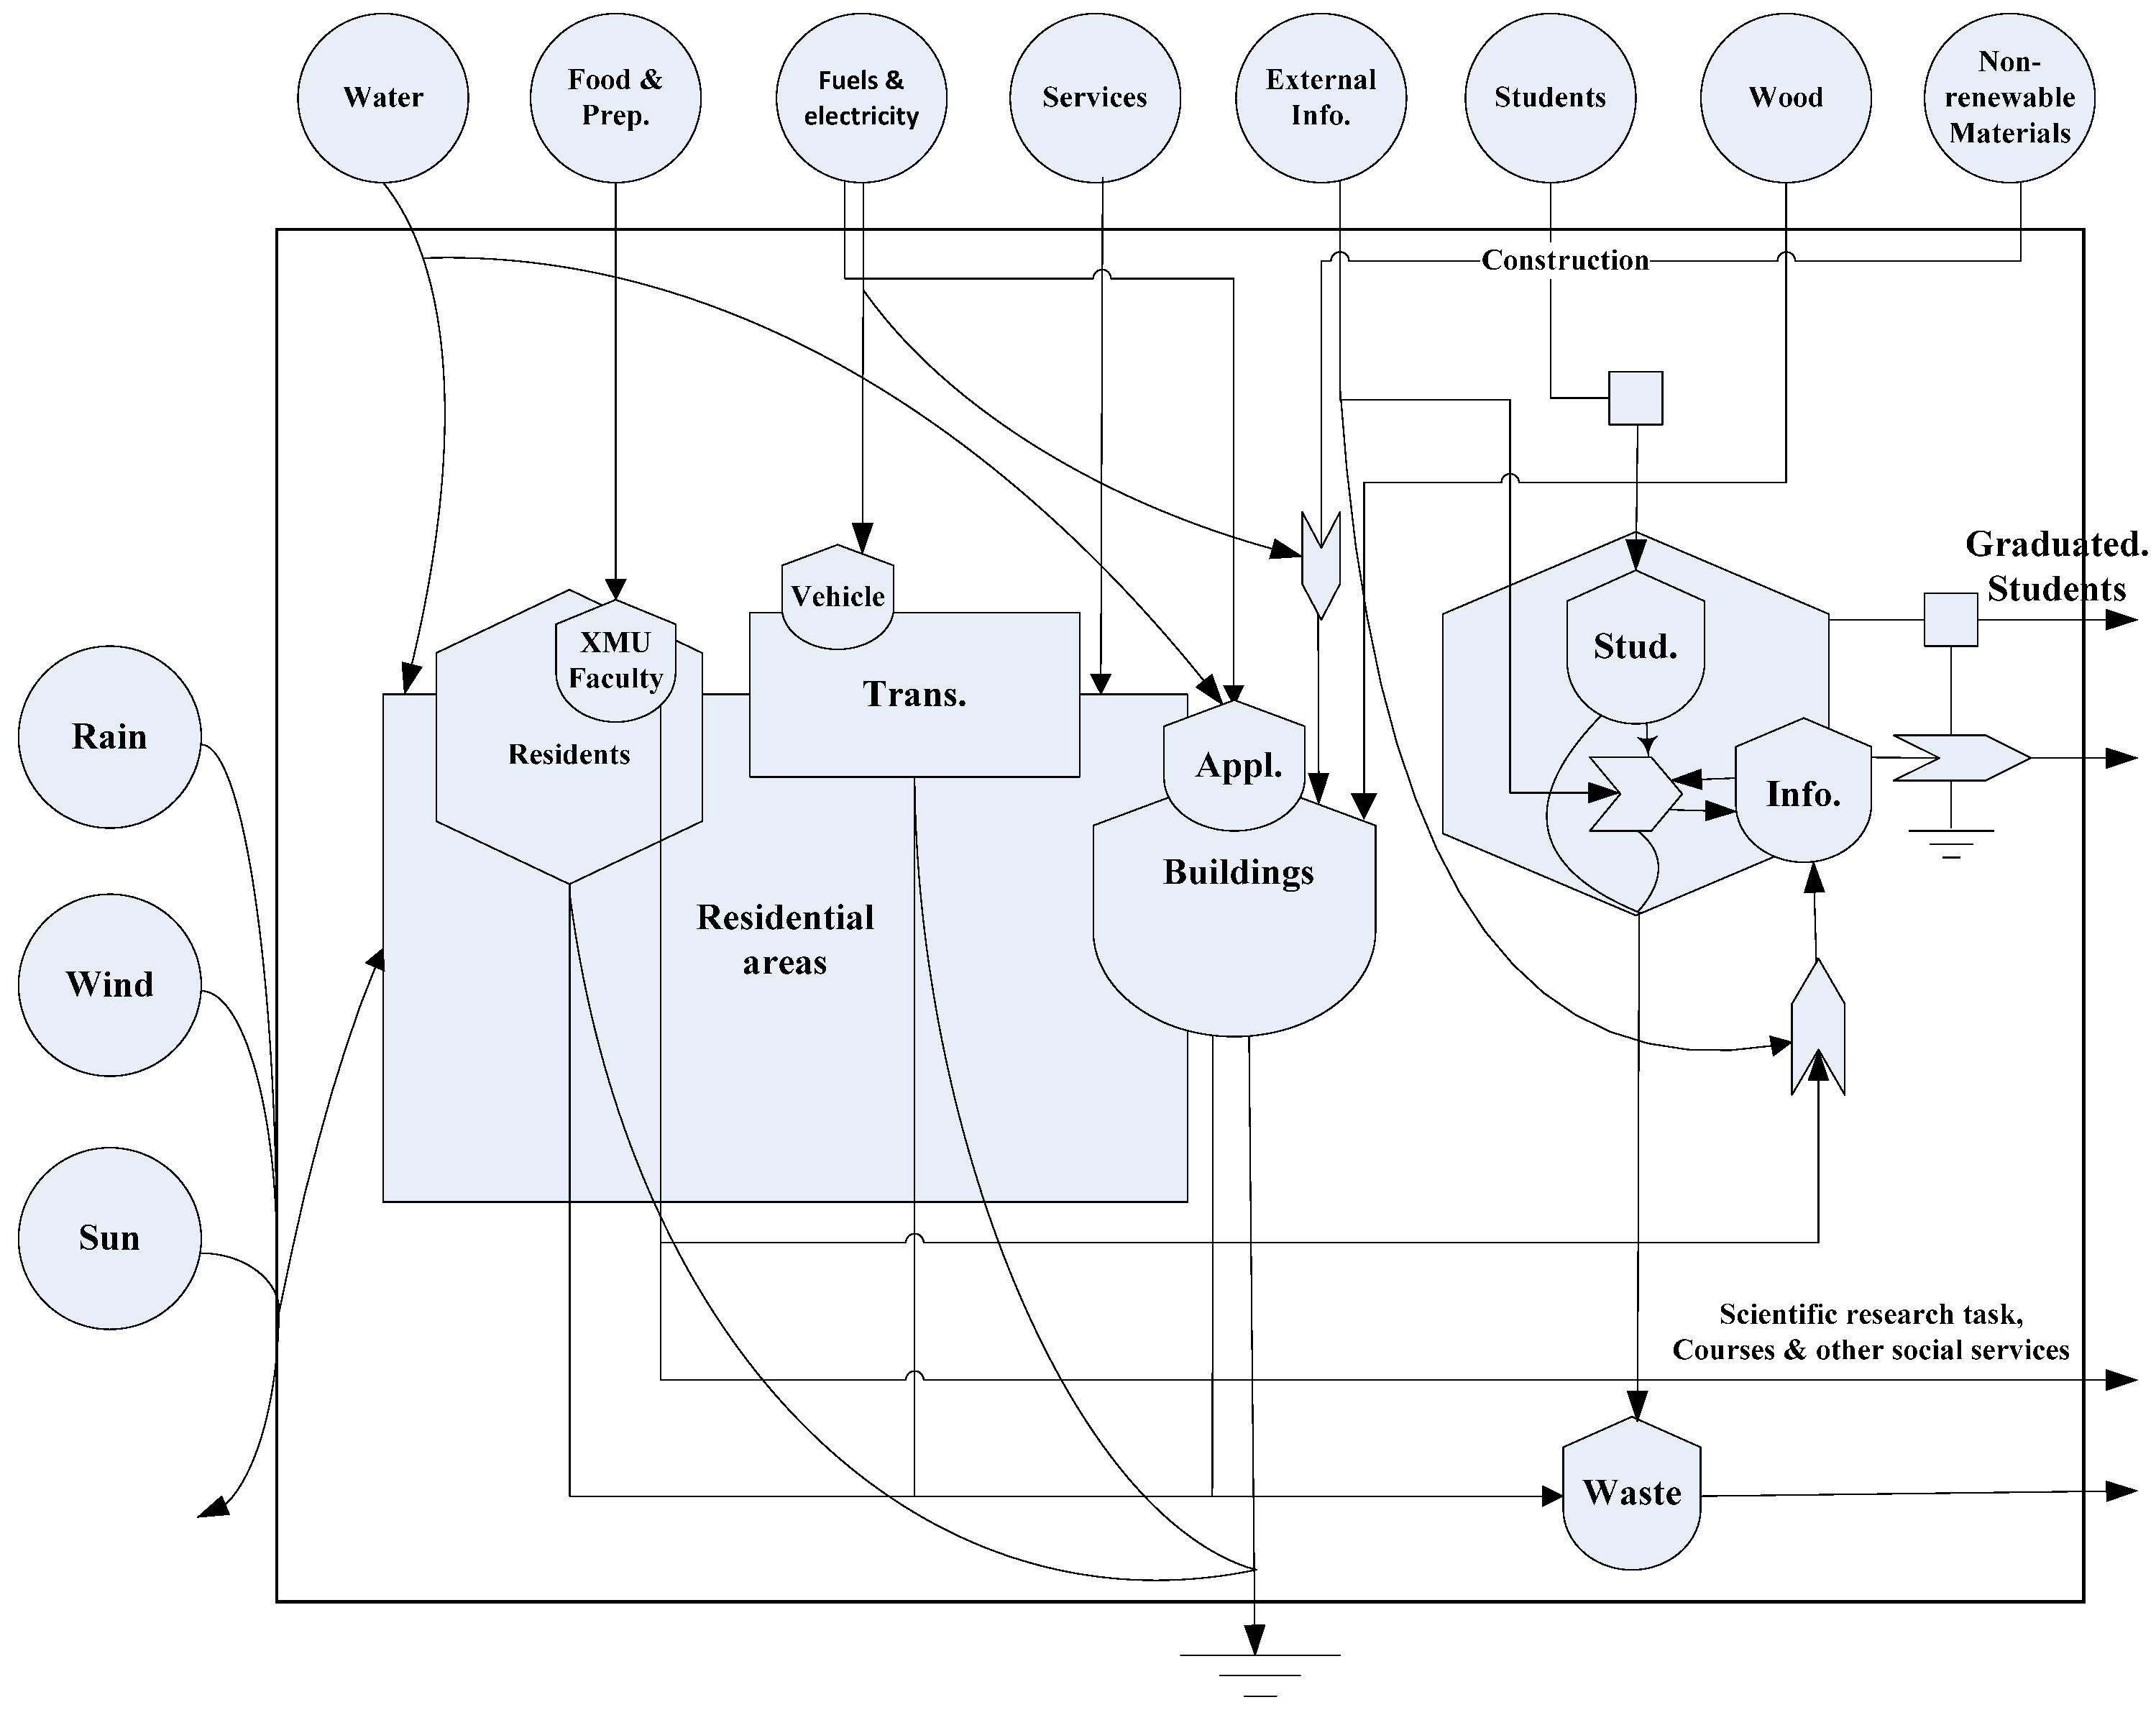
4.3.1. System Diagram

As a necessary procedure for emergy evaluation, a series of energy systems symbols were designed by Odum to represent the main ecosystem components, and provide the foundation for emergy system diagramming [31,51,58]. In the settlement system, social services and infrastructure inputs are needed to maintain settlement system operation, and the system outputs boundary are the key services (education) offered by XMU faculty residents to society.
The system diagram for settlements is presented in Figure 4. The system boundary is defined as the settlement area. The major compartments of the system include buildings with residents, the transportation system, and the student system as an information and social services acceptor. This diagram shows the inflows, storage, and outflows of the main metabolism processes that residents consume from other subsystems (buildings, food, and vehicles) and circulate through the student system (information acceptor) via information interaction. According to the transformation hierarchy level, external cycling is arranged from left to right, and represents the renewable materials (natural resources) and energy inflows to the settlement system; information such as lectures and publications makes up another external source [50]. Dispersion of potential energy into heat occurs in the information, residential, and transportation sectors during processing and storage. Food and resident subsystems contribute waste to the external system and heat dispersion occurs in nearly every subsystem and process.

4.3.2. Emergy Analysis

The emergy analysis contains system inputs and outputs flow items, including indigenous sources, nonrenewable resources, and energy. Based on the above calculation of the different quality of flows in each section, and after assembling preliminary natural environmental parameters and socioeconomic information, the annual emergy of each item was valued according to the respective emergy transformity values taken from the related literature and all the transformity values are updated to the 15.83 × 1024 sej/year global Emergy reference [59]. Summary of emergy flows in two settlements is shown in supplementary materials (Table S1).

4.4. Emergy Flow Structure of the Two Settlements

The material input emergy is the main difference between the two settlements’ emergy flow structure (Figure 5). Renewable (renewable natural resources and products) and non-renewable (non-renewable materials, fuels, and electricity) emergy flows into Qianpu were 4% and 8%, respectively. This compares with 0.3% renewable and 15% non-renewable in XMU, indicating that Qianpu was less reliant on non-renewable emergy. Figure 5b illustrates the material inputs emergy structure divided into functions. In XMU, most of the consumed non-renewable emergy was in the form of material inputs, predominantly building material inputs (>90%), while in Qianpu building material inputs were only 53%, with the rest being food (27%), appliances (12%), and transportation (8%). In addition, the total electricity energy consumed by appliance usage in Qianpu (57%) was higher than the transportation sector (43%); see Figure 5c.
Qianpu lies about 12 km away from the work unit and many employees prefer to drive to work (31.6% compared with 5.8% in XMU; see ”motor vehicle commuting” in Table 2). An ineffective jobs-housing balance strategy is expected to increase travel demand, use of time-saving motor vehicle transport, and energy consumption [24]. However, Qianpu residents used a range of transport modes, showing a slight preference for motor vehicles over public mass transit (23% vs. 21%). In addition, the proportion of emergy consumption by mass transit (bus, BRT, and commuting bus) was much higher than private car and taxi transport (71% vs. 7% emergy) in XMU. In the high density pre-reform XMU, short commuting distances result in energy savings and increased frequency of walking to work. However, the overall amount of emergy consumed demonstrates that the spatial separation of residential, work-unit, and other activities in relatively large settlement zones (i.e., the lower mixed land use compared to Qianpu), and resulting high frequency of public transport use for non-commuting trips dominates other functional consumption (see Figure 5c).

4.5. Metabolism Sustainability Indices Development and Comprehensive Analysis

Emergy-based indicators such as the Emergy Yield Ratio (EYR) and the Environmental Loading Ratio (ELR) are commonly used to illustrate the relative worth of a material and the intensity of human development around the exploitation of environmental resources [60]. On this basis, several studies extended these basic indicators to more complex emergy indices to analyze the impacts of metabolism flows at the settlement/building level [11,61,62]. With reference to urban sustainability, Huang and Hsu have developed an integrated framework of emergy-based indicators to measure the effect of urban construction on Taipei’s sustainability: (1) intensity of resource consumption; (2) inflow/outflow ratio; (3) urban livability; (4) efficiency of urban metabolism; and (5) emergy evaluation of urban metabolism [11]. According to the definition of settlement-level sustainability, a comprehensive set of sustainability indices was established to investigate sustainability covering different aspects of the settlement level, as devised by Huang and Hsu [11]. It is grouped into five categories: (1) metabolic efficiency; (2) resilience and renewability; (3) natural resources reliance; (4) waste and environmental burden; and (5) welfare.
The metabolic efficiency indicators (I) mainly focus on the emergy density (ratio of total emergy inputs to total area), characterizing an active socioeconomic system performance and inputs/outputs (ratio of emergy inputs to emergy outputs) to illustrate the effective use of materials and energy; and the emergy production ratio (ratio of system output to nonrenewable resources emergy input flows), clarifying to what extent the system output relies on nonrenewable resources. To further explore self-supportive ability and to what extent the system is reliant on both renewable and nonrenewable natural resources, the resilience and renewability indicator (II) and natural resources reliance indicators (III) include fraction of self-support (ratio of indigenous natural resources to total emergy inputs), percent fuels and electricity (ratio of fuel and electricity inputs to total emergy inputs), and percent non-renewable (ratio of nonrenewable emergy inputs to total emergy inputs) to measure the system resilience, renewability, and natural resources reliance. The waste and environmental burden indicators (IV) suggest a measure of the relative load brought by waste to the renewable resources (ratio of waste emergy outputs to renewable natural resources emergy inputs), system environmental pressure posed by waste output (ratio of waste emergy outputs to total emergy inputs), and the non-renewable emergy placed on the local environment’s indigenous natural resources emergy processing capacity (ratio of nonrenewable resources emergy flows to local indigenous natural resources inputs) [63]. Welfare indicators (V) show the outputs of system operation and the welfare benefits (total emergy inputs, material inputs, fuels and electricity input, construction input, transport infrastructure and fuel inputs, service input) per person from emergy consumption. Detailed explanations of the indicators and study results for the two settlements are shown in Table 3; for each indicator, the more sustainable value is shown in bold type.
In the first set of indicators, a low input/output ratio suggests an efficient metabolism where system investment is low while outputs are relatively high. The evaluation results of “Ratio of input/output” and “Ratio of emergy production” show that Qianpu performs better in metabolic efficiency with the exception of the emergy density indicator, with higher outputs and less reliance on nonrenewable resources inputs from outside. Furthermore, evaluation results of “Fraction of self-support ratio” and natural resources reliance indicators suggest that Qianpu is stronger and more self-supportive, with higher indigenous natural resources input and environmental-friendly consuming modes, and is also less reliant on natural resources due to lower fuel, electricity, and nonrenewable inputs as indicated by the “Per capita fuels and electricity use” indicator and “Percent non-renewable” indicator evaluation results. From the Welfare indicators it can be seen from “Per capita material use” and “Services input” that Qianpu residents enjoy relatively high material and services livability. Their welfare is also greener, mainly due to the contribution made by renewable resources to material welfare (29% in Figure 5a). According to the definition of settlement-level sustainability, post-reform Qianpu is more sustainable than XMU, due to its relatively high metabolism efficiency, lower environmental loading, natural resources use and waste production, greener per capita welfare, and environmentally-sustainable system operation, as shown in the evaluation results of indicators.
With reference to the XMU settlement, the high emergy density of XMU characterizes an active system socioeconomic performance. Within the active flows, the low proportion of renewable resources (0.26% in Figure 5a) and a large amount of nonrenewable inputs (19.12% in Figure 5a) (predominantly building material inputs) contribute to all of the environmental pressure indicators, the high value of which suggests an increase in environmental demand and a heavier potential pressure from waste to the surrounding ecosystem. Actually, nonrenewable resources make up the majority of XMU material inputs (98.7% in Figure 5a), most of which are incorporated into the structure of the buildings, as indicated in the “Per capita construction use” indicator and construction input flows (92.3% in Figure 5b). In addition, evaluation results for the “Per capita fuels and electricity use”, “Per capita construction use”, and “Per capita infrastructure use” indicators suggested that welfare of XMU relies heavily on non-renewable fuels, electricity, construction, and infrastructure use, and the per capita welfare indicator is decreased due to the high resident density.

5. Discussion

There is still no consensus on what constitutes a sustainable urban form. However, it is commonly agreed that greater sustainability will be achieved for multi-functional settlements in relation to higher population densities, mixed land use, and shorter commuting distances [64,65,66,67,68]. Ma et al. have studied the relationship between urban form and individual behavior and found that the travel behavior of inhabitants from work unit settlements and Hutong settlements is generally more “low-carbon” compared with a newly built settlement. Furthermore, the commuting carbon emission of the work unit settlements and Hutong settlements (usually characterized by high population density and narrow alleys) is one third that of the newly built settlement, mainly for the surrounding land use model and urban planning of settlements [26]. The results in this study also support the conclusion that high-density settlements with integrated, mixed-use, and spatial planning, which is more pedestrian-friendly and bicycle-oriented, are more sustainable at the settlement scale under the metabolism context. While it may sometimes be possible to take advantage of the work–housing balance inherited from the old work-unit settlements, high residential density and short commuting distances may not be as sustainable as previously assumed. Instead, as indicated by the higher metabolic efficiency of Qianpu, the necessary foundation for sustainable Chinese cities includes integrated mixed-use land planning, which provides convenient facilities and infrastructure, short travel distances, and a relatively lower household density.
The findings in this paper are based on only two cases and are therefore not enough to provide definitive conclusions on the nature of genuinely compact and sustainable settlements. Further elements of sustainability, e.g., improving ecosystem health by integrating urban form planning with green considerations, improving social welfare, perception of neighborhood safety, and preserving privacy at high density, are also important considerations that supplement the complex dimensions of sustainability but go beyond the emergy approach. However, Wu and Ren (1999) found that pre-reform settlements may lead to unreasonable land use in areas outside the work unit settlements, and poor living conditions in cities [69]. It would be desirable to conduct an integrated examination of more case studies in different kinds of settlements, considering social, economic, and physical factors.
The material flow analysis (MFA) and emergy analysis (EMA) methodologies adopted for this study stem from the industrial ecology field of urban metabolism. Urban metabolism has provided effective approaches for quantitatively measuring input and output flows and stocks, and has helped with recognition of socio-ecological processes, impacts, and driving factors [70,71]. However, there are some debates about the metaphorical conception of metabolism and its appropriateness [71]. The contested points mainly focus on the real existence of controls, information-mediated feedback cycles, or evolutionary mechanisms, as shown in several studies [71,72,73]. We are also aware that industrial ecology assessment takes little account of the social, historical, and political processes and dynamics reshaping urban metabolisms [74]. Political–industrial ecology analyses offer valuable and novel insights into the relationship between the society, policy and nature. Therefore, to address the shortcomings in the industrial ecology approach, further studies should concentrate on broadening considerations of social behavior, political, ecological, and economic processes within the political–industrial ecology context. Our results are also characterized by different aspects of uncertainty. Construction material consumption per unit may differ in space and time, but the ratio of material consumed in three major structural types (brick–concrete, shear wall, and frame) is relatively constant in the medium term. Meanwhile, emergy accounting often overestimates the low exergy (high entropy) fluxes [30], and more complementary work could be performed using exergy methods that offer useful insights for the correct assessment of the process. The emergy analysis may also be further refined by using the “partial transformities” approach (see [63]) to determine the sedimentary and renewable fraction of non-dissipated materials such as sand, stone, cement, and brick, thereby reducing the dominance of building materials in material emergy inputs.

6. Conclusions

By analyzing settlement-level metabolism and sustainability, this study helps to understand how anthropogenic activities interact with urban form and inner metabolic processes and ultimately impact urban sustainability. Based on the data analysis, we draw three conclusions. First, the work-unit settlements have a lower per capita land area and less mixed land use than post-reform settlements. Previous research has found that the housing reform stimulated planning and construction [70]; it was desirable to improve post-reform built environmental quality, which resulted in more mixed-function land use and improved residential livability, as in Qianpu settlement. Second, housing reform has changed the work–housing balance and travel demand has increased. However, metabolic efficiency gains from short commuting distances will not always lead to an overall decrease in motor vehicle use, as some previous research shows [24]. In fact, non-commuting transportation was responsible for most of the emergy consumed by private and public transportation, increasing the importance of local mixed land-use functional planning. Third, the post-reform settlement is more sustainable due to its relatively high metabolic efficiency, low environmental loading, natural resources use and waste production, greener per capita welfare, and environmentally-sustainable system operation. The sustainability improvements come from (1) suitable building density and floor area ratio; (2) mixed-function land use with convenient access to schools, public transport, and commercial and recreational centers. Although the brick–concrete construction structure saves on non-renewable materials, high building density with ineffective mixed-use incorporation has made welfare heavily dependent on non-renewable fuels, electricity, and infrastructure, and decreased the per capita welfare of XMU.

Supplementary Materials

The following are available online at www.mdpi.com/2071-1050/8/5/459/s1, Table S1: Summary of emergy flows in two settlements.

Acknowledgments

The authors wish to thank the editor and three anonymous reviewers for their comments and suggestions. This study was supported by the National Natural Science Foundation of China (71533003, 41371205 and 41371535), National Science and Technology Support Program of China (2013BAJ04B01), the Chinese Academy of Sciences (KZCX2-YW-450), the Knowledge Innovation Program of the Chinese Academy of Sciences (IUEQN201302), Natural Science Foundation of Ningbo (2013A610284), and the Nature Science Foundation of Fujian Province, China (2016J01200). We would like to thank Luoping Zhang and Huanhuan Rao at XMU University for helping with the survey and questionnaire.

Author Contributions

Lijie Gao and Shenghui Cui conceived and designed the structure and case study of the paper; Dewei Yang and Lina Tang helped reorganize the structure of the paper; Xuanqi Li designed the questionnaire and did the survey; Jonathan Vause wrote part of the Discussion section and contributed analysis tools; Lishan Xiao and Longyu Shi did the statistics work and analyzed the data.

Conflicts of Interest

The authors declare no conflict of interest. The founding sponsors had no role in the design of the study; in the collection, analyses, or interpretation of data; in the writing of the manuscript, and in the decision to publish the results.

References

  1. UNDP (UN Population Division). World Urbanization Prospects: The 2007 Revision. Executive Summary; UN Population Division: New York, NY, USA, 2008; p. 2. [Google Scholar]
  2. Huang, S.L.; Kao, W.C.; Lee, C.L. Energetic mechanisms and development of an urban landscape system. Ecol. Model. 2007, 201, 495–506. [Google Scholar] [CrossRef]
  3. Codoban, N.; Kennedy, C.A. Metabolism of neighborhoods. J. Urban Plan. Dev. 2008, 134, 21–31. [Google Scholar] [CrossRef]
  4. Golubiewski, N. Is there a metabolism of an urban ecosystem? An ecological critique. AMBIO A J. Hum. Environ. 2012, 41, 751–764. [Google Scholar] [CrossRef] [PubMed]
  5. Chrysoulakis, N.; Lopes, M.; San José, R.; Grimmond, C.S.B.; Jones, M.B.; Magliulo, V.; Klostermann, J.E.M.; Synnefa, A.; Mitraka, Z.; Castro, Z.A.; et al. Sustainable urban metabolism as a link between bio-physical sciences and urban planning: The bridge project. Landsc. Urban Plan. 2013, 112, 100–117. [Google Scholar] [CrossRef]
  6. Baccini, P.; Brunner, P.H. Metabolism of the Anthroposphere: Analysis, Evaluation, Design, 2nd ed.; The MIT Press: Cambridge, MA, USA, 2012; pp. 81–172. [Google Scholar]
  7. Dempsey, N.; Brown, C.; Raman, S.; Porta, S.; Jenks, M.; Jones, C.; Bramley, G. Elements of urban form. In Dimensions of the Sustainable City; Jenks, M., Jones, C., Eds.; Springer: Dordrecht, The Netherland, 2009; pp. 21–51. [Google Scholar]
  8. Kennedy, C.; Cuddihy, J.; Engel-Yan, J. The changing metabolism of cities. J. Ind. Ecol. 2007, 11, 43–59. [Google Scholar] [CrossRef]
  9. OECD. Innovative Policies for Sustainable Urban Development—The Ecological City; OECD: Paris, France, 1996; pp. 12–20. [Google Scholar]
  10. Newman, P.W.G. Sustainability and cities: Extending the metabolism model. Landsc. Urban Plan. 1999, 44, 219–226. [Google Scholar] [CrossRef]
  11. Huang, S.L.; Hsu, W.L. Material flow analysis and emergy evaluation of Taipei’s urban construction. Landsc. Urban Plan. 2003, 53, 145–161. [Google Scholar] [CrossRef]
  12. Wolman, A. The metabolism of cities. Sci. Am. 1965, 213, 179–190. [Google Scholar] [CrossRef] [PubMed]
  13. Rappaport, R.A. The flow of energy in an agricultural society. Sci. Am. 1971, 224, 117–133. [Google Scholar]
  14. Hanya, T.; Ambe, Y. A study on the metabolism of cities. Sci. Better Environ. 1977. [Google Scholar] [CrossRef]
  15. Newcombe, K.; Kalina, J.D.; Aston, A.R. The metabolism of a city: The case of Hong Kong. Ambio 1978, 7, 3–15. [Google Scholar]
  16. Kennedy, C.; Pincetl, S.; Bunje, P. The study of urban metabolism and its applications to urban planning and design. Environ. Pollut. 2011, 159, 1965–1973. [Google Scholar] [CrossRef] [PubMed]
  17. Darton, R.C. Scenarios and metrics as guides to a sustainable future: The case of energy supply. Process Saf. Environ. Prot. 2003, 81, 295–302. [Google Scholar] [CrossRef]
  18. Balta, M. Exergetic cost analysis and sustainability assessment of various low exergy heating systems. Energy Build. 2012, 55, 721–727. [Google Scholar] [CrossRef]
  19. Balta, M.; Dincer, I.; Hepbasli, A. Performance and sustainability assessment of energy options for building HVAC applications. Energy Build. 2010, 42, 1320–1328. [Google Scholar] [CrossRef]
  20. Kim, J.T.; Todorovic, M.S. Towards sustainability index for healthy buildings—Via intrinsic thermodynamics, green accounting and harmony. Energy Build. 2013, 62, 627–637. [Google Scholar] [CrossRef]
  21. Ortiz, O.; Castells, F.; Sonnemann, G. Sustainability in the construction industry: A review of recent developments based on LCA. Constr. Build. Mater. 2009, 23, 28–39. [Google Scholar] [CrossRef]
  22. Reza, B.; Sadiq, R.; Hewage, K. Emergy-based life cycle assessment (Em-LCA) of multi-unit and single-family residential buildings in Canada. Int. J. Sustain. Built. Environ. 2014, 3, 207–224. [Google Scholar] [CrossRef]
  23. Pan, H.X.; Shen, Q.; Zhang, M. Influence of urban form on travel behaviour in four neighbourhoods of Shanghai. Urban Stud. 2009, 46, 275–294. [Google Scholar]
  24. Wang, D.; Chai, Y. The jobs-housing relationship and commuting in Beijing, China: The legacy of Danwei. J. Transp. Geogr. 2009, 17, 30–38. [Google Scholar] [CrossRef]
  25. Zhou, S.H.; Lan, L.Y. The situation and transition of jobs-housing relocation in Guangzhou, China. Acta Geogr. Sin. 2010, 65, 191–201. [Google Scholar]
  26. Ma, J.; Liu, Z.; Chai, Y. Urban form and carbon emissions from urban transport: Based on the analysis of individual behavior. Urban Plan. Int. 2013, 28, 19–24. [Google Scholar]
  27. Wang, Y.P.; Murie, A. Commercial housing development in urban China. Urban Stud. 1999, 36, 1475–1494. [Google Scholar] [CrossRef] [PubMed]
  28. Liu, J.R.; Wang, R.S.; Yang, J.X. Metabolism and driving forces of Chinese urban household consumption. Popul. Environ. 2005, 26, 325–341. [Google Scholar] [CrossRef]
  29. Costanza, R.; D’Arge, R.; Groot, R.D.; Farber, S.; Grasso, M.; Hannon, B.; Limburg, K.; Naeem, S.; O’Neill, R.V.; Paruelo, J.; et al. The value of the world’s ecosystem services and natural capital. Nature 1997, 387, 253–260. [Google Scholar] [CrossRef]
  30. Sciubba, E.; Ulgiatib, S. Emergy and exergy analyses: Complementary methods or irreducible ideological options? Energy 2005, 30, 1953–1988. [Google Scholar] [CrossRef]
  31. Crawley, M.J.; Odum, H.T. Systems ecology; An introduction. J. Anim. Ecol. 1984. [Google Scholar] [CrossRef]
  32. Balocco, C.; Papeschi, S.; Grazzini, G.; Basosi, R. Using exergy to analyze the sustainability of an urban area. Ecol. Econ. 2004, 48, 231–244. [Google Scholar] [CrossRef]
  33. Xiamen Construction and Administration Bureau. The Development of Social Security Housing (2007–2010). Available online: http://www.xmzfbz.gov.cn/develop/fzgh2.htm (accessed on 20 December 2008).
  34. Li, D.; Wang, R.S. Hybrid Emergy-LCA (HEML) based metabolic evaluation of urban residential areas: The case of Beijing. Chin. Ecol. Complex. 2009, 6, 484–493. [Google Scholar] [CrossRef]
  35. Planning for Qianpu Residential Area. Available online: http://info.tgnet.cn/Detail/200801252005022573/ (accessed on 15 January 2009).
  36. Property Services Scheme for XMU Faculty. Available online: http://zchqc.xmu.edu.cn/show.asp?id=112 (accessed on 15 January 2009).
  37. Cui, S.H.; Niu, H.B.; Wang, W.; Zhang, G.Q.; Gao, L.J.; Lin, J.Y. Carbon footprint analysis of the Bus Rapid Transit (BRT) system: A case study of Xiamen City. Int. J. Sustain. Dev. World 2010, 17, 329–337. [Google Scholar] [CrossRef]
  38. Li, D.; Wang, R.S.; Zhou, C. Leap based comprehensive scenario analysis of Emergy evaluation on urban residential area. J. Grad. Sch. Chin. Acad. Sci. 2009, 26, 72–82. (In Chinese) [Google Scholar]
  39. Liu, T.X.; Hu, D. Environmental impact of residential building construction in Beijing: 1949–2003: Assessing the construction materials’ environmental impact by LCA. J. Grad. Sch. Chin. Acad. Sci. 2006, 23, 231–241. (In Chinese) [Google Scholar]
  40. Shen, F.F. Recycle of ferrous metal in scraped cars. Chin. Resour. Compr. Util. 2000, 8, 12–16. (In Chinese) [Google Scholar]
  41. Fang, H.F.; Huang, Y.H.; Wang, K. Research on recovery technology of non-metallic materials of ELV. Mater. Technol. Equip. 2007, 28, 45–49. (In Chinese) [Google Scholar]
  42. Xiamen Statistical Yearbook 2009. Available online: http://www.stats-xm.gov.cn/2009/ (accessed on 29 August 2009).
  43. Xiamen Municipal Prices Reports. Available online: http://www.xmwj.com/Market/schq_list.aspx?id=56&type=0 (accessed on 4 October 2009).
  44. Handbook of Xiamen Bus Line. Available online: http://xmgjt.com/gy.asp?id=45 (accessed on 12 April 2009).
  45. BRT: Reducing the Psychological Distance between Downtown and Suburban. Available online: http://www.jimei.gov.cn/myoffice/documentComm.do?docId=D21843 (accessed on 29 August 2009).
  46. Lu, K.A. Status quo and comprehensive utilization of refuse produced from construction and removal of buildings in China. Constr. Technol. 1999, 28, 44–45. (In Chinese) [Google Scholar]
  47. Gao, P.Q. Management and integrated treatment planning of municipal domestic waste in Xiamen City. Environ. Sanit. Eng. 2007, 15, 8–11. (In Chinese) [Google Scholar]
  48. Lecture information of Xiamen University. Available online: http://lecture.xmu.edu.cn/ (accessed on 29 August 2009).
  49. XMU Measures for the Implementation and Assessment of XMU Faculty Appointment. Available online: http://rsc.xmu.edu.cn/view_article.asp?id=132 (accessed on 29 August 2009).
  50. Meillaud, F.; Gay, J.B.; Brown, M.T. Evaluation of a building using the emergy method. Sol. Energy 2005, 79, 204–212. [Google Scholar] [CrossRef]
  51. Odum, H.T. Environmental Accounting: Emergy and Environmental Decision Making; John Wiley & Sons Inc.: New York, NY, USA, 1996; pp. 1–15. [Google Scholar]
  52. Huang, S.L.; Lee, C.; Chen, C.W. Socioeconomic metabolism in Taiwan: Emergy synthesis versus material flow analysis. Resour. Conserv. Recycl. 2006, 48, 166–196. [Google Scholar] [CrossRef]
  53. Pulselli, R.; Simoncini, E.; Ridolfi, R.; Bastianoni, S. Specific emergy of cement and concrete: An energy-based appraisal of building materials and their transport. Ecol. Indic. 2008, 8, 647–656. [Google Scholar] [CrossRef]
  54. Huang, S.L.; Lai, H.Y.; Lee, C.L. Energy hierarchy and urban landscape system. Landsc. Urban Plan. 2001, 53, 145–161. [Google Scholar] [CrossRef]
  55. Pulselli, R.M.; Simoncini, E.; Pulselli, F.M.; Bastianoni, S. Emergy analysis of building manufacturing, maintenance and use: Em-building indices to evaluate housing sustainability. Energy Build. 2007, 39, 620–628. [Google Scholar] [CrossRef]
  56. Huang, S.L.; Odum, H.T. Ecology and economy: Emergy synthesis and public policy in Taiwan. J. Environ. Manag. 1991, 32, 313–333. [Google Scholar] [CrossRef]
  57. Huang, S.L. Energy Basis for Urban Ecological Economic System; Chan’s Arch Books Co., Ltd.: Taipei, Taiwan, 2004; pp. 73–76. [Google Scholar]
  58. Odum, H.T. Self-organization, transformity, and information. Science 1988, 242, 1132–1139. [Google Scholar] [CrossRef] [PubMed]
  59. Odum, H.T.; Brown, M.T.; Brandt-Williams, S. Folio #1-introduction and global budget, handbook of emergy evaluation. In Center for Environmental Policy; University of Florida: Gainesville, FL, USA, 2000; p. 2. [Google Scholar]
  60. Arbault, D.; Rugani, B.; Barna, L.T.; Benetto, E. A semantic study of the emergy sustainability index in the hybrid lifecycle-emergy framework. Ecol. Indic. 2014, 43, 252–261. [Google Scholar] [CrossRef]
  61. Amponsah, N.Y.; Lacarrière, B.; Zghal, N.J.; Corre, O.L. Impact of building material recycle or reuse on selected emergy ratios. Resour. Conserv. Recycl. 2012, 67, 9–17. [Google Scholar] [CrossRef] [Green Version]
  62. Brown, M.T.; Buranakarn, V. Emergy indices and ratios for sustainable material cycles and recycle options. Resour. Conserv. Recycl. 2003, 38, 1–22. [Google Scholar] [CrossRef]
  63. Felix, E.; Tilley, D.R. Integrated energy, environmental and financial analysis of ethanol production from cellulosic switch grass. Energy 2009, 34, 410–436. [Google Scholar] [CrossRef]
  64. Moles, R.; Foley, W.; Morrissey, J.; O’Regan, B. Practical appraisal of sustainable development—Methodologies for sustainability measurement at settlement level. Environ. Impact. Asses. 2008, 28, 144–165. [Google Scholar] [CrossRef]
  65. Camagni, R.; Gibelli, M.C.; Rigamont, P. Urban mobility and urban form: The social and environmental costs of different patterns of urban expansion. Ecol. Econ. 2002, 40, 199–216. [Google Scholar] [CrossRef]
  66. Giradet, H. Creating Sustainable Cities; Devon Green Books: Totnes, UK, 1999; p. 11. [Google Scholar]
  67. Alberti, M.; Susskind, L. Managing urban sustainability: An introduction to the special issue. Environ. Impact Asses. Rev. 1996, 16, 213–221. [Google Scholar] [CrossRef]
  68. Meldon, J. Learning Sustainability by Doing; AnTaisce/URGE: Dublin, Ireland, 1998; pp. 63–77. [Google Scholar]
  69. Wu, Q.Y.; Ren, D.M. The transformation of metropolitan area structure and sustainable development since reform. Sci. Geogr. Sin. 1999, 19, 108–113. (In Chinese) [Google Scholar]
  70. Newell, J.P.; Cousins, J.J. The boundaries of urban metabolism. Prog. Hum. Geog. 2014. [Google Scholar] [CrossRef]
  71. Grimm, N.B.; Faeth, S.H.; Golubiewski, N.E.; Redman, C.L.; Wu, J.G.; Bai, X.; Briggs, J.M. Global change and the ecology of cities. Science 2008, 319, 756–760. [Google Scholar] [CrossRef] [PubMed]
  72. Gandy, M. Rethinking urban metabolism: Water, space and the modern city. City 2004, 8, 363–379. [Google Scholar] [CrossRef]
  73. Kowalski, M.F. Society’s metabolism. J. Ind. Ecol. 1998, 2, 61–78. [Google Scholar] [CrossRef]
  74. Cousins, J.J.; Newell, J.P. A political–industrial ecology of water supply infrastructure for Los Angeles. Geoforum 2015, 58, 38–50. [Google Scholar] [CrossRef]
Figure 1. System boundary of settlement metabolism.
Sustainability 08 00459 g001
Figure 2. (a) Street views of XMU settlement; (b) street views of Qianpu settlement.
Sustainability 08 00459 g002
Figure 3. (a) Urban form of XMU settlement; (b) urban form of Qianpu settlement.
Sustainability 08 00459 g003
Figure 4. Systems diagram for settlements.
Sustainability 08 00459 g004
Figure 5. (a) Comparison of emergy flux (sej); (b) comparison of emergy flows of material input by function (sej); and (c) comparison of emergy structure of fuels and electricity energy flow (sej) in XMU and Qianpu settlements.
Sustainability 08 00459 g005
Table 1. Questionnaire contents.
Information CategoriesContent of Survey
SocioeconomicHousehold size (No. of people), individual and household income, age, gender
BuildingBuilding No., housing area, monthly electricity, water, gas expenditure (CNY/month)
Appliances
 CookingElectric cookerRated power (kw)
Microwave ovenNumber, rated power (kw)
 LightingElectric lightsRated power (kw)
 Other appliancesAir conditioningNumber, type, average rated power (kw)
Electric/gas water heaterNumber, volume, rated power (kw)
Television Number, rated power (kw), size (inches)
RefrigeratorNumber, refrigeration volume (liters)
Washing machine Number, rated power (kw)
Computer Number
Transport
 Purpose and destinationWork, school, shopping, entertainment, others
 Travel modesPrivate car, taxi, Bus Rapid Transport (BRT), ordinary bus, work-unit commuting bus, electric bicycle, bicycle, walking
 Travel variablesTrips made daily or monthly, destination of each trip (list at least three), one-way trip time/distance from home
 If private car ownerVehicle displacement, daily vehicle miles or time traveled, fuel use per hkm, monthly vehicle fuel expenditure
Food
 Dining outMonthly expenditure
 Cooking at homeTotal monthly expenditure (CNY)
Expenditure on grains, vegetables, meat, fish, eggs, oil, fruit, wine, dairy products, desserts and cakes, cigarettes, tea (CNY/month)
Place of purchase
WasteDaily household waste (kg)
Table 2. Summary of the two settlements’ characteristics.
VariableXMUQianpu
Urban form
Geographic location on the islandSWNE
Road area (ha) 13.22 c0.63 a
Green area (ha) 26.79 d0.73 b
Gross floor area (ha) 322.94 e2.15 g
Site area (ha) 42.63 c0.50 c
Total area (ha) 512.64 f1.87 f
Building typeMultistory (1–7)Multistory and small high-rise
Structure of buildingsBrick-concreteShear wall (multistory) and frame (small high-rise)
Socioeconomic 6
Household income (yuan/month)69577250
Housing
Number of households2244 e250
Household size (number of persons) 63.353.74
Per household living area (m2) 685112
Per capita living area (m2) 625.329.9
Per capita public road area (m2) 615.319.1
Per capita gross floor area (m2) 621.523.0
Per capita green area (m2) 66.57.8
Floor area ratio (%) 72.11.5
Household Commuting 6
Car possession (%)27.840.7
Commuting mode (walking or electric bicycle %)33.54.4
Commuting mode (motor vehicle %)5.831.6
Commuting distance (average)1.512.0
Appliances 6
Number of air conditioning units2.03.2
Number of electric/gas water heater1.11.3
Number of televisions2.91.4
Television size (inches)28.029.7
Number of refrigerators21
Refrigerator volume (liters)150223.8
Number of washing machines1.01.1
1 Road area: roads in the settlement areas and public roads for residents’ transportation; 2 Green area: settlement areas of a linear greenspace or open urban space with plant life managed by settlement agencies for the purpose of passive or active human enjoyment; 3 Gross floor area: the total floor area inside the building envelope (including the external walls but excluding the roof); 4 Total area: foundation area, roads, and green areas; 5 Site area: the area of land on which the settlements are built; 6 Statistics from surveys; 7 Floor area ratio: the ratio of the gross floor area of buildings on a certain location to the size of the land of that location; a Scaled from Google Earth and using average per capita public road area data from Xiamen Special Economic Zone Yearbook 2009; b Calculated from the greening rate of Qianpu settlement [35], green rate is a ratio of green area/land area; c Calculated with data scaled from Google Earth; d Calculated from road area in settlements scaled from Google Earth and data from the property services scheme for XMU faculty [36]; e Data from property services scheme for XMU faculty [36]; f Calculated with base area scaled by Google Earth, road and green areas; g Data from Planning for Qianpu residential area [35].
Table 3. Sustainability indices of settlement metabolism.
Emergy IndicatorsExplanations QianpuXMU
I. Metabolic efficiency
(1) Emergy densityRatio of total emergy inputs to total area (sej/ha)Socioeconomic performance of the system3.68 × 10164.89 × 1016
(2) Ratio of input /outputRatio of emergy inputs to emergy outputsMetabolism efficiency 6.82 × 10−17.74 × 10−1
(3) Ratio of emergy productionRatio of system output to nonrenewable resources emergy input flowsHigher emergy outputs produced or lower nonrenewable resources used represents efficiency7.71 × 1003.89 × 100
II. Resilience and renewability
(1) Fraction of self-support Ratio of indigenous natural resources to total emergy inputs System self-supportive ability7.69 × 10−45.78 × 10⁻⁴
III. Natural resources reliance
(1) Percent fuels and electricity (% fuels and electricity)Ratio of fuels and electricity inputs to total emergy inputs Reliance to external non-renewable fuel and electricity inputs2.40 × 10−36.07 × 10⁻³
(2) Percent non-renewable (% Non-renewable)Ratio of nonrenewable emergy inputs to total emergy inputs Reliance to external non-renewable material inputs1.92 × 10−13.37 × 10³
IV. Waste and environmental burden
(1) Waste to renewable RatioRatio of waste emergy outputs to renewable natural resources emergy input System recycling ability and recycling pressure posed by waste output4.92 × 10−28.60 × 10⁻¹
(2) Percent waste (% waste)Ratio of waste emergy outputs to total emergy inputs System environmental pressure posed by waste output4.14 × 10−35.59 × 10⁻³
(3) Environmental load ratio (ELR)Ratio of nonrenewable resources emergy flows to local indigenous natural resources inputsEnvironmental stress due to nonrenewable production2.50 × 1025.84 × 102
V. Welfare
(1) Per capita emergy usePer capita emergy inputs (sej/person)Emergy welfare7.34 × 10175.79 × 1017
(2) Per capita material use Per capita material inputs (sej/person)Material welfare2.01 × 10171.95 × 1017
(3) Per capita fuels and electricity use Per capita fuels and electricity inputs (sej/person)Fuels and electricity welfare1.76 × 10153.52 × 1015
(4) Per capita construction usePer capita construction inputs(sej/person) Construction welfare 6.07 × 10157.18 × 1016
(5) Per capita infrastructure use Per capital transport infrastructure and fuel inputs (sej/person) Transport infrastructure welfare9.47 × 10142.95 × 1015
(6) Per capita service usePer capita service inputs (sej/person)Service emergy consumed by residents for the better livability3.28 × 10157.26 × 1014
(7) Services inputRatio of service input to total emergy inputs Reliance to labor power and other services input4.47 × 10−31.25 × 10⁻³

