Article

From Life Cycle Costing to Economic Life Cycle Assessment—Introducing an Economic Impact Pathway

Technische Universität Berlin, Chair of Sustainable Engineering, Office Z1, Str. des 17. Juni 135, 10623 Berlin, Germany
*
Author to whom correspondence should be addressed.
Sustainability 2016, 8(5), 428; https://doi.org/10.3390/su8050428
Submission received: 22 January 2016 / Revised: 19 April 2016 / Accepted: 22 April 2016 / Published: 29 April 2016
(This article belongs to the Section Economic and Business Aspects of Sustainability)

Abstract

:
Economic activities play a key role in human societies by providing goods and services through production, distribution, and exchange. At the same time, economic activities through common focus on short-term profitability may cause global crisis at all levels. The inclusion of three dimensions—environment, economy, and society—when measuring progress towards sustainable development has accordingly reached consensus. In this context, the Life cycle sustainability assessment (LCSA) framework has been developed for assessing the sustainability performance of products through Life cycle assessment (LCA), Life cycle costing (LCC), and Social life cycle assessment (SLCA). Yet, the focus of common economic assessments, by means of LCC, is still on financial costs. However, as economic activities may have a wide range of positive and negative consequences, it seems particularly important to extend the scope of economic assessments. Foremost, as the limitation to monetary values triggers inconsistent implementation practice. Further aspects like missing assessment targets, uncertainty, common goods, or even missing ownership remain unconsidered. Therefore, we propose economic life cycle assessment (EcLCA) for representing the economic pillar within the LCSA framework, following the requirements of ISO 14044, and introducing an economic impact pathway including midpoint and endpoint categories towards defined areas of protection (AoPs). We identify important target ratios by means of economic AoPs, which drive economic activities on the macro- and microeconomic level. Furthermore, we provide suggestions for midpoint and endpoint indicators representing the defined categories. With the presented EcLCA framework, a first step towards the inclusion of economic impacts within LCSA has been made. Relations between economic activities and resulting consequences are displayed, going beyond the cost-driven view of classical LCC. Further research and fine-tuning of the identified midpoint and endpoint categories and related indicators is, however, needed to enable a valid and consistent assessment basis for fostering the practical implementation of EcLCA and LCSA.

1. Introduction

Economic activities play a key role in human societies by providing goods and services through production, distribution and exchange. At the same time, economic activities have a decisive influence on the environmental system, as shown in the case of climate change [1]. A common focus on short-term profitability may cause global crisis at all levels within economic, environmental, and social systems [2]. Ehrenfeld [3] even states that “Economic development itself is undermining the very roots of sustainability”, as it may lead to unsustainability in environmental but also human terms. The Brundtland Commission [4] and later the Rio Summit [5] underlined that the sustainable development concept must go beyond economic or environmental considerations. Correspondingly, sustainable development is understood as a policy principle and central notion, which is openly defined as “development that meets the needs of the present generation without compromising the ability of future generations to meet their own needs” [4]. Sustainability in this context embodies the objective to achieve stable societies through consideration of environmental, economic, and social aspects [5].
Following on this, the inclusion of three dimensions—environment, economy, and society—have reached consensus, when measuring progress towards sustainable development [6,7,8]. In this context, the Life cycle sustainability assessment (LCSA) framework has been developed including all three sustainability dimensions through Life cycle assessment (LCA), Life cycle costing (LCC) and Social life cycle assessment (SLCA) [6,9]. The framework generally aims to assess the sustainability performance of products, processes, and services along their life cycle. However, the three methods involved do not have the same level of maturity, as especially the social and economic assessments face challenges in scientific robustness and practicality [10].
Addressing the economic pillar of LCSA, LCC embodies a method that is supposed to measure the economic sustainability on the corporate or product level. Nonetheless, until now it has been focused on financial costs expressed in monetary values [11,12,13], even though the economic system goes beyond monetary values. So far little progress has been achieved to improve economic assessment practice within the LCSA framework [14]. It seems particularly important to redefine LCC within the LCSA framework, as economic activities may have a wide range of positive and negative consequences. Those consequences may affect the other dimensions of sustainability that cannot be represented by means of monetary values only [15,16]. The required redefinition may, however, provide alternatives to conventional growth-oriented development targets [17] and shall include crucial aspects such as the stability of economic systems [18,19,20].
Correspondingly, within this study we propose Economic life cycle assessment (EcLCA) going beyond financial cost assessment to better represent the economic pillar of LCSA. We consider classical LCC as the basis for further developments, by which economic activities within LCSA can be more thoroughly addressed. The therefore needed methodological harmonization will be further addressed in Section 2.2 after providing an introduction on LCC’s general background in Section 2.1. The re-structuring process towards EcLCA will be subsequently presented in Section 3. In conclusion, we discuss our findings and address remaining challenges of the new EcLCA approach.

2. The Economic Pillar of Life Cycle Sustainability Assessment

As indicated in the previous section, LCC may not yet sufficiently represent the economic pillar of LCSA. Therefore, we initially survey the current status of LCC in Section 2.1. Subsequently in Section 2.2, we identify needs and suitable directions to better address economic aspects in the LCSA context.

2.1. Life Cycle Costing

For LCC a heterogeneous terminology is featured in literature and it is inter alia referred to as Life cycle costing, Whole-life costing, or Total cost of ownership [21]. Within this study we stick to LCC as an umbrella term for cost-oriented economic life-cycle based assessment methods to avoid confusion. LCC was first used in the mid-1960s by the United States Department of Defense. Twenty years later it was taken up by the construction industry to assess building investments (also including energy and disposal costs and considering an environmental context). LCC was originally developed to rank different investment options, but did for a long time not consider operating costs occurring during the product’s life time [14].
A first international standard addressing LCC was published in 2008 with ISO15686-5 [22], which defines LCC as “a technique which enables comparative cost assessments to be made over a specified period of time, taking into account all relevant economic factors both in term of initial costs and future operational costs” [22]. Through ISO, LCC allows for a comprehensive cost assessment throughout the life cycle, also including the operation and end-of-life phase. A similar structure has been followed within the so-called manual for LCC, the Environmental Life Cycle Costing book, published by Hunkeler et al. [11]. It includes producers, suppliers, consumers, and end of life (EoL) actors in the assessment, reflecting costs associated with a product’s life cycle. Those cost categories have already earlier been proposed by Grießhammer et al. [23], differentiating different actors and/or fields.
Hunkeler et al. [11] differentiate three types of LCC—conventional LCC, environmental LCC, and societal LCC. Conventional LCC sets the focus on (“real”) internal costs, which are associated with a product’s life cycle. Environmental LCC goes beyond that and also includes external costs, which are likely to be internalized in the decision-relevant future. In addition, within environmental LCC taxes and subsidies are considered and in parallel non-monetized LCA results can be included. Societal LCC goes even further by regarding all costs covered by anyone in the society, whether today or in the long-term, through the inclusion of preferably all external costs in a monetarized form [11]. Here, according to Hunkeler et al. [11], cost-benefit-analysis (CBA) may help to define how a social cost perspective can be taken into account. In this context, the external cost discussion has also gained momentum for several reasons: the risk of double-counting, the unclear system boundary definition, and the unresolved internalization approach, which has already been mentioned by Rebitzer and Hunkeler [24]. To avoid double-counting with the other two dimensions, addressed by LCA and SLCA, within LCSA it is normally referred to environmental LCC, only including external costs that are likely to be internalized.
No impact level has yet been considered in current LCC assessment practice, even though Hunkeler et al. [11] named first impact categories—namely “economic prosperity” and “economic resilience”—also mentioning GDP/GNP changes and value-added (VA). Nonetheless, some studies tried to implement a broader economic perspective. To name just a few: May & Brennan [25] include VA as an economic indicator and relate it to wealth generation; Kruse et al. [26] and Thomassen et al. [27] consider VA as an (additive) economic indicator; Heijungs et al. [28] calculate the VA for all processes along a product’s life cycle. Jeswani et al. [29] state that LCC allows for hotspot identification by considering VA. Wood and Hertwich [30] go even further and connect VA to GDP by using economic modeling (input output (I/O) analysis) approaches. They also extend the classical LCC framework by drawing a connection between costs on the microeconomic level and effects at the macroeconomic level.
Despite these first approaches to broaden LCC (also often in relation with LCSA), consensus has not yet been achieved on whether and how to re-structure LCC. A controversial point is whether LCC should remain limited to the cost level especially in the context of sustainability (and LCSA). Although Swarr et al. [13] stated that there is no need for characterization in LCC (as performed in LCA according to ISO 14044 [31]), as costs would already comprise a unit of measure; further studies address the need for broadening the scope going beyond pure cost assessment. Earlier, Curran et al. [32] criticized classical LCC for ignoring causalities and Gluch & Baumann [14] mentioned that it oversimplifies the economic dimension. First, because such an oversimplification states that everything is expressible in monetary figures, and second, because decisive factors such as uncertainty, common goods, or even missing ownership (e.g., parts of the natural environment) remain unconsidered [14].
Implementation challenges for LCC emerge due to inconsistent approaches and unreliable data in connection with conceptual confusions and missing consensus [14,23,30]. Such inconsistencies are partly fostered by the limitation to monetary values and missing target functions, which in life cycle based assessments are normally described as areas of protection (AoPs) [10,14]. Especially within industry [15,21,30,33], LCC is still perceived as infrequently implemented due to methodological confusion and the variety of defined but very similar concepts, like “total cost accounting” or “full cost accounting” [14]. Limitations to short-term considerations additionally fuel the doubts [21,34].
Strikingly, Heijungs et al. [28] raised the question: “What do we in fact want to learn from LCC?” Clearly, the goal of LCC cannot only be summing up of life cycle costs [14], which may also lead to double-counting if not done with caution [28], as normally different perspectives (e.g., producer or consumer) can be covered—compare Hunkeler et al. [11]. Heijungs et al. [28] conclude that especially in the context of sustainability the limitation to costs would be comparable to “(…) narrowing the environmental analysis to waste.” They add that further aspects, like VA, growth, trade balance, etc., may be of interest.
Thus, in its current form LCC may lead to misinterpretation as a relation to the production location is needed to put costs in correct context [23]. Therefore, Jørgensen et al. [35] and Rebitzer and Hunkeler [24] suggest to use LCC only in the context of LCSA and to focus on the monetary gains and losses for the poor. Reap et al. [36] find LCC helpful to identify trade-offs. In this regard, LCC may also allow for hotspot identification, which may be valuable for the decision-making process [29].

2.2. Economic Aspects within the Life Cycle Sustainability Assessment Framework

Following on the findings in Section 2.1, the LCSA community faces the question of whether or not to include LCC in the LCSA framework. Klöpffer and Ciroth [12], in their answer to an editorial letter, clearly pointed out that LCC, referred to as “classical” environmental LCC limited to financial costs, must be part of LCSA, as economic aspects have ever played and will always play a crucial role within sustainable development. We share that view to include economic aspects in the LSCA framework, but argue that a revisited form of LCC is needed to more adequately display the economic dimension of sustainability for complementing the social and environmental considerations of SLCA and LCA.
With regard to LCSA, additional methodological inconsistencies need to be addressed. The missing impact levels become crucial as all related methods of LCSA reportedly state to follow the structure of ISO 14044 [11,13,31,37]. Even though impact assessment is not mandatory according to ISO 14044 [31], except for studies, which are intended to be used in comparative assertions, it is generally envisaged.
Regarding the requirements of the impact assessment phase, ISO 14044 [31] is quite explicit. The impact assessment phase shall include impact categories, category indicators, and characterization models. Furthermore, the impact (characterization) models shall follow environmental (social or economic) mechanisms. These mechanisms relate the inventory results (e.g., costs) with impact categories (usually described as midpoint impact categories) and category endpoints (usually described as endpoint impact categories). The consideration of impacts seems reasonable as impact indicators, in contrast to inventory indicators, display the relative importance of emissions, circumstances, or consequences resulting from certain actions at a given stage of an impact pathway [38].
For adapting the economic pillar of LCSA, economic mechanisms (often referred to as impact pathways, see Jolliet et al. [39] and Jørgensen et al. [40]) shall be followed, as costs alone (as considered within classical LCC) do not represent a causal chain, as required in an impact assessment. Therefore, we propose linking products specifics to microeconomic categories and, in the following step of the impact pathway, to macroeconomic “damages”.
Thus, enhancements shall in the first instance focus on: (i) identifying relevant economic topics for broadening the scope within LCSA’s economic pillar (also considering the ones suggested in former studies, see Section 2.1); (ii) defining relevant economic target functions (by means of AoPs); (iii) defining relevant impact categories and interlinking them within an economic pathway. Interesting considerations in this context may be the contradiction between minimization of costs and maximization of value added, as it has been pointed out by Wood and Hertwich [30], Boons et al. [2], and Zamagni et al. [41]. Furthermore, Settanni et al. [21] propose to put the customer point of view more into focus by defining products as value deliverables. Wood and Hertwich [30] additionally differentiate between short-term economic cost and long-term economic sustainability by identifying aspects like investments, labor productivity, and geographical specifications as influencing factors for economic strength. The aspect of human resources may also play an important role in contradicting the pure profit view. Some authors [42,43] state that growth, mostly measured in terms of GDP, cannot be the only goal or factor within economic assessments.

3. Introducing Economic Life Cycle Assessment

Following on the findings of the previous sections, we propose EcLCA for representing the economic pillar of LCSA. Therefore, we will consider aspects named by former studies, like VA or productivity, but also economic impacts defined earlier, like “economic prosperity” or “economic resilience.” Considering I/O approaches like those presented by Wood and Hertwich [30] and Settanni et al. [21], we include aspects on the microeconomic as well as macroeconomic level. We, however, follow a different approach, as e.g. Wood and Hertwich [30] assumed causal relations between technological improvements and value-added but at the same time neglected changes in supply and demand, which seems unrealistic unless a monopoly power exists. In addition, they limited their investigation mainly to value-added but did not include further aspects like long-term investments or customers’ perspectives. Furthermore, no comprehensive study has been performed to prove that I/O analysis can indeed solve the economic challenges of LCSA. I/O analysis is more a top-down than a bottom-up method, considering effects on the macro level rather than considering product-related issues. Therefore, the general usefulness of I/O with regard to LCSA and EcLCA may be questioned. From a microeconomic life cycle perspective, it appears to be more logical to start from the process level. This study therefore conceptually proposes the implementation of impact pathways relating microeconomic activities to macroeconomic consequences and economic targets (by means of economic AoPs), but starting from a bottom-up perspective and broadening the field through the inclusion of further perspectives, e.g., customers.

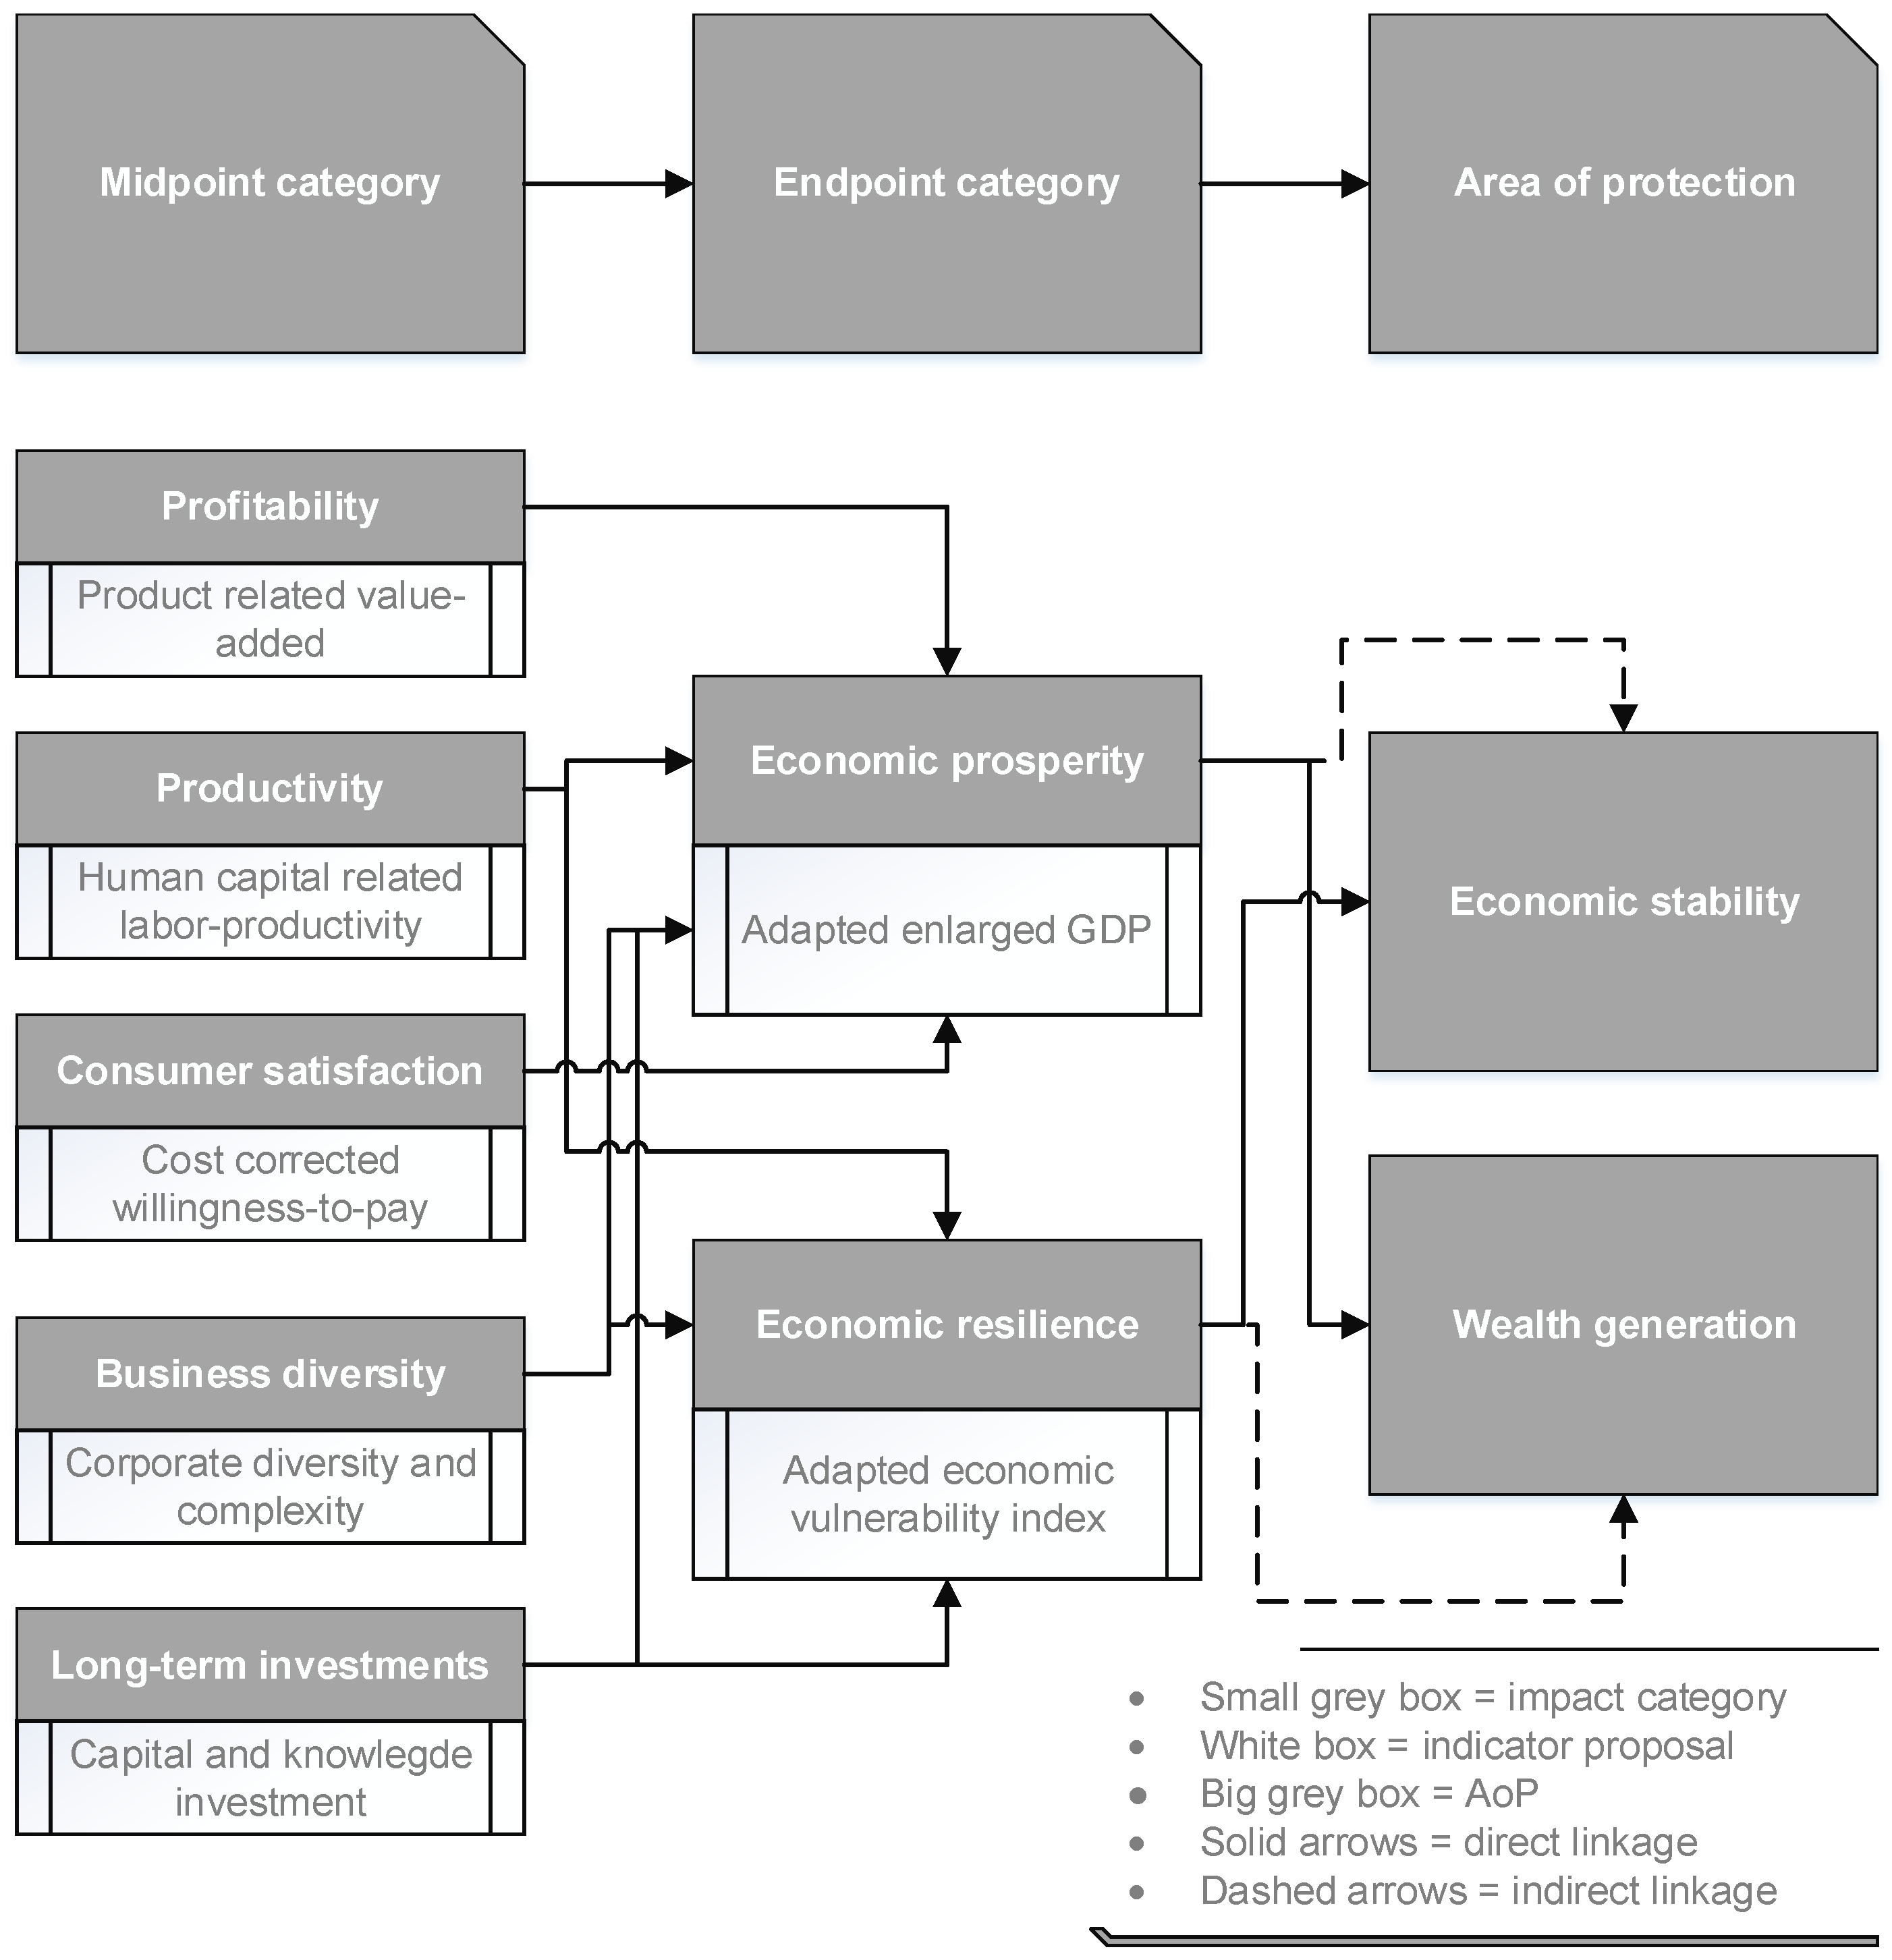
3.1. Impact Pathway Definition

When describing economic activities, the classification into micro- and macroeconomic aspects is broadly supported within economic research [42,44,45,46]. Generally, microeconomic actions (striving to improve market efficiency) to a certain extent determine the macroeconomic performance, which leads to an increased or decreased economic stability and wealth [46,47,48,49,50]. Consequently, one of the core questions is: How do microeconomic activities and macroeconomic effects influence each other and how can those effects be measured? Within this study, we try to answer this question on a conceptual level through the identification of relevant micro- and macroeconomic aspects and their interrelation. Therefore, we propose a consideration of microeconomic effects on the midpoint level and macroeconomic effects at the endpoint level of the new EcLCA approach.
Indeed, the influences of small components like product systems on the functionality of an economic system are hard to grasp [30]. Nevertheless, micro- and macroeconomic studies, which will be presented in the subsequent sections, determine crucial factors connecting the corporate or organizational level with economy-wide effects. On this basis, we develop an impact pathway to better represent the economic dimension within LCSA.
Impact pathways, coming from the understanding in LCA according to ISO 14044 [31], normally connect single aspects with impact and damage levels resulting from those aspects [39]. Transferring this logic to the EcLCA framework, detached economic aspects like costs shall be connected to resulting impact and damage categories (see Figure 1). The linkage between an economic midpoint impact and endpoint damage level can succeed by considering the micro- as well as the macroeconomic level. The defined midpoint categories therefore describe important aspects for microeconomic market efficiency. The endpoint (or damage) categories aim at the determination of impacts on the macroeconomic level, which are interlinked with the defined midpoint categories. Additionally, two economic areas of protection have been defined, describing target values by which economic activities are assessed.
With the presented pathway, we focus on the economic dimension representing midpoint and endpoint categories towards two new economic areas of protection. Firstly, we introduce the macroeconomic level with the AoPs and endpoint categories. Afterwards, we draw the connection to the microeconomic level by presenting the midpoint categories. We will then give concrete proposals for midpoint indicators representing the defined impact categories to enable a process-specific bottom-up assessment.
In a nutshell: Economic stability and Wealth generation seem to be essential targets for today’s economic systems, as those are named as important by many studies [18,19,30,51,52,53]. They seem therefore suitable to be defined as economic areas of protection (for detailed definitions, see Section 3.2).
Two crucial aspects affecting the two areas of protection seem to be: Economic prosperity and Economic resilience. The latter describes the shock resistance and long-term functionality of an economic system, which influences its stability [42,45,49], whereas the former orientates more on the classical economic growth paradigm generating a macroeconomic value added, which affects wealth and prosperity [32,43,54]. Of course the list of possible and suitable endpoint categories is not necessarily limited to the two presented here. For instance, the growth paradigm itself has been questioned several times with the argument of finite resources and unsustainable consumption patterns [20,55,56,57]. Therefore, additional endpoint categories and/or AoPs may become meaningful in future considerations. However, some aspects of the growth criticism can already be covered under Economic resilience. Furthermore, by considering EcLCA within the LCSA framework the assessments within the social and environmental dimension provide limitations to the growth orientation of Economic prosperity and Wealth generation. Therefore, we stick to two endpoint categories for now (for detailed definitions, see Section 3.3).
These two endpoint categories may be determined by several midpoint categories describing microeconomic activities and targets. Within this study we have identified as relevant: Profitability, understood as microeconomic value added [21]; Productivity, understood as output in connection with employee participation and human development [58]; Consumer satisfaction, representing a product’s utility from a consumer perspective [59]; Business diversity, understood as region-specific corporate diversity [49]; and Long-term investments, determining the long-run success and survival in the market [43] and including dependencies on different types of capital [60]. Microeconomic aspects like profitability, productivity, consumer satisfaction, and long-term investments have earlier been addressed within the Oxfam Poverty Footprint [61]. Thus, the defined midpoint categories seem not only relevant for developed economies, but also for the developing world (for detailed definitions, see Section 3.4).

3.2. Areas of Protection within EcLCA

Classically, an area of protection (AoP) describes something that needs to be protected or may function as a target for a certain area [62,63]. AoPs within LCSA and/or its three related methods are therefore hardly independent or detached, e.g., the AoP Human health was originally allocated to LCA, but meanwhile is often seen as an AoP for SLCA. This confusion may be obvious, as the three sustainability dimensions are not detached but interlinked. Actions in one dimension are likely to have benefits or drawbacks in another. In particular, the economic dimension is embraced by the social and environmental one, as economy can be seen as a subset of society, which itself is located in the environmental system [15,64]. An economic AoP can thus describe the economic dimension at its core but also its borders to the other two dimensions. A similar procedure has already been followed in LCA, where the three classical AoPs describe the environmental dimension itself (ecosystem quality), the borderline to the economic dimension (resources) and the overlaps with the social dimension (human health) [65]. Within this study, we limit the number of AoPs considered to two representing the economic dimension. We are, however, stress that additional AoPs may be possible.
We define Economic stability as the first AoP, which aims at a self-sustaining economic system over time (describing the core of the economic dimension). As a second AoP we include Wealth generation addressing the general target of economic activities: optimizing utility for society towards increased wealth (describing an AoP at the borderline to the social dimension).

3.2.1. Economic Stability

The European Commission [18] defines Economic stability as an overarching target that aims at avoiding economic (financial) crisis and promotes growth and employment. From this understanding, within Economic stability economic growth and prosperity are linked. Although economic growth still plays a key role, it is complemented by debt limitations and determining aspects of economic resilience, like shock resistance and long-term considerations. Debt limitations, according to Briguglio et al. [45] and Kollmorgen et al. [66], may contribute to the stabilization of economic systems, as inflation and deflation resulting from political shocks may be avoided. In addition, aspects of economic resilience can help to broaden the growth orientation. Within the “Washington consensus” sustainable growth has been mentioned in the context of Economic stability [66].
Going beyond this definition, Economic stability is also often connected to economic (industrial) diversity [47,67] and investment ratios [44]. Consequently, Economic stability is both a national and a multilateral concern, as due to progressive globalization interconnections between countries increase and vulnerabilities easily spread across sectors and borders [19]. Multilateral concerns seem to play a crucial role in avoiding asymmetric shocks, as they determine the balance and/or compensation between economic but also social systems.
Summarizing, under Economic stability relevant aspects towards functioning economic systems are covered including (sustainable) growth, aspects of economic resilience, long-term considerations, etc. Thus, Economic stability functions well as an umbrella term for representing the economic dimension.

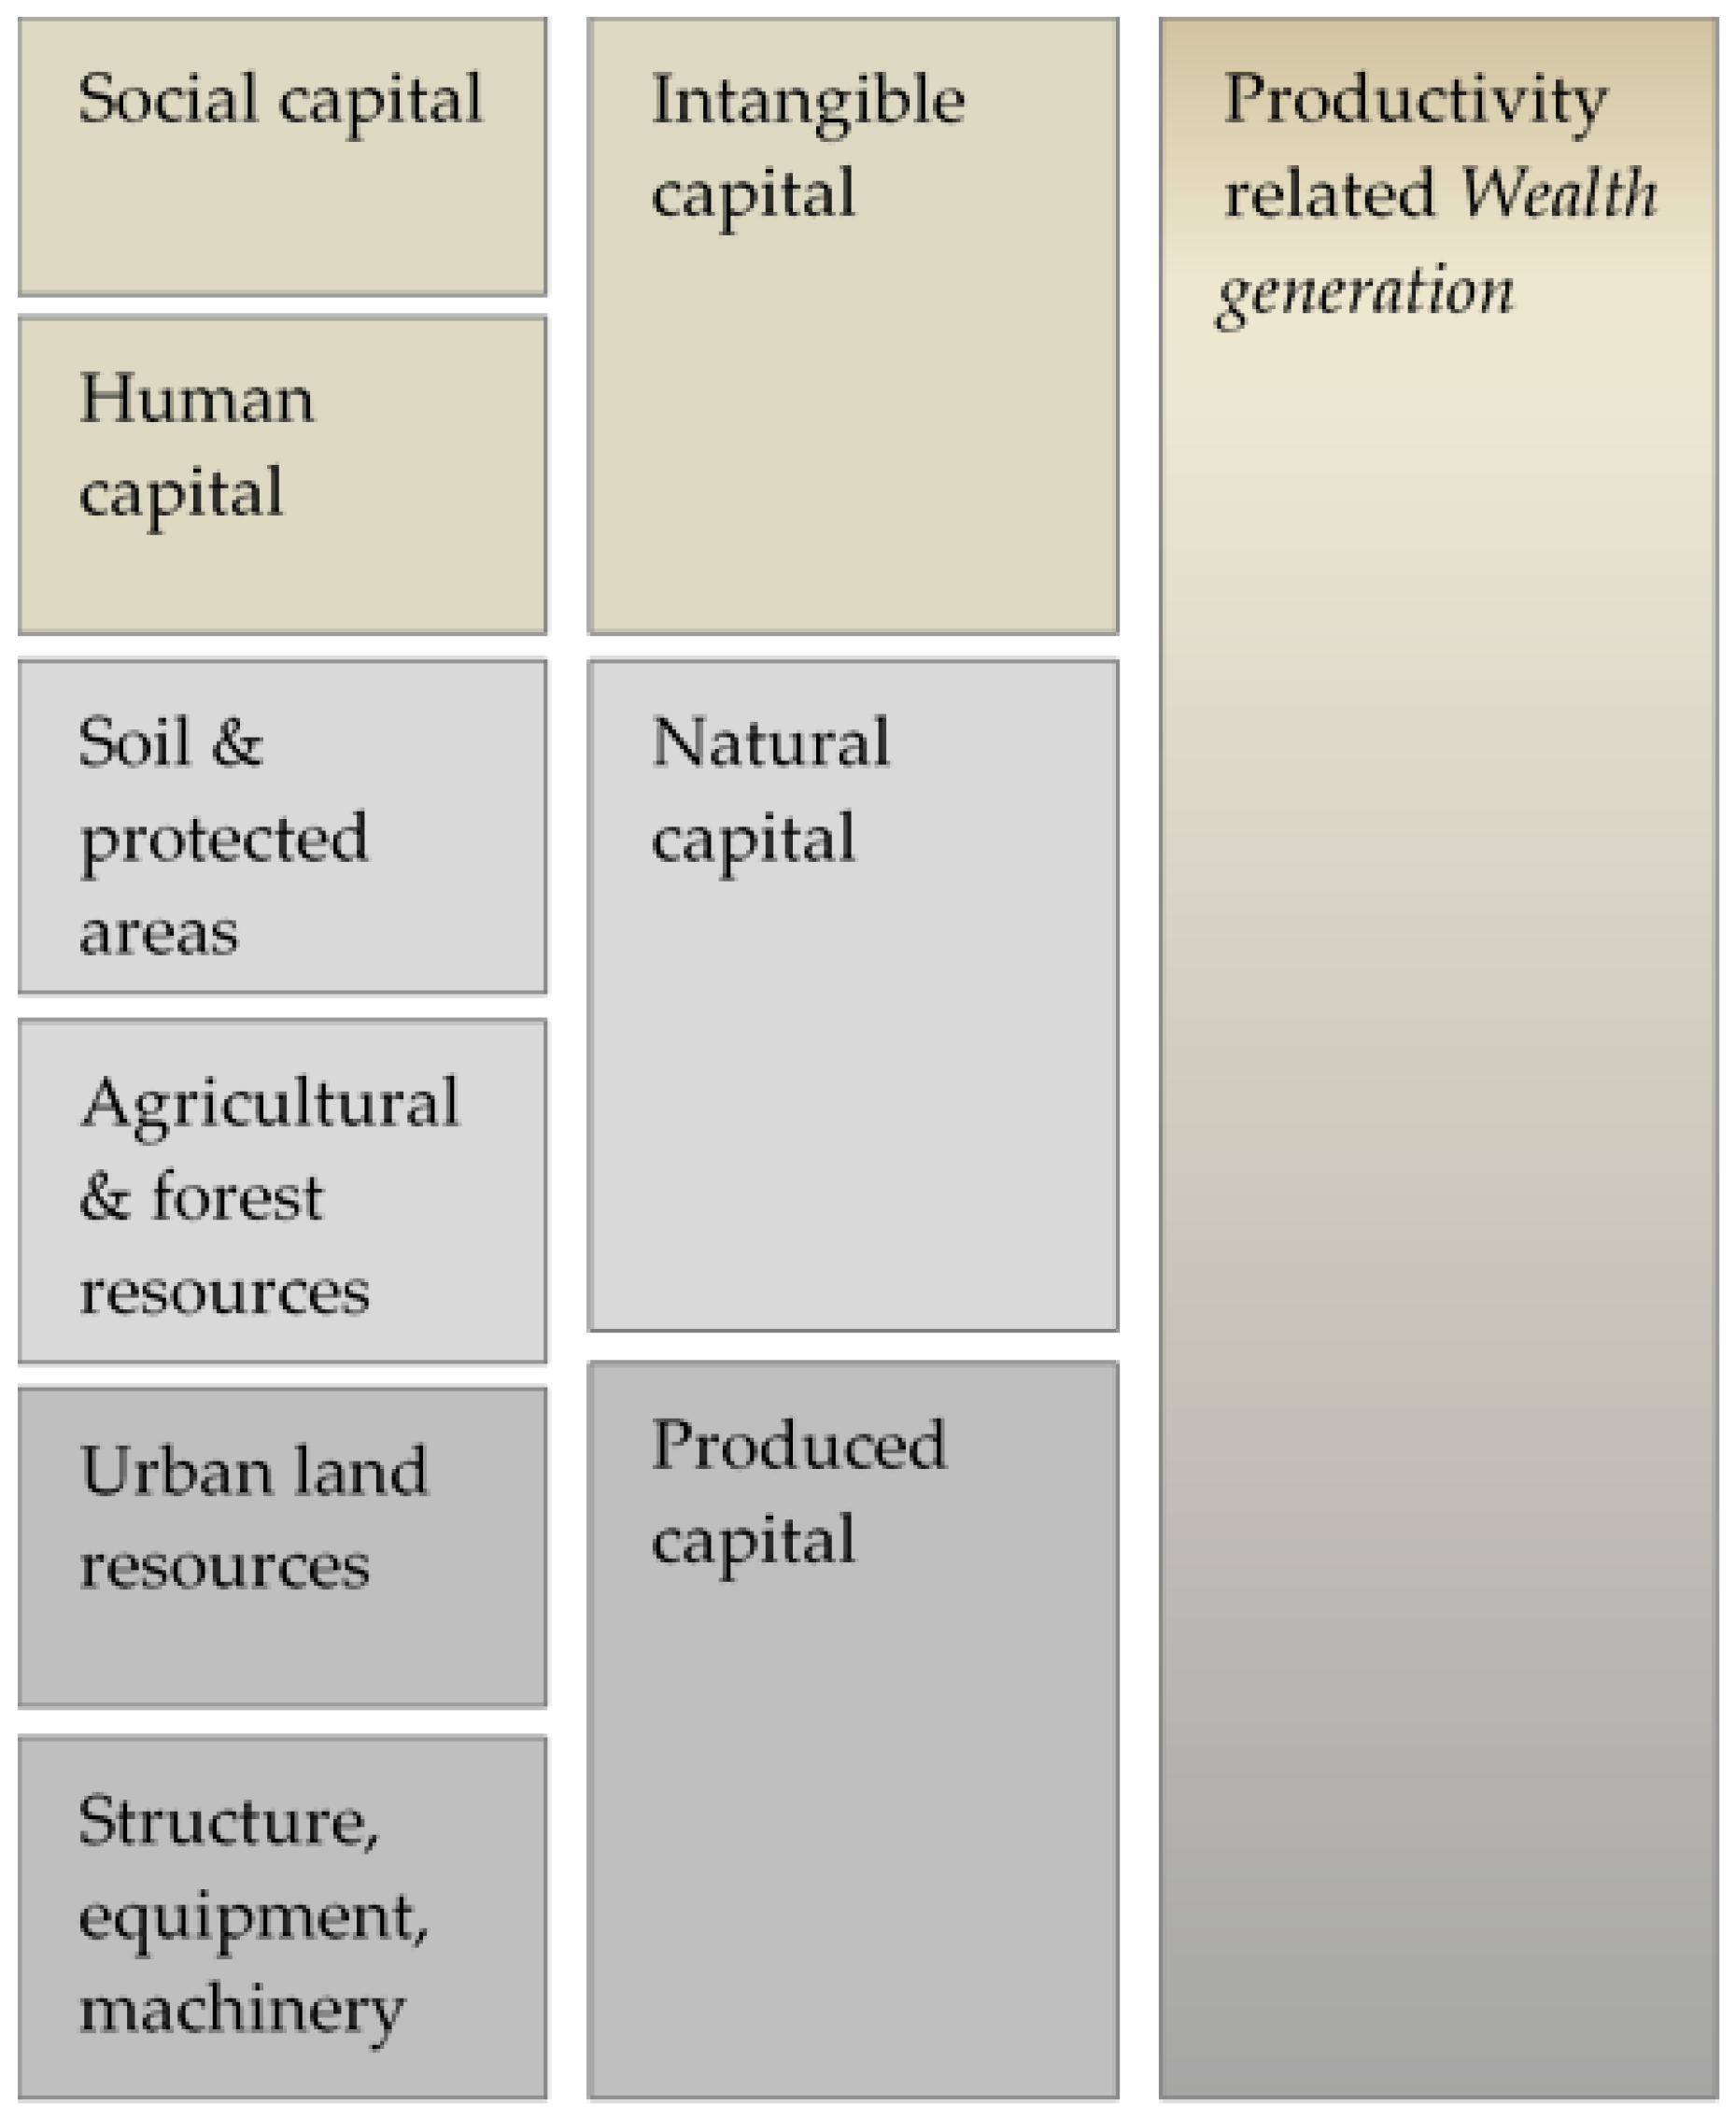
3.2.2. Wealth Generation

The main mechanism behind economic systems is to achieve and optimize utility for societies and their members [68] in order to generate wealth [53,64]. However, with the conversion towards profit maximization economies created both benefits and drawbacks for society. This is linked to the fact that, unlike economic growth, which is theoretically infinite, the generation of utility (and thus satisfaction) has its limitations [69,70]. This becomes evident if we consider the debate on happiness or subjective wellbeing measures as a proxy for utility. Income growth is accompanied by an increase in subjective wellbeing, but only until a certain point. From then on, income grows further while wellbeing stagnates [71,72,73].
By linking wealth generation with utility it may, according to Jonkman et al. [59], also connect to quality of life, which can be determined by income per capita and life expectancy. Some authors [51,54,60] criticize the common GDP-oriented view and include not just current but also future generations in the consideration by voting for equal capital distribution. Blok et al. [54] define important aspects of distributed wealth, such as supply security and industry competition. Vulnerability, flexibility, and innovation also play crucial roles in this consideration [45]. Anand and Sen [51] explicitly stress that wealth maximization is worthless without considerations of distribution (more explicitly, distributional equity). Spash [74] also calls for action “to address gender inequity, and inequity between, within and across social groups, time periods and spatial dimensions”, in his discussion on self-conception and perception in the field of ecological economics. With his discussion on the interplay between human needs and human capabilities, Sen [75] goes even further, as he demands the inclusion of (human) freedoms into the sustainability discussion. Those freedoms may play an important role in the formation of values including consumption behaviors and thus may also influence wealth.
Thus, aspects normally assigned to the generation of wealth are not only relevant from an economic perspective, but also from a social one. Accordingly, Wealth generation as an AoP goes beyond a purely economic perspective and shall contain complementation and broadening of economic activities, but also linkage between the economic and social dimension. It considers not only the pure maximization of material prosperity (e.g., by considering income per capita), but also the distribution and distributional equity within the economic system (e.g., by industry competition and social equity). Life expectancy and consumer’s value may additionally function as a proxy of a nation’s or economy’s wealth.
When using Wealth generation as an additional AoP for EcLCA within the LCSA framework, a distinction is needed between the related economic and social considerations, as e.g., gender equity or subjective wellbeing are normally part of SLCA. However, there is no contradiction in defining AoPs, which are relevant for more than one sustainability dimension. Similar accounts e.g., for Human health, which is likely to be influenced by social, environmental as well as economic impacts [26,76,77,78]. Yet, focusing on EcLCA, we limit the assignment of impact categories to economic considerations. We do not say that the social links are irrelevant, but shall rather be considered within the social dimension of LCSA to ensure consistency and avoid double-counting.

3.3. Definition of Endpoint Categories in EcLCA

Endpoint categories within LCSA typically define damage levels (e.g., damage to Human health, or Ecosystems), which positively or negatively influence the defined AoP(s) [65]. Accordingly, endpoint impact indicators can be seen as measurement endpoints to determine the level of damage. Thus in economic terms, potential benefits and damages for the defined AoPs (Section 3.2) could be described as endpoint categories for EcLCA. Economic endpoint categories shall additionally provide some linkage to the macroeconomic level and display broader economic consequences arising from a product’s life cycle (compare Section 3.1). The potential benefits or damages at the endpoint level may be influenced by microeconomic actions defined as midpoint impacts. Following the research results presented in Section 3.1 economic performance and prosperity as well as resilience seem to play a crucial role with regard to the two defined AoPs of Section 3.2. In this section, we therefore introduce two potential endpoint categories for EcLCA addressing the issues of Economic prosperity and Economic resilience.

3.3.1. Economic Prosperity

Economically, the prosperity of a country or region is normally determined by capital stocks, consisting of labor, (intangible) capital, and (natural) resources, which contribute to the progress of material prosperity [51,60]. Economic activities are usually determined by those capital stocks, which create materials and information for human use [69]. Broader definitions also include innovation and a highly skilled workforce as well as genuine and net savings and equitable distribution [60,79]. Although, the relation between prosperity and net savings is not apparent for high income countries, it is of importance for developing countries. Net savings or adjusted genuine savings furthermore provide indications for a change in welfare [68].
Due to human use, those capital stocks and savings may not be left intact, causing damage to human welfare (or wealth) through degradation of natural and societal systems. As those economic activities typically orientate on the growth paradigm, declines in GDP could be reflected as damages to economic performance and prosperity.
Within classical LCC, Economic prosperity has already been mentioned as an economic impact by Hunkeler et al. [11], Cinelli et al. [80], and—indirectly—by Weidema [81], who added the welfare term to economic assessments. Connections have been established for capital and resource productivity, material wellbeing, and GDP/GNP.
Following on this, we understand Economic prosperity as a key aspect of economic activities, expressing benefits and damages resulting from those activities. We therefore define Economic prosperity as a new economic endpoint category for EcLCA. The defined category is threefold and depends on growth, adjusted net savings, and equitable distribution. With its broadened view on material prosperity, it links with the AoP Wealth generation through achieved social prosperity levels resulting from equitable or inequitable distribution, but may also contribute positively or negatively to Economic stability through the inherent growth orientation.
As for indicator measures, GDP shows potential but has shortcomings as it presupposes constant consumption growth [15,30]. Furthermore, current GDP measures do not consider equity and distribution [15]. Complementary indicators have been provided with the Genuine Progress indicator (GPI) [82,83,84] or the enlarged GDP introduced by the European Commission [85], addressing the aspect of prosperity and thus complementing the growth-orientated view. The GPI and/or the enlarged GDP may therefore serve as first economic indicators at the endpoint level until tailored life cycle based indicators have been established. They do provide a first indication of economies’ state at the macroeconomic level and may as well be attributable to the product level.

3.3.2. Economic Resilience

The ability to react to or even prevent drastic changes without major drawbacks for the overall economic stability is usually described by the term economic resilience [49]. Economic resilience has generally been described by three aspects: shock resistance or adaptability, long-term considerations or lock-in, and state of equilibrium [42,49]. The level of international trade influences and in the worst case increases country’s vulnerability but at the same time determines a country’s success in international markets [45]. Thus, to achieve economic resilience a good balance of international trade needs to be found. Along with this balance, market flexibility and diversity embody two important factors of economic resilience [45,49].
Hunkeler et al. [11] already mentioned Economic resilience as an impact for classical LCC and named changes in the gross national product (GNP) as an influencing factor. However, they did not identify further influencing factors besides GNP, such as economic diversity or import dependencies. Wood and Hertwich [30] and Simmie and Martin [49] referred to long-term economic sustainability and mentioned important factors normally covered under the term economic resilience, such as human resources, knowledge, and natural capital.
We propose Economic resilience as a second endpoint category for EcLCA, following up on the suggestions from the studies mentioned. Economic resilience describes the benefits on the macroeconomic level for long-term development resulting from the avoidance of shocks, diversity, flexibility, and the avoidance of lock-in. Following the definitions above, changes within the category Economic resilience positively or negatively affect Economic stability but may also influence Wealth generation.
Briguglio et al. [45] propose an “economic resilience index” that accounts for the abovementioned influencing factors. They name as crucial market efficiency, good governance, and social development, which are determined through inflation and unemployment rates and debt-to-GDP ratios affecting (macro-)economic stability. Another “Resilience Index” has been developed by FM Global [86], which may also serve as a first indication of region-specific or country-specific economic resilience. The “economic vulnerability index” (EVI), which was proposed by the United Nations [87], additionally includes export instability and concentration to determine macroeconomic resilience. Those indices may serve as first indicators for the endpoint category of Economic resilience as long as no life cycle and product-based endpoint indicators have been developed. In particular, the EVI seems promising as the single components, like location or specialization, are well defined and may therefore be more easily translatable to the product level.

3.4. Definition of Midpoint Categories in EcLCA

Midpoint categories typically describe an intermediate state at a defined impact pathway between the inventory result (e.g., costs) and the damage level (normally defined as endpoint categories) [39]. Midpoint impact indicators can be seen as parameters in the environmental/social/economic mechanism network influencing the level of benefit or damage within the endpoint categories [76]. Translating this scheme to EcLCA, following the logic of the presented pathway (see Section 3.1), midpoint categories shall cover the transition from the micro- to the macroeconomic level. Therefore, economic midpoint categories shall reflect aspects of the microeconomic level that result from industry’s and firm’s activities and affect the (defined) damage categories (see Section 3.3) and its coherent market efficiency. Targeting extension of the classical LCC focus, the defined midpoint categories shall broaden the cost reduction oriented view. Therefore, besides Profitability, this study includes further impact categories such as: Productivity, Consumer satisfaction, Business diversity, and Long-term investment.

3.4.1. Profitability

Most firms and organizations still have a strong focus on profit margins, which is mainly substantiated by current market situations and growth-driven economic systems. Two terms are broadly used when assessing products and services: profitability and/or value-added. Those product values are usually described as a mix of value creation, revenue, costs, and benefits [2,88].
Considering classical LCC, the value term has already been taken up by several authors. Heijungs et al. [28] introduced the supply chain related value-added (VA). They therefore proposed a vector-based calculation in order to align LCA calculations with calculations in classical LCC. Hunkeler et al. [11] also mentioned VA in the context of classical LCC. Kruse et al. [26] defined VA as a socioeconomic indicator. Although VA has already been identified as relevant for classical LCC, none of the studies provided concrete suggestions on how to measure it, nor did they differentiate between inventory, impact, or damage levels.
With the introduced EcLCA, according to the presented impact pathway in Section 3.1, we now allocate VA to the midpoint level, as it describes an important part of firms’ efforts to succeed in microeconomic markets. Addressing the profit focus, which doubtless is an important aspect of microeconomic activities, we define Profitability as a new midpoint category. It covers the VA concept for ensuring business success and delivery of product values.
When going beyond the theoretical definition of Profitability as a midpoint category, the definition of specific indicators contains further challenges. The perception of product values seems important to properly define an understanding of added value. Commonly, different value concepts are distinguished depending on the point of view and target group. Broadly, there is a differentiation between value-in-use and value-in-exchange. Value-in-exchange describes value from a neoclassical point of view and expresses the purchasing power measured through monetary values, e.g., prices. Value-in-use generally describes customer’s utility during use and thus the relation between the consumer and the object consumed. Often, products with a high value-in-use, e.g., water, may have a low value-in-exchange. A similar dynamic applies for value-in-exchange, e.g., diamonds may have a high value-in-exchange, but a rather low value-in-use [89]. This simplification may, however, not generally hold true, e.g., houses may at the same time contain a high value-in-use (especially for homeless people) and -exchange (especially for investors). Thus, those two types of value are mutually dependent on each other, as there can hardly be value without exchange and there can be no value without utility [50,90].
Nonetheless, the differentiation between both value concepts enables a logical allocation of aspects to the identified midpoint categories and indicators. Following the definitions of Aspromourgos [89], value-in-exchange is in line with the value-added concept and is therefore allocated to the defined midpoint category Profitability. Aspects relating to the value-in-use instead address aspects of customer and business relations, as well as services and reputation, and are therefore allocated to the later introduced midpoint category Customer satisfaction.
Subsuming, a midpoint indicator representing the category Profitability shall include the value-added (or value-in-exchange) concept, by including costs, benefits, and revenues. Thus, the VA indicator considers the difference between value sold and inputs purchased for products production, as described in Equation (1) (following the definitions of Azapagic & Perdan [91] and May & Brennan [25]):
V A ( p ) =   l = 1 L c = 1 C { S c . l   [ O c , l + M c , l ] } ,
where L, C ∊ ℕ and VA(p) equals the VA of product p; Sc,l represents total income; Oc,l represents total operating costs; and Mc,l represents total material costs needed by company c in life cycle stage l for producing product p.
A product’s VA is consequently dependent on income through purchase (S) minus operating (O) and material (M) costs. Labor costs are therefore included in the total sum of operational costs (and thus the VA calculation), as there can be no added value without labor, which generates income. Capital costs are excluded here, as they are accounted for within the impact category Long-term investments. The overall added value is the total sum of the subsystem’s VA involved in the product’s life cycle within the system boundary. Thus, the sum of all product-related VAs shall represent the VA of the respective organization.
The relation to the endpoint (damage) level can be drawn through the sum of all (gross) VAs within a defined economic system. Assumedly, these gross VAs of all sources shall equal the GDP of the respective economy [25,91]. Thus, Profitability partly determines the defined category Economic prosperity at the endpoint level, affecting both defined AoPs. Whereas Profitability’s influence on Wealth generation may overridingly positive, it may cause negative impacts for Economic stability if the focus on profits is too strong and limits in resources are neglected.

3.4.2. Productivity

“Productivity is commonly defined as a ratio of a volume measure of output to a volume measure of input use” [46]. While there is consensus on this general understanding of the term, the measurement and definition of productivity differ broadly depending on the type of application and point of view. Productivity measures can be used to track technological improvements, efficiency, or cost savings, but also for benchmarking or determining the level of living standards [46].
Considering classical LCC, Thomassen et al. [27] already defined labor productivity as one economic indicator for the life cycle based assessment of dairy farms. However, no economic impact category has yet been defined addressing the aspects of productivity.
Productivity measures are normally based on economic theory and can be defined in a narrow sense when limited to output per working hours, but also in a very broad sense, when including intangible or even natural capital [50]. Both definitions influence the economic system. Whereas the linkage between total output and business success is relatively obvious, the economic consequences resulting from using or providing different types of capital is harder to grasp. Some studies [43,53,58,68,72,92], however, draw a relation between intangible and human capital and prosperity and the generation of wealth in the long term.
On this basis, we define Productivity as a new midpoint category, translating output and labor productivity into a midpoint impact, which positively or negatively affects Economic prosperity and Wealth generation. We therefore follow the suggestion of The World Bank [60], by which productivity on the corporate level shall be determined by intangible capital (dominated by human capital), total factor productivity (linked to technological status and change as well as natural capital), and institutional quality.
Going beyond the conceptual level, indicators are needed to determine the impact. Therefore, beside the total factor productivity, which goes in line with the output-oriented definition of productivity, the different types of capital must be considered. We follow an earlier scheme provided by Hamilton et al. [68], relating the different components of productivity with wealth generation (see Figure 2). Of particular interest are the components of intangible and its sub-part human capital, which are hard to determine but significantly affect the level of productivity [46,58,72].
Intangible capital is commonly understood as the share of production that is usually neglected within the estimates of produced and natural capital. Generally, this covers the knowledge and skills of the labor force [68]. According to broader interpretations, it may also cover information stored in humans, species, or ecosystems [69]. Furthermore, intangible capital may also cover aspects of social capital and governance [68]. Social capital and governance aspects, however, remain unconsidered within this study, as they may not be relevant to a product perspective.
Doubtless, one crucial component of intangible capital is human capital. Human capital (or employee relations) determines to a large extent the productivity within an organization. The productivity level rises and falls with employees’ satisfaction, safety, skills, and knowledge [46,58,72]. Blundell et al. [58] point out that higher skills and knowledge within an organization’s workforce positively influence the general speed, but also the flexibility and variety of production. Often education and training are listed as a way to improve employees’ skills and knowledge levels. The absolute effect of education and training is, however, broadly challenged and ranges from high to no influence on productivity [58]. We therefore do not further address the aspects of training but rather focus on education (assuming that it provides a first measure for skills and knowledge) in the subsequent considerations. Therefore, we propose a midpoint indicator containing two parts. The first one addresses the usual productivity measures; the second one accounts for the human capital aspects of productivity.
Usual productivity measures relate the gross VA [27] or volumes [19] to the amount of labor needed to create a defined output. Adding to this, the Organization for Economic Co-operation and Development [46] introduces multifactor productivity measures, which are either based on the VA concept or on gross output. To avoid double-counting with the proposed VA-based midpoint indicator addressing the category Profitability, within this study we include gross output for describing Productivity at the midpoint level (see Equation (2)):
P L ( p ) = l = 1 L c = 1 C G O c , l L c , l ,
where L, C ∊ ℕ; PL(p) equals the total productivity of product p; GOc,l represents the gross output; and Lc,l represents the labor (by means of labor costs) needed by company c in life cycle stage l for producing product p.
To include the human capital aspect into the determination, productive hours, suggested by Oxenburgh et al. [48], can be used as a proxy for labor needed. Productive hours describe the total hours paid by the employer less hours not actively producing, which may include injuries, illness, training, vacation, and other. Equation (2) would accordingly be transformed to:
P L ( p ) = l = 1 L c = 1 C G O c , l L c , l   W L c , l ,
where WLc,l represents the work loss (hours not actively producing) within company c and life cycle stage l.
Yet, Equation (3) does not indicate any effects resulting from workers’ skills, satisfaction, or knowledge. Considering e.g., studies from Jamal and Saif [93] or Baxter and Matear [94], the inherent complexity of human capital contributes to this dilemma. Therefore, enabling a first coverage of human capital aspects within the productivity indicator, we include an education measure, assuming that it serves as a first indication for overall knowledge and skills within the workforce. We, however, stress that the equation presented below may only serve as a first suggestion and that further improvements are needed to cover a broader range of human capital aspects.
Wößmann [95] suggests a simplification by focusing on a human capital related rate of return (HCRR) expressed within an exponential relation changing with an efficiency function. It expresses the rate of return depending on years of schooling. Note that, different approaches focused on labor income based measures, like the one presented by Mulligan and Sala-i-Martin [96]. This however seems meaningless from an organizational perspective, as by this means no rate of return on human capital is expressed. Therefore, we follow the suggestions of Wößmann [95], expressed in the following Equation:
H C R R = e f ( L U ) .
Therefore, f(LU) in its simplest form is defined according to the following equation:
f ( LU ) =   r e × a s ,
where f(LU) reflects the efficiency within a unit of labor (LU) with s years of schooling, re is the rate of return to education, and as is the years of schooling. First measures of rates of return, both social and private, are provided by Psacharopoulos [97] and Montenegro and Patrinos [98]. However, we suggest that organizations determine their own rate of return depending on their human capital to more accurately reflect the organization’s performance.
Although Wößmann [95] rather considers the macro-level than the micro-level of economic consequences, the related function could be translated into a corporate or even product context, reflecting its inherent human capital potential. Consequently, the final Productivity indicator function would describe as:
P L ( p ) = l = 1 L c = 1 C { G O c , l L c , l   W L c , l × H C R R c , l } ,
where HCRRc,l describes the human capital related rate of return of company c in life cycle stage l.
In its defined combination the suggested midpoint indicator likely influences Economic prosperity at the endpoint level through the labor productivity part, but may also affect Economic resilience through the human capital aspects included. How the aggregation from the midpoint towards the endpoint level is performed goes beyond the scope of this study and will be part of further research. The presented studies of Hamilton et al. [68], OECD [46] and Ștefănescu-Mihăilă [43] may therefore serve as starting points.

3.4.3. Consumer Satisfaction

Customers and consumers embody the target groups of most business activities [99]. Customer relations and customer satisfaction consequently seem important for a business’s success and should not be neglected within economic assessments [50,93]. Customers’ value and utility seem crucial for ensuring that products give prolonged satisfaction [100]. Customer utility is generally described through product’s use and thus the relation between the consumer and the object consumed [89]. The core question according to Ehrenfeld [3] is: Does a product create authentic satisfaction or does it just deliver momentary relief? We assume that just the former creates benefits for long-term business success. In this context, authentic satisfaction can be understood as value-in-use (introduced in Section 3.4.1).
In classical LCC studies, the customer is only regarded through the price he/she has to pay for receiving the desired product or service [11,12]. Grießhammer et al. [23] goes beyond this interpretation of a customer’s involvement by also addressing utility. Bovea and Vidal [101] in this context named the customer’s willingness-to-pay (WTP) for increasing products’ value.
From a product’s perspective the WTP seems reasonable, as it displays the consumer’s satisfaction with the product and/or product option and thus indirectly provides information on long-term business success. It also, according to Jonkman et al. [59] and Hacking and Guthrie [7], enables valuation of goods and services or even externalities, which are not ordinarily monetized within the market. Thus, WTP may express a customer’s perception of value received [102], which is in line with the proposal of Settanni et al. [21] to set the focus on the customer’s point of view.
We therefore define the new midpoint category Consumer satisfaction to cover aspects of utility and of value-in-use as well as customer relations within EcLCA. Regarding the endpoint level, Consumer satisfaction may influence the defined endpoint Economic prosperity, as it ensures an organization’s market success as well as indicates the customer’s factual utility, contributing to prosperity and thus wealth.
The abovementioned approach of Bovea and Vidal [101] for including the WTP in the assessment seems promising when going beyond the conceptual level towards indicator development, in particular as value-in-use is by definition hard to grasp. Some interpret value-in-use as future attributable cash flows [103]. Often, value-in-use is also understood as value-based selling, considering product design, services and support, and reputation [79,104]. The customer would then react to those offers from the selling organization with emotion, cognition, and certain behaviors, which could result in a transaction of goods and services [100]. In both ways of understanding the value-in-use, the customer’s willingness-to-pay (WTP) can be a suitable measure.
We therefore define a first midpoint indicator representing the category Consumer satisfaction by including a customer’s WTP. We follow the approach of Bovea and Vidal [101] and extend the WTP by the internal costs of the same product option to calculate its customer’s value. It is understood as a maximizing function and has been described in the following equation:
C V = max { W T P i     I C i } ,
where CV equals the customer’s value, WTPi the Willingness-to-pay of product option i, and ICi the internal or production cost (IC) of the same product option.
Through the combination of the WTP and the IC the product’s and/or firm’s performance can be tracked and the definition of value is broadened. Both may be relevant for economies value-added at the macroeconomic level and may therefore affect the defined endpoint Economic prosperity and the AoPs Economic stability and Wealth generation. However, the detailed determination of the endpoint effects is beyond the scope of this study but shall be part of further research.

3.4.4. Business Diversity

Diversity has been determined as a crucial factor to ensure functioning economies [47,67]. Diversity is important for two reasons: economic resilience and economic prosperity. More complex or diverse products can mostly be found within high-income countries, whereas the least complex products can be found in low-income countries [105,106]. Note that, the two terms diversity and complexity describe the same cause according to Felipe and Hidalgo [52], Felipe et al. [105]; and Hausmann et al. [106] Simplistically said: the more diverse the product portfolio within a certain economy, the higher the prosperity level. At the same time, diversity seems to be important to prevent and recover from external shocks on both the economy and the firm level [47]. For instance, an organization dependent on an industry that is likely to experience shocks is at risk of being hit by such a shock [42].
Within classical LCC, diversity has earlier been mentioned in the context of economic resilience [11]. However, neither an impact category nor an indicator has yet been defined to address diversity on the corporate level. Nevertheless, economic studies seem to confirm the relationship between diversity and economic resilience. Thus, we link diversity to the defined endpoint category of Economic resilience (see Section 3.3.2). Furthermore, diversity may also influence Economic prosperity, as addressed by Malizia and Ke [47], Briguglio et al. [45], and Hausmann et al. [106]. Therefore, we define Business diversity as a new midpoint category for EcLCA.
Business diversity addresses the microeconomic level, mainly following the research of Hill et al. [42] and Felipe et al. [105]. It thus accounts for the diversification rate of organization’s partners [42] and/or the complexity of organization’s products [105]. Clearly, the complexity of products within an organization is linked to the knowledge and skills stored and mobilized within an organization [106]. To avoid double-counting between this midpoint category and the earlier defined category productivity, within business diversity we only address knowledge in relation to the intricate structure of organization’s products. Within productivity we link knowledge and skills to human capital related aspects, e.g., for indicating how knowledge influences the workforce and performance (see Section 3.4.2).
A firm’s diversification may be especially relevant for highly specialized industries and sectors, like mining or agriculture. Those industries are highly dependent on natural resources, weather conditions, and market demand. All those aspects together may be more likely to result in business or external shocks, due to changing demands, weather disasters, and unsustainable resource management [47,52].
Measuring Business diversity strictly at the product or corporate level seems challenging. Even though Hausmann et al. [106] earlier suggested a product complexity index (PCI), which covers a variety of products and also considers their intricate structure. It does, however, not give an indication of if and when a firm’s diversity is sufficient, as it rather displays a country’s situation. A closer relation to the corporate and product level has been provided by Bowen and Wiersema [107]. They define a firm’s optimal level of diversification by balancing the resulting economic gains against the bureaucratic transaction costs and resource-based views. They furthermore identify different variables influencing a firm’s diversity, like resource-based dependencies, firm size, and export and import intensities. They, however, fail to address product’s complexity (as suggested by Hausmann et al. [106]). Thus, the combination of both approaches seems promising to comprehensively cover Business diversity at the midpoint level. However, a more thorough investigation, which goes beyond the scope of this study, is needed to develop a meaningful EcLCA indicator.

3.4.5. Long-Term Investment

Economic development can only be sustainable if constant capital stocks or at least constant capital services are ensured over a longer time period [60,68]. This seems particularly important for organizations involved in natural resource business. Those resources must be carefully managed to avoid the “resource curse”, which would hinder long-term development and thus prosperity (see Section 3.3.1) [60,68]. Long-term investments seem to determine the success and survival of an organization in the market and ensure corporate self-reliance [43,60,82]. Furthermore, it seems relevant in connection with agricultural products, as soil fertility determines a business’s success in the long term [108]. According to the Global Reporting Initiative [88], The World Bank [68], and others [79,83], such long-term investments shall include general investments, reproducible capital, longevity, and technical developments. They furthermore identify investment grants, subsidies leading to capital accumulation, and genuine savings as crucial in the long term. Some [92] even count human capital investments as crucial for growth and wealth in the long term; however, to avoid double-counting within this study, we refer to human capital only in the context of Productivity. However, risky political or economic conditions often hinder the consideration of long-term investments [109].
Within classical LCC, the aspect of long-term economic development and thus long-term investment has mostly been neglected. Naturally, investment costs have been considered by targeting cost savings throughout a product’s life cycle. However, aspects like the abovementioned have not yet been included, nor were impact levels defined.
We therefore propose to cover Long-term investments within a midpoint category, as it seems to be important for microeconomic market efficiency in the long run. This midpoint also affects Economic resilience at the endpoint level, as it determines economies’ stability by covering the aspect of capital accumulation. This may have positive effects on import and export diversification important for resilient economies [42,45,52]. In addition, Long-term investments influence Economic prosperity as genuine savings may positively contribute to a firm’s success and thus to economies’ value-added [79,83].
Quantitative measures for the defined midpoint category are hard to define; however, Zadek and Tuppen [79] proposed a qualitative indicator addressing long-term investments. They described a classification and categorization of different investment decisions, like capital investment (e.g., plants), knowledge investment (e.g., Research and Development), or acquisition. Defining a practical indicator on long-term investments is not trivial, as its link to the product level is challenging plus it requires retrospective and assumed prospective time series along an organization’s existence [68]. Therefore, we stick for now to the qualitative level. We, however, stress that the development of quantitative indicators is of utmost importance, especially as long-term considerations have far-reaching effects within and beyond economies [79].

4. Discussion

With the definitions of first endpoint and midpoint categories as well as economic AoPs for EcLCA, new considerations and aspects are provided for the representation of the economic pillar within the LCSA framework. Relevant relations between the midpoint and endpoint level have been displayed through the defined impact pathway. This study therefore serves as a first step towards a more comprehensive structure for LCSA’s economic pillar, displaying relevant aspects of economic activities. Furthermore, the new structure better copes with the requirements of ISO 14044 [31] followed within the LCSA framework.
Targeting the implementation of this first conceptual framework, trials on general applicability will be part of future research. The practical implementation of the midpoint categories and indicators defined may be less challenging, as management accounting systems normally contain the data needed. Aggregation towards the endpoint (damage) level needs, however, further consideration. For the determination of concrete measures at the endpoint level, future research shall therefore include broader economic assessment approaches, like ecological economics, as those may provide helpful insights.
We defined the midpoint indicators more precisely, as the application of midpoint indicators can generally be seen as easier than the implementation of endpoint indicators [36,88,110,111]. We are nevertheless aware that some of the proposed indicators may contain some inconsistencies. For instance, WTP measures (see Section 3.4.3) may contain shortcomings, due to the assumption that everyone has perfect knowledge. Thus, prices assumed through WTP would be very different if those inconsistencies were eliminated [69]. Nonetheless, Sen [75] mentions the formation of values including consumption behaviors in connection with human freedoms. In this context, WTP may also be seen as a counterpart to VA reflecting human capabilities. In connection to the value term used within the VA definition, further investigation is needed for clearly delineating Profitability and Productivity. The core question here is if and to what extent labor costs can be regarded in both midpoint categories without causing double-counting.
Emphasizing the conceptual nature of the presented EcLCA approach, we understand all categories and indicators proposed as starting points that may need further investigation and adaption. The representative nature of the chosen indicators as well as their implementation potential will therefore be considered in future research. Similar accounts for establishing a measurable linkage between midpoint and endpoint indicators, as within this study a rather qualitative relation was targeted. Through this limitation to qualitative relations, the discussion on the inclusion of external costs remains partly unresolved, even though some external costs (e.g., addressing damage to society’s wealth) can indeed be covered by the already defined endpoint categories or may be covered by the social impact categories defined within SLCA.
Addressing the conceptual framework, the differentiation between the micro- (midpoint) and macroeconomic (endpoint) level may not in any case be straightforward. Some of the defined categories could generally reflect both levels, e.g., Business diversity. Business diversity can describe a company’s as well as a region’s level of diversity. However, as the resulting level of diversity heavily affects the two defined endpoints of Economic prosperity and stability (see Section 3.4.4), we define Business diversity as a midpoint category reflecting the corporate level.
Coming from classical LCC, different perspectives have generally been regarded within the assessment method (typically producer, consumer, and society). With the definition of the new EcLCA framework, the different groups are now reflected within the defined impact categories. Those midpoint and endpoint categories shall account for all relevant aspects along a product’s life cycle. We, however, stress that the presented impact categories are neither exclusive nor necessarily comprehensive and thus additional impact categories may be expedient, e.g., to better cover socioeconomic aspects, which are covered neither in SLCA nor in the new EcLCA.
Still pending is the discussion on intra- and inter-generational equity. This topic can, however, not solely be addressed by one of the three LCSA methods, but is rather an overlapping concern. The new EcLCA with its inclusion of the economic AoP Wealth generation as well as the endpoint category Economic prosperity may, however, provide a first step for considering important economic aspects of intra- and intergenerational equity like diversity and distribution. For complementing the broader picture, the ecological economics approach or Sen’s capability approach may provide helpful insights for further developments, as both consider equity as an important concern. They further provide assistance for developing tools towards strong sustainability concepts, considering economy as a subset of the environment. Arising trade-offs between the three dimensions may hereby become more easily identifiable and solvable.

5. Conclusions

With this study, we present a new EcLCA approach to better reflect the reality of economic systems. We initially focused on achieving a conceptual framework addressing possible and considerable interlinkages between the micro- and the macroeconomic level. Relations between economic activities and resulting consequences have been displayed going beyond the cost-driven view of classical LCC. We hypothesize that the presented interlinkages along the impact pathway are necessary to understand the economic system and to enable a quantitative determination of economic impacts within EcLCA. We furthermore hypothesize that the implementation and consideration of economic impact pathways will contribute to a wider application of LCSA, as the aim of the new EcLCA approach seems more plausible compared to classical LCC. Further research and fine-tuning of the identified midpoint and endpoint categories and related indicators is, however, needed to enable a valid and consistent assessment basis fostering practical implementation of EcLCA and also LCSA.

Acknowledgments

We acknowledge that this research has been funded by the German Research Foundation DFG (SFB 1026/1 2012), Collaborative Research Center CRC1026 (Sonderforschungsbereich SFB1026).

Author Contributions

Sabrina Neugebauer is the main author. She was mainly responsible for the idea, concept and research as well as writing the manuscript. Silvia Forin supported the research with regard to the macroeconomic considerations. She and Matthias Finkbeiner provided helpful feedback for composing the final document. All authors approved the final manuscript.

Conflicts of Interest

The authors declare no conflict of interest.

Abbreviation

The following abbreviations are used in this manuscript:
AoP
Area of protection
CBA
cost–benefit analysis
EcLCA
Economic life cycle assessment
GDP
Gross domestic product
GNP
Gross national product
GPI
Genuine Progress Indicator
HCRR
Human capital related rate of return
ICAEW
Institute of Chartered Accountants in England and Wales
IMF
International Monetary Fund
ISEW
Index of Sustainable Economic Welfare
ISO
International Organization for Standardization
LCA
Life cycle assessment
LCC
Life cycle costing
LCSA
Life cycle sustainability assessment
OECD
Organization for Economic Co-operation and Development
SD
Sustainable development
SLCA
Social life cycle assessment
VA
Value added
WTP
Willingness-to-pay

References

  1. Intergovernmental Panel on Climate Change (IPCC). IPCC: Climate Change 2013—The Physical Science Basis. Summary for Policymakers; Stocker, T.F., Qin, D., Plattner, G.-K., Tignor, M.M.B., Allen, S.K., Boschung, J., Nauels, A., Xia, Y., Bex, V., Midgley, P.M., Eds.; Cambridge University Press: Cambridge, UK; New York, NY, USA, 2013. [Google Scholar]
  2. Boons, F.; Montalvo, C.; Quist, J.; Wagner, M. Sustainable innovation, business models and economic performance: an overview. J. Clean. Prod. 2013, 45, 1–8. [Google Scholar] [CrossRef]
  3. Ehrenfeld, J.R. The Roots of Sustainability. Sloan Manage. Rev. 2005, 46, 23–25. [Google Scholar]
  4. United Nations. Report of the World Commission on Environment and Development—Our Common Future; Oxford University Press: New York, NY, USA; Toronto, ON, Canada, 1987. [Google Scholar]
  5. UNCED. A Summary of the Proceedings of the United Nations Conference on Environment and Development 3–14 June 1992. Available online: http://www.iisd.ca/download/pdf/enb0213e.pdf (accessed on 28 April 2016).
  6. Finkbeiner, M.; Schau, E.M.; Lehmann, A.; Traverso, M. Towards Life Cycle Sustainability Assessment. Sustainability 2010, 2, 3309–3322. [Google Scholar] [CrossRef]
  7. Hacking, T.; Guthrie, P. A framework for clarifying the meaning of Triple Bottom-Line, Integrated, and Sustainability Assessment. Environ. Impact Assess. Rev. 2008, 28, 73–89. [Google Scholar] [CrossRef]
  8. Heijungs, R.; Huppes, G.; Guinée, J.B. Life cycle assessment and sustainability analysis of products, materials and technologies. Toward a scientific framework for sustainability life cycle analysis. Polym. Degrad. Stab. 2010, 95, 422–428. [Google Scholar] [CrossRef]
  9. Klöpffer, W. Life Cycle Sustainability Assessment of Products. Int. J. Life Cycle Assess. 2008, 13, 89–95. [Google Scholar] [CrossRef]
  10. Neugebauer, S.; Martinez-Blanco, J.; Scheumann, R.; Finkbeiner, M. Enhancing the practical implementation of life cycle sustainability assessment—Proposal of a Tiered approach. J. Clean. Prod. 2015, 102, 165–176. [Google Scholar] [CrossRef]
  11. Hunkeler, D.; Rebitzer, G.; Lichtenvort, K. Environmental Life Cycle Costing; CRC Press: Boca Raton, FL, USA, 2008. [Google Scholar]
  12. Klöpffer, W.; Ciroth, A. Is LCC relevant in a sustainability assessment? Int. J. Life Cycle Assess. 2011, 16, 99–101. [Google Scholar] [CrossRef]
  13. Swarr, T.E.; Hunkeler, D.; Klöpffer, W.; Pesonen, H.-L.; Ciroth, A.; Brent, A.C.; Pagan, R. Environmental life-cycle costing: A code of practice. Int. J. Life Cycle Assess. 2011, 16, 389–391. [Google Scholar] [CrossRef]
  14. Gluch, P.; Baumann, H. The life cycle costing (LCC) approach: A conceptual discussion of its usefulness for environmental decision-making. Build. Environ. 2004, 39, 571–580. [Google Scholar] [CrossRef]
  15. Hall, M.R. A transdisciplinary review of the role of economics in life cycle sustainability assessment. Int. J. Life Cycle Assess. 2015, 20, 1625–1639. [Google Scholar] [CrossRef]
  16. Singh, R.K.; Murty, H.R.; Gupta, S.K.; Dikshit, A.K. An overview of sustainability assessment methodologies. Ecol. Indic. 2012, 15, 281–299. [Google Scholar] [CrossRef]
  17. Sneddon, C.; Howarth, R.B.; Norgaard, R.B. Sustainable development in a post-Brundtland world. Ecol. Econ. 2006, 57, 253–268. [Google Scholar] [CrossRef]
  18. European Commission. Economic Stability and Growth. Available online: http://ec.europa.eu/economy_finance/euro/why/stability_growth/index_en.htm (accessed on 26 April 2016).
  19. International Monetary Fund (IMF). How the IMF Promotes Global Economic Stability; IMF: Washington, DC, USA, 2015. [Google Scholar]
  20. Jackson, T. Prosperity without Growth; World Tour Forum Lucerne: Luzern, Switzerland, 2011. [Google Scholar]
  21. Settanni, E.; Newnes, L.B.; Thenent, N.E.; Parry, G.; Goh, Y.M. A through-life costing methodology for use in product–service-systems. Int. J. Prod. Econ. 2014, 153, 161–177. [Google Scholar] [CrossRef] [Green Version]
  22. ISO. ISO 15686-5:2008. Buildings and Constructed Assets—Service-Life Planning—Life-Cycle Costing; ISO: Geneva, Switzerland, 2008. [Google Scholar]
  23. Grießhammer, R.; Buchert, M.; Gensch, C.-O.; Hochfeld, C.; Manhart, A.; Rüdenauer, I. PROSA–Product Sustainability Assessment; Institute for Applied Ecology: Freiburg, Germany, 2007; Volume 49. [Google Scholar]
  24. Rebitzer, G.; Hunkeler, D. Life cycle costing in LCM: Ambitions, opportunities, and limitations. Int. J. Life Cycle Assess. 2003, 8, 253–256. [Google Scholar] [CrossRef]
  25. May, J.R.; Brennan, D.J. Sustainability Assessment of Australian Electricity Generation. Process Saf. Environ. Prot. 2006, 84, 131–142. [Google Scholar] [CrossRef]
  26. Kruse, S.A.; Flysjö, A.; Kasperczyk, N.; Scholz, A.J. Socioeconomic indicators as a complement to life cycle assessment—An application to salmon production systems. Int. J. Life Cycle Assess. 2009, 14, 8–18. [Google Scholar] [CrossRef]
  27. Thomassen, M.A.; Dolman, M.A.; van Calker, K.J.; de Boer, I.J.M. Relating life cycle assessment indicators to gross value added for Dutch dairy farms. Ecol. Econ. 2009, 68, 2278–2284. [Google Scholar] [CrossRef]
  28. Heijungs, R.; Settanni, E.; Guinée, J. Toward a computational structure for life cycle sustainability analysis: Unifying LCA and LCC. Int. J. Life Cycle Assess. 2012, 18, 1722–1733. [Google Scholar] [CrossRef] [Green Version]
  29. Jeswani, H.K.; Azapagic, A.; Schepelmann, P.; Ritthoff, M. Options for broadening and deepening the LCA approaches. J. Clean. Prod. 2010, 18, 120–127. [Google Scholar] [CrossRef]
  30. Wood, R.; Hertwich, E.G. Economic modelling and indicators in life cycle sustainability assessment. Int. J. Life Cycle Assess. 2012, 18, 1710–1721. [Google Scholar] [CrossRef]
  31. ISO. ISO 14044:2006. Environmental Management—Life Cycle Assessment—Requirements and Guidelines; Deutsches Institut für Normung e.V.: Berlin, Germany, 2006. [Google Scholar]
  32. Curran, R.; Raghunathan, S.; Price, M. Review of aerospace engineering cost modelling: The genetic causal approach. Prog. Aerosp. Sci. 2004, 40, 487–534. [Google Scholar] [CrossRef]
  33. Hochschorner, E.; Noring, M. Practitioners’ use of life cycle costing with environmental costs—A Swedish study. Int. J. Life Cycle Assess. 2011, 16, 897–902. [Google Scholar] [CrossRef]
  34. Seuring, S.; Müller, M. From a literature review to a conceptual framework for sustainable supply chain management. J. Clean. Prod. 2008, 16, 1699–1710. [Google Scholar] [CrossRef]
  35. Jørgensen, A.; Herrmann, I.T.; Bjørn, A. Analysis of the link between a definition of sustainability and the life cycle methodologies. Int. J. Life Cycle Assess. 2013, 18, 1440–1449. [Google Scholar] [CrossRef]
  36. Reap, J.; Roman, F.; Duncan, S.; Bras, B. A survey of unresolved problems in life cycle assessment. Int. J. Life Cycle Assess. 2008, 13, 374–388. [Google Scholar] [CrossRef]
  37. Benoit, C.; Mazijn, B. Guidelines for Social Life Cycle Assessment of Products; UNEP/SETAC Life Cycle Initiative: Paris, France, 2009. [Google Scholar]
  38. Vanclay, F. Conceptualising social impacts. Environ. Impact Assess. Rev. 2002, 22, 183–211. [Google Scholar] [CrossRef]
  39. Jolliet, O.; Müller-Wenk, R.; Bare, J.; Brent, A.; Goedkoop, M.; Heijungs, R.; Itsubo, N.; Peña, C.; Pennington, D.; Potting, J.; et al. The LCIA Midpoint-damage Framework of the UNEP/SETAC Life Cycle Initiative. Int. J. Life Cycle Assess. 2004, 9, 394–404. [Google Scholar] [CrossRef]
  40. Jørgensen, A.; Lai, L.C.H.; Hauschild, M.Z. Assessing the validity of impact pathways for child labour and well-being in social life cycle assessment. Int. J. Life Cycle Assess. 2010, 15, 5–16. [Google Scholar] [CrossRef]
  41. Zamagni, A.; Pesonen, H.-L.; Swarr, T. From LCA to Life Cycle Sustainability Assessment: Concept, Practice and Future Directions. Int. J. Life Cycle Assess. 2013, 18, 1637–1641. [Google Scholar] [CrossRef]
  42. Hill, E.; Wial, H.; Wolman, H. Exploring Regional Economic Resilience; Institute of Urban and Regional Development: Berkley, CA, USA, 2008. [Google Scholar]
  43. Ștefănescu-Mihăilă, R. Social Investment, Economic Growth and Labor Market Performance: Case Study—Romania. Sustainability 2015, 7, 2961–2979. [Google Scholar] [CrossRef]
  44. Bleaney, M.F. Macroeconomic stability, investment and growth in developing countries. J. Dev. Econ. 1996, 48, 461–477. [Google Scholar] [CrossRef]
  45. Briguglio, L.; Cordina, G.; Farrugia, N.; Vella, S. Economic Vulnerability and Resilience: Concepts and Measurements. Oxf. Dev. Stud. 2009, 37, 229–247. [Google Scholar] [CrossRef]
  46. Organisation for Economic Co-operation and Development (OECD). Measuring Productivity; OECD: Paris, France, 2001. [Google Scholar]
  47. Malizia, E.E.; Ke, S. The Influence of Economic Diversity on Unemployment and Stability. J. Reg. Sci. 1993, 33, 221–235. [Google Scholar] [CrossRef]
  48. Oxenburgh, M.; Marlow, P.S.P.; Oxenburgh, A. Increasing Productivity and Profit through Health and Safety: The Financial Returns from a Safe Working Environment; CRC Press: Boca Raton, FL, USA, 2004. [Google Scholar]
  49. Simmie, J.; Martin, R. The economic resilience of regions: Towards an evolutionary approach. Cambridge J. Reg. Econ. Soc. 2010, 3, 27–43. [Google Scholar] [CrossRef]
  50. Vargo, S.L.; Lusch, R.F. Service-dominant logic: Continuing the evolution. J. Acad. Mark. Sci. 2008, 36, 1–10. [Google Scholar] [CrossRef]
  51. Anand, S.; Sen, A. Human development and economic sustainability. World Dev. 2000, 28, 2029–2049. [Google Scholar] [CrossRef]
  52. Felipe, J.; Hidalgo, C. Economic diversification implications for Kazakhstan. In Development and Modern Industrial Policy in Practice: Issues and Country Experiences; Felipe, J., Ed.; Edward Elgar Pub: Cheltenham, UK; Northampton, MA, USA; Asian Development Bank: Manila, Philippines, 2015; pp. 160–196. [Google Scholar]
  53. Offer, A. A Vision of Prosperity; SDC Commission Workshop: London, UK, 2007; pp. 1–11. [Google Scholar]
  54. Blok, K.; Huijbregts, M.; Roes, L.; van Haaster, B.; Patel, M.K.; Hertwich, E.; Hauschild, M.; Sellke, P.; Antunes, P.; Hellweg, S.; et al. A Novel Methodology for the Sustainability Impact Assessment of New Technologies; EC 7th framework project PROSUITE: Utrecht, The Netherlands, 2013. [Google Scholar]
  55. Daly, H.E. For the Common Good: Redirecting the Economy Toward Community, the Environment, and a Sustainable Future; Beacon Press: Boston, MA, USA, 1994. [Google Scholar]
  56. Meadows, D.H.; Meadows, D.L.; Randers, J.; Behrens, W.W. The Limits to Growth; Universe Books: New York, NY, USA, 1972. [Google Scholar]
  57. Meadows, D.; Meadows, D.; Randers, J. Limits to Growth: The 30-Year Update; Chelsea Green Publishing: White River Junction, VT, USA, 2004. [Google Scholar]
  58. Blundell, R.; Dearden, L.; Meghir, C.; Sianesi, B. Human Capital Investment: The Returns from Education and Training to the Individual, the Firm and the Economy. Financ. Stud. 1999, 20, 1–23. [Google Scholar] [CrossRef]
  59. Jonkman, S.N.; van Gelder, P.H.; Vrijling, J.K. An overview of quantitative risk measures for loss of life and economic damage. J. Hazard. Mater. 2003, 99, 1–30. [Google Scholar] [CrossRef]
  60. World Bank. The Changing Wealth of Nations; World Bank: Washington, DC, USA, 2011. [Google Scholar]
  61. Oxfam International. Oxfam Poverty Footprint—Understanding Business Contribution to Development; Oxfam International: Oxford, UK, 2009. [Google Scholar]
  62. Haes, H.; Jolliet, O.; Norris, G.; Saur, K. UNEP/SETAC life cycle initiative: Background, aims and scope. Int. J. Life Cycle Assess. 2002, 7, 192–195. [Google Scholar] [CrossRef]
  63. Jørgensen, A.; Le Bocq, A.; Nazarkina, L.; Hauschild, M. Methodologies for Social Life Cycle Assessment. Int. J. Life Cycle Assess. 2008, 13, 96–103. [Google Scholar] [CrossRef]
  64. Giddings, B.; Hopwood, B.; O’Brien, G. Environment, economy and society: Fitting them together into sustainable development. Sustain. Dev. 2002, 10, 187–196. [Google Scholar] [CrossRef]
  65. European Commission Joint Research Centre. ILCD Handbook: Analysis of Existing Environmental Impact Assessment Methodologies for Use in Life Cycle Assessment; European Commission Joint Research Centre: Ispra, Italy, 2010. [Google Scholar]
  66. Kollmorgen, R.; Merkel, W.; Wagener, H. Transformation und Transformationsforschung: Zur Einfuhrung; Springer Fachmedien: Wiesbaden, Germany, 2015. (In German) [Google Scholar]
  67. Attaran, M. Industrial diversity and economic performance in U.S. areas. Ann. Reg. Sci. 1986, 20, 44–54. [Google Scholar] [CrossRef]
  68. Hamilton, K.; Ruta, G.; Bolt, K.; Markandya, A.; Pedroso-Galinato, S.; Silva, P.; Ordoubadi, M.S.; Lange, G.-M.; Tajibaeva, L. Where is the Wealth of Nations? World Bank: Washington, DC, USA, 2006. [Google Scholar]
  69. Costanza, R.; d’Arge, R.; de Groot, R.; Farber, S.; Grasso, M.; Hannon, B.; Limburg, K.; Naeem, S.; O’Neill, R.V.; Paruelo, J.; et al. The value of the world’s ecosystem services and natural capital. Nature 1997, 387, 253–260. [Google Scholar] [CrossRef]
  70. Easterlin, R. Does economic growth improve the human lot? In Nations and Households in Economic Growth: Essays in Honor of Moses Abramovitz; David, P., Reder, M., Eds.; Academic Press: New York, NY, USA, 1974; pp. 89–125. [Google Scholar]
  71. Clark, D.A. The Capability Approach: Its Development, Critiques and Recent Advances; Global Poverty Research Group: Oxford, UK, 2005. [Google Scholar]
  72. Diener, E.; Seligman, M.E.P. Beyond Money—Toward an Economy of Well-Being. Psychol. Sci. Public Interest 2004, 5, 1–31. [Google Scholar] [CrossRef] [PubMed]
  73. Layard, R.; Mayraz, G.; Nickell, S. The marginal utility of income. J. Public Econ. 2008, 92, 1846–1857. [Google Scholar] [CrossRef]
  74. Spash, C.L. New foundations for ecological economics. Ecol. Econ. 2012, 77, 36–47. [Google Scholar] [CrossRef] [Green Version]
  75. Sen, A. The Ends and Means of Sustainability. J. Hum. Dev. Capab. 2013, 14, 6–20. [Google Scholar] [CrossRef]
  76. Bare, J.C.; Hofstetter, P.; Pennington, D.W.; de Haes, H.A.U. Midpoints versus Endpoints: The Sacrifices and Benefits. Int. J. Life Cycle Assess. 2000, 5, 319–326. [Google Scholar] [CrossRef]
  77. Pennington, D.W.; Potting, J.; Finnveden, G.; Lindeijer, E.; Jolliet, O.; Rydberg, T.; Rebitzer, G. Life cycle assessment part 2: Current impact assessment practice. Environ. Int. 2004, 30, 721–739. [Google Scholar] [CrossRef] [PubMed]
  78. Neugebauer, S.; Traverso, M.; Scheumann, R.; Chang, Y.-J.; Wolf, K.; Finkbeiner, M. Impact Pathways to Address Social Well-Being and Social Justice in SLCA—Fair Wage and Level of Education. Sustainability 2014, 6, 4839–4857. [Google Scholar] [CrossRef]
  79. Zadek, S.; Tuppen, C. Adding Values—The Economics of Sustainable Business; Britisch Telecom: London, UK, 2000. [Google Scholar]
  80. Cinelli, M.; Coles, S.R.; Jørgensen, A.; Zamagni, A.; Fernando, C.; Kirwan, K. Workshop on life cycle sustainability assessment: The state of the art and research needs—November 26, 2012, Copenhagen, Denmark. Int. J. Life Cycle Assess. 2013, 18, 1421–1424. [Google Scholar] [CrossRef]
  81. Weidema, B. The Integration of Economic and Social Aspects in Life Cycle Impact Assessment. Int. J. Life Cycle Assess. 2006, 1, 89–96. [Google Scholar] [CrossRef]
  82. Bleys, B. The Regional Index of Sustainable Economic Welfare for Flanders, Belgium. Sustainability 2013, 5, 496–523. [Google Scholar] [CrossRef] [Green Version]
  83. Talberth, J.; Cobb, C.; Slattery, N. The Genuine Progress Indicator; Redefining progress: Oakland, CA, USA, 2007. [Google Scholar]
  84. Zieschank, R.; Diefenbacher, H. The National Welfare Index as a Contribution to the Debate on a More Sustainable Economy; Forschungszentrum für Umweltpolitik: Berlin, Germany, 2012. [Google Scholar]
  85. European Commission. Enlarged GDP. Available online: http://ec.europa.eu/environment/beyond_gdp/indicators_egdp_en.html (accessed on 26 October 2015).
  86. Oxford Metrica. The 2015 FM Global Resilience Index Annul Report; Oxford Metrica: Oxford, UK, 2015. [Google Scholar]
  87. Guillaumont, P. An Economic Vulnerability Index: Its Design and Use for International Development Policy. Available online: https://www.econstor.eu/dspace/bitstream/10419/45132/1/589771515.pdf (accessed on 28 April 2016).
  88. Global Reporting Initiative. G4—Sustainability Reporting Guideline; Global Reporting Initiative: Amsterdam, The Netherlands, 2013. [Google Scholar]
  89. Aspromourgos, T. On the Origins of Classical Economics: Distribution and Value from William Petty to Adam Smith; Routledge: Abingdon-on-Thames, UK, 2013. [Google Scholar]
  90. Lindgreen, A.; Hingley, M.K.; Grant, D.B.; Morgan, R.E. Value in business and industrial marketing: Past, present, and future. Ind. Mark. Manag. 2012, 41, 207–214. [Google Scholar] [CrossRef]
  91. Azapagic, A.; Perdan, S. Indicators of Sustainable Development for Industry: A General Framework. Process Saf. Environ. Prot. 2000, 78, 243–261. [Google Scholar] [CrossRef]
  92. Nehru, V.; Swanson, E.; Dubey, A. A new database on human capital stock in developing and industrial countries: Sources, methodology, and results. J. Dev. Econ. 1995, 46, 379–401. [Google Scholar] [CrossRef]
  93. Jamal, W.; Saif, I. Impact of Human Capital Management on Organizational Performance. Eur. J. Econ., Financ. Admin. Sci. 2011, 34, 55–69. [Google Scholar]
  94. Baxter, R.; Matear, S. Measuring intangible value in business-to-business buyer-seller relationships: An intellectual capital perspective. Ind. Mark. Manag. 2004, 33, 491–500. [Google Scholar] [CrossRef]
  95. Wößmann, L. Specifying Human Capital: A Review, Some Extensions, and Development Effects; Working Paper No. 1007; Kiel Institute of World Economics: Kiel, Germany, 2000. [Google Scholar]
  96. Mulligan, C.B.; Sala-i-Martin, X. A labor income-based measure of the value of human capital: An application to the states of the United States. Jpn. World Econ. 1997, 9, 159–191. [Google Scholar] [CrossRef]
  97. Psacharopoulos, G. Returns to investment in education: A further update. Educ. Econ. 1994, 12, 111–134. [Google Scholar] [CrossRef]
  98. Montenegro, C.; Patrinos, H.A. Comparable Estimates of Returns to Schooling around the World; World Bank, Education Global Practice Group: Washington, DC, USA, 2014. [Google Scholar]
  99. Pesonen, H.L.; Horn, S. Evaluating the Sustainability SWOT as a streamlined tool for life cycle sustainability assessment. Int. J. Life Cycle Assess. 2012, 18, 1780–1792. [Google Scholar] [CrossRef]
  100. Payne, A.; Storbacka, K.; Frow, P. Managing the co-creation of value. J. Acad. Mark. Sci. 2008, 36, 83–96. [Google Scholar] [CrossRef]
  101. Bovea, M.; Vidal, R. Increasing product value by integrating environmental impact, costs and customer valuation. Resour. Conserv. Recycl. 2004, 41, 133–145. [Google Scholar] [CrossRef]
  102. Cronin, J.; Brady, M.; Hult, G.; Tomas, M. Assessing the effects of quality, value, and customer satisfaction on consumer behavioral intentions in service environments. J. Retail. 2000, 76, 193–218. [Google Scholar] [CrossRef]
  103. Institute of Chartered Accountants in England and Wales (ICAEW). Measurement in Financial Reporting Information for Better Markets Initiative; ICAEW: London, UK, 2006. [Google Scholar]
  104. Smals, R.G.M.; Smits, A.A.J. Value for value-The dynamics of supplier value in collaborative new product development. Ind. Mark. Manag. 2012, 41, 156–165. [Google Scholar] [CrossRef]
  105. Felipe, J.; Kumar, U.; Abdon, A.; Bacate, M. Product complexity and economic development. Struct. Chang. Econ. Dyn. 2012, 23, 36–68. [Google Scholar] [CrossRef]
  106. Hausmann, R.; Hidalgo, C.A.; Bustos, S.; Coscia, M.; Simoes, A.; Yildirim, M.A. The Atlas of Economic Complexity; MIT Press: Cambridge, UK, 2013. [Google Scholar]
  107. Bowen, H.P.; Wiersema, M.F. Foreign-based competition and corporate diversification strategy. Strateg. Manag. J. 2005, 26, 1153–1171. [Google Scholar] [CrossRef]
  108. Kotschi, J. Bodenlos - Negative Auswirkungen von Mineraldüngern in der Tropischen Landwirtschaft; Heinrich Böll Stiftung & WWF Deutschland: Berlin, Germany, 2013. (In German) [Google Scholar]
  109. Casson, A. Oil Palm, Soy Beans & Critical Habitat Loss. A Review Prepared for the WWF Forest Conservation Initiative; WWF Forest Conversion Initiative: Zurich, Switzerland, 2003. [Google Scholar]
  110. Jolliet, O.; Frischknecht, R.; Bare, J.; Boulay, A.-M.; Bulle, C.; Fantke, P.; Gheewala, S.; Hauschild, M.; Itsubo, N.; Margni, M.; et al. Global guidance on environmental life cycle impact assessment indicators: findings of the scoping phase. Int. J. Life Cycle Assess. 2014, 19, 962–967. [Google Scholar] [CrossRef]
  111. Hutchins, M.J.; Sutherland, J.W. An exploration of measures of social sustainability and their application to supply chain decisions. J. Clean. Prod. 2008, 16, 1688–1698. [Google Scholar] [CrossRef]
Figure 1. Impact pathway representing the economic dimension of sustainability within LCSA.
Sustainability 08 00428 g001
Figure 2. Productivity related components of wealth generation (adapted according to Hamilton et al. [68]).
Sustainability 08 00428 g002

