1. Introduction
Sustainable development has become a major concern for policy-makers and planners in both developed and developing countries since the publication of Brundtland Commission report [
1], which defined sustainable development as the “
development that meets the needs of the present without compromising the ability of future generations to meet their own needs”. This later led to the definition of sustainable transport: according to the European Conference of Transportation Ministers,
a sustainable transport system is one that is accessible, safe, environmental-friendly and affordable (ECMT [
2]). Therefore, new development patterns to meet these strategic objectives should be proposed.
The importance of urban freight transport is strictly related to the impacted population. Currently, 50% of the world’s population lives in urban and metropolitan areas, and in Europe this share reaches 70%. In 2050, the urban population worldwide is expected to have risen to 69%, while in Europe and the USA it could be 85% and 91%, respectively (UN [
3]). In this context, many solutions have been studied and implemented by local administrators (Russo and Comi [
4]; Sugar [
5]; Lindholm [
6]; Straightsol [
7]), but they mainly focus on systematic passenger mobility (e.g., commuter and student trips). Only recently has attention also been paid to non-systematic mobility, chiefly related to shopping, tourism, and leisure. This type of mobility has two sequential segments with two different decision-makers: final and intermediate chain users. Final users are people who undertake trips for shopping, while intermediate users are involved in shop restocking. In addition, these two segments have addressed the production of trips that can be assumed to be systematic (e.g., daily shop restocking trips performed by food distributors).
The rapid growth of urban freight transportation due to changes that are occurring in the supply chain (e.g., just-in-time, home deliveries, and e-shopping) produces more deliveries and more light goods vehicles in residential areas (Browne
et al. [
8]; Ducret [
9]; Visser
et al. [
10]). There are some sustainability concerns about the growing number of freight vehicles in residential areas (McKinnon
et al. [
11]), like congestion, air pollution, noise issues (
environmental), and an increase in logistic costs and, hence, the price of products (
economic). In addition, a combination of different types of vehicles on the road increases the risk of accidents (
social; Elvik
et al., 2009 [
12]).
That said, in order to assure an efficient urban freight distribution system able to meet the requirements of the various stakeholders involved (decision-makers) and minimize externalities, some classes of strategies can be implemented:
environmental sustainability, i.e., use of light and environment-friendly vehicles;
economic/financial sustainability, i.e., increase in commercial speed;
social sustainability, i.e., increase in safety thanks to the reduction of interference with other city mobility components (e.g., private traffic and pedestrians) and the number of commercial vehicles.
The objectives of sustainable development can be pursued by means of measures that are sometimes conflicting, and can generate impacts that are influenced by the acceptance of stakeholders and external factors (Anderson
et al. [
13]; Russo and Comi [
4]; Marcucci and Gatta [
14]). For example, end consumers (
i.e., residents, visitors) and public authorities (e.g., public planners) wish to reduce transport impacts in order to have an attractive city for inhabitants and visitors (mainly
environmental and
social sustainability, with a reduction in congestion, pollution, accidents, and so on). On the other hand, retailers (or producers) and private companies (e.g., carriers) wish to deliver and to pick up goods at the lowest cost with high-quality transport operations and short lead-times in order to satisfy users’ expectations in the best possible way (mainly
economic sustainability). Therefore, the new challenges of urban planning are to find solutions that can reduce the impacts of urban goods mobility without penalizing the life of the city (sustainable city logistics solutions/measures). As happens in passenger mobility, transport externality issues have led to the attractiveness of mass transit being improved. Indeed, transit allows accessibility to be maintained. By the same token, city logistics has to investigate the possible solutions that can allow externalities to be reduced and sustainability to be enhanced without damaging city functions. According to Marchau
et al. [
15], policy-making on transport requires an integrated view with respect to the various options, their possible consequences for transport system performance, and societal conditions for implementation. In this context, policy-making concerns making choices regarding a system in order to change the system outcomes in a desired way. Since the characteristics of urban areas can substantially differ, while all measures could produce good results in terms of external transport costs, some of them could, for example, increase costs incurred by some freight system actors (Wygonik and Goodchild [
16]). Then, their acceptability should be pointed out trying to share the objectives and to find an optimal compromise among the different actors involved (Marcucci
et al. [
17]). Therefore, in order to implement the most effective city logistics measures, the choice of a set of measures should be based on a planning scenario implementation process able to simulate the main effects of an exogenously specified scenario (
i.e.,
ex-ante assessment—“what if” approach). In this way, the obtainable effects can be evaluated prior to implementation and their results verified afterwards. Thus, a first objective of the paper is to identify, from the extensive literature on city logistics measures, the main criteria for classifying them, focusing on the direct impacts (both on actors—
internal—and on collectivity—
external) that could explicitly support the definition of planning horizons and the sustainable goals to pursue (
Section 2). Subsequently, due to the desirability to have methods and models for
ex-ante city logistics scenario assessment, the second macro-objective of the paper germinates,
i.e., to identify the methods and models that can be used in the
ex-ante assessment of city logistics scenarios for estimating impacts and system performance, and hence for comparing future scenarios according to a set of given target values (
Section 2).
Furthermore, as recognized by COP 21 [
18], climate change represents an urgent and potentially irreversible threat to human societies and the planet. It is crucial to accelerate the reduction in global greenhouse gas emissions and also pollutant emissions. Urban freight transport also has to contribute to achieve environmental goals. Even if several studies have investigated the environmental issues arising from urban freight transport (e.g., Leonardi and Baumgartner [
19]; Baumgartner
et al. [
20]; McKinnon
et al. [
11]; Rizet
et al. [
21]; Waygood
et al. [
22]; Hwang and Ouyang [
23]), they mainly refer to CO
2 emissions on the part of operators (e.g., shippers, transporters, consumers), while few of them identify the visions of city planners or administrators (McKinnon [
24]). This shows that further work is needed in this field. Therefore, as stated above, pushed by the desirability to plan city logistics to meet environmental/green goals, this paper presents the results of an
ex-post environmental assessment of some city logistics measures in order to identify
a priori the measure (or set of measures) that could be implemented to meet environmental/green challenges. Against this background, the European Commission has promoted the concept of sustainable urban mobility and has supported guidelines for developing Sustainable Urban Mobility Plans (SUMP [
25]). According to the SUMP approach, the guidelines for developing and implementing Sustainable Urban Logistics Plans (SULP) were defined within the research project named ENCLOSE (Energy Efficiency in city logistics services for small and mid-sized European historic towns; Ambrosino
et al. [
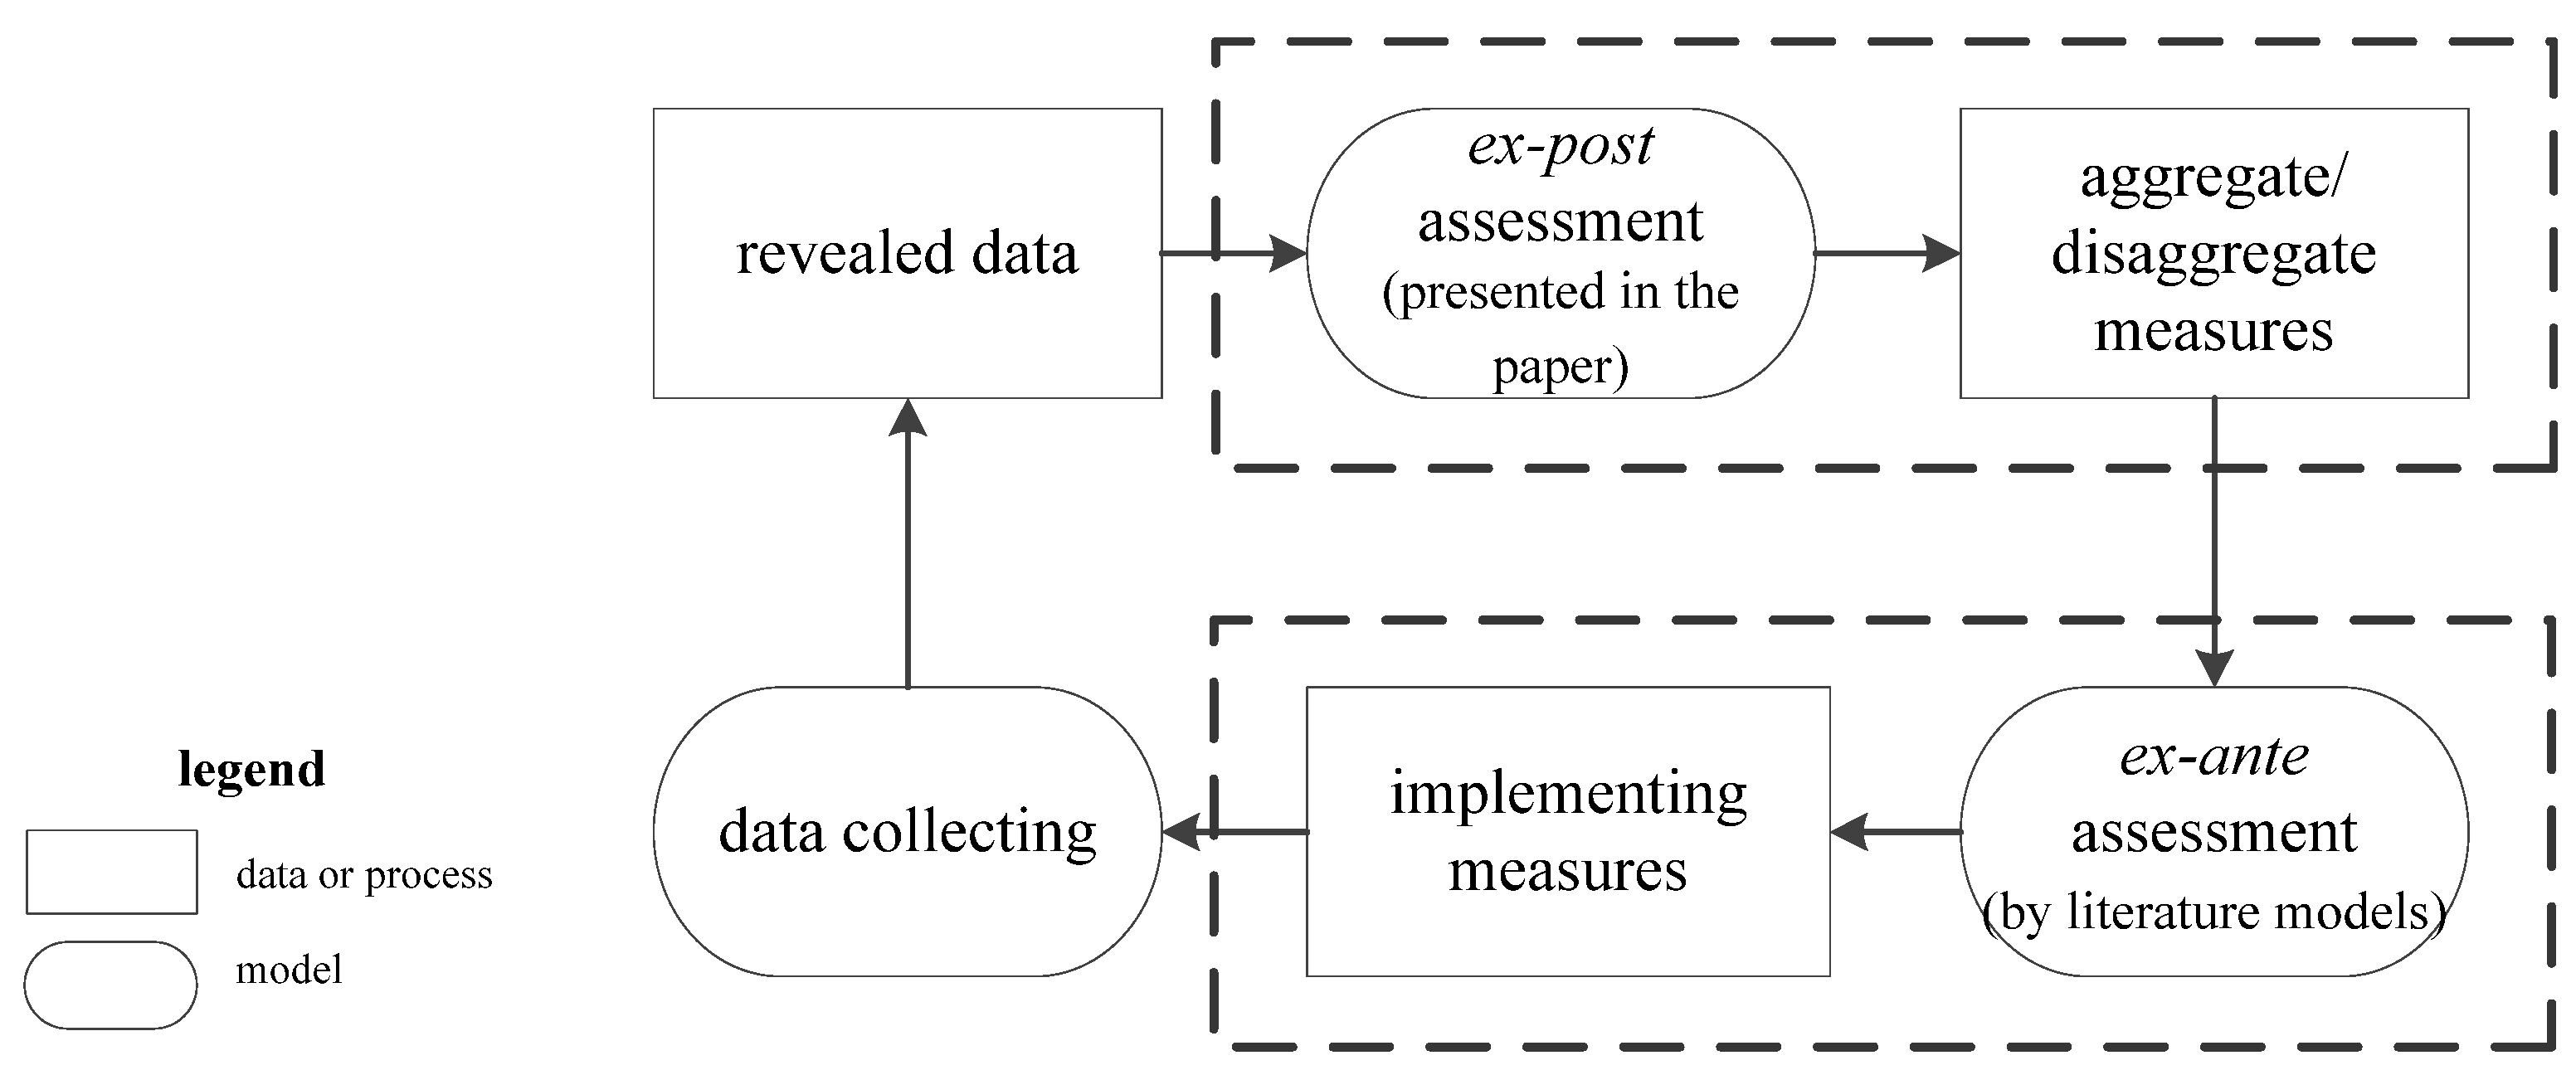
26]). Following Nuzzolo and Comi [
27] and Taniguchi [
28], to meet the EU environmental/green goals, the analysis of the freight mobility and the definition of city logistics design scenarios, which has to be assessed
ex ante, can be readily outlined as synthesized in
Figure 1.
Therefore, in a “what if” framework, the opportunity to have a first set of implementable measures according to environmental/green goals and city specificities can support planners in future scenario definition (e.g., giving indications on which measures are most suitable for city purposes). This first analysis was performed in terms of reducing carbon dioxide emissions. The results allowed a relationship to be defined among city logistics measures, the impacted population and reduction in CO
2 emissions that may be expected. For more details, refer to Russo and Comi [
29,
30]. Therefore, starting from these first results, the third macro-objective of the paper is generated:
i.e., to investigate the contribution of city logistics measures to improve environmental sustainability in European urban areas in terms of pollutant emissions. First, data from available
ex-post assessments are collected, and subsequently empirical relationships (
i.e., models to identify effect) among environmental/green revealed goal indicators (e.g., reduction in air pollutant emissions: CO, NO
x, SO
x, PM) and city logistics measures are proposed.
The paper is structured as follows:
Section 2 gives an overview of implemented measures and models to simulate urban freight mobility with the
ex-ante assessment procedure of city logistics scenarios;
Section 3 presents some environmental evidence from some European cities and indicative results; and in
Section 4 conclusions are drawn.
2. Urban Goods Movements and Feasible Measures to Achieve Sustainability
Several empirical studies carried out in French and Australian cities showed that urban freight vehicles account for 6%–18% of total urban travel (Schoemaker
et al. [
31]; Figliozzi [
32]; Nuzzolo
et al. [
33]) and for 14% of vehicle-kilometers, 19% of energy use and 21% of CO
2 emissions. Some studies have also evidenced the importance of light vehicles
vs. heavy in producing negative impacts within urban areas (Browne
et al. [
8]). Other studies have pointed out the use of electric or hybrid vehicles for finding solutions to reduce environmental impacts (Frevue [
34]; Van Duin
et al. [
35]; Faccio and Gamberi [
36]).
In some cases, it may be difficult to quantify impacts due to the implementation of the above measures, at least for two reasons. On the one hand, as agreed by several authors, the implemented measures have not yet been fully validated due to lack of interest by local authorities and have been mainly promoted as spot initiatives driven by specific local needs. On the other hand, there is a shortage of data. In few cases have comprehensive surveys been carried out (Browne
et al. [
37]; Holguín-Veras and Jaller [
38]; Nuzzolo
et al. [
33]).
In city logistics planning, the assessment of any scenario (
i.e., implementation of a set of measures) should be performed by evaluating,
ex-ante, some goal indicators that allow improvements to be achieved (Haghshenas and Vaziri [
39]). Therefore, analysis and classification of implementable measures have to identify straightforwardly the methods and models to be used for
ex-ante assessment. Thus, in the following, the city logistics measures are first briefly recalled (
Section 2.1); subsequently, the main requirements of models are identified (
Section 2.2).
2.1. City Logistics Measures
Urban freight transport, allowing products to arrive at end consumers, plays a key role in the maintenance of functions related to trade and city life. This is why it is necessary to find equilibrium solutions among:
an effective and efficient urban logistic system, and
a sustainable level of externalities due to traffic, mainly related to congestion and pollutant emissions.
An efficient urban logistics system allows us to move freight at decreasing prices, while the effective system is expressed by the stakeholders’ capacity to ensure freight delivery in terms of quantity, place, and time and to meet the customers’ requirements. The difficulty in managing such a system concerns the various stakeholders involved and the constraints dictated by the urban structure and high sprawl level of retail activities, and the existence of distribution process in which the recipient manages the last mile.
These objectives can be achieved by implementing different classes of city logistics measures. According to one of the objectives of this study (
i.e., an overview of city logistics measure outcomes that can be used in an
ex-ante assessment methodology for planning which measure—or set of measures—could work best in a given city in relation to the goals of environmental sustainability to pursue), a classification should allow us to analyze the city logistics measures in relation to:
who the decision-maker is (public authorities, private company, public-private partnership);
when, or which planning horizon is referred to (strategic, tactical, operative); and
why, or which class of outcomes and goals can be pursued by their implementation.
Although different classifications have been proposed in recent years, they have been mainly developed within the specific city logistics measure assessment process and usually present some shortcomings because their focus is mainly on the class of measures investigated, neglecting or classifying them into one or at most two classes. Therefore, some of them fail to clearly identify the above objective criteria that should be used during city logistics planning.
Table 1 summarizes these classifications, showing that the classification proposed by Russo and Comi [
4] could be preferable for the reasons listed below.
BESTFUS [
41], which can be seen as a follow-up and continuation of the COST 321 project [
44], highlights the importance of Urban Distribution/Consolidation Centers. Therefore, it envisages a specific class for UDC and includes all other measures in a large class that does not allow us to identify who has to comply with them or to identify their planning horizons easily. A similar shortcoming is in the classification adopted within the European research project City Port [
42]. Munuzuri
et al. [
43] classify, with respect to stakeholders and focusing on local administrators, because they are responsible for establishing city regulations regarding traffic and transport. Van Duin and Quak [
40] classify according to objectives, but consider only three classes that do not allow identification of the different planning horizons and of the different actors involved in their implementation. Russo and Comi [
4] use a classification organized for macro-actions and identify the sustainability outcomes that can be obtained by their implementation. This last type of class seems to be more suitable for the identification of direct impacts (both on actors—internal—and on collectivity—external) that could explicitly support the definition of planning horizons and the sustainable goals to pursue. Thus, in the following, this last classification is adopted.
The used classification of measures consists of four classes (referring to
Table 1):
material infrastructures, consisting of building new infrastructures to optimize freight transport (e.g., sub-network only for freight vehicles, loading and unloading zone, urban distribution center, nearby delivery area);
- ○
who: local government, logistics, and transport operators;
- ○
when: strategic (or tactical); and
- ○
why: to increase sustainability within the urban area through new linear and surface features to optimize freight transport; such infrastructure allows economic, social, and environmental sustainability to be improved;
non-material infrastructures, consisting, generally, of solutions related to research, learning and training, while the telematics in terms of Intelligent Transportation Systems (ITS; electronic access, traffic monitoring, traffic control, delivery bay booking and delivery tour planner) can also be considered;
- ○
who: local government, logistics, and transport operators;
- ○
when: tactical and operative (sometimes strategic, e.g., traffic monitoring, delivery bay booking); and
- ○
why: to improve effectiveness (in terms of high service levels) and efficiency (in terms of cost reduction) of logistics flows, and to reduce negative externalities, also improving enforcement efficiency and broadening the scope of enforcement;
equipment, consisting of the introduction of new standards for loading and transportation units (sustainable performance, railway);
- ○
who: public authorities, logistics, and transport operators;
- ○
when: strategic or tactical or operative; such types of measures can refer both to producers (involved in the design and realization of a new industrial system: strategic) or city managers interested in implementing limits related to current emission standards (tactical or operative); and
- ○
why: to optimize handling and transport by new low-emission vehicles (loading units); to reduce environmental impacts of transport units (e.g., reduction in truck emissions and use of electric vehicles, methane vehicles, metropolitan railways, trams);
governance, consisting of actions related to traffic regulations and limits (e.g., time windows, minimum load factor, switch from own account to third parties, traffic limits, area-pricing, and specific permission);
- ○
who: local government, logistics, and transport operators;
- ○
when: strategic or tactical or operative; and
- ○
why: to reduce the interference with other components of urban mobility and to reduce the number of driving vehicles.
The above framework mainly refers to specific measures and not to cross measures, such as measures related to promotion, cooperation and enforcement, which need different types of models to be assessed (Holguín-Veras [
45]; Silas
et al. [
46]). For more details on implementation steps and/or difficulties encountered, the reader can refer to the extensive literature on this topic (LEAN [
47]; Schoemaker [
48]; Dablanc [
49]; Browne
et al. [
37]; Straightsol [
7], and the references quoted therein).
2.2. The Modeling Framework for Ex-ante Urban Freight Scenario Assessment
Interest is growing in defining tools able to support decision-makers to understand the structure of the freight urban system and compute some indicators which allow its level of service to be determined against target and benchmarking values. Therefore, the city logistics scenario (
i.e., choice of a set of city logistics measures to be implemented) has to be based on design tools by simulating the main effects of an exogenously specified scenario (
i.e., what if approach). In these tools, the transportation models are characterized with respect to their base assumptions, whether they represent user behavior or whether they are only statistical relations. Thus, there are descriptive models (empirical relations between freight demand and variables of the economic and transportation system), and behavioral models, in which there are explicit hypotheses on the decision makers involved in the choice processes. It should be noted that, for some analytical functions, both models can have an identical form. A recent overview of how models allow analysts to obtain behavioral solutions from revealed data is given by Russo and Vitetta [
50] and Ortuzar and Willumsen [
51].
Therefore, a general demand modeling framework should allow us to simulate the choices of each decision maker (actor) involved in the urban freight transport and logistics, and to investigate how the policies and the subsequent measures can influence her/his choices.
However, starting from the statement that freight mobility concerns two different segments of mobility (
i.e., shopping and freight restocking) and that these two segments should be jointly analyzed as components of the same system, there are general modeling frameworks representing commodity flows as generated by end consumers’ requirements. The challenges to simulate actors’ choices through advanced discrete choice models pointing out the dynamic choices, the presence of ITS and the dispersion of taste have to be investigated as in the state of the art reviewed by Comi
et al. [
52]. They review models for the urban freight movements, mapping the behavior of the retailers and some aspects of the end consumers that generate freight movements in an urban context. Two macro-segments in the last miles of the freight supply chain have been identified, with the retail outlet as a decoupling point: the segment upstream, between firms, and the segment downstream, between the consumer and retailer.
The main characteristic of the above framework is the representation of the interacting behavior of commodity consumers and commodity suppliers/shippers/retailers. For a medium-size city, it could consist of two main levels, implemented within a disaggregated approach for each decision level (Russo and Comi [
53]):
commodity level (first level) concerning estimation of the quantity of Origin-Destination (O-D) flows; and
vehicle level (second level) that allows quantity flows to be converted to vehicle flows; the vehicle level through time and path macro-model provides the road link flows (for both passengers and goods vehicles) and then generates the input for analysis of transport externalities.
Commodity level consists of two macro models: attraction and acquisition. Its outputs are the goods quantity flows by end consumer and area. In particular, the attraction macro model allows us to investigate how city logistics measures, modifying the transportation attributes for passengers or the sales network, can change end consumer demand and, hence, the quantity of the attracted goods. On the other hand, the acquisition macro model mainly concerns logistics trips from the restocker’s standpoint, and serves to point out city logistics measures impacting on the generalized travel cost between acquisition and selling zones. For example, changes in generalized travel costs and area accessibility could push the retailer/wholesaler/producer to arrange a different transport service, e.g., toward a third party which, in general, is more efficient than own account operation.
Vehicle level consists of two macro models: service and path. Its outputs are the freight vehicle flows for zones, and path and link freight flows for a target time. In detail, the service macro model receives as input the demand in quantity for a macro area and gives as output the quantity for each consignment and zone and the vehicles needed for restocking. It also serves to point out the definition of trip chain, and how the implementation of city logistics solutions can modify the number of stops per trip chain, driving toward more efficient transport services in terms of transported load and generalized travel cost. For example, the interest in ITS can be used to improve route and trip planning as well as services provided to customers. In addition, this macro level allows us to take into account the impacts related to the implementation of city logistics measures affecting, for example, the following attributes: attributes specific to the generic stock zone, attributes specific to the freight type, and attributes of generalized travel cost regarding the disutility of transporting freight, sold in shops. The path macro model points out time and path models. In fact, the macro model receives as input the demand in vehicles and gives as output the departure/arrival time and path used; it can be both static and dynamic. With respect to the path model, it allows us to investigate which path is used for restocking the shops located within the study area. The path choice can be influenced by all the types of measures mentioned above (e.g., specific roads, traffic information systems, emission or weight limits, road pricing, delivery bay booking and delivery tour planner). Some measures could modify the expected generalized travel cost (e.g., travel time and cost) and others could suggest the use of specific roads.
3. Environmental Evidence from Cities
Starting from the
ex-post analysis of implemented city logistics scenarios in Europe in recent years, some environmental indicators will be proposed in order to support the definition of freight plans within the urban transport planning (SUMP [
25]). Moreover, since sustainable environmental transportation is difficult to measure directly, various performance indicators could be used to evaluate it. For example, pollutants can be measured directly or indirectly. In the following, the focus will be on direct (e.g., NO
x) measurement.
The goal indicators, obtained by each measure, are related to the impacted population and density of the investigated cities. In the following, the results are analyzed for both classes of measures (aggregate) and specific ones (disaggregate). This analysis should be considered only an overview of city logistics with respect to environmental/green outcomes. It could be a useful source of information to identify the measures which have the potential to be applied in a specific city in order to obtain the expected environmental/green goals. Subsequently, as stated, the defined future scenario has to be assessed through models and methods presented in the earlier sections in order to verify if the sustainability objectives are met.
3.1. The Sample Cities
To find possible relationships among city characteristics, city logistics measures, and environmental/green goal indicators (
i.e., reduction of CO, NO
x, SO
x and PM), in-depth desk-research was carried out beginning from the extensive literature on city logistics measures (e.g., Schoemaker [
48]; Patier [
54]; Quak and de Koster [
55]; Sathaye
et al. [
56]; Browne
et al. [
57]; Sugar [
5]; Van Duin
et al. [
35]; Straightsol [
7], Taniguchi and Thompson [
58] and references quoted therein) in order to select the city sample where pollutant reductions were measured after the implementation of such a city logistics scenario. In particular, the cities were selected according to the following three criteria:
- (1)
measures univocally classifiable according to the classes of the chosen classification (see
Section 2.1); therefore, cities where cross measures were implemented were not considered in the following analyses;
- (2)
an environmental ex-post assessment was performed and more than one environmental indicator (i.e., reduction in the above pollutants) was computed (measured); visual and noise impacts, and relative indicators were hence neglected; and
- (3)
cities (or better areas where the measures were implemented) can be considered homogenous in terms of economy and land use.
Table 2 lists the investigated cities (or areas of the cities, e.g.,
city centers) with the impacted population and relative spatial density. Generally, in an implemented plan there is a city logistics scenario defined as a mix of the measures recalled above. Thus, it becomes very difficult to identify and quantify specific measure goal indicators. Thus, only the cities where the goal indicators related to a given measure can be extracted with good approximation were considered. Moreover, the city center is affected by both passenger and commercial vehicles, but the local administrators often implement the city logistics scenario without changing passenger regulations. Therefore, the goal indicators related to freight due to implementation of the city logistics scenario can be estimated.
Additionally, according to criterion three, it should be pointed out that, in the paper, the analysis mainly refers to European cities and to urban structure typically found in Europe and in the east coast of North America (USA and Canada) and Australia. Although, worldwide, there are very different urban structures characterizing the megalopolises of countries such as China, India, Central and South America, and Africa, that differ from European cities (in terms of population and area), many of the results presented in the paper can be extended to other metropolises that can be considered extensions of cities.
Starting from the
ex-post assessment carried out in the European cities investigated, as previously detailed, this paper seeks to provide an overview of city logistics environmental outcomes that could be useful for local administrators and city planners when dealing with specific problems related to environmental issues due to freight transport (
Figure 1).
The environmental tested outcomes (
Yz) of air pollutants (
z) were modeled through regressive models, in which
Y (dependent variable) was estimated as follows:
where
Xz,j is the j-th independent variable for each observation (e.g., city impacted population);
εz is the error term; and
βj is the j-th parameter to be estimated.
Such models were estimated according to four types of air pollutants: SO
x, NO
x, SO
x, and PM). The reported models were calibrated employing the generalized least squares (GLS) method. First, the tested environmental outcomes (e.g., monthly reduction) of air pollutant
z were obtained from survey (
), and then the parameters (
β) were estimated solving the following expression:
The ability to reproduce the revealed observations was measured by the coefficient of determination R2 (R2 = 1 – SSE/SST, where SSE is the sum of square errors and SST is the total sum of squares).
3.2. The Aggregate Ex-post Goal Indicators
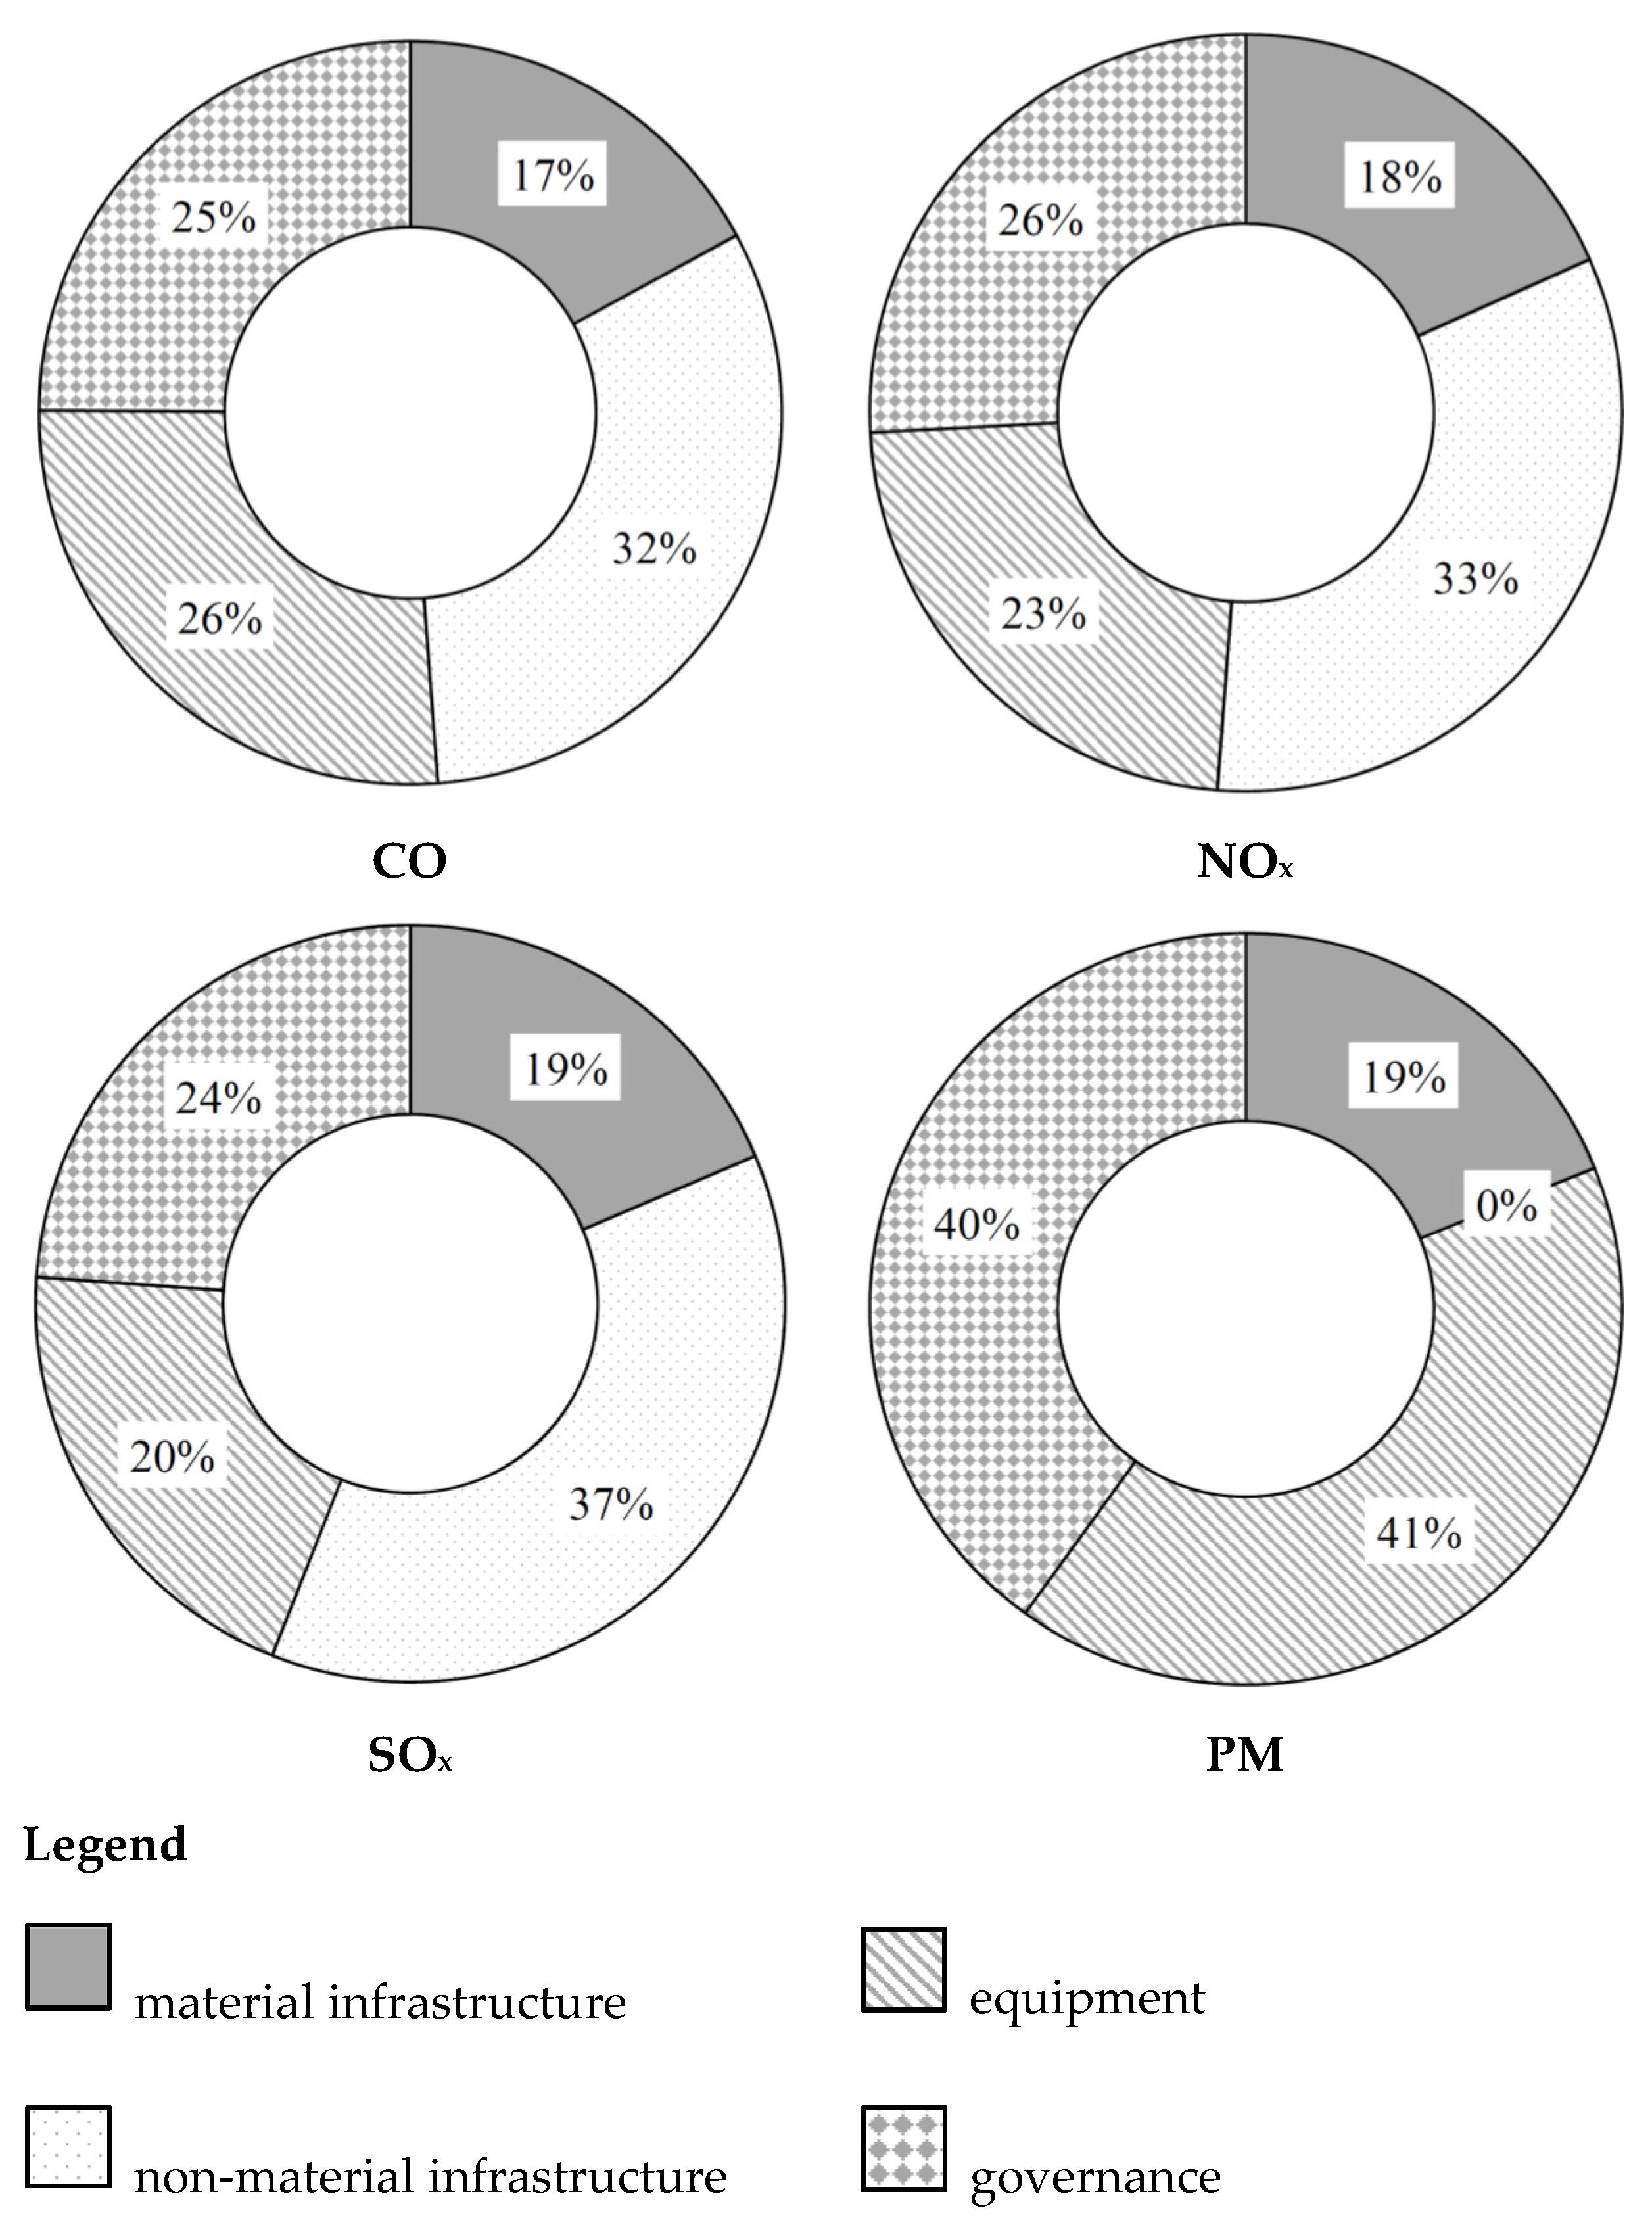
According to the classification chosen above, the monthly reduction in pollutants was investigated for the following set of aggregate measures: material infrastructures (i.e., sub-network, urban distribution center and nearby delivery area), non-material infrastructures (i.e., intelligent transportation system), equipment (i.e., sustainable performance and railway), and governance (i.e., time windows and area-pricing).
The monthly reduction aggregate index (
IPz) of air pollutant (
z) was expressed as follows:
where
ROPz is monthly reduction of air pollutant (
z),
POP is the impacted population (expressed in million),
Xh is a dummy variable specific for each aggregate set of city logistics measures
h, and
βh,z are the parameters to calibrate. The considered air pollutants
z are: CO, NO
x, SO
x, and PM.
The calibration results for the above models are reported in
Table 3. Data from the cities explained in
Table 2 were used. All parameters have the expected signs and most of them are statistically significant as demonstrated by high value of
t-student. The value of
R2 is quite good. Parameter analysis allows the four measure classes to be compared. No available data were found for PM reduction due to ITS implementation.
The material infrastructures measures produce averagely not good measured results. Probably, this is due to the long time that it takes to complete the infrastructures and hence the dispersion of the results in time. The best results could be obtained by implementation of governance measures as well as time windows and area-pricing, and non-material ones. This analysis does not consider the investment costs, but it has to note that the investment costs are one of the most important factors for city logistics measures assessments, in this way this analysis belongs to the class of output oriented ones. Different analyses are in progress in order to study the relationships between city logistics goal indicators and investment costs that belong to input-oriented ones. On the other hand, a first model (relationship) based on the large recognized magnitude of the implementation costs can be given. Thus, considering as reference costs those due to governance measure implementation, material and equipment measures can be supposed to be about 100 times higher, while non-material ones have intermediate costs that can be reasonably hypothesized to be 10 times higher. Therefore, scaling the obtained results, the governance measures appear to be the best performing. Additionally, they are, in general, easy to implement, while the material measures remain those that have the highest costs with lower evidenced environmental goal indicator values. In addition, they could require a long time to implement and hence a long time would be required before obtaining results. Besides, referring to PM reduction which remains one of the main objectives promoted by the European Commission for improving the city environment (White Paper [
59]), as well as the governance measures, the equipment measures could produce good goal indicators also driven by the statement that the city fleet mainly consists of diesel vehicles (Browne
et al. [
8]; Nuzzolo
et al. [
33]), that are the main sources of PM emissions.
Figure 2 reports the results obtained in terms of revealed environmental goal indicators and allows the four classes of measures to be compared, showing how material infrastructure measures produce on average results which are poorer than the others. The planners from the results, pictured in
Figure 2, have an overview of the environmental outcomes of city logistics measures, which provides the average contribution of each class of measures in relation to the environmental sustainability goals. It may be noted that the incidence of non-material infrastructure to obtain a reduction of one unit of air pollutant is always higher than 32% (
i.e., 7.03/22.14), while the best performing results seem to be obtained by governance measures.
3.3. The Disaggregate Ex-post Goal Indicators
Subsequently, each specific implemented measure was analyzed in depth. A monthly reduction disaggregate index (
IRz) was calculated as follows:
where
IRz is the natural logarithm of monthly reduction of air pollutant
z (
ROPz, see Equation (1) with respect to spatial density (
DS) of the given city, in the zones involved by relative city logistics measures.
Then, for each city (or areas of the city) of
Table 2, the
IRz index was calculated. This
IRz index was then specified as a linear combination of dummy variables specific to each city logistics measure
k,
Xk, as follows:
where
βk,z are the set of parameters to calibrate. The results are reported in
Table 4, referring to measures of
Table 1.
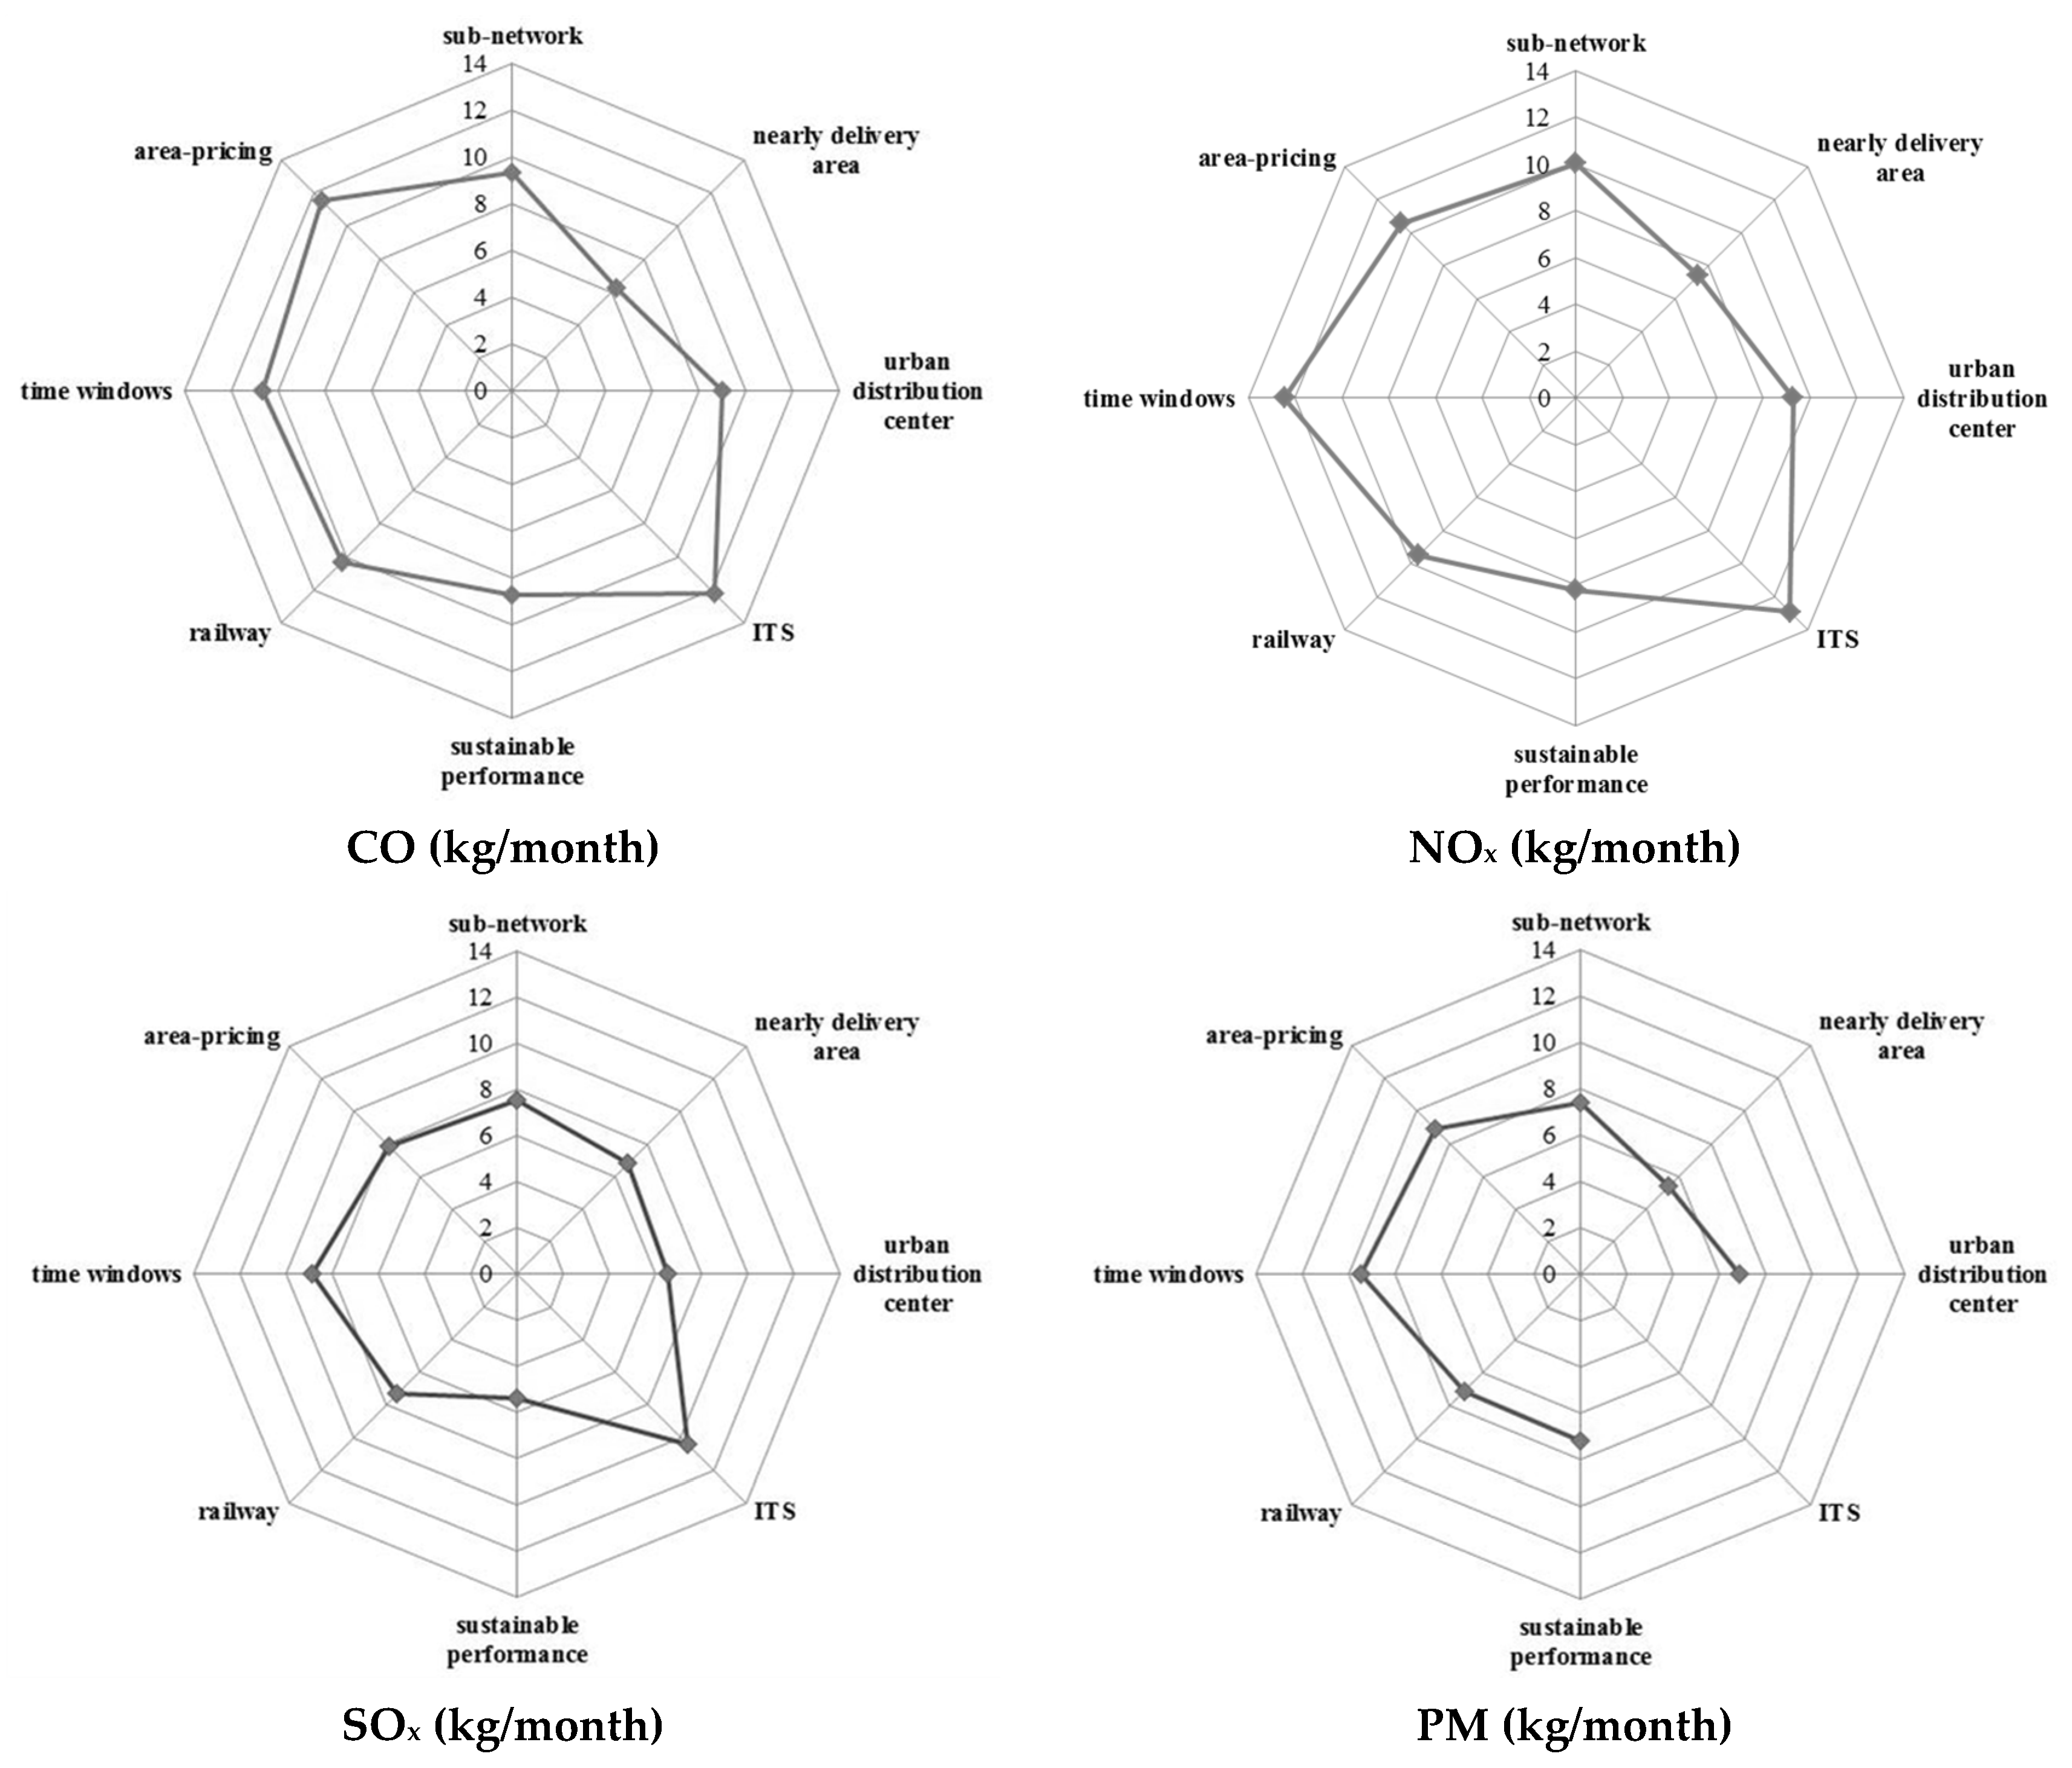
The value of R2 is good and all parameters have the expected signs, most of them being statistically significant as demonstrated by the high value of t-student. Given a city, the best results in terms of index reduction could be obtained by sustainable performance, ITS, and time window measures. The lower values refer to material infrastructure measures that, as previously discussed, also require high investments and long times for their construction/implementation.
The results show the differences in the index among the analyzed city logistics measures; the material infrastructure (i.e., urban distribution center and sub-network) and equipment (i.e., sustainable performance) measures produce a lower reduction in index than do other classes of measures, confirming the aggregate results. The non-material measures as well as governance measures allow greater reductions to be obtained.
The analysis also confirmed that governance measures have positive effects on pollutant emissions. In fact, they could push actors toward more environmentally efficient patterns, i.e., improving load factors, moving away from peak hours with a subsequent increase in commercial speed and reduction in interference with other mobility components, using third party services that generally perform better.
The results are plotted in
Figure 3, showing the incidence of reduction of externalities that can be obtained by a given measure in relation to a generic city. The diagrams show that, starting from the equipment measures (sustainable performance) toward higher-sustainable performance measures (railway), the higher monthly reductions of air pollutants could be obtained by governance measures (
i.e., time windows or area pricing) and ITS. These last measures are those that also present the intermediate level of investment costs. With this respect, much attention should be paid to the relative comparison among the different types of measures. For example, measures classified as material could seem non-relevant with respect to ITS or governance measures but, due to the time required for their implementation, the effects could be dispersed and their success could be affected by some context changes that could alter their outcomes. Additionally, these types of measures are usually implemented for historic, tourist, or business areas of the cities and, hence, their results could be penalized in the presented analysis.
The environmental/green outcomes investigated confirm that there is considerable diversity in city logistics measures with respect to results to be obtained (e.g., material vs non-material measures and ITS vs. nearby delivery area). As also emerged from the reviewed studies, each city decides the measures to implement without considering that each measure works better with respect to a given environmental goal and without assessing, ex ante, their effectiveness.
An important finding in this study is that the percentage of pollutant reduction could depend on the city characteristics (
i.e., large or small centers in terms of impacted population and relative density), which may justify different city logistics measures with respect to the pollutant outcomes to pursue. As the city size increases, so does the length of delivery tours, measures that provide two-tier systems should be preferred (e.g., urban distribution/consolidation centers or nearby delivery areas). Indeed, as demonstrated by other studies (Nuzzolo
et al. [
33]) the total travelled distance can be reduced (
i.e., implementation of city distribution centers or transit points). Furthermore, in large areas, good results could also be obtained by material measures although they are fairly penalized by the above results presented. In the small centers (or neighborhoods), governance and non-material measures that push toward third party transport should be implemented. Indeed, the hypothesis here is that third party transport is more efficient.
This study also confirms that little attention has been paid to the end consumer’s role in urban freight transport. Indeed, the reviewed measures were mainly implemented focusing on distribution activities, neglecting that the impacts of end consumer mobility related to shopping could be higher than those of restocking. For example, the changes in their socio-economic characteristics (e.g., increasing age, availability of private transport) and their purchasing behavior (Russo [
60]) could be considered and the measures to be implemented should consider both components jointly in order to have the better possible environmental/green outcomes. Therefore, a city logistics scenario (
i.e., set of measures) to be implemented should move from these statements, identifying and incorporating stakeholder concerns and needs in the city logistics decision-making process (
i.e., public engagement; Cascetta and Pagliara [
61]).
4. Conclusions
This study focused on environmental/green goals to be achieved by implementing city logistics measures. In-depth analysis was conducted in terms of direct revealed goal indicators relative to air pollutants. The indications of this study can be considered a useful environment city logistics measure overview for: city authorities, when designing measures, need to verify whether their expected results match the results obtained in other cities in the way of defined goals; and experts, when designing and assessing city logistics scenario and needing to identify who must take decisions or who has to abide by them, with strong references to the goals of sustainability. Additionally, they could be interested to ascertain whether a successful approach in one city can be transferred to another and whether the necessary conditions and organizations required for such an approach are already in place.
Such an analysis could contribute to more effective and rational planning process, helping city planners or administrations to select the more expected performing environmental/green measures according to the main city characteristics. Therefore, the proposed analysis may be a useful pre-guide when there is the need to ascertain whether a successful approach in one city can be potentially transferred to another.
It should also be stressed that governance measures have positive effects for city users (e.g., end consumers), but they are often rejected by logistics operators because they could be led to think that such measures might increase transportation costs. Thus, it is important to recognize and understand the concerns of different actors with respect to urban freight transportation in order to introduce city logistic policies successfully.
While some measures are easier to implement and at least show a higher degree of acceptability among stakeholders, they could require a sound surveillance system to enforce compliance. For this purpose, a consultation forum or public-private partnership should be pursued. In this context, the concept of a living lab could also be considered, a forum in which to integrate people into the entire development process as urban freight transport process.
According to these first results, although some evidences were analyzed, the result of transferability in terms of environment issues is not direct, and city-specific surveys could be needed. The general conclusion is that a more systemic approach has to be used in assessing city logistics, seeking to define a more structured process where the key-role is played by the selection of city logistics measures in defining a future scenario and by ex-ante assessment tools. Results such as those reported in this paper can contribute to more effective and rational management of resources.
Further analyses are also in progress to improve these first results, developing other analyses through the inclusion of other city attributes (e.g., number and types of shops) in order to take into account other factors that describe urban freight transport. Furthermore, a comparative analysis between the degree of transferability of the models and the final accuracy achieved with them is under development.
Finally, other developments could aim to improve the presented results and investigate other fields of environmental sustainability, such as noise, view, and so on.


