1. Introduction
Owing to the impacts of climate change and increasing human activities, global drought events have become larger and more frequent [
1]. As a large, agricultural country, China’s agricultural production and food security are directly threatened by drought [
2]. Statistics from the Bulletin of Flood and Drought Disasters in China show that, from 1950 to 2007, national agricultural drought disasters affected an average of 21.73 million ha per year, and annual food losses due to drought were up to 15.8 billion kg, accounting for more than 60% of total grain losses from all natural disasters combined. It is clear that worsening drought has become a major threat to China’s sustained, stable, high agricultural yields and an important factor constraining the sustainable, rapid and healthy development of its agriculture [
3,
4].
Due to the negative impacts of droughts and comprehensive understanding of the concepts, definitions of drought have caused extensive concern [
5,
6,
7,
8,
9,
10]. The various descriptions all directly or indirectly reveal water deficit as the essence of drought. However, there is no consensus definition of drought. The current drought is regarded as natural factors and human activities, rather than a single natural phenomena. Drought tends to be the deficiency of precipitation causing a side impact on the society, economy and environment in a period of time [
11]. On this occasion, drought is generally classified into four categories, including meteorological drought, hydrological drought, agricultural drought and socio-economic drought [
12]. In order to quantitatively analyze and predict drought, models applied in monitoring and forecasting have been developed [
13,
14,
15,
16,
17,
18,
19,
20,
21,
22], as well as land data assimilation systems for drought modeling [
23,
24]. Among the four types of droughts mentioned above, agricultural drought is influenced by natural factors, as well as human factors, becoming one of the most complex kinds of drought. In this paper, drought refers to a period with declining soil moisture and consequent crop failure without any reference to surface water resources [
12].
Agricultural drought monitored by remote sensing monitoring and meteorological monitoring is a major field of current study. The remote sensing approach plays an important role for a wide range, long period and dynamic drought monitoring. Related studies achieved agricultural drought monitoring in a large scale through using a remote sensing inversion model based on the moisture in the soil and vegetation [
25,
26,
27,
28]. The meteorological monitoring method is performed by statistically analyzing the meteorological data from meteorological sites [
29,
30], in order to describe the time succession characteristics and development trends of agricultural drought according to the statistical characteristics of drought. Drought indexes, such as the Palmer drought severity (PDSI) [
31,
32], a standardized precipitation index (SPI) [
33,
34], the relative moisture index [
35] and negative precipitation anomaly percentage [
36], are used to analyze and monitor both the meteorological characteristics of agricultural droughts and the regularity of agricultural drought disasters. On this basis, some scholars have concluded that crops are directly threatened by agricultural drought [
37,
38,
39]. Moreover, with the further cognition of the crop drought mechanism, crop model research has made considerable progress in aspects of quantitative evaluation of agricultural drought [
40,
41,
42,
43]. Such studies essentially examine natural background conditions. At the same time, human activities increase, ameliorating or preventing drought, making drought an event that is heavily affected by social factors. As a result, many studies have evaluated agricultural drought and drought disasters considering both natural and socioeconomic factors. Wilhelmi
et al. [
22] selected multiple indicators, such as climate, soil, land use and irrigation, and adopted an improved numerical weighting method to evaluate the agricultural drought vulnerability in Nebraska and to create a vulnerability distribution map. Shang
et al. [
44] proposed diagnosing the agricultural drought system vulnerability and established a drought vulnerability evaluation index and model based on agricultural production processes to assess drought vulnerability, using Xingtai County as an example. Shang
et al. [
45] explored the issue of agricultural drought system recovery. They proposed a restoration evaluation framework, establishing a comprehensive index model by selecting factors, such as land resources, crop structure, rainfall, irrigation and productivity level, in order to evaluate the drought resilience in Xingtai, Hebei Province.
In China, scholars have emphasized an important concept in agricultural drought systems: agricultural drought resistance. This resistance is the ability of humans to prevent potential hazards for crop growth caused by drought through their own activities and to reduce the impacts of agricultural droughts [
46]. There is relatively little international research on the assessment of agricultural drought. Most research focuses on the natural, social and economic factors affecting agricultural drought resistance, selecting several evaluation factors to build an index system and then conducting a quantitative evaluation of the agricultural drought resistance [
47,
48,
49]. However, we believe that research into agricultural drought resistance still has some unresolved issues: (1) Studies on crop droughts have been extensive, but the diversity of crops and complex phenology mean that the study objectives have been too targeted. Temporal and spatial scale restrictions have made it inconvenient to carry out and promote research on a large, regional scale; (2) Of the current studies on agricultural drought resistance, some have quantitatively evaluated the risk of agricultural drought disasters using various factors, such as precipitation, evaporation and soil humidity, based only on natural conditions. Some have been confined to indexes related to regional conservancy projects to analyze and evaluate the drought resistance qualitatively or quantitatively. However, in studies that consider both natural and socioeconomic factors, the natural background of agricultural drought was brought into the evaluation index system only as a general indicator, which, to a certain extent, weakened the influence of natural elements on agricultural drought resistance; (3) Most research has selected only a single agricultural or administrative region at a small or medium-sized spatial scale as the study area; large-scale research has been rare. In particular, the evaluation of the agricultural drought resistance of the main grain-producing areas and comparative studies of multiple areas have seldom been reported.
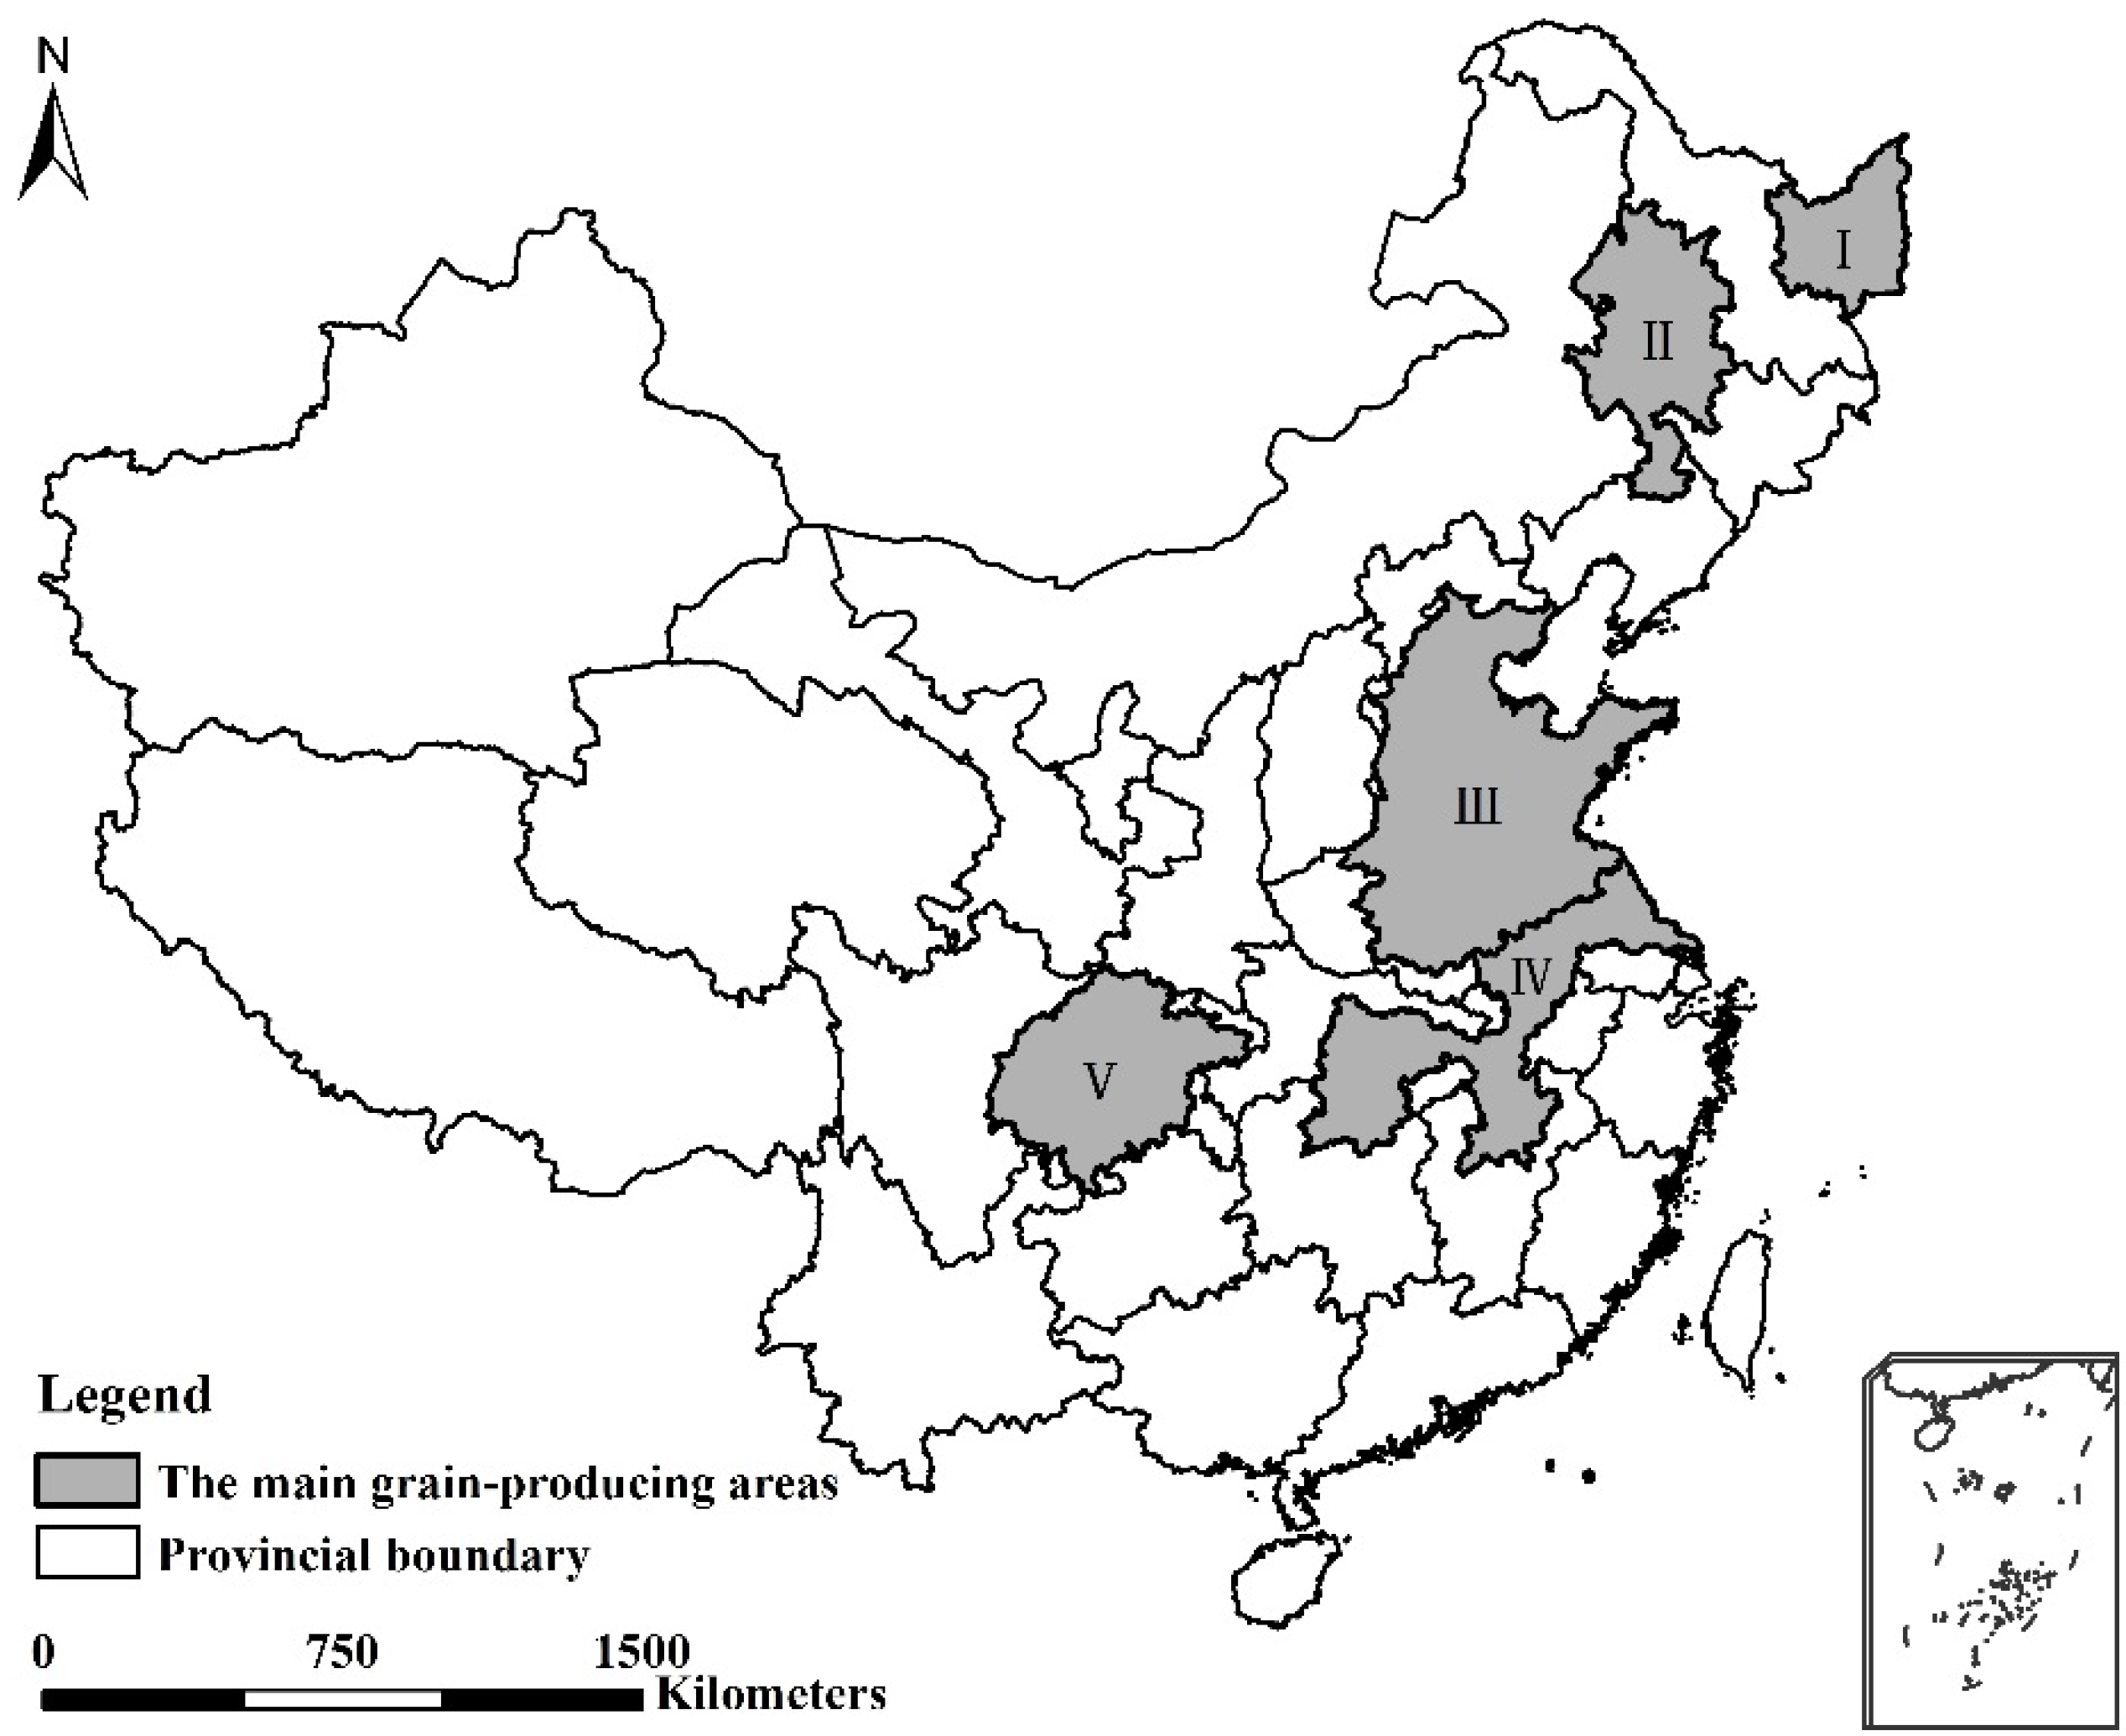
In recent years, drought disaster areas have extended from western and northern regions to eastern and southern regions, covering several of the main grain-producing regions in China. The Sanjiang Plain (I), Songnen Plain (II), Huang-Huai-Hai Plain (III), middle Yangtze River and Jianghuai region (IV) and Sichuan Basin (V) are the five main grain-producing regions in China. These areas play a major role in Chinese agriculture, including the 12 main grain-producing provinces across the country. Statistics from the Chinese Farming Information Network (
http://www.zzys.moa.gov.cn) [
50] show that the crop planting area of these five regions accounts for 69.07% of all cropland in the country, and they produce more than 70% of the national yield. These regions account for 72.6%, 77.37% and 69.10% of the total planting area of the main food crops of wheat, rice and maize, respectively, and they account for more than 70% of total yields. Thus, crop growth and agricultural drought conditions in the main grain-producing areas directly affect national food security. The aim of this study was to conduct a comprehensive evaluation of the agricultural drought resistance of the five main grain-producing regions by building a suitable index system in order to completely and objectively depict the spatial differences in the comprehensive agricultural drought resistance of the five main grain-producing regions and to provide scientific information to formulate drought defense and relief for these areas.
3. Results
3.1. Comprehensive Analysis of Agricultural Drought Degree
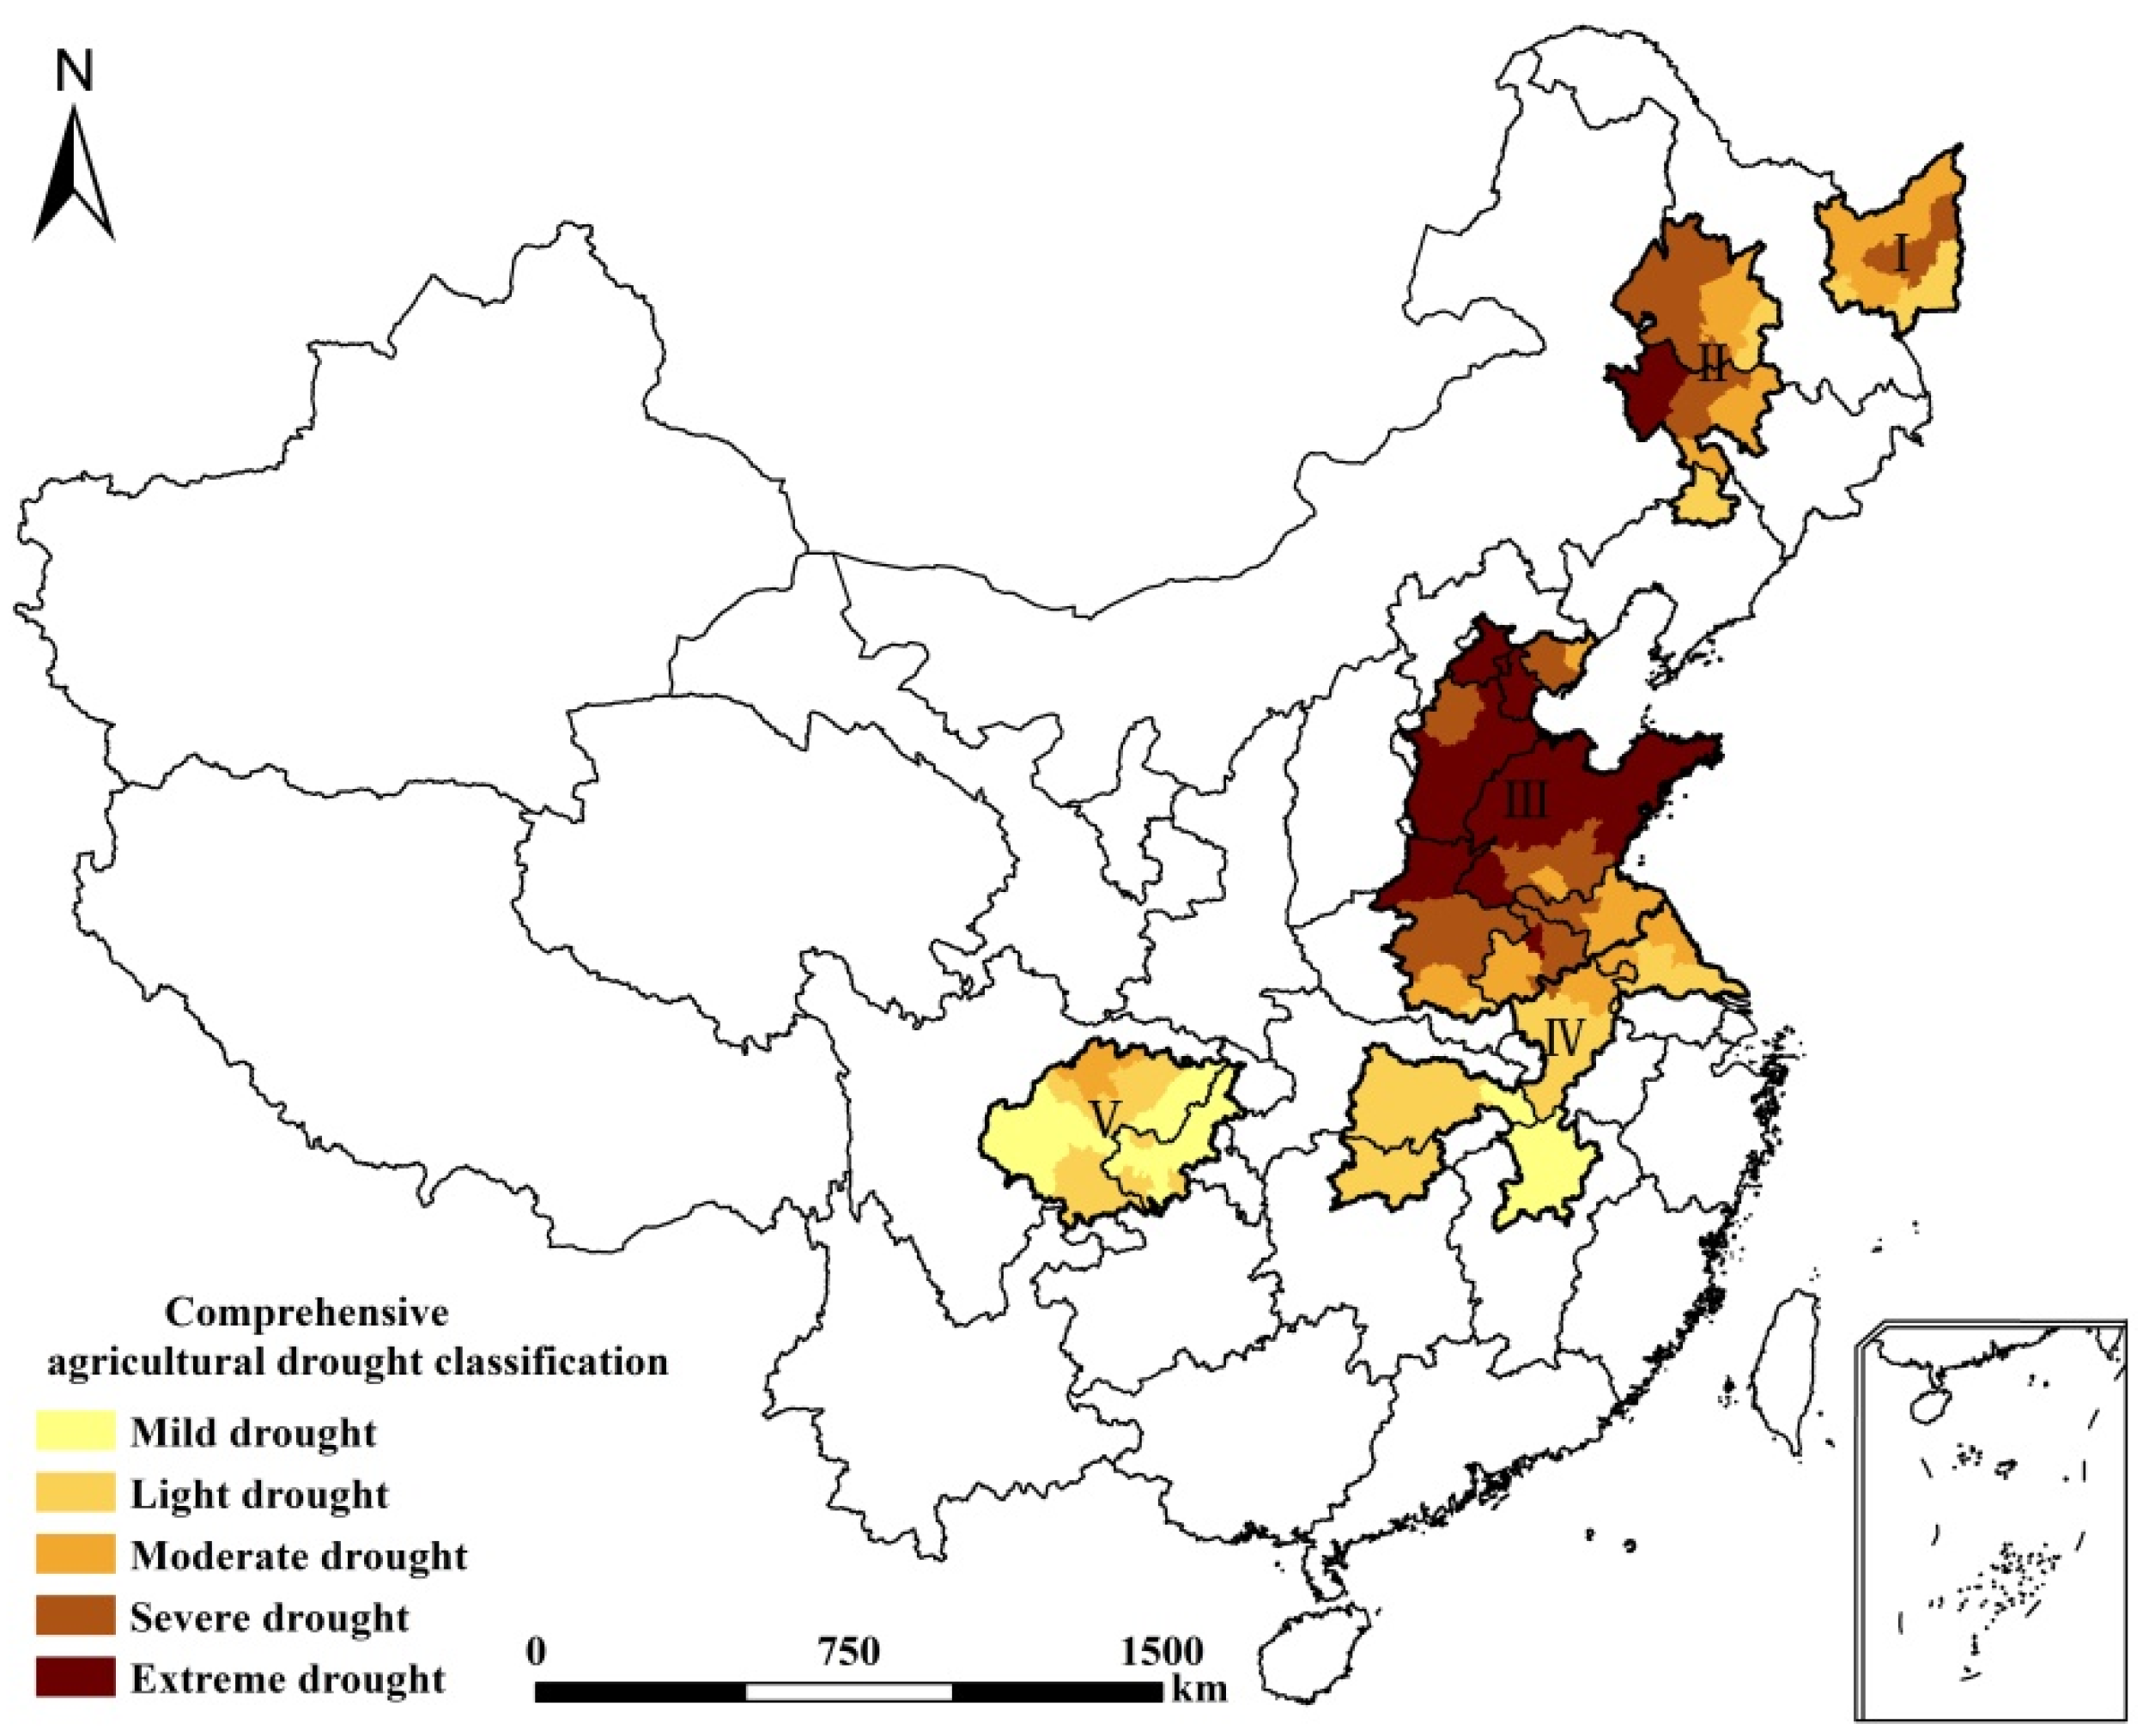
The comprehensive agricultural drought situation of the five main grain-producing areas is shown in
Figure 2 and
Table 3. In the Sanjiang Plain, 55.33% and 24.74% of the area were defined as having moderate and light drought, respectively, and another 21.93% of the area had severe drought. In this region, the drought degree of wheat was most serious, experiencing primarily severe and extremely severe drought, and the drought degree of maize and rice was mainly moderate. Compared to the Sanjiang Plain, the drought degree of the Songnen Plain was more serious. In the Songnen Plain, more than 50% of the area experienced severe and extremely severe drought and 28.22% had moderate drought, and the drought degree of spring wheat and rice could not be overlooked. In the Huang-Huai-Hai Plain, where the drought degree was worst, more than 90% of the area had more than moderate drought, of which 29.98% was severe and 53.90% was extreme, all of which severely impacted crop growth. In addition, the drought degree of winter wheat was highest in the Huang-Huai-Hai Plain. The middle Yangtze River and Jianghuai region did not exhibit extreme drought; and more than 65% of the area had light drought, and less than 1% had severe drought. Moderate and light levels were the most common drought degree of winter wheat and late rice, and the lightest level was most common for early rice. In the Sichuan Basin, agricultural drought was the lightest of the five main grain-producing areas. It had only moderate and lighter drought, mainly mild, which comprised 55.72% of the area, and the drought degrees of all crops were mainly light or below light.
3.2. Evaluation of Agricultural Drought Resistance
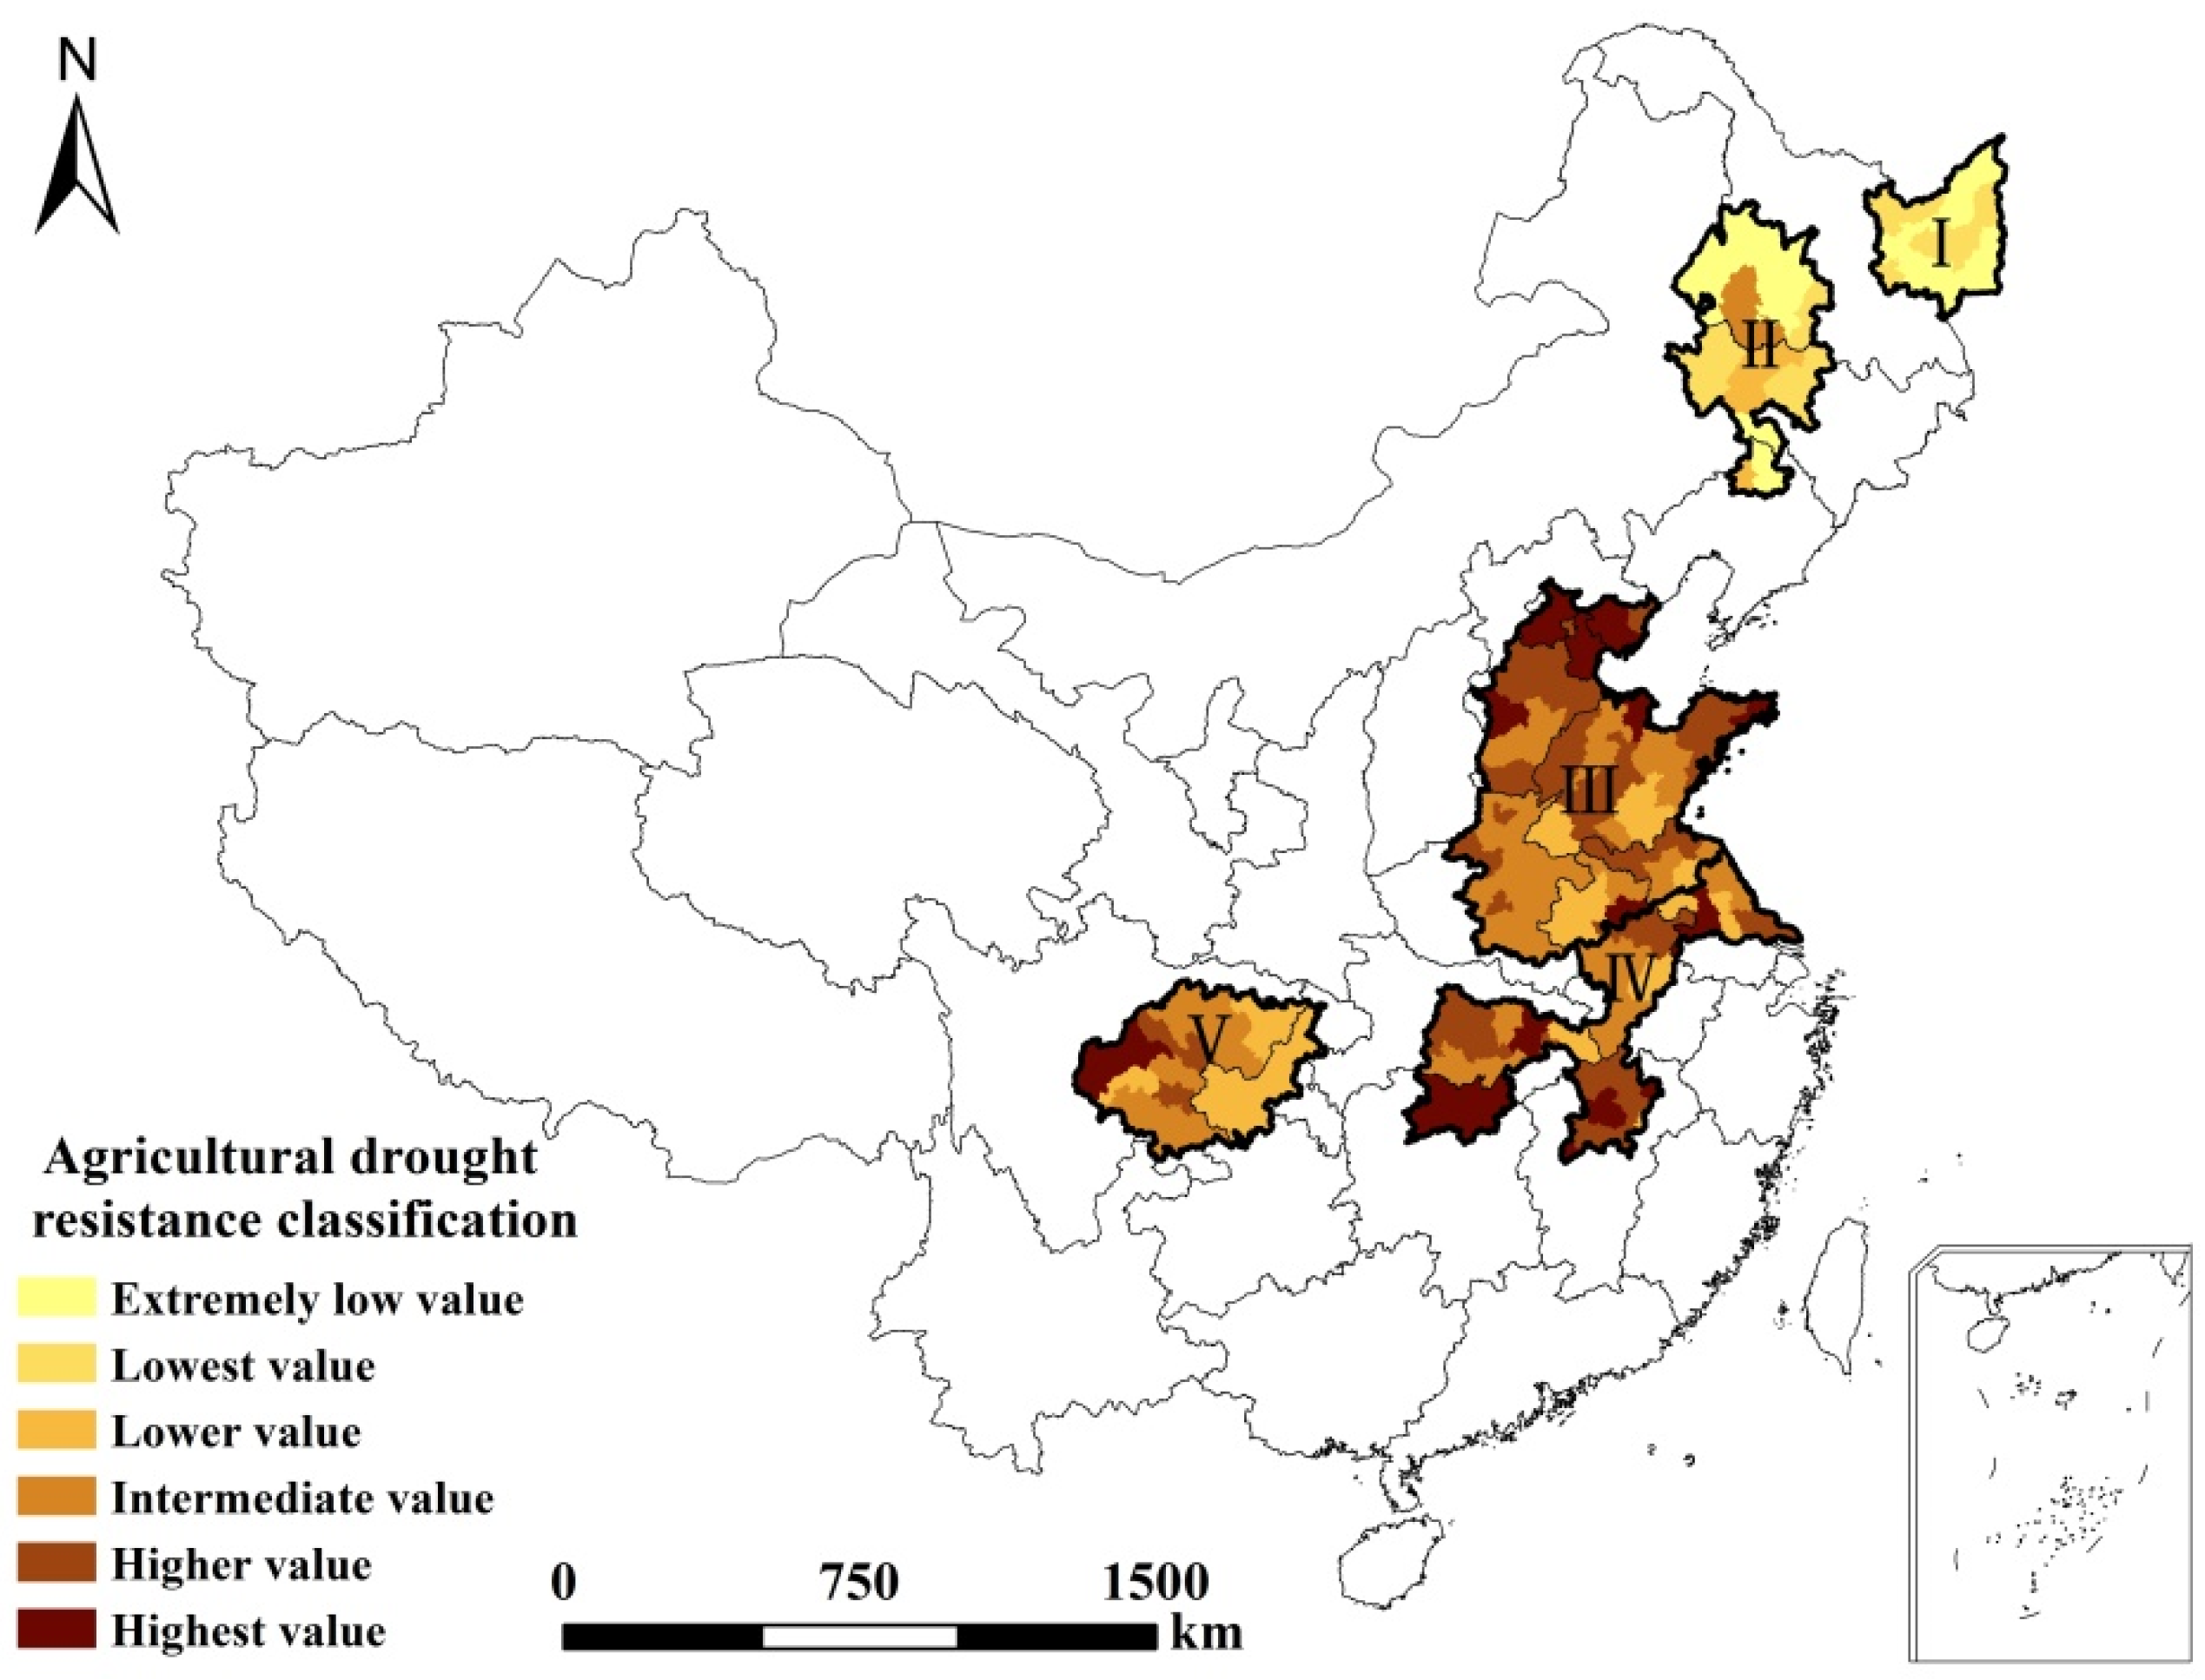
According to our results, we statistically determined the hierarchical proportion of each indicator in the five main grain-producing areas to produce a map of agricultural drought resistance based on the comprehensive evaluation score of cities in the study area. The difference in agricultural drought resistance in the five areas was striking (
Figure 3).
The agricultural drought resistance of the Sanjiang and Songnen Plains was clearly weaker than that of the other three areas. The entire Sanjiang Plain exhibited the lowest and extremely low drought resistance. In the Songnen Plain, the proportion of the area with resistance below average was more than 85%, forming a concentric distribution in the area. Neither region had areas with higher or the highest values. In both areas, the rate of efficient irrigation was less than 30%, the lowest rates among the five areas. The agricultural machinery dynamic coefficient and the expenditures on agroforestry and water transactions were also the lowest among the five areas. Meanwhile, the ratio of water-intensive crop area to low water-demand crop area was very high, and the pressure of agricultural water demands was the highest; thus, drought disasters were deemed most likely to occur in these two areas.
In the Sichuan Basin, the agricultural drought resistance was also weak. The proportions of areas with lower and intermediate resistance were 38.52% and 39.61%, respectively, dispersed mainly in the east and center of the basin. The areas with the higher and highest values were mainly concentrated in the middle and northwest of the basin, with proportions of 9.02% and 12.55%. The soil drought resistance of the Sichuan Basin was the strongest of the five areas, and there was less pressure from crop water demands. However, the rate of efficient irrigation and the agricultural machinery dynamic coefficient were lower than in other areas. The expenditures on agroforestry and water transactions totaled less than 10,000 yuan per ha, and the per capita GDP was the lowest among the five areas.
In the Huang-Huai-Hai Plain and the middle Yangtze River and Jianghuai region, the proportion of areas with higher and the highest agricultural drought resistance was more than 50%. In the Huang-Huai-Hai Plain, the areas with the highest agricultural drought resistance were mainly situated in the north, and there was a weakening trend from north to south. The middle Yangtze River and Jianghuai region had the strongest agricultural drought resistance among the five areas, due to the proportion of areas with the highest agricultural drought resistance reaching 25.76%. For the above two areas, the rate of efficient irrigation is generally high, and the agricultural machinery dynamic coefficient and level of GDP per capita are higher than in the other areas. In addition, the middle Yangtze River and Jianghuai region has a lower crop water demand and a higher expenditure on agroforestry and water transactions. In the Huang-Huai-Hai Plain, the soil drought resistance is weaker, and the pressure from agricultural water demands is higher, which adversely affects the overall agricultural drought resistance.
3.3. Analysis of Comprehensive Drought Resistance Based on Background Agricultural Drought Levels
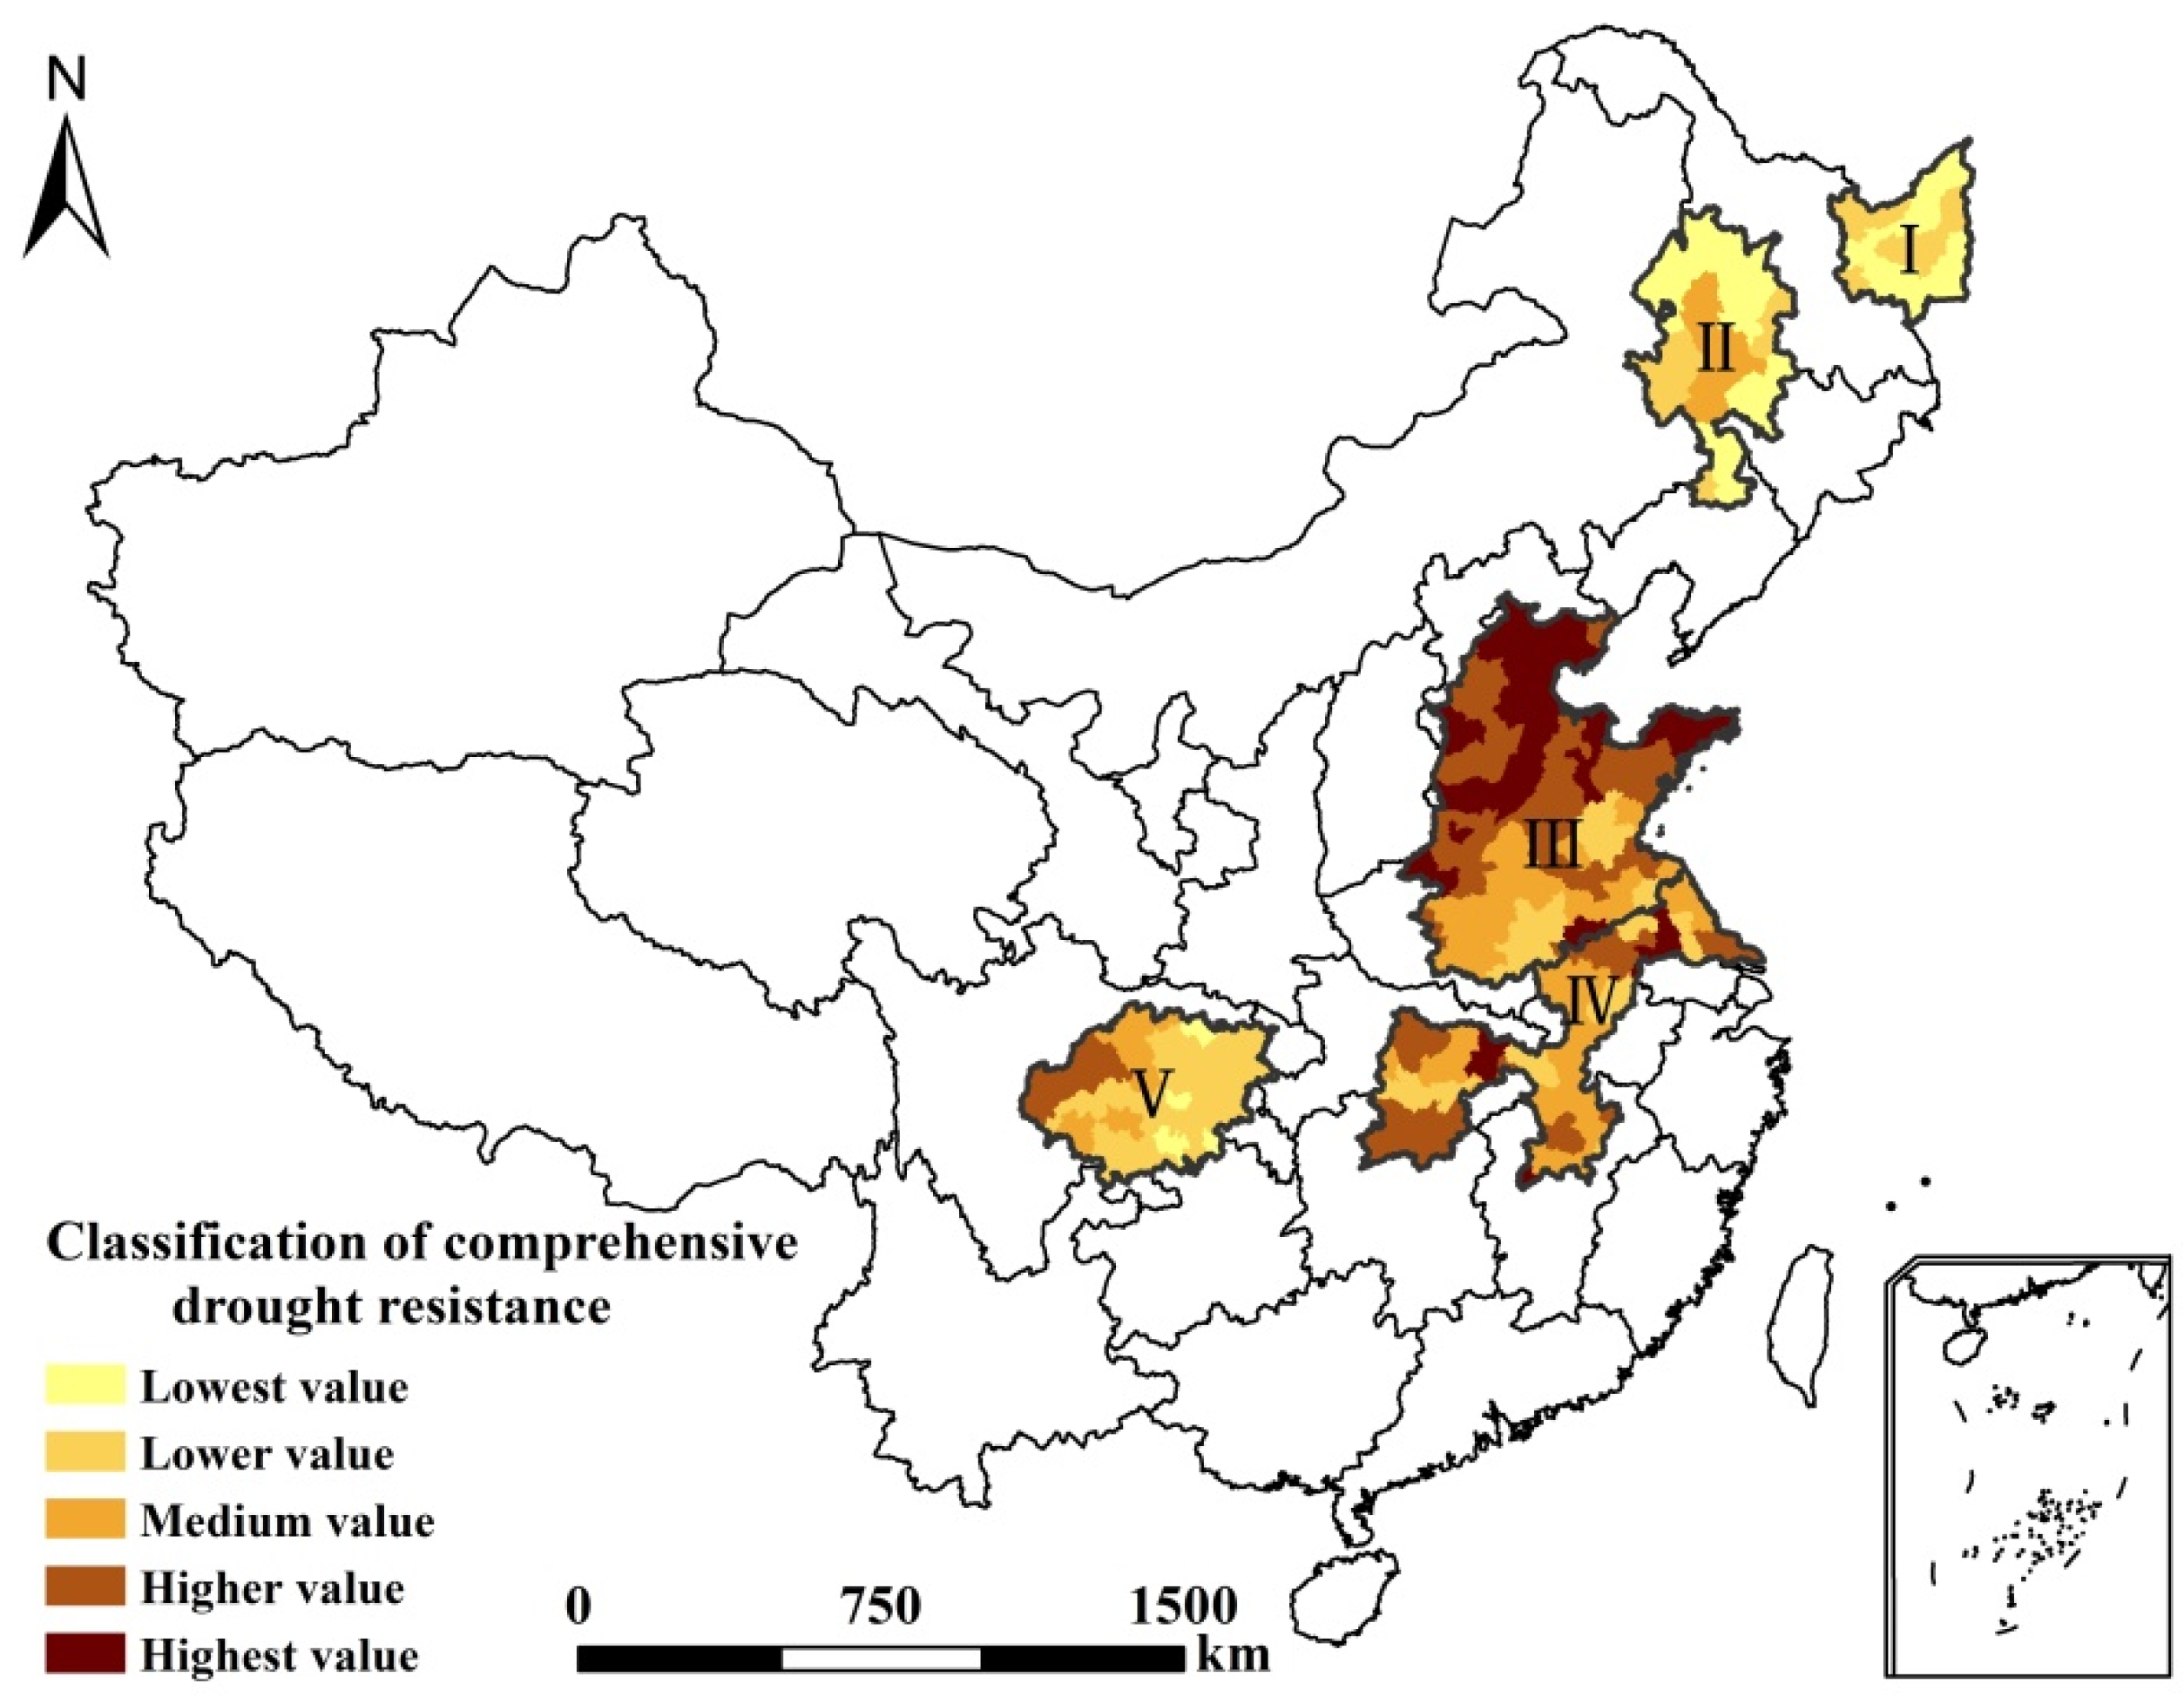
We calculated the evaluation score of comprehensive drought resistance against the background agricultural drought in each city according to Formula (7), classified the score into five values—lowest, lower, medium, higher and highest—by means of natural breaks and produced a map of comprehensive drought resistance (CADI) (
Figure 4). Next, we overlaid the space of the five main grain-producing areas with the scope of municipal administration and used the area-weighted method to calculate the score of comprehensive drought resistance in the main grain-producing areas as a basic statistical unit (
Figure 5). The higher the score, the stronger the comprehensive drought resistance was determined to be.
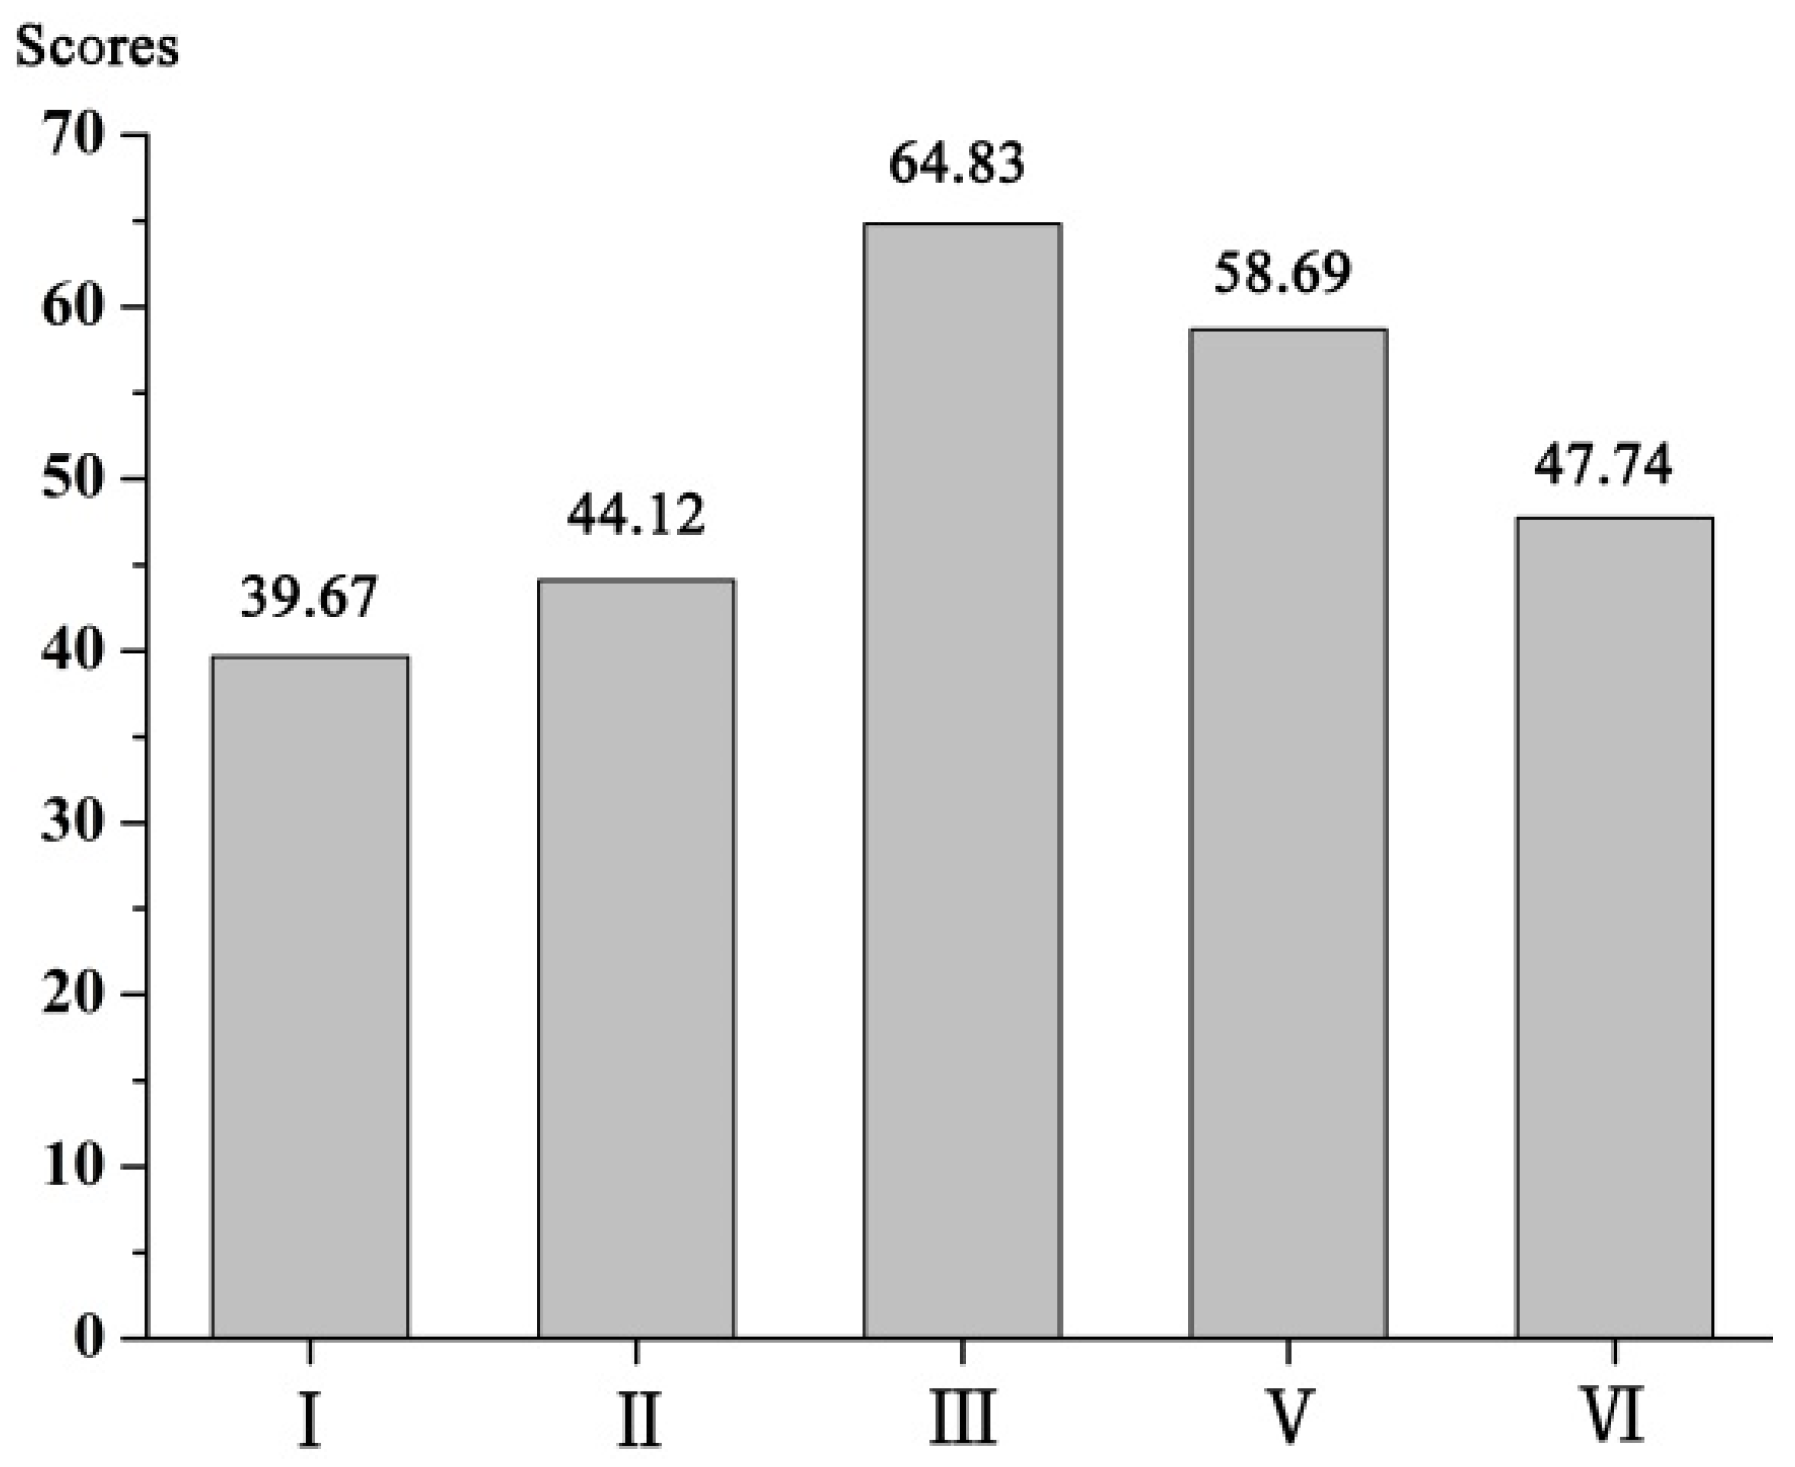
According to the comprehensive evaluation results (
Figure 5,
Table 4), the drought resistance against background agricultural drought was, from strongest to weakest: Huang-Huai-Hai Plain > middle Yangtze River and Jianghuai region > Sichuan Basin > Songnen Plain > Sanjiang Plain. Areas with the lowest and lower values of comprehensive drought resistance were mainly concentrated in the Songnen and Sanjiang Plains. More than 58% of the area in Sanjiang Plain had the lowest value, and 41.08% had the lower value, mainly distributed in the middle of the plain. In the Songnen Plain, the proportions of areas with the lowest and lower comprehensive drought resistance were 56.04% and 21.51%, respectively, concentrated in the north and south of the plain. Only the center had 22.45% with middle values. In these areas, precipitation was scarce, the agricultural drought degree was high and the agricultural drought resistance was weak. Both the drought background and insufficient agricultural infrastructure significantly weakened agricultural drought resistance, which resulted in the Sanjiang and Songnen Plains having the weakest comprehensive drought resistance among the five regions. In the Sichuan Basin, the comprehensive drought resistance weakened from west to east. Nearly 70% of the basin had the lowest and lower values of comprehensive drought resistance, mainly distributed in the east, and 21.58% and 9.78% had middle or higher values, distributed in some parts of the west. In the Sichuan Basin, the agricultural drought degree was the lightest of the five regions, decreasing the risk of agricultural drought to a certain extent, but the underdeveloped social economy, the shortage of agricultural machinery and the low GDP per capita all adversely affect the agricultural drought resistance. In the middle Yangtze River and Jianghuai region, most areas exhibited medium comprehensive drought resistance. More than 40% of this region had higher or the highest comprehensive drought resistance levels, and only 18.64% of areas, distributed sporadically, had a lower value. Abundant precipitation, which provides this region with a lighter degree of agricultural drought, and stronger socioeconomic drought resistance resulted in a higher level of comprehensive drought resistance in the middle Yangtze River and Jianghuai region. The Huang-Huai-Hai Plain had the highest comprehensive drought resistance of the five regions, with more than 60% of the plain exhibiting higher and highest values, mainly in the north. There were no areas with the lowest value. In this region, the degree of agricultural drought was most severe, but the high socioeconomic level, agricultural modernization and rate of efficient irrigation all effectively improved the comprehensive drought resistance of the Huang-Huai-Hai Plain.
3.4. Sensitivity Analysis for Integrated Drought Resistance
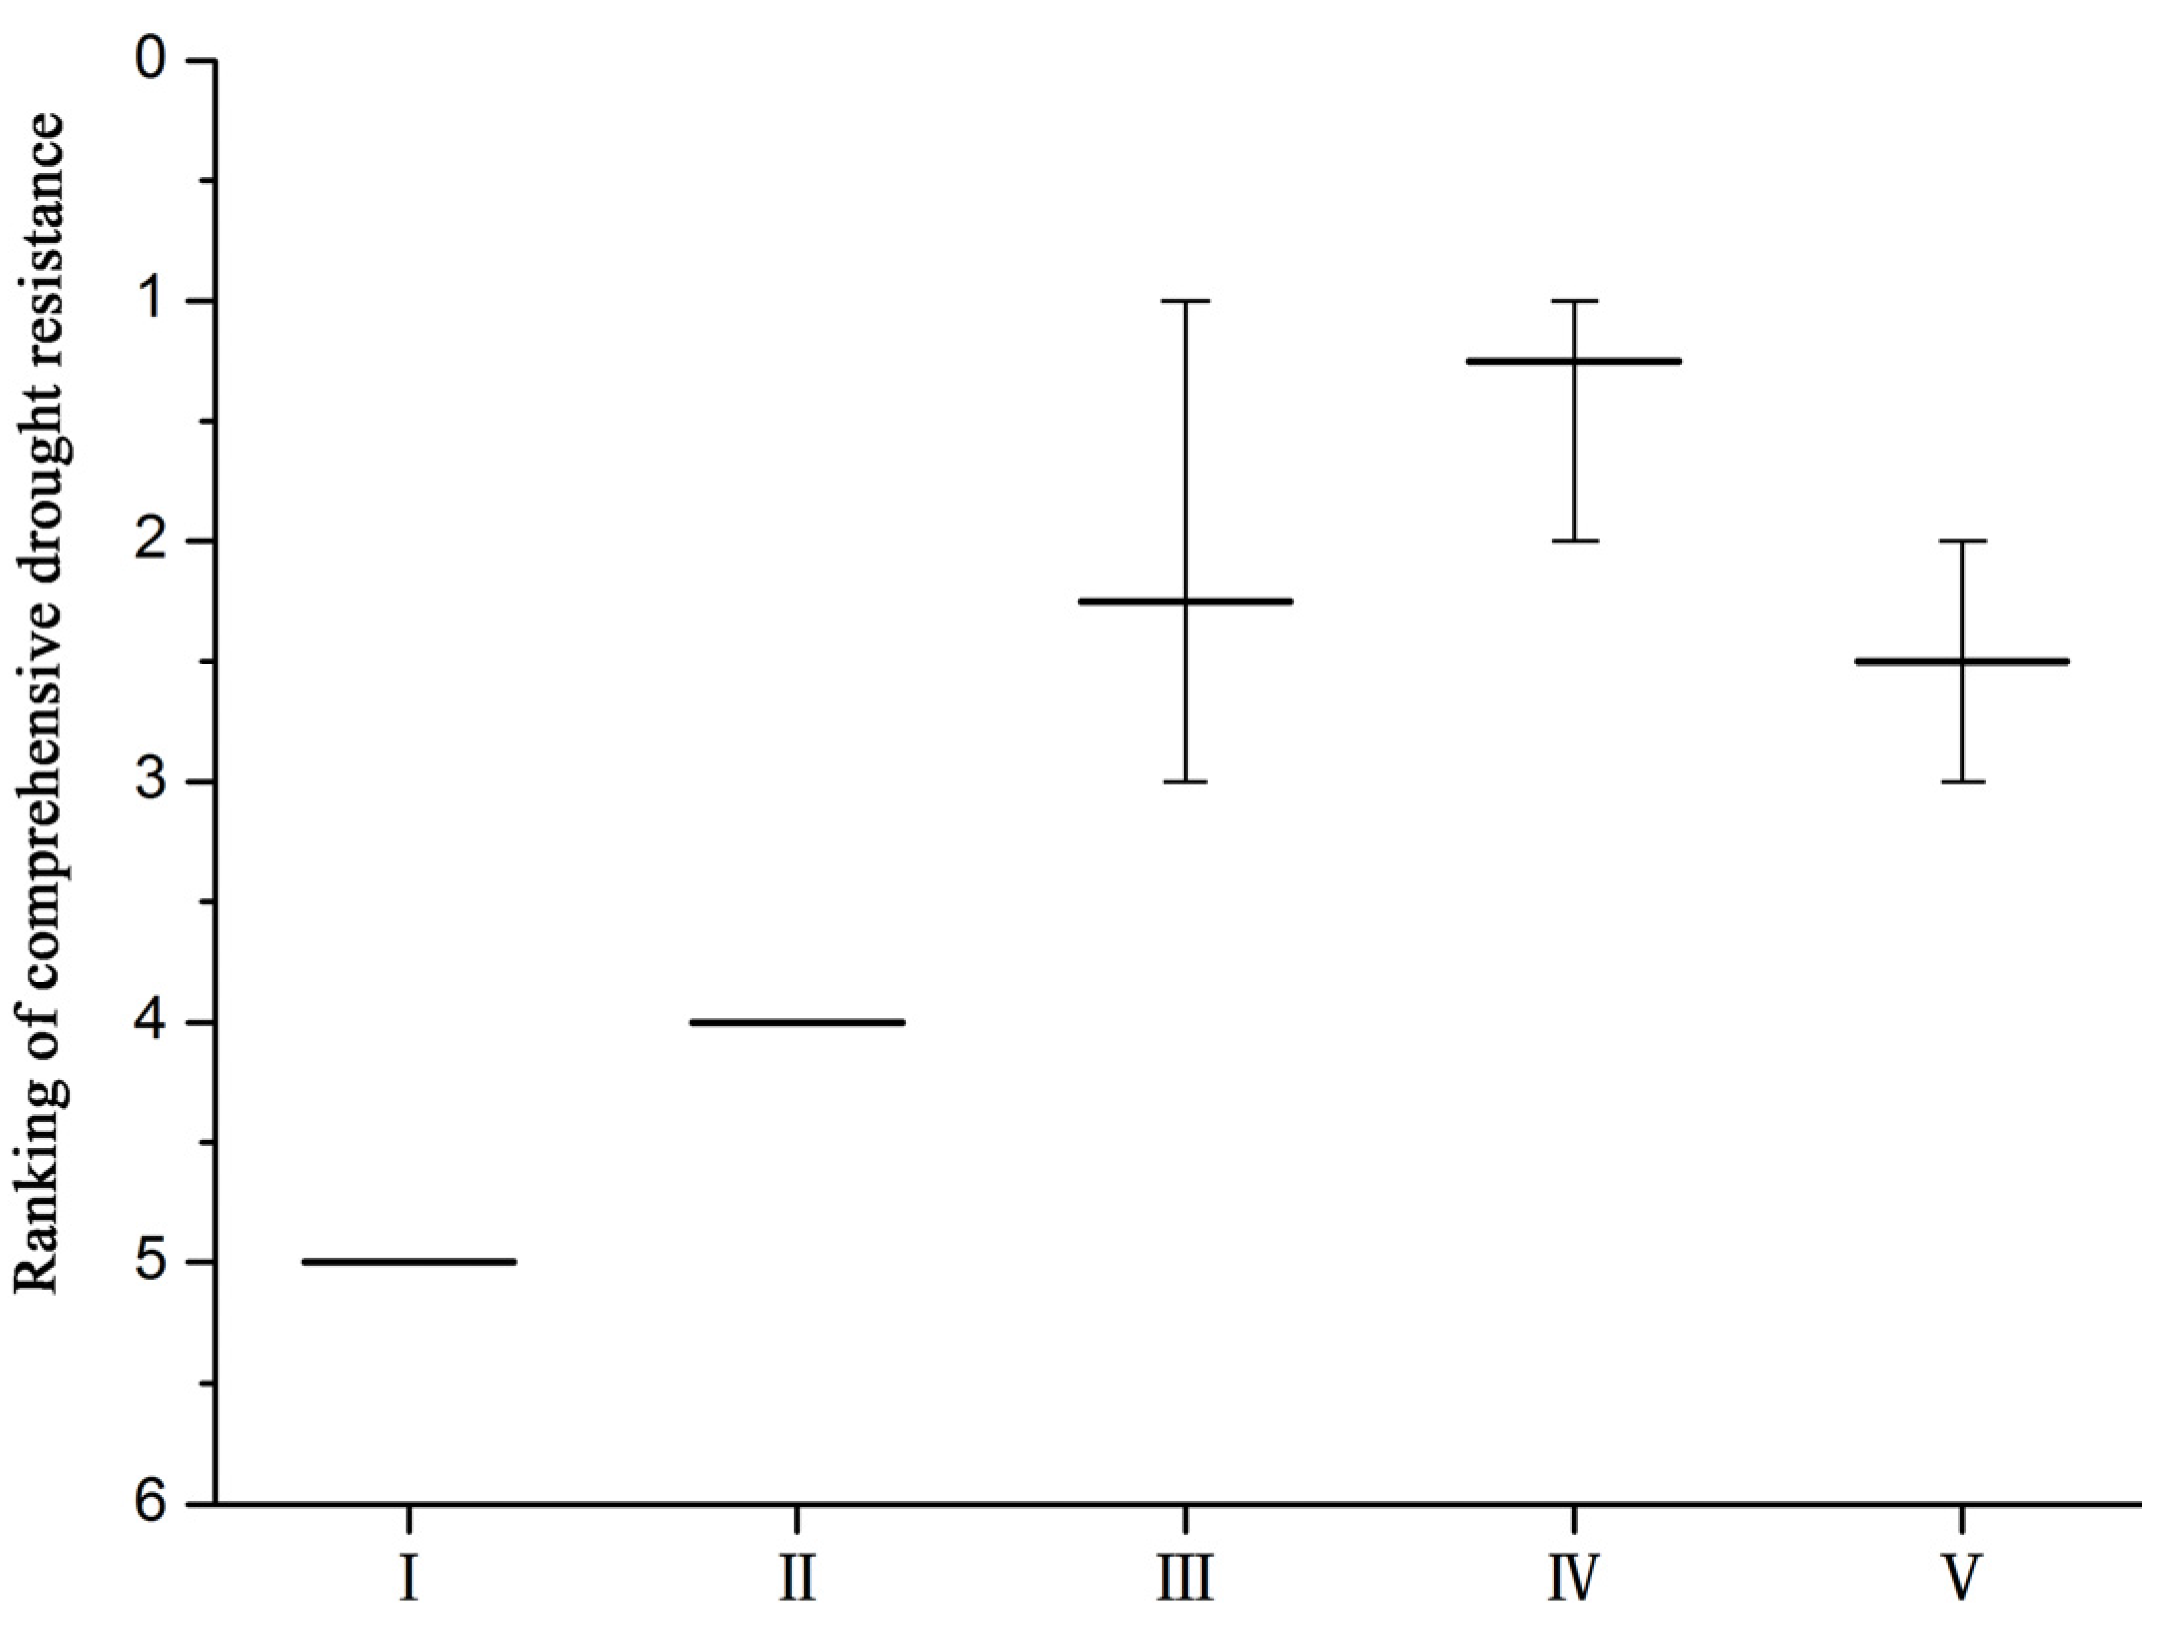
The results of the sensitivity analysis from the perspective of indicator selection showed that the stronger the comprehensive drought resistance of an area, the more sensitive the results would be to indicator selection (
Figure 6,
Table 5). The comprehensive drought resistance ranking of the Huang-Huai-Hai Plain changed most significantly in the ranking from No. 1 to No. 3. The regions with the second most obvious ranking change were the middle Yangtze River and Jianghuai region and the Sichuan Basin, with the ranking shifting from No. 1 to No. 2 and from No. 2 to No. 3, respectively. The rankings of the Sanjiang and Songnen Plains did not change with indicator selection. In addition, as shown in
Table 3, when excluding the Huang-Huai-Hai Plain, any one indicator among the rate of efficient irrigation, agricultural machinery dynamic coefficient and per capita GDP, the agricultural drought resistance of the region would change, indicating that the results are sensitive to these three indicators. The agricultural drought resistance of the middle Yangtze River and Jianghuai region had a certain degree of sensitivity to all indicators, except for the expenditure on agroforestry and water transactions. Each time an indicator was removed, the ranking would increase or decrease one place compared to the all-indicators’ evaluation results. For the Sichuan Basin, the result was more sensitive to the agricultural drought degree, rate of efficient irrigation, agricultural machinery dynamic coefficient and per capita GDP.
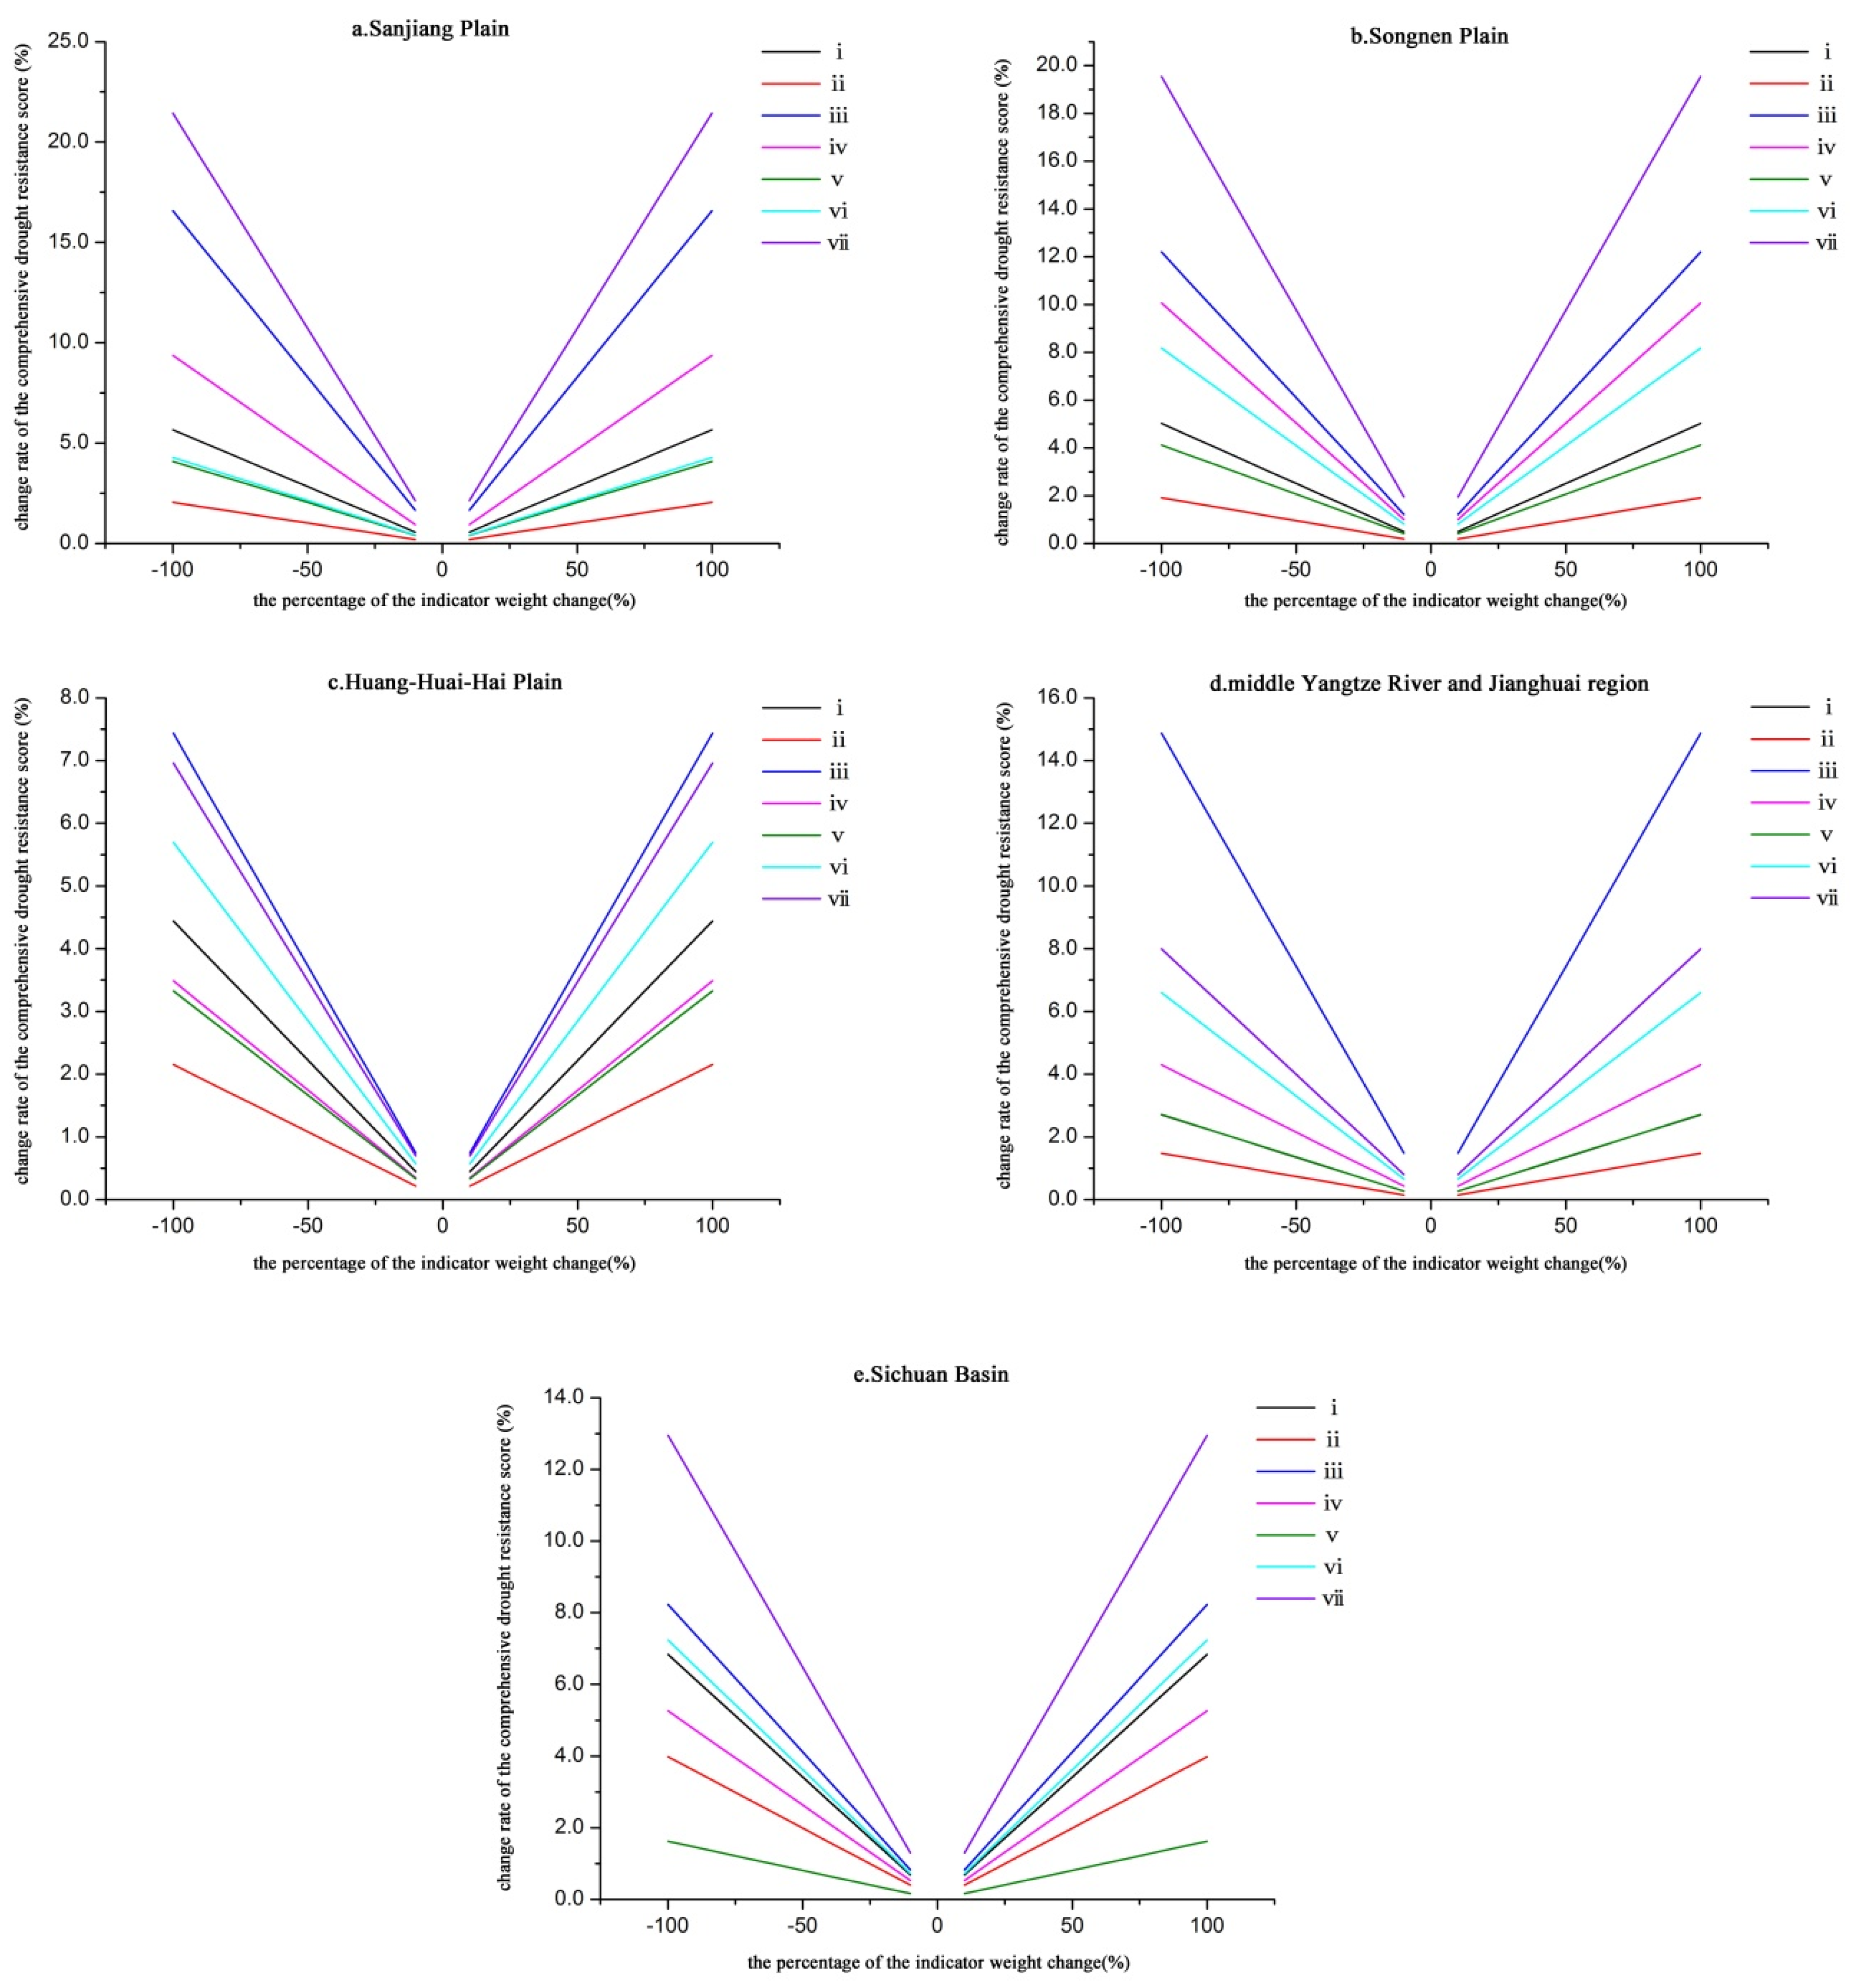
The comprehensive drought resistance will change with the change of indicator weight. Based on the OAT method, the figures for sensitivity analysis results in terms of indicator weight change were generated (
Figure 7). The results show that the sensitivity of agricultural drought resistance evaluation results to indicator weights in the Sanjiang Plain was in the order of: agricultural drought degree > rate of efficient irrigation > agricultural machinery dynamic coefficient > soil texture > per capita GDP > expenditures on agroforestry and water transactions > ratio of areas of high and low water consumption crops. The results for the Songnen Plain were similar, only differing in the order of soil texture and per capita GDP. This shows that the agricultural drought degree, rate of efficient irrigation and agricultural machinery dynamic coefficient were the more sensitive indicators in these two areas, which have a greater influence on agricultural drought resistance. The influence of other indicators on the resistance declined with decreasing sensitivity. That is, changing the weight value of agricultural drought resistance, the rate of efficient irrigation and the agricultural machinery dynamic coefficient significantly influenced the comprehensive drought resistance evaluation results of these two areas. Thus, it is necessary to give due consideration to the weight settings of these sensitive indicators. In the Huang-Huai-Hai Plain, the most sensitive indicator was the rate of efficient irrigation, followed by the agricultural drought degree, per capita GDP, soil texture, agricultural machinery dynamic coefficient, expenditures on agroforestry and water transactions and the ratio of areas of high and low water consumption crops. For the middle Yangtze River and Jianghuai region, the sensitivity sequences of all indicators were in accordance with the Huang-Huai-Hai Plain, which shows that the weight changes for the rate of efficient irrigation, agricultural drought degree and per capita GDP significantly influenced agricultural drought resistance evaluation results, while the ratio of areas of high and low water consumption crops had the smallest influence. For the Sichuan Basin, the agricultural drought degree was the most sensitive indicator, followed by the rate of efficient irrigation, per capita GDP, soil texture, agricultural machinery dynamic coefficient, ratio of areas of high and low water consumption crops and expenditures on agroforestry and water transactions.
Finally, in terms of indicator integration, this study used the method of multiplicative integration with weighted coefficients to evaluate the comprehensive agricultural drought resistance (
Table 6) and compared it to the evaluation results from the linear weighted summation method (additive integration) to discuss how different index integration methods influence the evaluation results. Through comparisons and analyses, the two-index integration methods did not change the overall drought resistance rankings of the five main grain-producing areas. However, the evaluation scores gained from the multiplicative integration method were obviously lower than those from the additive integration method. At the regional level, the more a region exhibited a weaker or stronger comprehensive drought resistance, the more significantly the results changed with different integration methods; this trend suggests a higher sensitivity to the indicator integration method. With further analysis, taking the Huang-Huai-Hai Plain as an example, two important indicators, the rate of efficient irrigation and the agricultural machinery dynamic coefficient, were significantly higher than in other areas. Based on the characteristics of multiplicative integration, the two indicators raised the comprehensive score level of drought resistance, so that the drought resistance tended to concentrate on the higher and highest values. Thus, it is evident that the multiplicative integration more sensitively reflects the differences in the levels of indicators and has higher sensitivity when distinguishing between the evaluated objects.
5. Conclusions
In recent years, due to climate change, the drought situation in the main grain-producing areas in China has become more serious. The main grain-producing areas play an important role in national food production, so their drought resistance directly influences food security. Therefore, using GIS technology, this study selected five main grain-producing areas, Sanjiang Plain, Songnen Plain, Huang-Huai-Hai Plain, middle Yangtze River and Jianghuai region and Sichuan Basin, as study areas and evaluated and analyzed the comprehensive agricultural drought situation, basic drought resistance and comprehensive drought resistance against the background agricultural drought in the study areas.
The agricultural drought degree in the Huang-Huai-Hai Plain was the most serious, while it was slightly lower for the Sanjiang and Songnen Plains and was relatively light for the middle reach of the Yangtze River and Jianghuai region and the Sichuan Basin.
There was a significant difference in agricultural drought resistance among the areas. The entire Sanjiang Plain had an agricultural drought resistance at the lowest value. The Songnen Plain was slightly stronger than the Sanjiang Plain. In the Sichuan Basin, there were no areas with agricultural drought resistance at the lowest value, but there were many lower and mid-value areas. The basin’s basic drought resistance was mainly limited by the relatively low economic and social development of the region. In the Huang-Huai-Hai Plain and middle Yangtze River and Jianghuai region, the agricultural drought resistance was stronger, without any lowest value areas. Over 50% of areas had higher and highest values. The higher rate of efficient irrigation and agricultural machinery dynamic coefficient greatly improved the resistance of these two areas.
The ranking of comprehensive drought resistance from strongest to weakest was as follows: Huang-Huai-Hai Plain > middle Yangtze River and Jianghuai region > Sichuan Basin > Songnen Plain > Sanjiang Plain. Among them, the comprehensive drought resistance of the Sanjiang and Songnen Plains was comparatively weak. The drier agricultural conditions and inadequate agricultural infrastructure significantly weakened the agricultural drought resistance of these areas. In the Sichuan Basin, the agricultural drought degree was the lowest of the five areas. However, due to the underdeveloped socioeconomic levels and insufficient basic drought resistance development, the comprehensive drought resistance level was relatively low. The comprehensive drought resistance of the middle Yangtze River and Jianghuai region mainly had medium values. The Huang-Huai-Hai Plain had the strongest comprehensive drought resistance, without any lowest value areas.
Through the sensitivity analysis, it is found that the same indicator has influence to different degrees on the agricultural drought resistance. The rate of efficient irrigation and agricultural machinery dynamic coefficient and per capita GDP, each of these three indicators would cause the change of agricultural drought resistance of the Huang-Huai-Hai Plain, the middle Yangtze River and Jianghuai region and the Sichuan Basin. However, they had no effect on the ranking of the Sanjiang Plain and the Songnen Plain. Besides, the sensitive factors affecting the agricultural drought resistance in different regions are different. The agricultural aridity degree and the rate of efficient irrigation were both the most sensitive factors to agricultural drought resistance in five main grain-producing regions, but different regions showed different sensitivity to per capita GDP, the agricultural machinery dynamic coefficient and other indicators. Compared to the additive integration method, the multiplication integration method reflects the difference in the levels of indicators more sensitively. It could distinguish different evaluation objects more sensitively just in this task.


