1. Introduction
It has been widely recognized that sustainable development with various species on the planet is the common pursuit of human beings. However, there is an increasing worldwide discussion about humans’ sustainability due to the rising trend of greenhouse gas (GHG) emissions and the excessive consumption of natural resources. Even though the key impact factors are still under debate, academia across the world has come to an agreement that this situation is basically ascribed to anthropogenic disturbances with agriculture, urban development and energy production [
1,
2,
3,
4].
In order to provide indicators for sustainability on the environmental side, in other words, to measure the human environmental impact on the earth, several methods have been developed during the recent decades [
5,
6,
7]. However, each approach has its strengths and weaknesses in application [
8]. Among these, ecological footprint (EF) analysis is one of the most widely used approaches. It is a quantitative environmental accounting tool for estimating the requirements for resource consumption and waste assimilation by a certain number of populations. Instead of calculating what population a particular region can support sustainably, the ecological footprint indicator directly shows the areas of biologically productive land appropriated to sustain a defined population, which were described as “footprints” that humans impose on the earth’s surface [
9]. Therefore, it represents the impact of human consumption activities and waste assimilation requirements on the natural ecosystems, and moreover, is able to compare the consumption (footprint) with the amount of resources that nature can produce in the same time (biocapacity).
Due to its full picture of the sustainability concept of the planet and its global comparability, accessibility and operability, the ecological footprint model has been applied to various scales by many scholars and governments. At the global scale, today humanity uses the equivalent of 1.6 planets to provide the resources we use and absorb our waste, according to the research report of the Global Footprint Network [
10]. Carbon has been the dominant component of humans’ ecological footprint for several decades, primarily caused by the burning of fossil fuels such as coal, oil and natural gas. It rose up to 53% of the total ecological footprint by 2010, while it was only 36% in 1961 and 45% in 2005 [
10]. At national and sub-national scales, Wackernagel
et al. have explored ecological footprint trends in Austria, the Philippines, and South Korea for the past 40 years [
11]. Pereira
et al. analyzed the ecological footprint in Brazil combined with energy synthesis [
12]. Palacios-Agundez
et al. provided a detailed assessment of ecosystem services supply and demand and analyzed the local service provisioning mismatch by using ecological footprint analysis [
13]. Moore
et al. calculated the residential consumption and ecological footprint of Metro Vancouver in 2006 by means of bottom-up ecological footprint analysis with the urban metabolism framework [
14]. There are also footprint studies at smaller scales, for example on specific sectors and products, to identify local environmental impacts [
15,
16].
In order to assess the impact by a certain kind of resource consumption or waste generation associated with human activities across multiple dimensions., a series of footprint-style indicators including the carbon footprint, water footprint, energy footprint, biodiversity footprint, nitrogen footprint and chemical footprint,
et al. have been widely proposed and analyzed [
17,
18,
19,
20,
21,
22,
23,
24]. In recent years, efforts have been made to build up a “footprint family” [
25,
26,
27] as a combination set of ecological footprint, carbon footprint and water footprint indicators to evaluate the comprehensive impact of resource consumption and GHG emissions on the earth. However, some important issues are still quite controversial in the footprint combination, such as cross-scale measuring and weighting [
28,
29,
30]. Currently, the concept of the ecological footprint created by Wackernagel has become very popular and the analysis model has a clear benchmark to compare the human consumption of resources and energies
versus what nature offers to humans.
China has been experiencing very fast economic development in recent years, but its process of urbanization and industrialization is still far from completion. This implies that there has been considerable demand for various products (agricultures, energies,
etc.) and services (waste assimilation,
etc.) because it is one of the biggest developing countries in the world. As a consequence, how much impact China imposes on the earth’s system is what we need to examine first, so it can be compared with the biocapacity to reveal whether the environment has been overloaded or not. Moreover, how the impact has changed in accordance with time and space is another question that we need to explore, as it directly reflects the implementation effect of sustainability policy. These objectives are of profound guiding significance for future socio-economic development. Though there has been research on the footprint analysis of Chinese society [
31,
32], explorations are seldom reported at the sub-national scale of this huge developing country. This study therefore aims to explore the two questions above based on a case analysis at a regional scale. It takes a typical city, Wuhan, in central China to track the dynamic changes of the city’s demand for raw materials and energies in terms of corresponding, biologically productive land types, and furthermore, to identify the component changes within the footprint in terms of material productivity and energy consumption. It is greatly valuable for local governments to adjust industrial structures and implement more suitable land use policies for reducing pressures on the planet.
2. Study Area
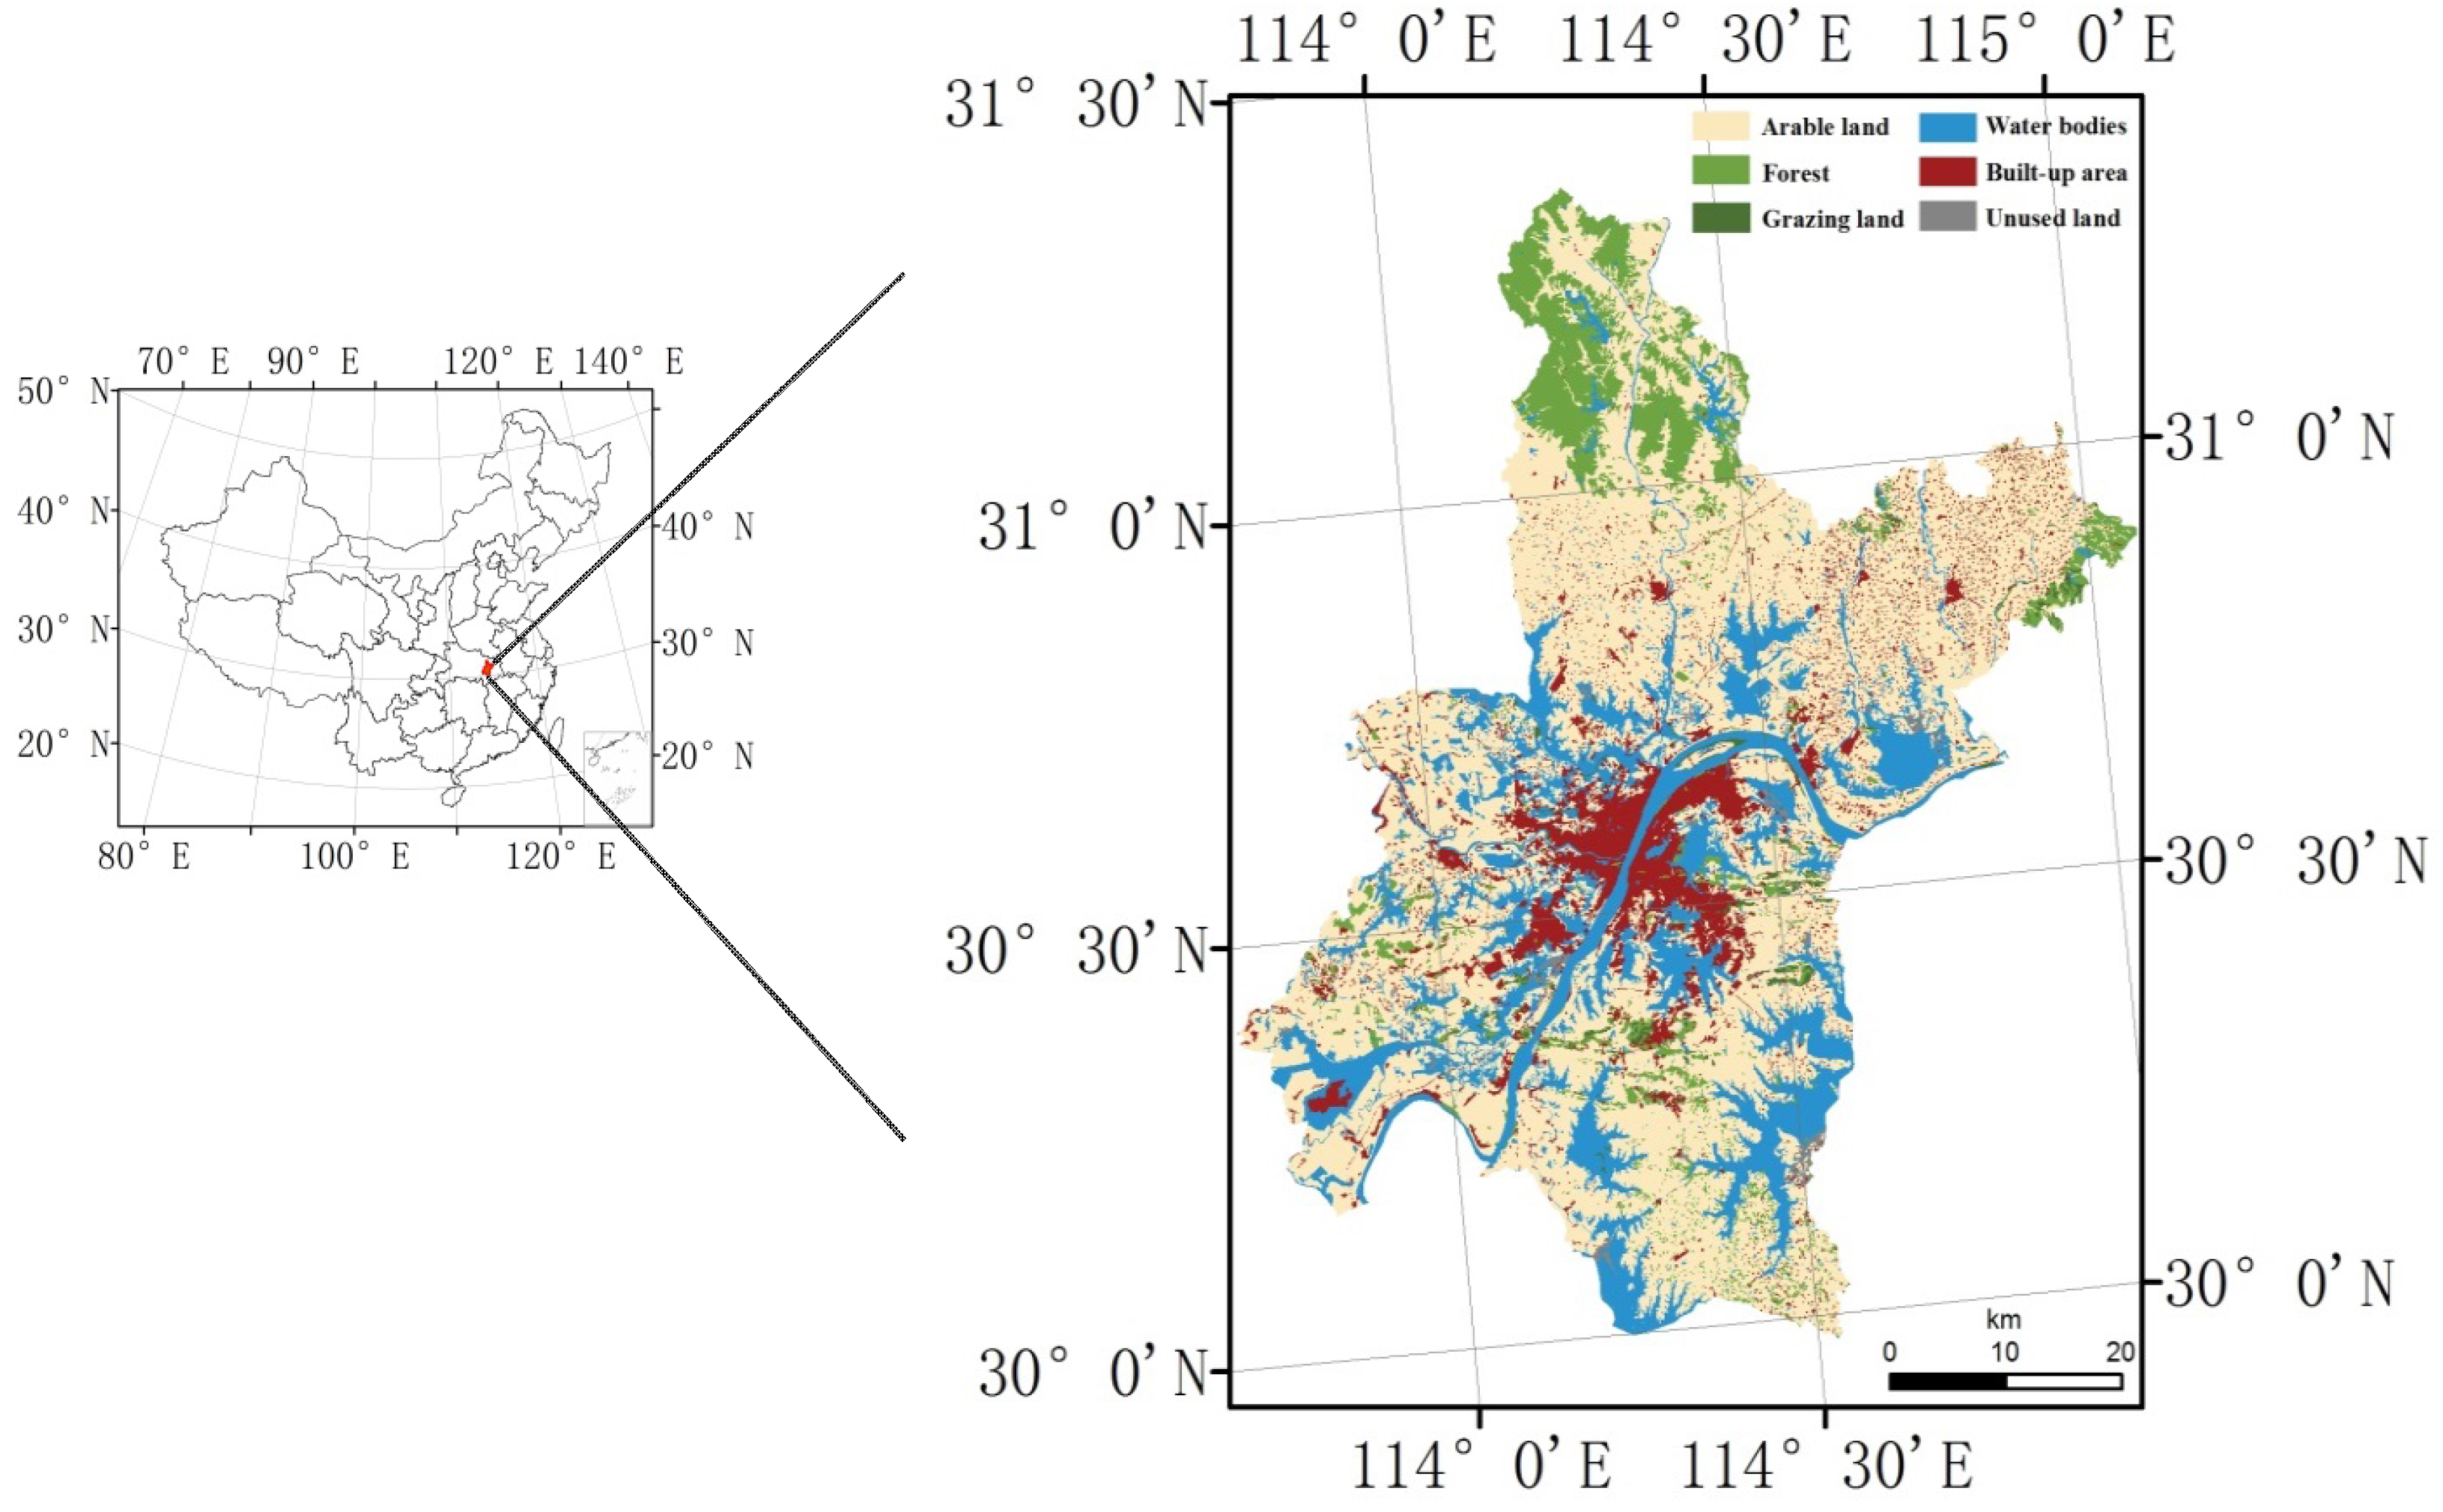
This study was performed in Wuhan Municipality (113°41′ E–115°05′ E, 29°58′ N–31°22′ N), central China, which is the capital city of Hubei Province. It covers a total area of 8523 km2 with a population of 10.33 million inhabitants (2014). Seated along the middle reaches of the Yangtze River, the city is located at the Yangtze Plain with only small hilly parts in the north and northeast. In addition, the Yangtze River’s largest tributary, Hanjiang River, flows from the west and into the city’s downtown, and tens of lakes interconnect within the region; the water bodies occupy nearly 20% of the metropolitan area.
Owning to a considerably abundant amount of water resources and good heat conditions, Wuhan and its surrounding areas used to be an important grain- and fishery-producing region. However, as China underwent a profound reform over recent decades, industrial and commercial sectors in Wuhan have also been tremendously strengthened since the 1990s. The proportions of these two sectors account for 47.5% and 49.0% of the total Gross Domestic Product (GDP) by the end of the year 2014, respectively, while the agricultural sector makes only 3.5% of the GDP, and is declining every year. Besides, with its advantageous location in the country and the vigorous development of its industries and commerce, Wuhan is now the central metropolis in inland China, and it plays an important role in the transportation exchange network, connecting the more developed regions in eastern China with the less developed regions in western China.
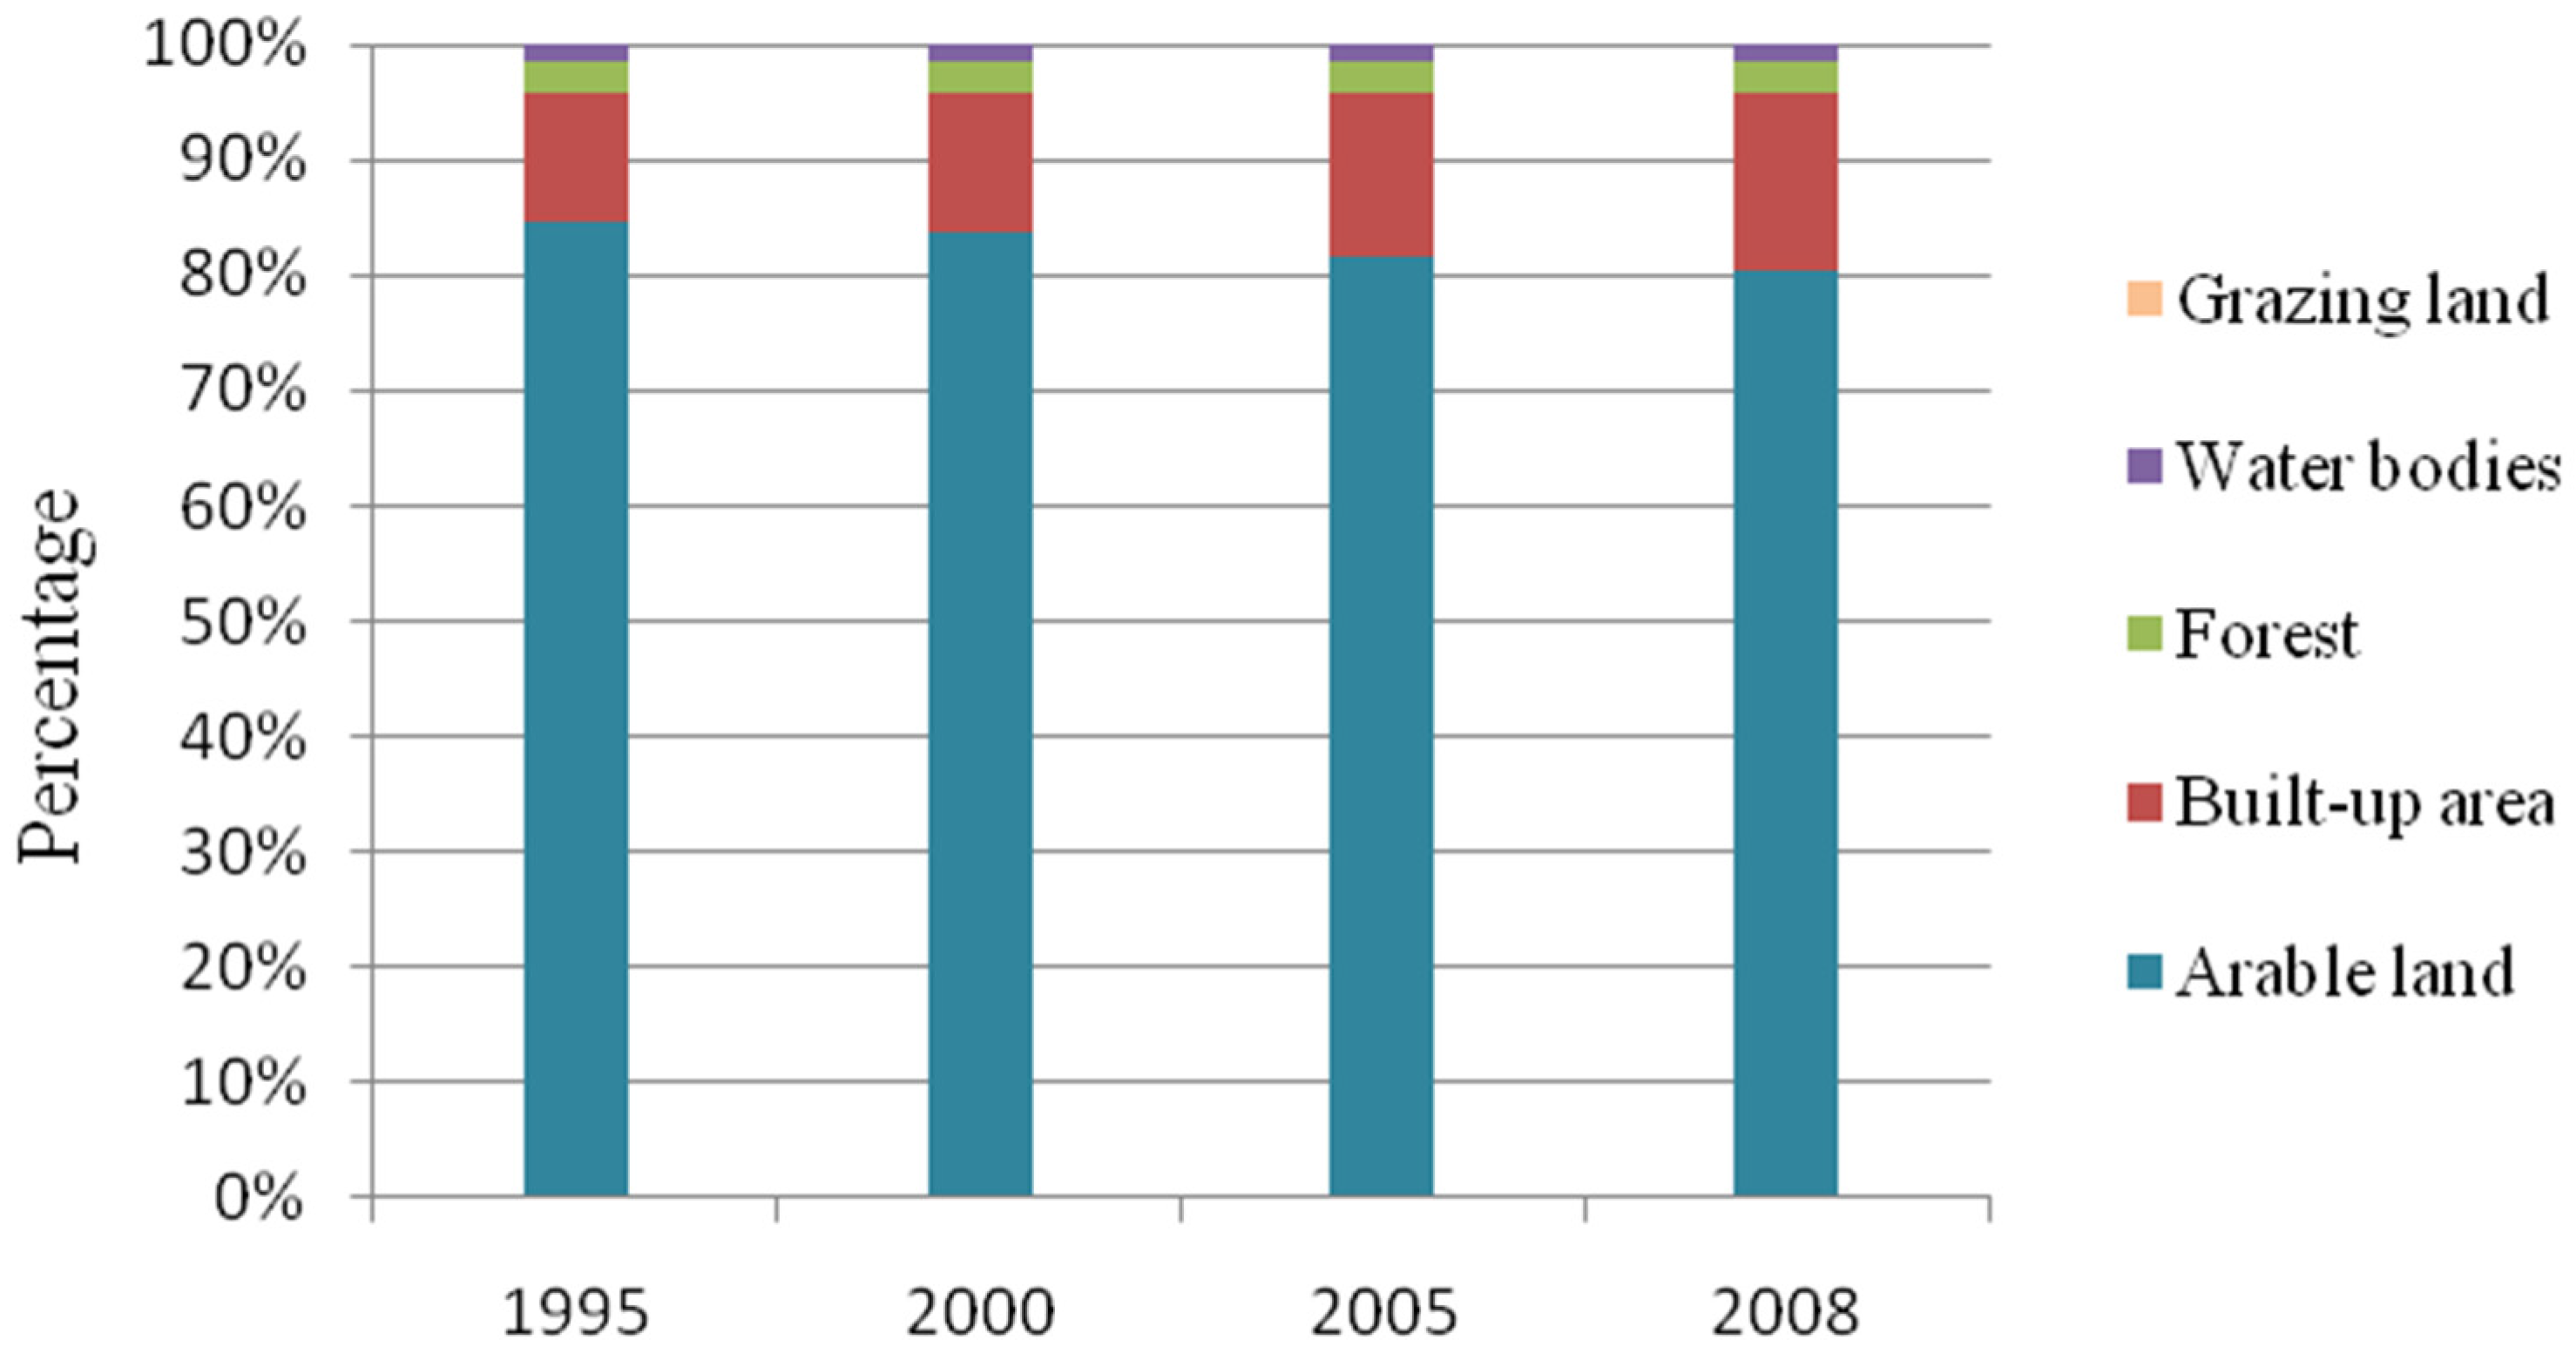
From the perspective of land use structure, nearly 59% of Wuhan’s land area was covered by arable land in 2008, which is about 5000 km
2. It includes paddy fields and irrigated dry soils covering about 3200 km
2 and 1800 km
2, respectively. Water bodies as well as forests make up about 30% of the region in total. Built-up area occupies approximately 10%, comprising urban areas, rural settlements, separated industrial areas, roads and wharfs, and it is still sprawling fast by seizing arable land. Grazing land and unused land, the latter involving swamps and bare ground, are the two types that are difficult to see in the city: each type covers less than 1% of the area, respectively (
Figure 1).
3. Data and Methods
3.1. Assessing the Ecological Footprint and Biocapacity
In this study, we used the ecological footprint as an environmental accounting indicator to describe the impact on the earth of the inhabitants’ activities in Wuhan. The impact is produced via resource utilization, waste generation and the use of services provided by the ecosystem. Therefore, the ecological footprint basically consists of two types of accounts: the biological resources account and the energy account.
The ecological footprint converts the anthropogenic impact into a biologically productive area, which means land that is able to perform photosynthesis and produce biomass. It is the basis for the unified measuring of various kinds of natural capitals. In other words, when calculating the ecological footprint accounts for a given region, all types of materials and energies consumption within the region are converted into the related biologically productive areas [
33].
The six main categories of biologically productive land consist of arable land, grazing land, forest, water bodies, built-up area and carbon uptake land. Arable land is mainly for the provision of plant-based foods and some other plants such as fiber, etc. Grazing land basically produces animal products. Forests provide forest products and wood materials, even though there are quite few in the study area. Water bodies supply various kinds of aquatic products, including animals and plants. Built-up areas offer habitats for humankind, for instance manufacturing, entertainment and infrastructures. Different from these five existing land categories, carbon uptake land is a virtual land type. It presents the forest areas that need to absorb the carbon dioxide emissions induced by humans when utilizing resources and energies and producing waste.
For a defined region, each of the biologically productive land categories is described as an area in hectares, expressing the land needed to serve the production and consumption demands. Since the six land categories have different biological productivities, a common measurement unit is needed to unify the different land areas [
5]. This unit converts the land areas to the biologically productive areas with world average productivity. In order to make the land areas be summed up and to ensure that these localized production and consumption metrics are globally comparable, the footprint model provides the equivalence factors (EQF) for each land type, by which they are multiplied to calculate the ecological footprint in global hectares (gha). The total amount of biologically productive areas is equal to the total ecological footprint:
where C
i is the amount of product
i that is produced (or the carbon dioxide that is emitted) in the region; EP
i is the world average yield for product
i (or the carbon uptake capacity in case C refers to carbon dioxide emissions); and EQF
i is the equivalence factor of each biologically productive land type producing product
i.
Opposite to the ecological footprint referring to the demand for goods from nature, the biocapacity of a particular surface is defined as nature’s ability to renew what people demand. It is therefore the ecosystem’s capacity to produce useful biological materials that are consumed by humans and to absorb the waste materials generated by humans, under the current management schemes and technologies [
9]. It is the sum of the productive areas of arable land, forest, grazing land, water bodies and built-up areas. To represent the productivity available to serve people’s uses as a standardized measurement, the biocapacity of an area is calculated by multiplying the actual physical area by the yield factor (YF) and the appropriate equivalence factor (EQF), expressed in global hectares as the ecological footprint is. The function of the yield factor of a given land type is to compare the production difference between a certain region with the world. The biocapacity of each land type is assessed according to the following formula:
where S
j is the biologically productive land area that is available for the production of each product
j; and YF
j is the yield factor for each type of land producing product
j.
The difference between biocapacity and ecological footprint is called ecological reserve (when the biocapacity is greater than the ecological footprint) or ecological deficit (when the biocapacity is smaller than the ecological footprint). If the ecological footprint exceeds the biocapacity of a region, meaning there is an ecological deficit, it implies that a scale mismatch occurs locally and that the region is importing service demand through trade at larger scales. It should be noted that at least 12% of the overall capacity must be kept to maintain biodiversity, and only 88% of the physical area can be counted into the provisioning biocapacity for goods and services [
34].
3.2. Data Sources and Handling
The accuracy of the ecological footprint highly depends on the quality of the source data [
35]. As a result, the most complete and detailed data available about production and consumption activities in Wuhan were collected in this research. Data describing the annual amounts of biological resource production and energy consumption in Wuhan were derived from the Wuhan Statistical Yearbook during the study period. The biological resources involve plant food, live animals, forestry products and inland aquacultures. The main items produced in the study area cover dozens of goods on corresponding land areas (
Table 1). The amount of energy consumption in Wuhan is basically grouped into crude coal, coke, crude oil, fuel oil, gasoline, diesel oil, kerosene, liquefied petroleum gas (LPG), hydroelectricity and fossil electricity, which are linked to the carbon footprint and built-up areas (
Table 1). The global average productivity for biological products is primarily based on the datasets published by the Food and Agriculture Organization (FAO) of the United Nations. The ecological footprint per unit mass of energy calculated by Wackernagel [
5] was applied in this work. As for the two important coefficients in this method, the equivalence factor and the yield factor were also quoted from his research [
33], due to its wide scope and application (
Table 2). The constant values of these two parameters were adopted mainly because: (a) the equivalence factor changed so slightly by year that it had little influence on the assessment [
11]; and (b) there were still some production data unknown in forestry and poultry-farming in the study area due to official statistical data missing in China, whose ranges of production data of some biological resources were different from the FAO dataset. Other supplementary energy data, for instance calorific value factors of each type of energy source, were collected from the China Energy Statistical Yearbooks launched by the National Bureau of Statistics.
Additionally, to trace the evolution trends of the biocapacity of Wuhan within the study period, land use data at the scale of 1:100,000 at some typical time points (1995, 2000, 2005 and 2008) was applied. It was collected from the Chinese Academy of Sciences (CAS). It uses a classification system of six classes at the first level and 25 classes at the second level, which relied on interpretation of the Landsat TM imagery and ground survey of 2000 with a high level of accuracy (about 98.7% of the average degree of interpretation accuracy and 97.6% of comparing the changing patches of land use between two periods) [
36].
Based on the idea of the ecological footprint proposed by Wackernagel and Rees [
33], the calculation process is very similar to their original conceptions except for not taking the imports and exports into consideration. Instead of calculating the apparent consumption by adding imports to production and subtracting exports as Wackernagel did, our work simplified Ci in Formula (1) as the yields of biological resources and the consumption amounts of energy resources, respectively, within the city of Wuhan, which were based on the following considerations: any biological resource produced within the city demanded the local biologically productive land, even if it was exported outside of the city and consumed by the people there; likewise, any source of energies consumed by the inhabitants of the city would cause an impact on the local environment by emitting GHGs and pollutants, even if the sources were produced elsewhere. Another reason, indeed, is that there is an obvious lack of data covering the imports and exports of each product at the regional level in China.
By collecting the data of production and the world average yield of each product corresponding to a certain type of biologically productive land (energy consumption data corresponding to carbon uptake land and built-up area, respectively), the amounts of each demanded land areas were calculated by year according to Formula (1). The whole amount of the ecological footprint per year in the city was summed up by the six biologically productive land types. Within the study period, the regional biocapacity in the years of 1995, 2000, 2005 and 2008 was evaluated by the given Formula (2). Hence, we could measure the ecological reserve/deficit in these four years as well to examine the changes of the environmental impact of the city.
5. Discussion
5.1. Comparisons with Other Evidence
The estimated changing trend of the ecological footprint in this work was quite similar to other scholars’ latest research, such as that of Huang
et al. [
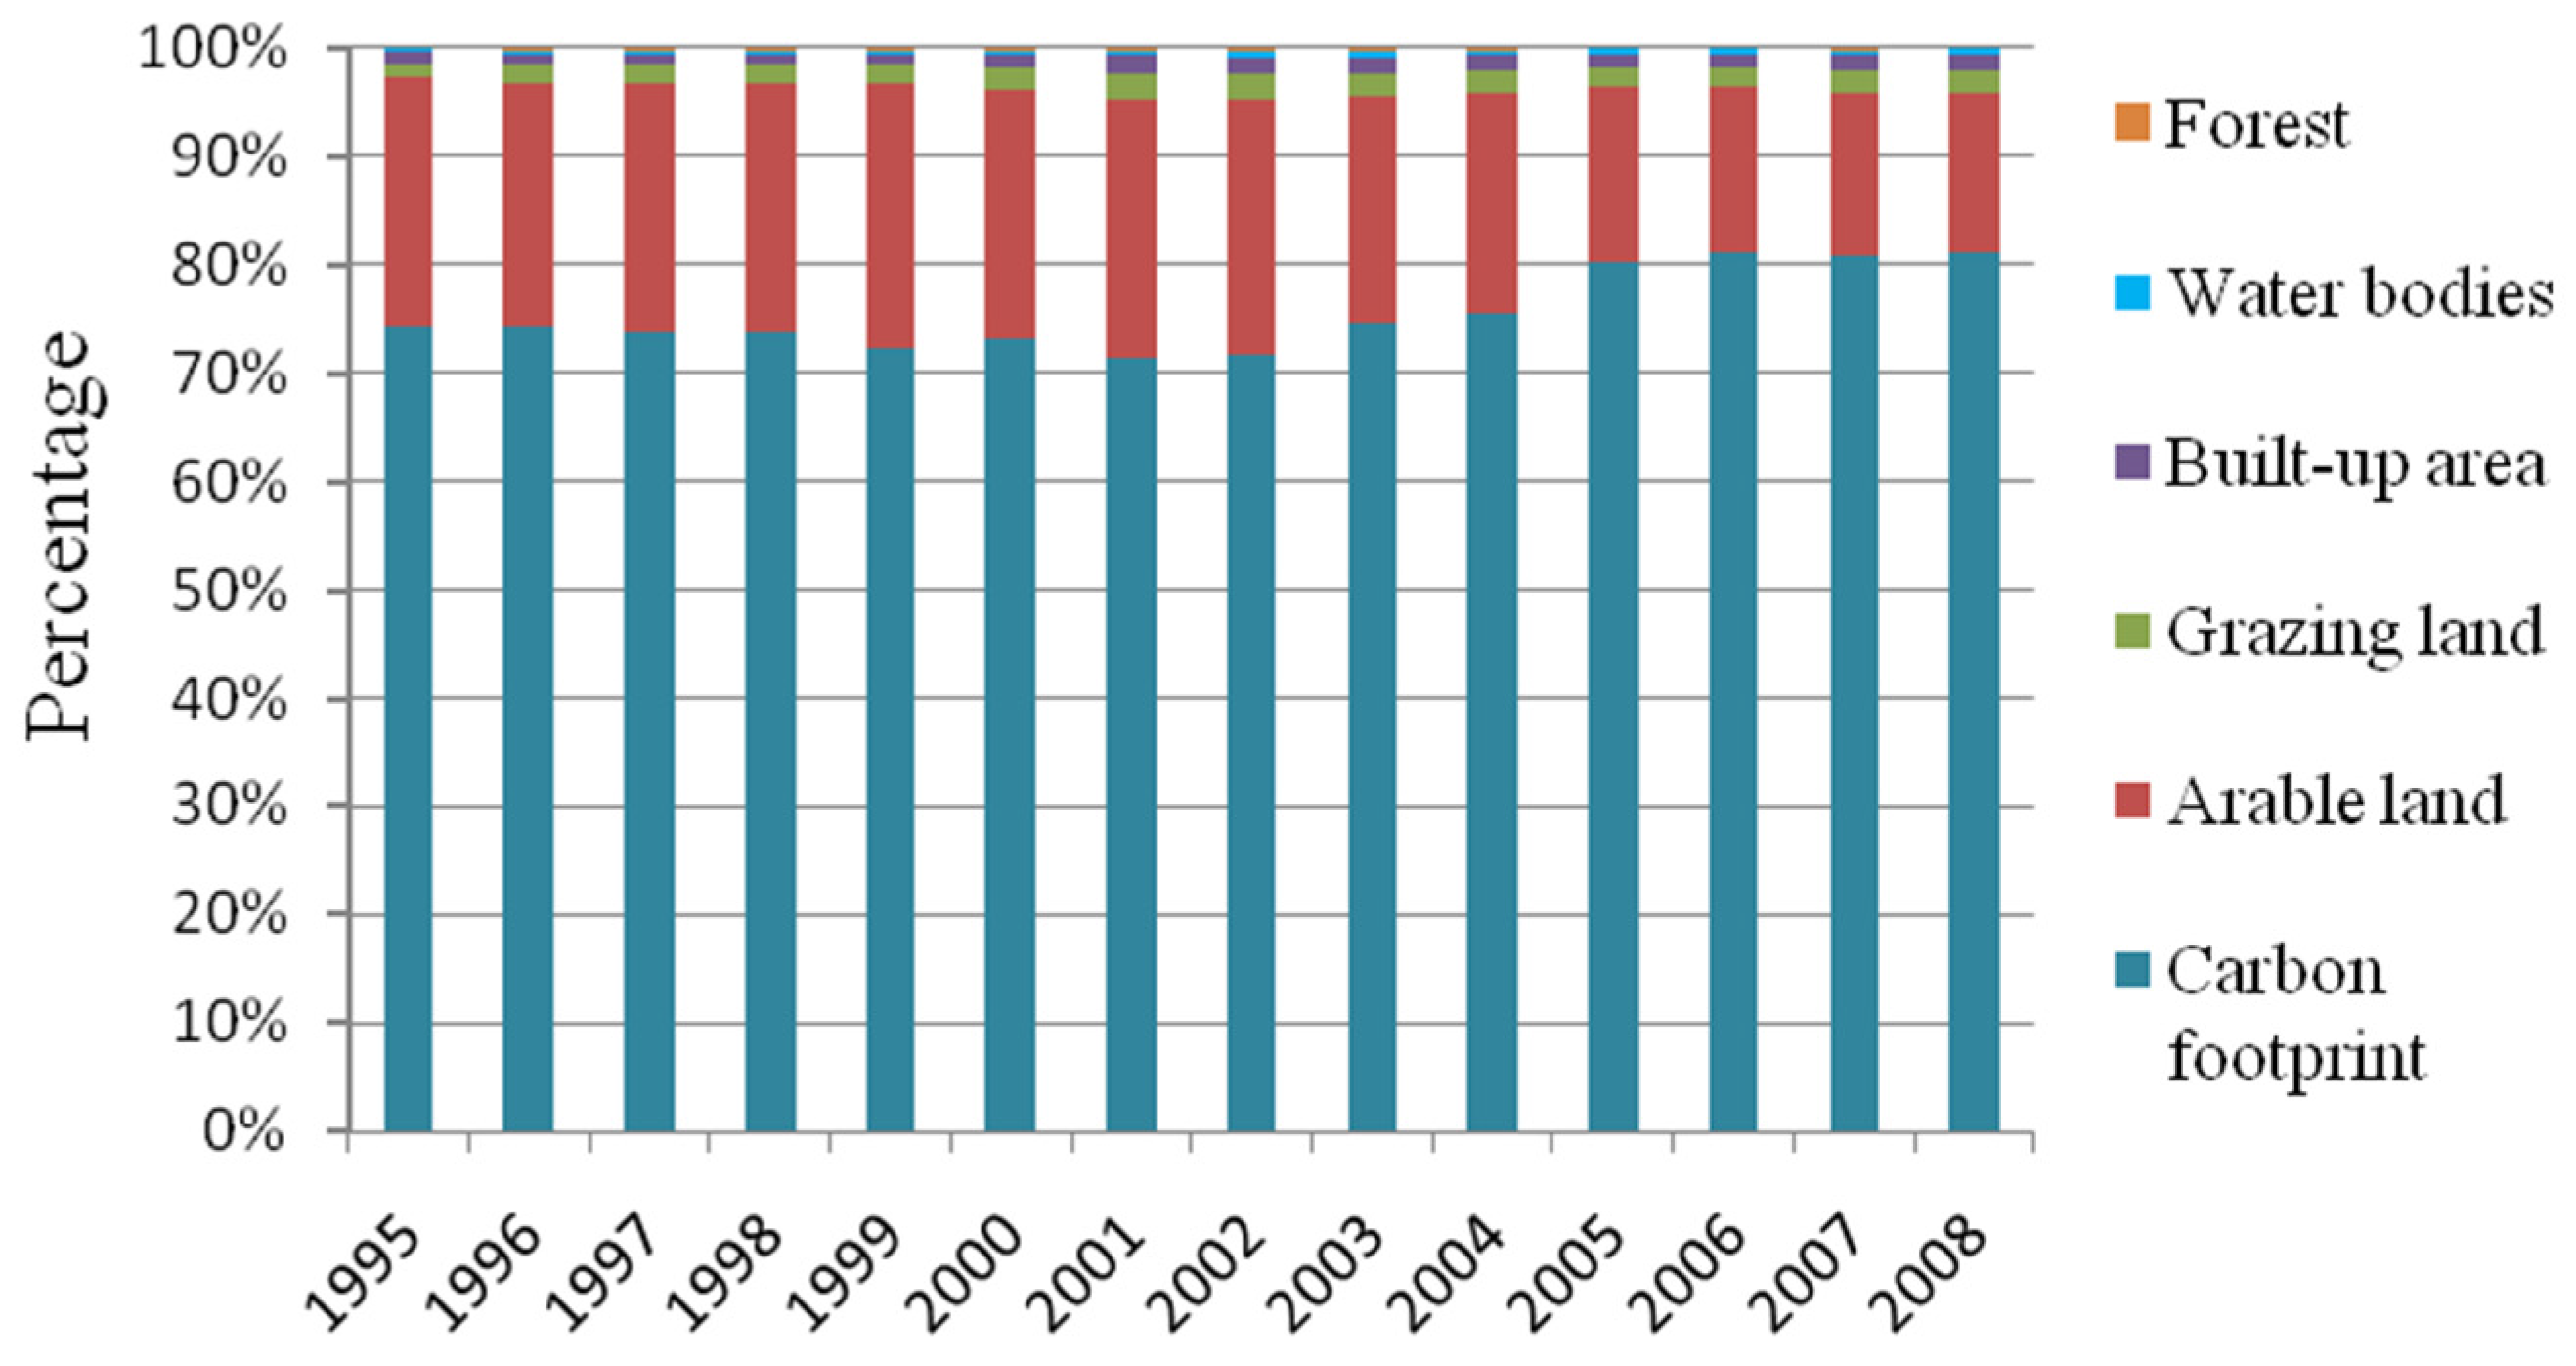
37], who showed the city’s two distinct development phases of the ecological footprint between 1995–2001 and 2001–2008. This implies that temporal changes are comparable with other big cities in China. The discrepancy of the specific EF values in each year probably stems from the differences of the parameters applied in calculation and partly from the differences of the collected source data. The component analysis by Huang also stated that the carbon footprint was the principle component of the total EF of the city in 2012, while indicating that this city demanded and consumed much more than Guangzhou, Beijing and Shanghai at the individual level.
Due to the differences of statistical data ranges among countries, it may be unpractical to relate the specific values of EF or EF per capita in Wuhan to other big cities worldwide. However, the dissimilarity in the EF component between Chinese societies and western countries could be clearly observed: unlike the carbon footprint being the predominant component in the ecological footprint in Wuhan, the major component in Metro Vancouver, Canada, for instance, was the food footprint in 2006, within which the food materials (production) contributed 81% of the ecological footprint, followed by energy consumption such as the transportation footprint and the buildings footprint with operating energy contributing the most [
14]. The enormous variation implicated, to some extent, that fossil fuels were overused in the city compared to similar cities in developed countries.
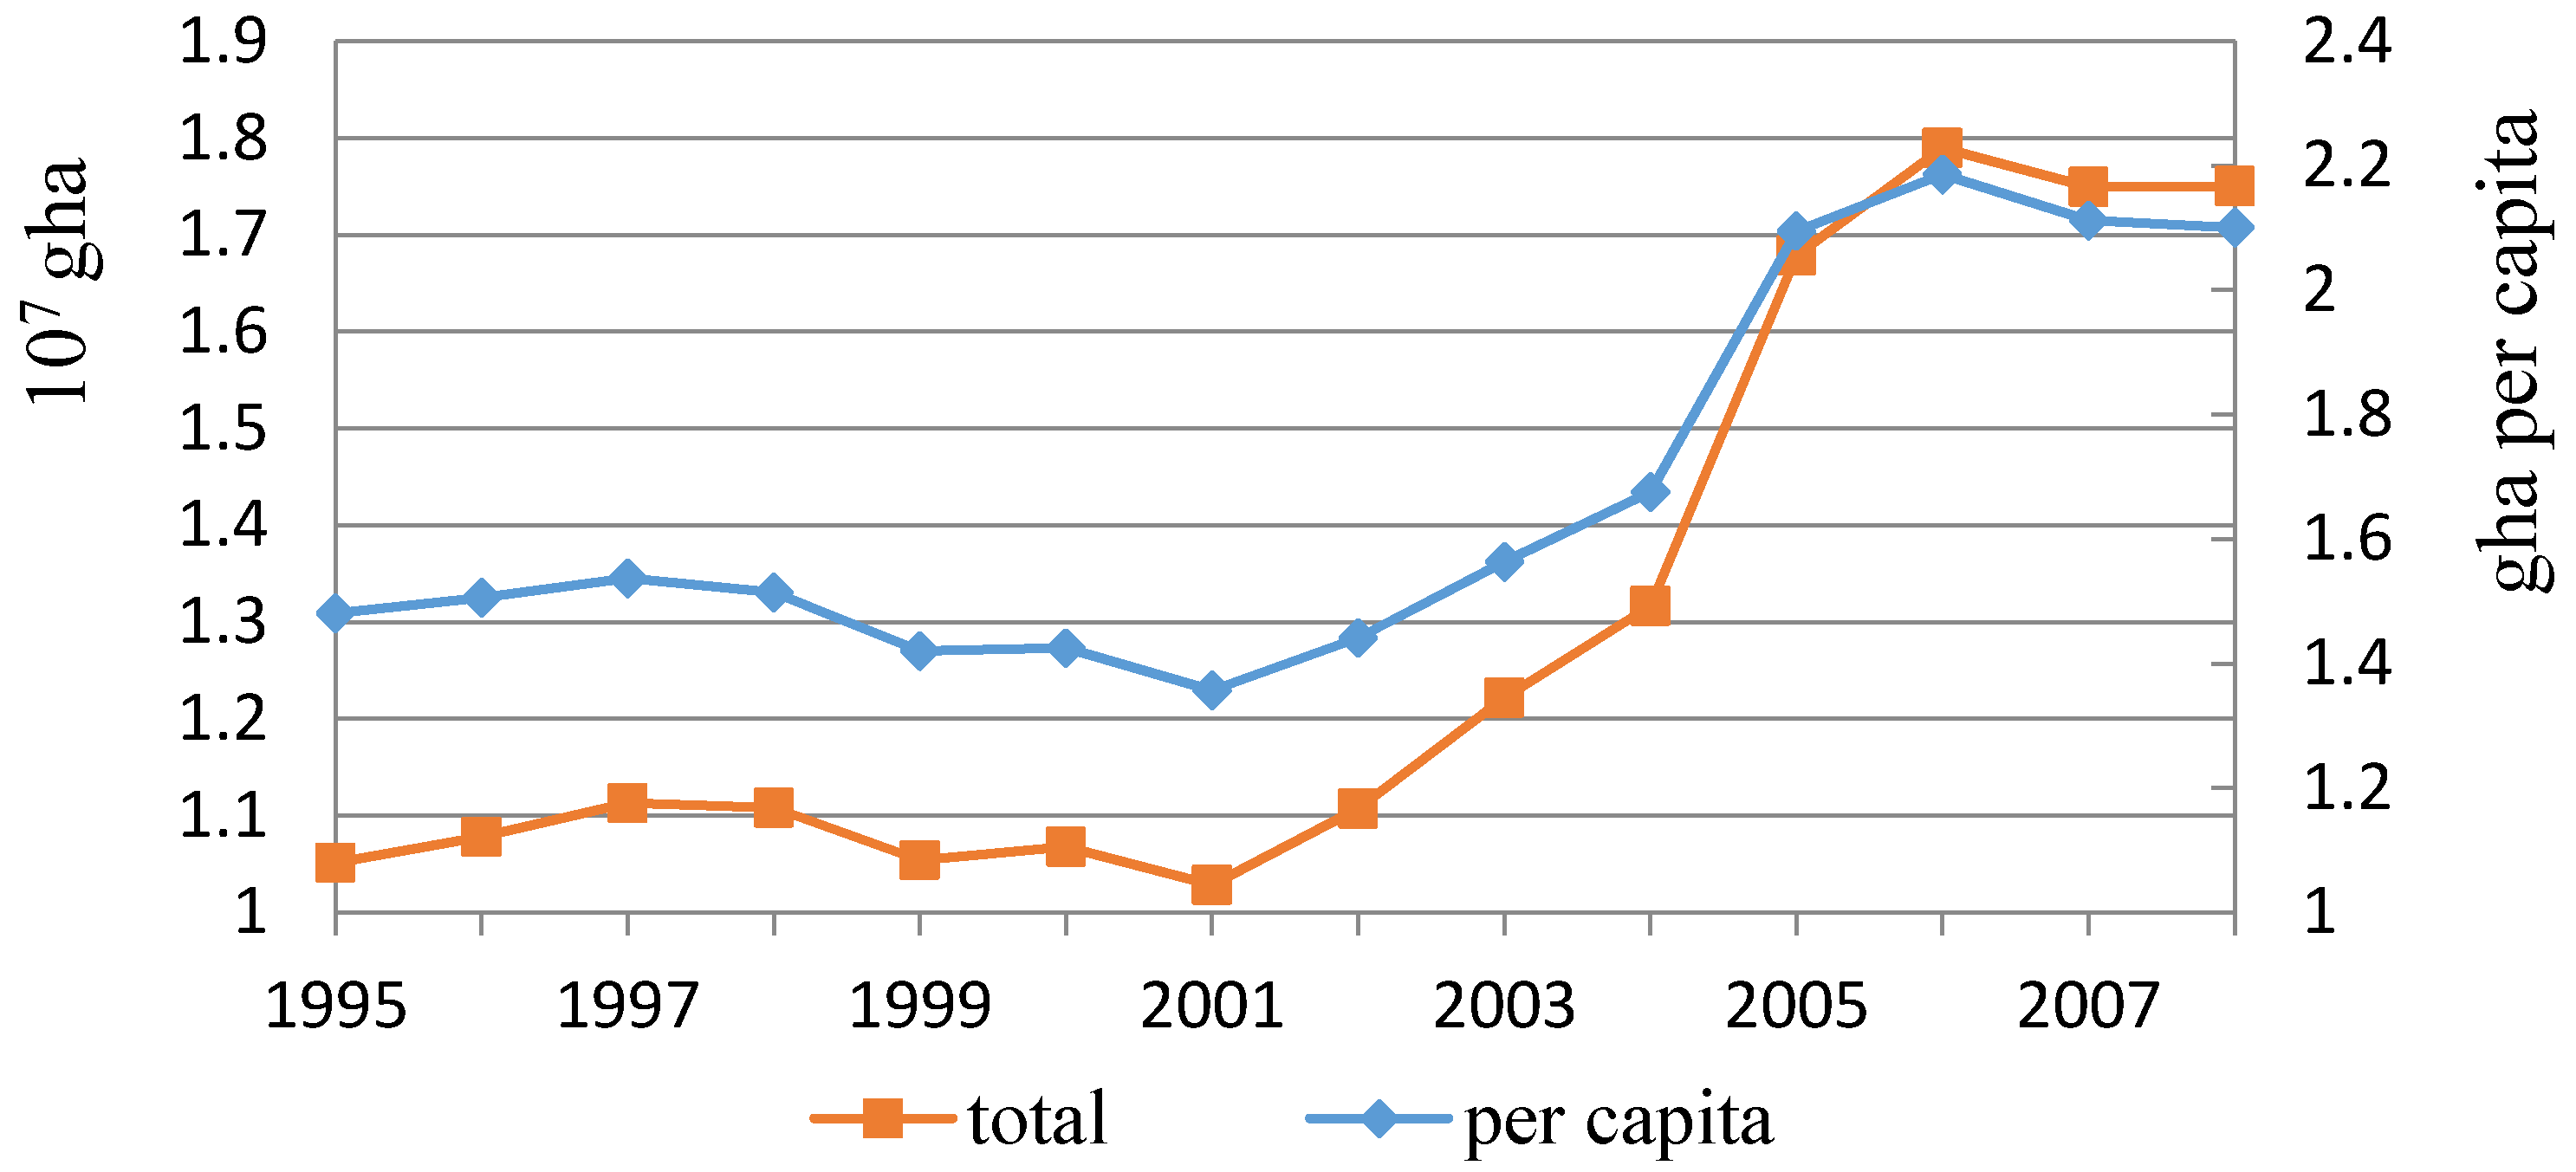
5.2. Implications for Resource Consumption and Regional Land Use
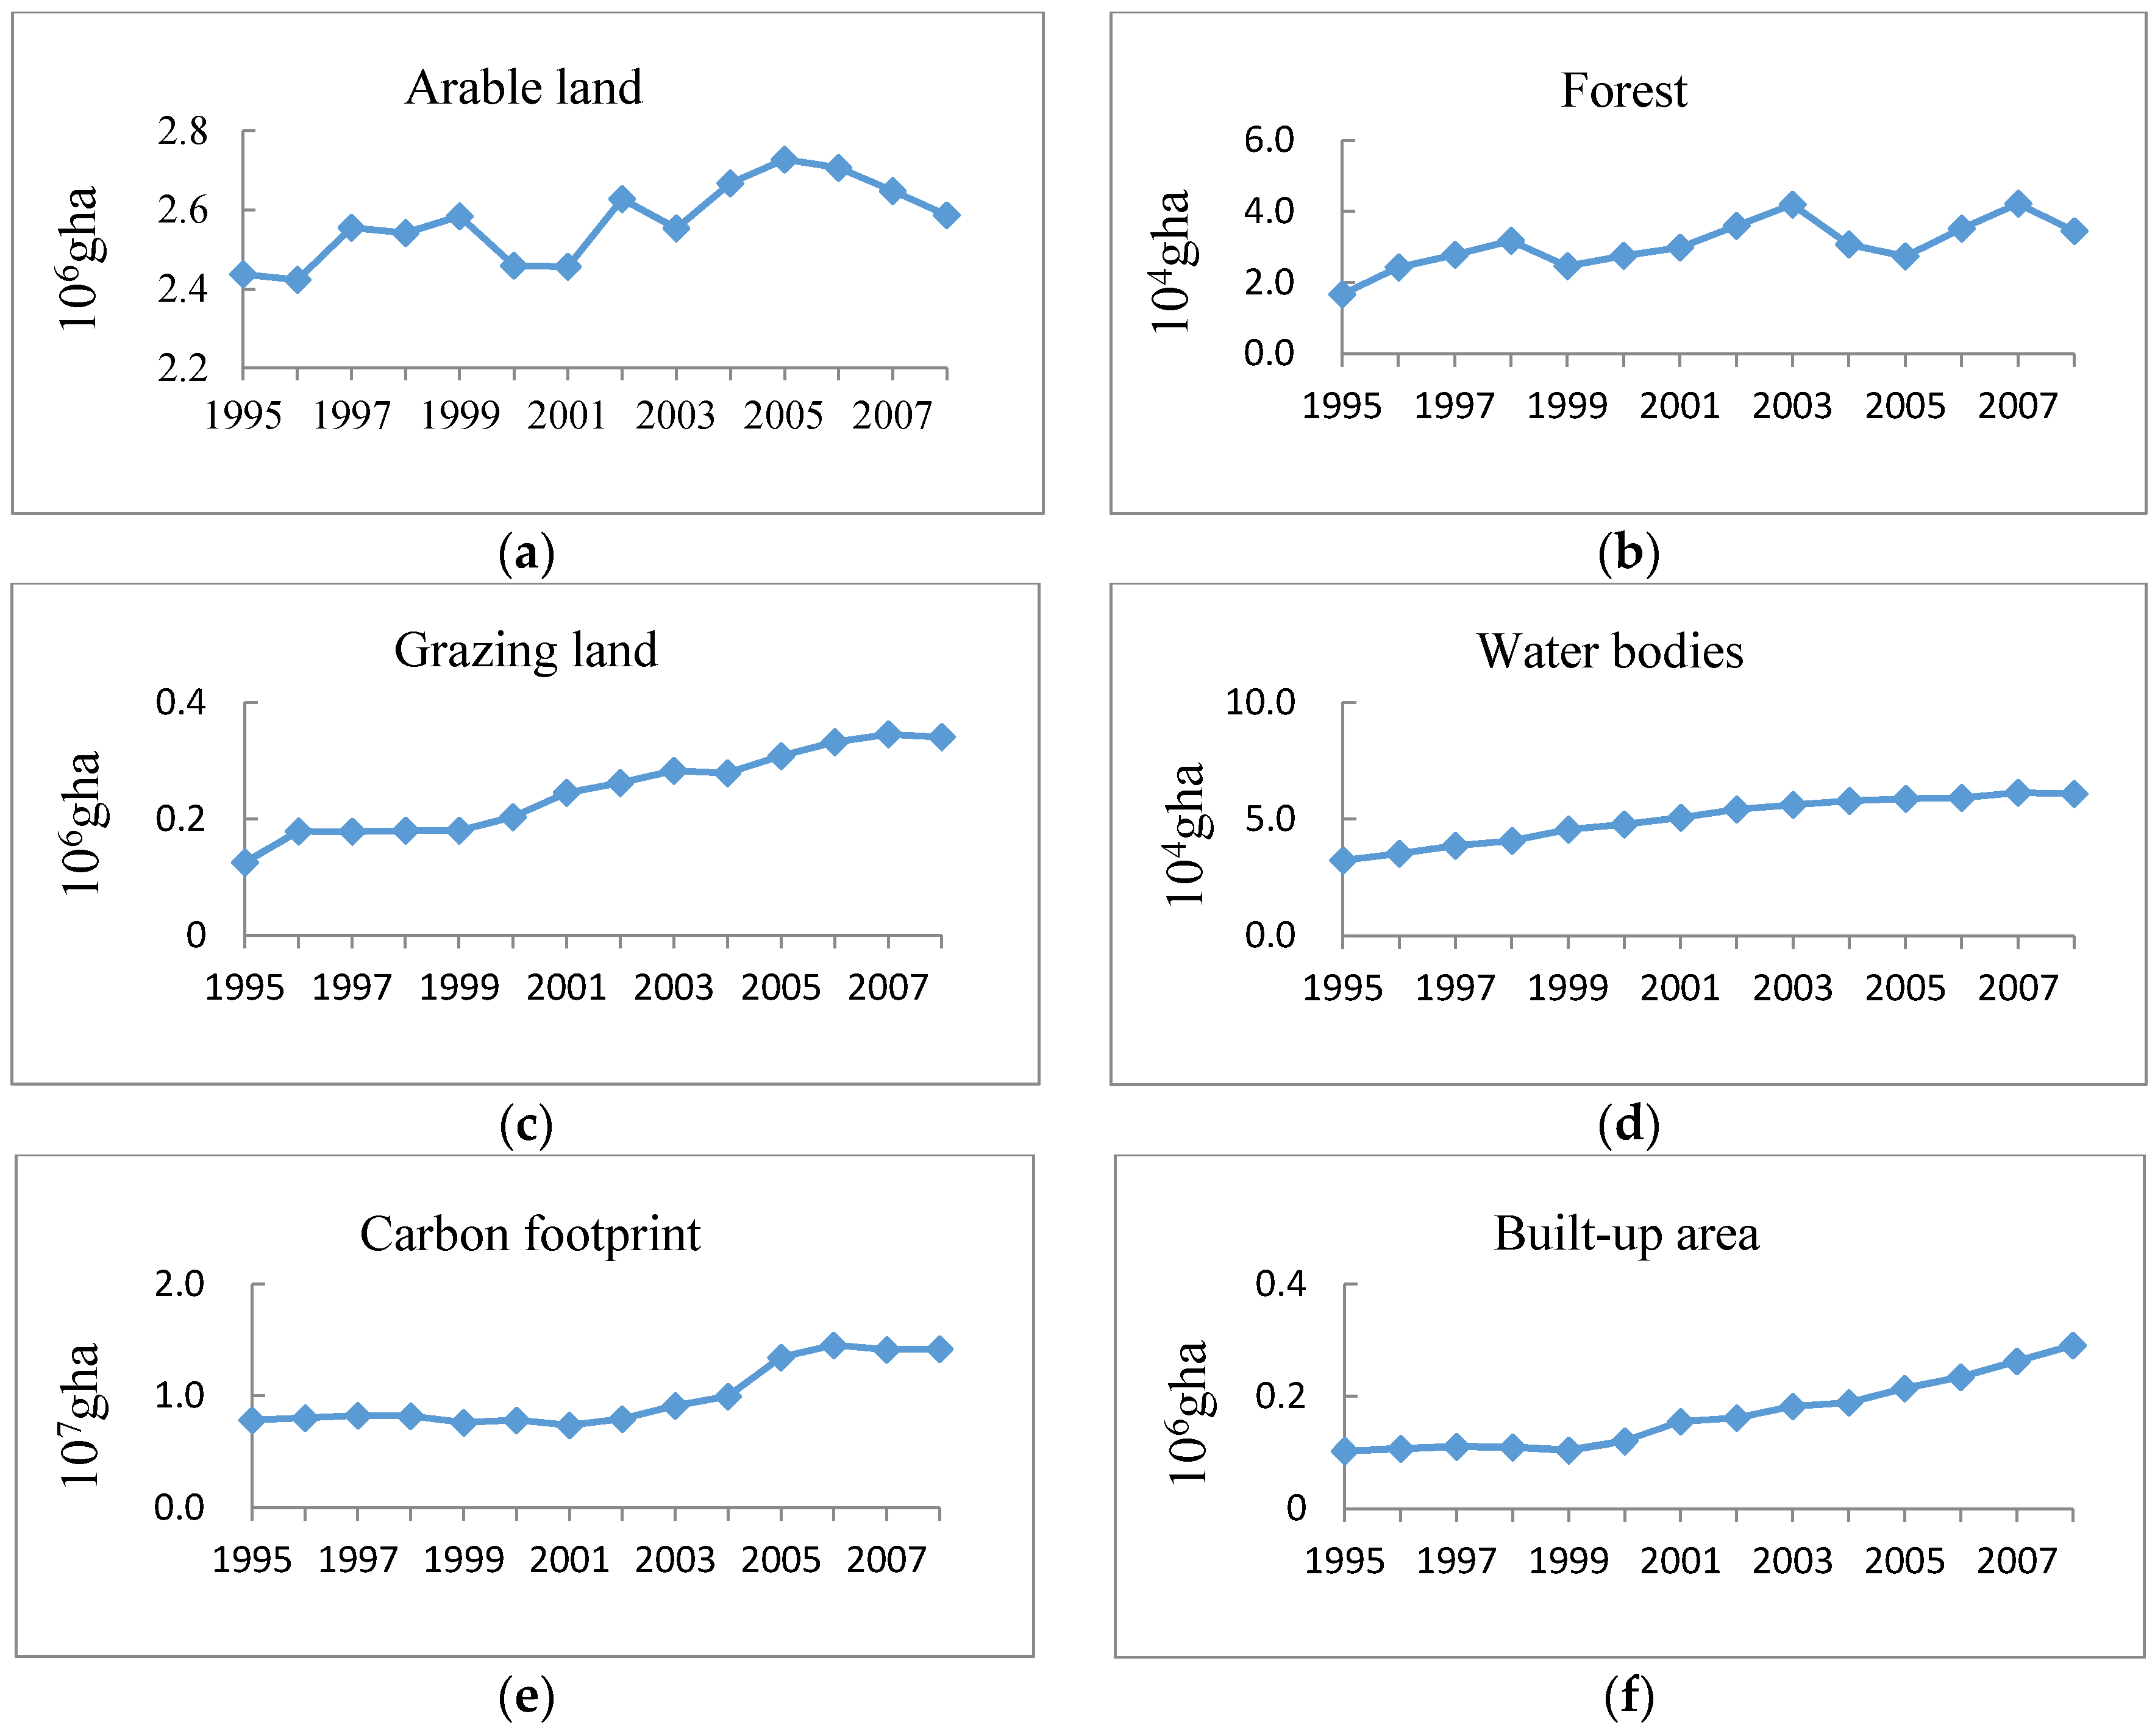
During 1995–2008, both the total amount and per capita amount of the ecological footprint in Wuhan underwent three periods of development: fluctuation at a relatively low level during 1995–2001, then increasing from 2001 to 2006, and a slight reduction again but maintaining a relatively high level during 2006–2008. However, different biologically productive land categories gave different contributions, which means biological products and energy consumption in the region varied significantly with the time.
As for arable land in Wuhan City, which is the predominant productive land providing biological resources, the yields of the main crops, including paddy rice, corn, vegetables and rape seeds, etc., are highly dependent on the plantation areas, which are closely related to complex socio-economic factors such as the conversion of arable land to built-up areas, farmers’ expectations on production cost and income, and agricultural policies. As is known to all that China began its fantastic urbanization process from the late 1990s, large amounts of arable land have been occupied by urban and infrastructural build-ups. A similar situation also happened in Wuhan. The loss of arable land reached 229 km2 within the study period, while the built-up area increased hugely from 618 km2 to 854 km2 during 1995–2008. Under this circumstance as well as accompanying farmers’ migration to cities with higher income, crop farming with lower benefits not attracting young farmers any longer, even though China has cancelled the tax on agricultural products since the very beginning of 2006. As a result, the biocapacity of arable land in Wuhan will probably continue decreasing in the near future, as it showed during the examined time period. That implies the crop-producing potential in this metropolitan region may be extremely limited. Correspondingly, the control of arable land conversion should be strictly implemented to avoid excessive arable land loss, and to prevent the substantial reduction of biocapacity and biodiversity.
Forest contributes as the only land type with a surplus capacity for producing biological resources in Wuhan during the studied period. Although the forest area is not large enough, its amount of consumption is quite moderate. This is highly ascribed to its concentrated distribution, and it plays a significant role in city excursions and recreation for the local inhabitants instead of provisioning forestry products. In contrast, grazing land in Wuhan is dispersedly distributed, and some of it is near the rural built-up areas and is facing degradation. Consistent inadequate utilization of the very limited grazing land results in it ranking in third place in the footprint component but in last place in biocapacity.
Due to comprising the second largest amount of actual area, the biocapacity of water bodies shows an almost stable situation over the 14 years, even though it is very small. However, with the increasing fishery productivity, its ecological surplus unfortunately turned into an ecological deficit, and the gap seems to grow larger with the time. Since natural products in the water bodies in Wuhan became markedly fewer, artificial breeding absolutely dominates the regional fishing industry, and it is obvious to see that the productivity has exceeded its own capacity. As the demand for aquaculture products grows, there will be greater biological risk for waters unless the local government manages to restrain fishermen from overfishing.
Besides biological resource production varying with time, energy consumption accounts for the largest proportions both in the total ecological footprint and in the ecological deficit of Wuhan within the period. Considering the increase of population in the region, which reached 10.33 million in 2014 from 8.33 million in 2008, the quick growth of energy consumption may lead to an exaggeration of the carbon footprint and the regional ecological deficit in future. Since carbon emission caused by the burning of fossil fuels is still increasing worldwide, it could be easily estimated that energy consumption in this quickly industrializing and urbanizing area will keep rising, which will lead to the growth of the carbon footprint. Actually, the decrease in biodiversity and the increase of the ecological deficit during 1995–2008 already showed this situation. What is worth noting is that coal, coke and crude oil are the major energy consumption sources in this city during the studied period. Consequently, substantial cuts in the burning of these fossil fuels could be one of the vital measurements in avoiding more pressures on the local environment and preventing an irretrievable impact on sustainable development.
5.3. Limitations of the Assessment
There are still some uncertainties and shortcomings in this research. First and foremost, the incompleteness of the data source is still an obstacle in improving the accuracy of the ecological footprint and its components, even though we tried our best to collect raw data as much as possible. Failing to collect the land use data in each year during the studied period resulted in only analyzing the region’s biocapacity for the specific years of 1995, 2000, 2005 and 2008, which weakened the accuracy of the changes in biocapacity and the consequential ecological deficit/surplus.
In addition, although the ecological footprint method has made many contributions to sustainability assessment, there are several limitations due to its theoretical design. The global average productivity for energy consumption, for instance, cited from the research by Wackernagel [
5], which is an unchanged productivity factor, is obviously deficient. There already has been research pointing out this weakness that has proposed the net primary productivity (NPP) method to estimate the energy productivity factor [
38], which has widespread applications in ecosystems from the biophysical perspective [
39,
40]. Other major received criticisms included great uncertainties about the equivalence factors, failure to allocate other species [
38], and probable heavy errors in the assessment results based on the global average productivity when calculating at regional scales [
41]. These weaknesses have hindered the wider acceptance and application of the approach.
Furthermore, there were obvious limitations in our current research in terms of discussing explanatory variables, since this work was limited to aiming at examining the dynamic changes of EF and biocapacity as well as the component changes of a typical city in China. The levels of the ecological footprint and EF per capita in a country or a region are highly related to the social and economic characteristics, and they vary significantly in space. Research has shown that the roles of the environmental intensity and income in the variation of EF per capita among nations could not be ignored [
42]. Challenges also exist in, at the basis of the EF component analysis, how to quantify the extent of the contributions of explanatory variables such as economic structure, demographic characteristics and technology towards the ecological footprint, [
43]. Therefore, future explorations that explore social and economic factors related to the regional ecological footprint are needed to deepen EF analysis.
6. Conclusions
Ecological footprint analysis presents an overall view on the people’s impact on natural resources and how the resources are utilized within the region, for instance whether they are overused or what amount of resources is maintained for sustainability.
The work in this paper examined ecological footprint evolution and provided a detailed estimation of footprint changes on the six biologically productive land types in Wuhan City during the time of 1995–2008. The research reveals that the footprints of the productive lands increased most of the time in the region, especially that of the grazing land, water bodies, carbon uptake land and built-up area, showing that there is a great impact on the ecosystem induced by humans’ manufacturing and consumption. Among the six footprint components, the carbon footprint contributed the most across the whole time period, implying a relatively high level of energy consumption. Compared to the declining biocapacity, it was found that a gradually aggravated ecological deficit exists in the region, which increased from 1.12 gha per capita in 1995 to 1.79 gha per capita in 2008. The research also points out that cutting down the consumption of fossil fuels could play a very important role in reducing the carbon footprint and the overall ecological deficit of the city.


