Article

Research on Investment Efficiency and Policy Recommendations for the Culture Industry of China Based on a Three-Stage DEA

1
Economic Management School, Beijing University of Technology, Beijing 100124, China
2
Finance and Economics Development Research Center, Economic Management School, Beijing University of Technology, Beijing 100124, China
3
Energy Studies Institute, National University of Singapore, Singapore 119620
*
Authors to whom correspondence should be addressed.
Sustainability 2016, 8(4), 324; https://doi.org/10.3390/su8040324
Submission received: 19 January 2016 / Revised: 26 March 2016 / Accepted: 29 March 2016 / Published: 31 March 2016
(This article belongs to the Section Economic and Business Aspects of Sustainability)

Abstract

:
The China State Council promulgated the “Culture Industry Promotion Plan” on 26 September 2009, raising the status of the culture industry to that of a strategic industry. This paper applies a three-stage data envelopment analysis (DEA) model to investigate the efficiency of investments made in the culture industry in 2011 in China. The results show that the overall efficiency of the culture industry in China is still at a relatively low level. The scale of companies in the culture industry is a key factor restricting development. The external environment has a great influence on this efficiency; the efficiency gap between the eastern, central and western areas is obvious and reflects the degree of the environmental impact on the culture industry in these regions. The western region will experience progress if the environment changes. In contrast, the central and eastern regions will see less progress. This paper proposes the following corresponding policy recommendations based on the analysis. (1) China should focus on expanding the scale of culture industry enterprises. (2) We need to accelerate the market-oriented reform of cultural institutional mechanisms. (3) We should pay attention to the efficiency gap between cultural industries in the eastern, central and western areas. We should use government power to support the development of cultural industries in the western region.

1. Introduction

Since China implemented its reform and “opening up” policy thirty years ago, the rapid development of its economy has drawn the world’s attention. Currently, China is the world’s second-largest economy. However, when we study China’s growth pattern, we find that China has always followed a straightforward development path. Culture, which can be an industrial or an economic attribute, has substantial development potential and connects the economic base with superstructures. Developing the culture industry can drive China’s economy and expand its international influence. Therefore, the culture industry represents an advanced mode of economic development. In this period of economic transition, the Chinese government has gradually realized the economic development potential of the culture industry; it is considered a “soft power” that could boost economic transition. Therefore, the culture industry has been promoted as a key industry and a low-carbon industry, and corresponding investments have been increased.
In recent years, the government has introduced a variety of policies to encourage the development of the culture industry. The State Council initiated the “Culture Industry Promotion Plan” on 26 September 2009, raising the status of the culture industry to that of a strategic industry. The People’s Bank of China, together with the Central Propaganda Department, the Ministry of Finance, the Ministry of Culture and nine other departments, jointly issued the “Guiding Opinions on Financial Support for Culture Industry Development and Prosperity” on 19 March 2010. This document is the first guidance supporting the development of the culture industry, and it means that cooperation between the financial and culture industries has finally gained policy support. In 2012, the Ministry of Culture issued a “Twelfth Five-Year Plan Period Culture Industry Doubling Plan”, which proposed that, during the “Twelfth Five-Year Plan” period, the average annual value added of the culture industry should grow at a rate higher than 20%; this means that culture industry development should finally be enacted. However, few empirical studies are available to help Chinese policy makers to understand the investment efficiency in the culture industry. The purpose of this study is to investigate the following mysteries.
Given this background of policy support, this paper addresses two problems: how much will the development of the culture industry be improved, and can large-scale investment lead to efficiency improvement? This paper applies a data envelopment analysis (DEA) model to study the operational efficiency of culture industry investment in China in the year 2011. The model eliminates environmental and random factors. Therefore, the results reflect the real level of operational efficiency.
The rest of the paper is structured as follows. Section 2 reviews the literature of culture industry investment and the literature of culture industry investment efficiency. Section 3 introduces the three-stage DEA model. The selection of variables and the source of data are provided in Section 4. Efficiency measurement using the three-stage DEA model and an interpretation of the results are given in Section 5. Section 6 analyzes efficiency in the culture industry by province, and the last section concludes the paper.

2. Literature Review

Cultural regeneration and cultural industries are widely investigated in different countries and cities [1,2,3,4,5].
The literature on cultural industries can be confusing. Several authors refer to cultural industries, while others refer to cultural product industries or creative industries. Collectively, these industries take many names: cultural industries, creative industries, cultural product industries, the creative economy, and the cultural economy [6,7,8,9]. Gonzalez et al. [10] confirm that social networks can influence the flow of cultural goods and services from providers to consumers. We believe that culture creative industry and culture industry are the same and include technological innovation.
In the following, we will review the literature on investment in culture creative industry investment and in culture industry investment.

2.1. The Literature Review of Culture Industry Investment

A report from the World Bank [11] noted that culture industry investment is an important component of economic investment, which is an important factor of world economic operations. Choi [12] shows that in the US, Japan and Europe, where the annual investment growth rate reaches 35%, there are many ways in which government money and foreign investment can help. Banks [13] noted that risk and active trust play an important role in culture industry investment and financing and studied how to control this risk.
Chinese scholars have also conducted studies on the financing of and investment in the culture industry. Zhang and Zhou [14] proposed establishing a diversified system of investment and financing, where national capital occupies the leading position and private capital has the highest status. Xie [15] noted that there are three reasons for financing difficulties in the culture industry: (1) culture industry products are an intangible asset; (2) current culture industry companies are mostly small and medium-sized enterprises and, therefore, their scale is small; and (3) the development of culture industry enterprises is not yet mature (e.g., many enterprises have not yet established a standardized financial system). Yu and Ren [16] summed up the characteristics of financial innovation in China’s culture industry and found a new way to finance: to loan cash by pledging ownership of a few enterprises. Li [17] noted that measures taken by developed countries in Europe and North America, such as preferential treatment for the culture industry, national treatment for international capital, the establishment of a national investment fund, and financial innovation, are effective ways to solve culture industry investment and financing problems. He also noted that China’s culture industry investment and financing system must be perfected. Wei [18] reviewed the challenges faced by China’s culture industry.

2.2. The Literature Review of Culture Industry Investment Efficiency

Chinese scholars have made some achievements addressing the efficiency of the culture industry by applying the DEA model. Wang and Zhang [19] applied the DEA model to study the efficiency of culture industry investment in 2004 in China. The results showed that the overall efficiency of the culture industry remains at a relatively low level in China after eliminating the influence of random and environmental factors. Ma and Zheng [20] applied the Banker-Charnes-Cooper (BCC) DEA model to study the efficiency of culture industry investment in in China between 1998 and 2006. The results show that there are regional differences in the efficiency of the culture industry. He et al. [21] employed the Malmquist productivity index model to study the entire essential factor productivity of the culture industry; the results show volatile growth from 2005 to 2009 and that the culture industry in the west has lagged compared with the central and eastern regions. Jiang and Wang [22] applied a three-stage DEA model and a super efficiency DEA model to analyze the efficiency of culture industry investment in Chinese provinces using data from the second economic census. The results showed that culture industry efficiency in different provinces is greatly affected by environmental factors and that scale inefficiency is the main driver of low efficiency in the culture industry. Zheng and Ge [23] showed that the most efficient way to deepen cultural restructuring is to improve efficiency in the culture industry.

2.3. The Literature Review of the Different Applications of DEA

DEA has been employed in different studies. Simões and Marques (2012) [24] summarized that DEA is the most representative methodology to evaluate the efficiency of waste utilities. Marques et al. (2014) [25] applied DEA to study institutional and environmental factors affecting efficiency of Japanese Water Utilities.
Li and Lin (2016) [26] employed DEA to study the impact of energy conservation policies on the green productivity in China’s manufacturing sector. Stewart et al. (2016) [27] applied DEA to study the efficiency in the Vietnamese banking system.
Overall, we find that the data used in the existing research are generally from before 2009 and rarely involve the efficiency of financial support for the culture industry. Therefore, this paper applies a DEA model and performs empirical analyses using financial data on the listed companies in the culture industry. This work builds on earlier works, expanding and updating them by addressing the efficiency of financial support for the culture industry.

3. Research Method

The DEA model is employed to study efficiency [28,29,30,31], particularly investment efficiency [32,33,34,35]. Charnes, Cooper, and Rhodes (1978) [32] be abbreviated to CCR Model by their creators. Banker, Charnes, and Cooper (1984) [33] be abbreviated to BCC Model by their creators.

3.1. Stage I: The Traditional DEA Model: from CCR Model to BCC Model

In 1978, Charnes et al. [36] first proposed data envelopment analysis, which is a nonparametric method based on the Pareto theory to measure efficiency. The effectiveness of the distance function and the input technology measure are based on the formula study. The theory is that (1) if and only if the input increases or the output decreases, the yield will increase, and that (2) to only reduce output, input should be reduced.

3.1.1. CCR Model

Charnes et al. [36] presented the constant returns to scale model. According to the DEA model, assume that there are n decision-making units (DMU), each of which represents a listed firm in the culture industry. The input vector X = (x1, x2, …, xm) T, while the output vector Y = (y1, y2, …, ym) T. Based on the assumption that any DMU is convex, subulate, invalid and minimum, the production possibility set is
T = { ( X , Y ) | j = 1 n λ j X j X , j = 1 n λ j Y j Y , λ j 0 , j = 1 , 2 , , n }
Therefore, we can obtain the CCR of the DEA model:
M i n [ θ ε ( i = 1 m s i + r = 1 s s r + ) ] s . t . j = 1 n x i j λ j + s i = θ x i j o i ( 1 , 2 , , M ) j = 1 n y r j λ j s r + = θ y r j o r ( 1 , 2 , , S ) θ , λ j , s i , s r + 0 j = 1 , 2 , , N
s i and s r + in the formula are the slack variables; m and s represent the input and output indexes, respectively. Taking the listed companies of the culture industry for our research sample as an example, x i j o and y r j o represent the I input item and the r output item of the jo culture industry company, which can be represented by (x0, y0). ε is the non-Archimedes infinitesimal, which represents the infinitesimal in the calculations.
Using Formula (2), we can calculate the technical efficiency (TE), which shows whether the financial support is effective in the addressed companies and whether output is maximized. As the size of the figure increases, the efficiency of financial support increases. Formula (2) implicitly assumes constant returns to scale, which means that the company increases production by the same percentage for a given investment as input; in other words, the scale of the investment does not affect efficiency.

3.1.2. BCC Model

The assumption of constant return to scale is not established in most cases and is different from actual circumstances. Therefore, we constructed a BCC model [37]. The BCC model is a type of DEA model and offers variable returns to scale. Additionally, the production possibility set still applies (see Equation (1)). Therefore, we can obtain the BCC model:
m i n [ θ ε ( i = 1 m s i + r = 1 s s r + ) ] s . t . j = 1 n y r j λ j s i + = θ y r j o r ( 1 , 2 , , s ) j = 1 n x i j λ j + s r = θ x i j o i ( 1 , 2 , , m ) j = 1 n λ j = 1 θ , λ j , s i , s r + 0 , j = 1 , 2 , , N
The variables in Formula (3) are the same as those defined for the previous model. We assume that the scale is variable, so technical efficiency is pure technical efficiency (PTE). PTE and scale efficiency (SE) can be calculated in Formula (3).
The number of domestic culture industry enterprises is high, the scale is currently small, and the reform of cultural institutions is incomplete. Therefore, the analysis in this paper will begin with the investment and apply the investment-focused BCC model, which is based on the assumption of variable returns to scale. Analyzing changes in output under the same conditions to achieve the minimum investment will indicate a direction for the further development of the Chinese culture industry.
Because the first stage of the DEA model cannot distinguish whether efficiency is caused by internal or external factors, a second stage is required.

3.2. Stage II: Similitude Analysis for the SFA (Stochastic Frontier Analysis) Model

From the first stage, we can obtain the efficiency value, as well as the input difference for the DMU, which is the difference between actual investment and the most efficient investment. Based on the analysis in the first stage, Fried et al. [38] used stochastic frontier analysis (SFA) to regress first stage performance measures against a set of environmental variables. Fried et al. [38] find that input/output slack variables are affected by three factors: environmental factors, random factors and management efficiency.
The SFA method is a parametric model. The SFA method requires exists a certain relationship between output and input.
The regression equation of the SFA model is
S n i = f n ( z i + β n ) + v n i + u n i ; n = 1 , 2 , N ;   i = 1 , 2 , I
S n i is the slack variable of the I sample investment in the n DMUs. z i = ( z 1 i , z 2 i , , z k i ) are the k observable environmental variables.   β n is the parameter to be estimated for the environmental variables. f n ( z i + β n ) represents the influence of the environmental variables on the redundant variables S n i . v n i + u n i are the mixed errors. We assume that v n i ~ N ( 0 , σ v n 2 ) represents the influence of the random variable, and u n i 0 represents management inefficiency.
Based on the most effective DMU model and using its input as a reference, the other sample’s input is adjusted as follows:
x n i A = x n i + [ m a x i { z i β ^ n } ] + [ m a x i { v ^ n i } v ^ n i ] ,   n = 1 , 2 , , N ;   i = 1 , 2 , , I
x n i and x n i A are the level of investment in each DMU before and after the adjustment, respectively. The first bracket states that all DMUs adjust to the same external environment. The second bracket adjusts the random errors of all DMUs in the same context so that each DMU faces the same operating environment and has the same luck.

3.3. Stage III: The Adjusted DEA Model

The original input data x n i is replaced by x ^ n i , which is the adjusted input data. The BBC is then used to analyze efficiency. The efficiency of each DMU results from eliminating external environment factors and random value factors, which can reflect the actual operation status of each DMU.
DEA method is non-parametric model. The advantages of non-parametric DEA are the followings.
We need not to determine the explicit expression between output and input. We just need to have input and output observations when we use DEA method.

4. The Selection of Variables and the Source of Data

4.1. The Selection of the Input and Output Indexes and the Source of Data

The selection of the input and output indexes is an important component of an analysis based on the DEA model. DEA is a measure of efficiency, and the input and output of each DMU are the fundamental components of efficiency. Therefore, the selection of the input-output indexes directly determines the measurement of efficiency.
In this paper, the production and equity methods are used to select input and output indicators. Combining the characteristics of the listed culture industry companies and lessons drawn from the criteria, we selected paid-in capital, the number of corporate units and the average number of employees of the culture industry as the input index. The output index is the operating receipts and the added value of the culture industry. The input and output indexes and the environmental variables can be seen in Table 1.
The number of DMUs should be at least double the sum of the inputs and outputs when we undertake the efficiency analysis. There are 31 DMUs in this paper, and the input-output index is 4, which meets the specification. In addition, the input and output indexes must have a positive correlation, which means that the input and output indexes should increase or decrease together. Therefore, we must perform a correlation test for the selected index. We used SPSS17.0 for the testing, and the result can be seen in Table 2.
From Table 2, at the 1% significance level, the correlation coefficients between the culture industry input and the output indexes are positive. Based on a two-tailed test, the indexes can be considered to have a significant positive correlation. Therefore, they are suitable for analyzing efficiency using the DEA model. The input and output index data are from [39].

4.2. The Selection of the Environmental Variables and the Data Source

The environmental factors eliminated in the second stage can be called external factors. For the culture industry, the environmental variables should be factors that affect the efficiency of the culture industry but that are not subjective or controllable. Taking an integrated view, these factors are economic development, social systems, cultural systems, human resources, government support and level of technology. Specifically, the environmental variables are as follows.
(1)
Economic development. There are two indicators: (a) per capita GDP (gross domestic product), which represents the value of a country’s or a region’s production and all services for a defined period of time. GDP is the best indicator to measure the level of economic development for a country or a region. As a type of high-end consumption in people’s daily lives, cultural needs can be influenced by the economic level of an area. (b) The average pay of culture consumption is a direct factor that affects cultural access.
(2)
The cultural system. The number of corporate units in the culture industry reflects the structure and scale of a regional culture industry market. The number of cultural institutions is the basis for the development of the culture industry in an area.
(3)
The urbanization ratio. This important social factor is calculated by taking the ratio of the urban population to the total population.
(4)
Human resources. The level of education for residents is calculated based on college degrees or the proportion of the population aged 6 and over.
(5)
The government. The influence of the government cannot be ignored. We use the proportion of cultural costs in government spending.
(6)
Science and Technology. The culture industry is a high-end model of economic development, which is combined with advanced technology. Development is thus limited by the local level of science and technology. Therefore, we use the number of patent applications as a variable to measure the level of the science and technology.
For the analysis, information on GDP, cultural and entertainment consumption expenditure per capita, the urbanization rate, and residents’ educational level is taken from the following studies [40,41,42,43].
Information on the number of corporate units in the culture industry, the number of cultural institutions, the proportion of cultural costs in government spending and the number of patent applications is from the following studies [44,45,46].
In this paper, the data are economic census data, ensuring timeliness.

5. Measurement of Efficiency Using a Three-Stage DEA Model and Interpretation of the Results

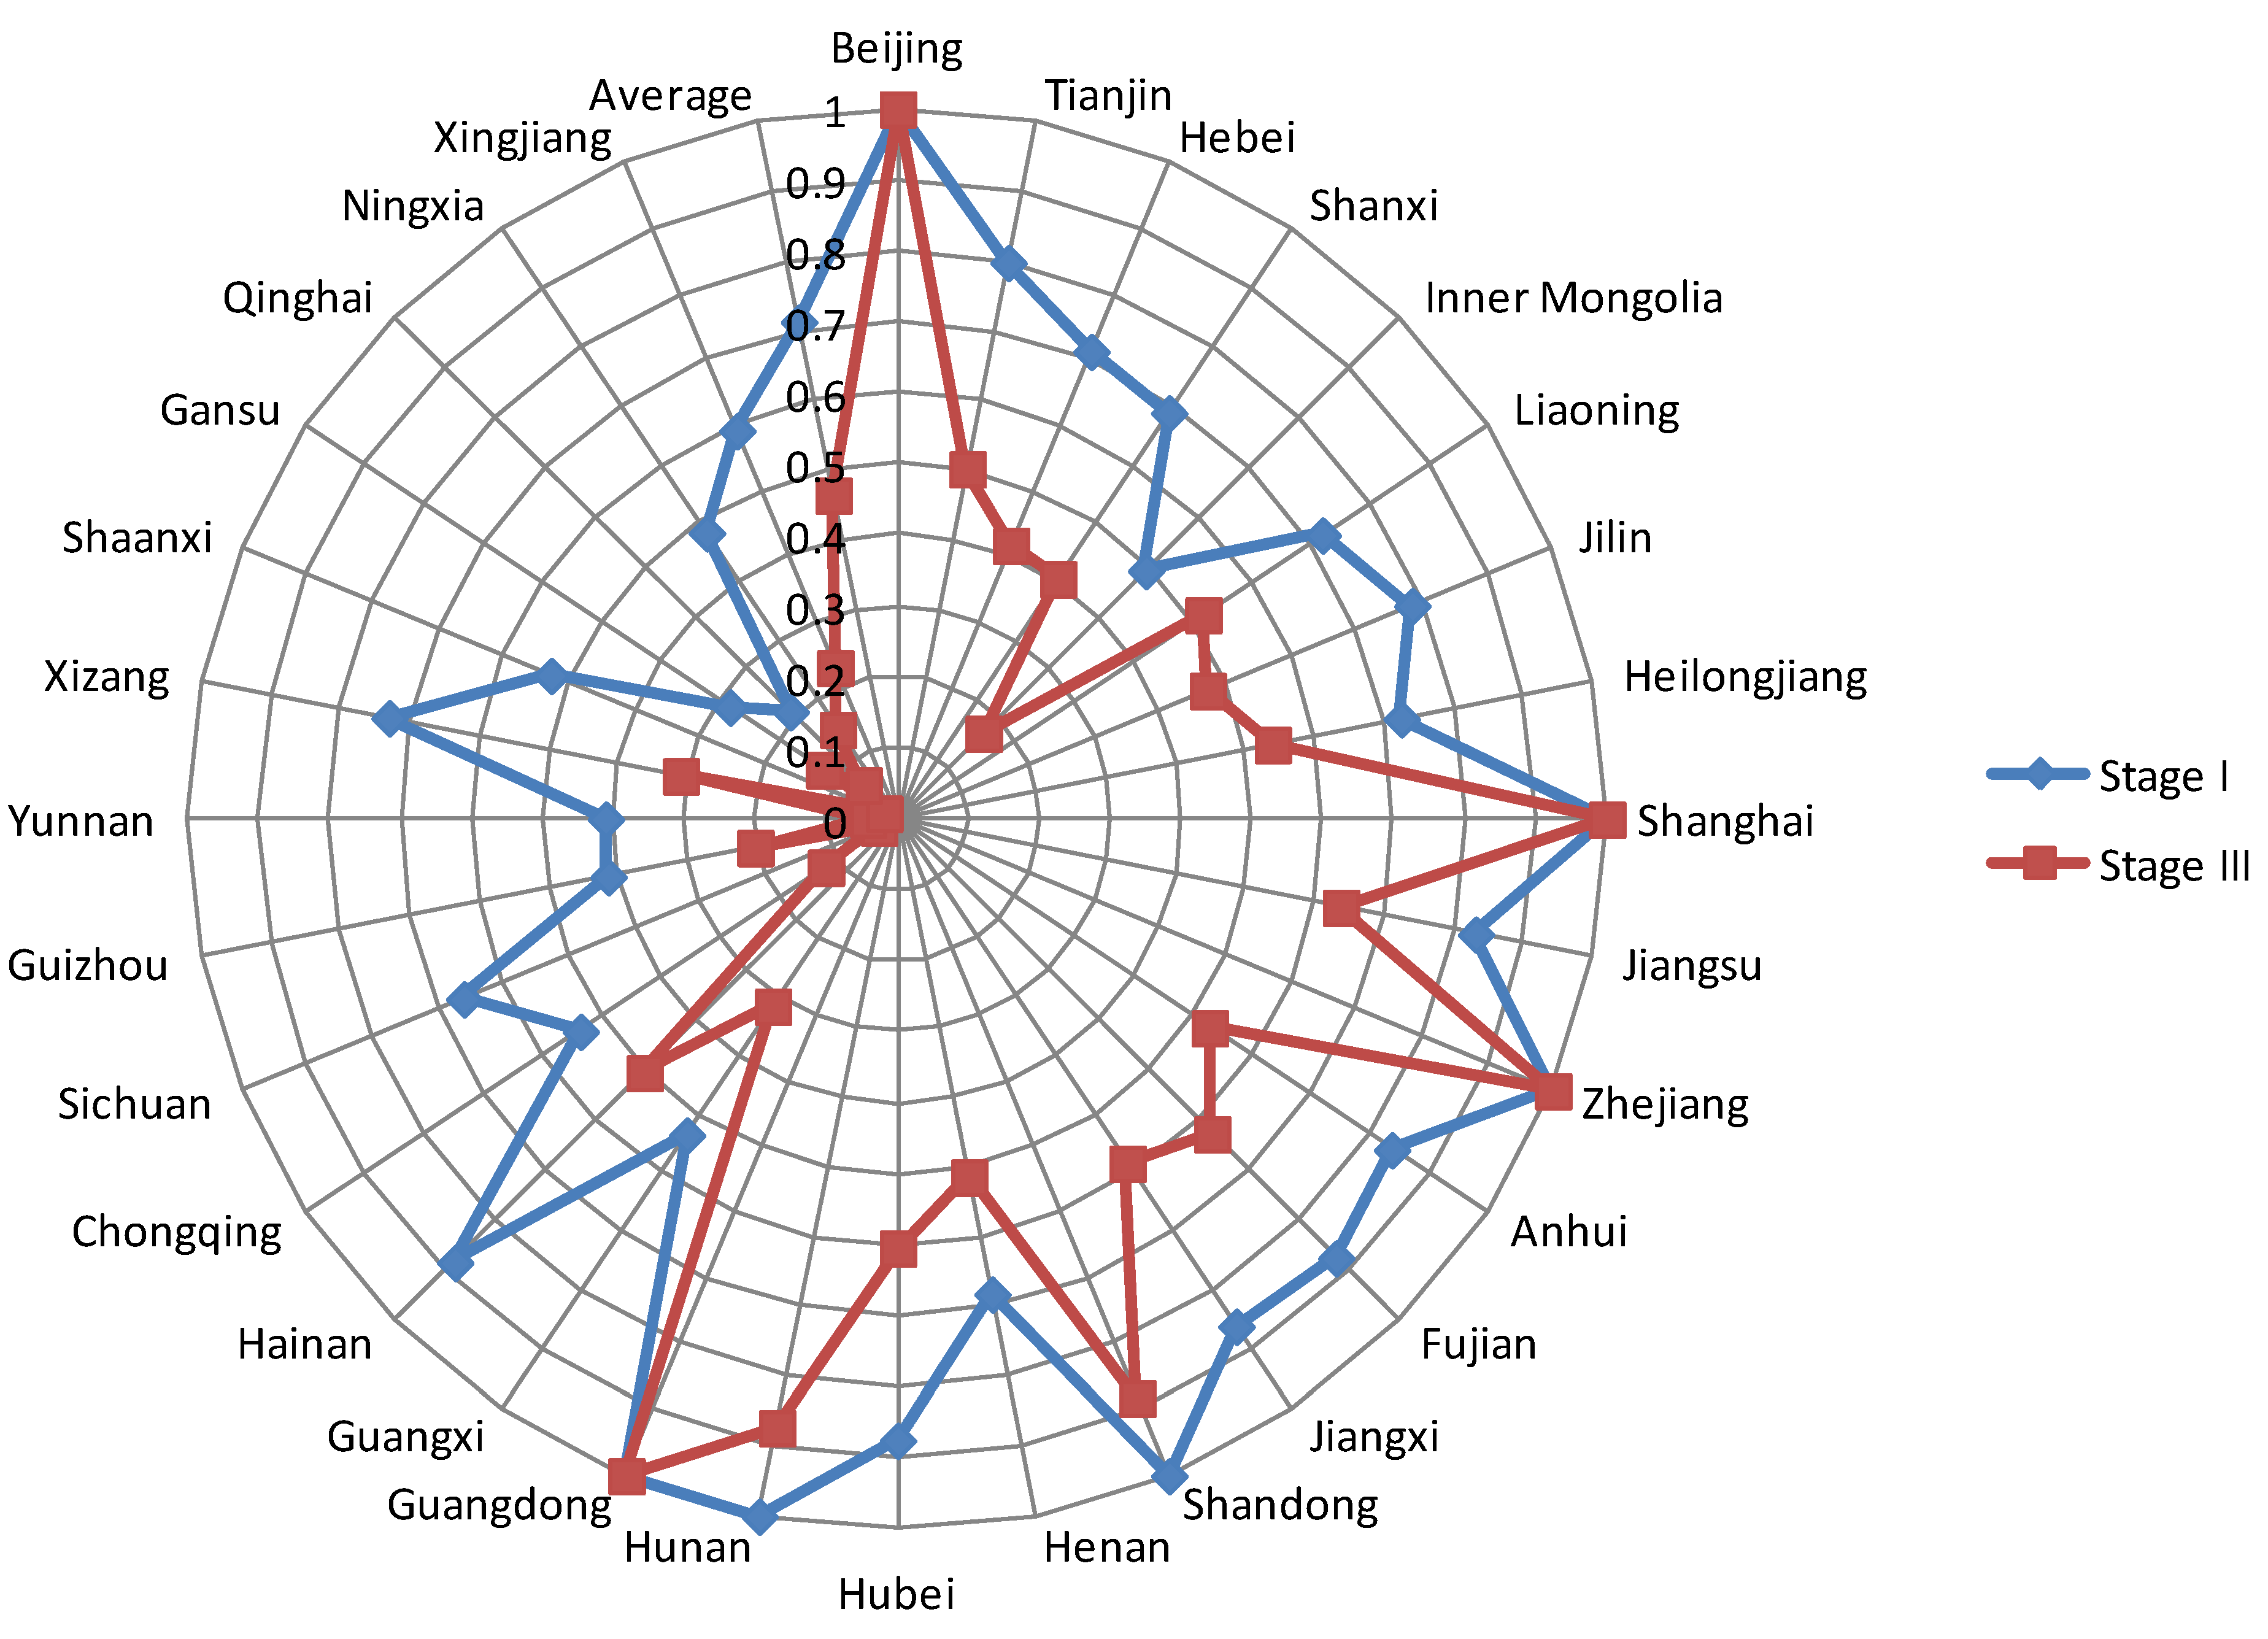
5.1. Stage I: Empirical Results Using the Traditional DEA

Based on the input and output indexes of the culture industry in 31 provinces, we can use DEAP2.1 software and the DEA model to answer our questions. After analyzing the efficiency and returns to scale of China’s culture industry in 31 provinces, the results are shown in Figure 1 and Table 3.
From the first stage of the traditional DEA efficiency measurement, it can be seen that, in 2011, for 31 provinces in China, the average value of the culture industry investment operational efficiency is 0.714, and the average pure technical efficiency and average scale efficiency are 0.778 and 0.909, respectively. Therefore, there is still room to improve the overall operational efficiency of the culture industry. The scale efficiency is higher than pure technical efficiency, which indicates that low efficiency is the main reason for lower pure technical efficiency. It also can be seen from Table 3 that Beijing, Shanghai, Zhejiang, Guangdong, Shandong and Hunan, which have higher technical efficiency, represent 19.4% of all provinces and cities. In summary, China’s culture industry efficiency remains to be improved.

5.2. Stage II: SFA Regression Results

The slack variables (paid-in capital, average employment and number of corporate units) for the DMU calculated in the first stage are dependent variables in the second stage. The results of the SFA regression analysis are shown Table 4.
As we can see from Table 4, the regression coefficients of the three types of input variables are all at the 5% significance level, except for per capita GDP, which is at a 1% significance level. Therefore, these environmental variables have a significant effect on culture industry efficiency, so the selection of the model variables appears to be reasonable. In addition, the gammas of the three types of input variables are close to 0 and significant at the 5% level, showing that random factors have a significant influence on culture industry efficiency. It is thus necessary to strip out and analyze the random factors and environmental factors of the SFA model.
Before further analysis, it should be confirmed that the coefficients listed in Table 3 are determined by regressing the environmental variables on the input slack variables. When the regression coefficient is negative, there is a negative correlation between the environmental variables and the input variables; this means that an increase in the former will cause a decrease of the latter. When the environmental variables are increased, the input variable of waste or the negative output will be reduced, which means that the efficiency of the culture industry will be improved. In contrast, when the regression coefficient is positive, it means that an increase in the environmental variables will increase the input variables and the efficiency of the culture industry will be reduced. On this basis, the specific analysis of each environmental variable is as follows.
(1)
Per capita GDP. As we can see from Table 4, the regression coefficients of GDP for three types of input variables are negative, indicating that when, we increase the per capita GDP, we effectively reduce the culture industry paid in capital, the number of employees and the number of corporate units, which reflect improvement in the efficiency of the culture industry. This effect occurs because, when per capita GDP in a region is high, the level of economic development of that region is higher than in other regions; at the same time, the income level of residents will be higher. Once the material needs of the residents are met, they seek a higher level in their spiritual pursuits. These needs will effectively promote the development of the local culture industry, which will help local cultural firms to achieve economies of scale and improve their efficiency.
(2)
Cultural and entertainment consumption expenditure per capita. These coefficients for regression on the input slack variables are negative. The input variables of the culture industry decrease when consumer spending on per capita cultural entertainment increases and industrial efficiency improves. The index of per capita cultural entertainment expenditure for the culture industry is the most direct reflection of consumer demand. This index shows that, when the demand for cultural products and services is stimulated, the efficiency of the culture industry can be improved.
(3)
Number of corporate units. As we can see from Table 4, the regression coefficients of the index for the three input variables are positive, which means that an increase in the number of corporate units will lead to an increase in the input of the culture industry and will not improve the efficiency of the culture industry. This result reflects that, currently, there are too many companies in the culture industry in China, and that their scale is too small. This causes redundancy in capital for the entire industry, in labor inputs and in resource allocation. The small scale of the companies can also lead to low efficiency.
(4)
Number of cultural institutions. The regression coefficients for the number of cultural institutions for three types of slack variables are positive, which means that increasing the number of cultural institutions will lead to an increase in investment, which will reduce the overall efficiency of the culture industry.
(5)
The urbanization rate. The regression coefficients of the urbanization rate for the three types of input variables are positive, which means that a higher level of urbanization will increase the input and reduce the efficiency of the culture industry. The city level is measured by the proportion of the urban population in the total population, which indicates that an increase in the urban population in a region will reduce the efficiency of the culture industry. This result does not reflect expectations, and to understand it, the actual national conditions in China must be understood. China is currently in the primary stage of an urbanization reform, where rural populations are transforming into urban populations and the proportion of the urban population is increasing. This type of change is not conducive to the development of a regional economy. In contrast, it increases pressure on local employment and local economies and may cause turbulence in society; these factors are not conducive to the development of a local culture industry.
(6)
Residents’ education level. As we can see from Table 4, the regression coefficient of residents’ education level for the three types of input variables are negative, indicating that an increase in residents’ educational levels will reduce the input and improve the efficiency of the culture industry. Education and culture are closely related: as residents’ education level in a district increases, the demand for cultural products and services increases, and the efficiency of the culture industry increases.
(7)
Government fiscal expenditure on cultural undertakings. The regression coefficients of the cultural undertaking fees on the three input slack variables are positive; thus, financial support from the government is not conducive to improving the efficiency of the culture industry because cultural system is not reasonable. The current domestic cultural industries are composed mainly of for-profit cultural enterprises and institutions; this can lead the culture industry to independently improve the efficiency of the main cultural enterprises. The main object of government financial support is cultural institutions; therefore, raising cultural undertakings fees is not conducive to improving the efficiency of the culture industry.
(8)
The number of patent applications. It can be seen from the regression results that the number of patent applications is associated with the culture industry paid in capital, which is a slack variable, and the coefficient is negative. A greater number of patent applications reflects improvements in science and technology and can reduce culture industry investment and improve efficiency.
To sum up, different environmental variables affect the efficiency of culture industry investment and operations to different degrees. When we evaluate the efficiency of various culture industries in different provinces, if the influence of environmental variables is not eliminated, we would be unable to measure the actual efficiency of the culture industry. Several provinces with poorer practical efficiency are likely to have better actual performance because of a better environment; provinces with better efficiency may not have better performance because of a poor business environment. Therefore, based on the regression results of the second stage, we adjust these input variables to equalize the business environment and measure the adjusted efficiency of the culture industry.

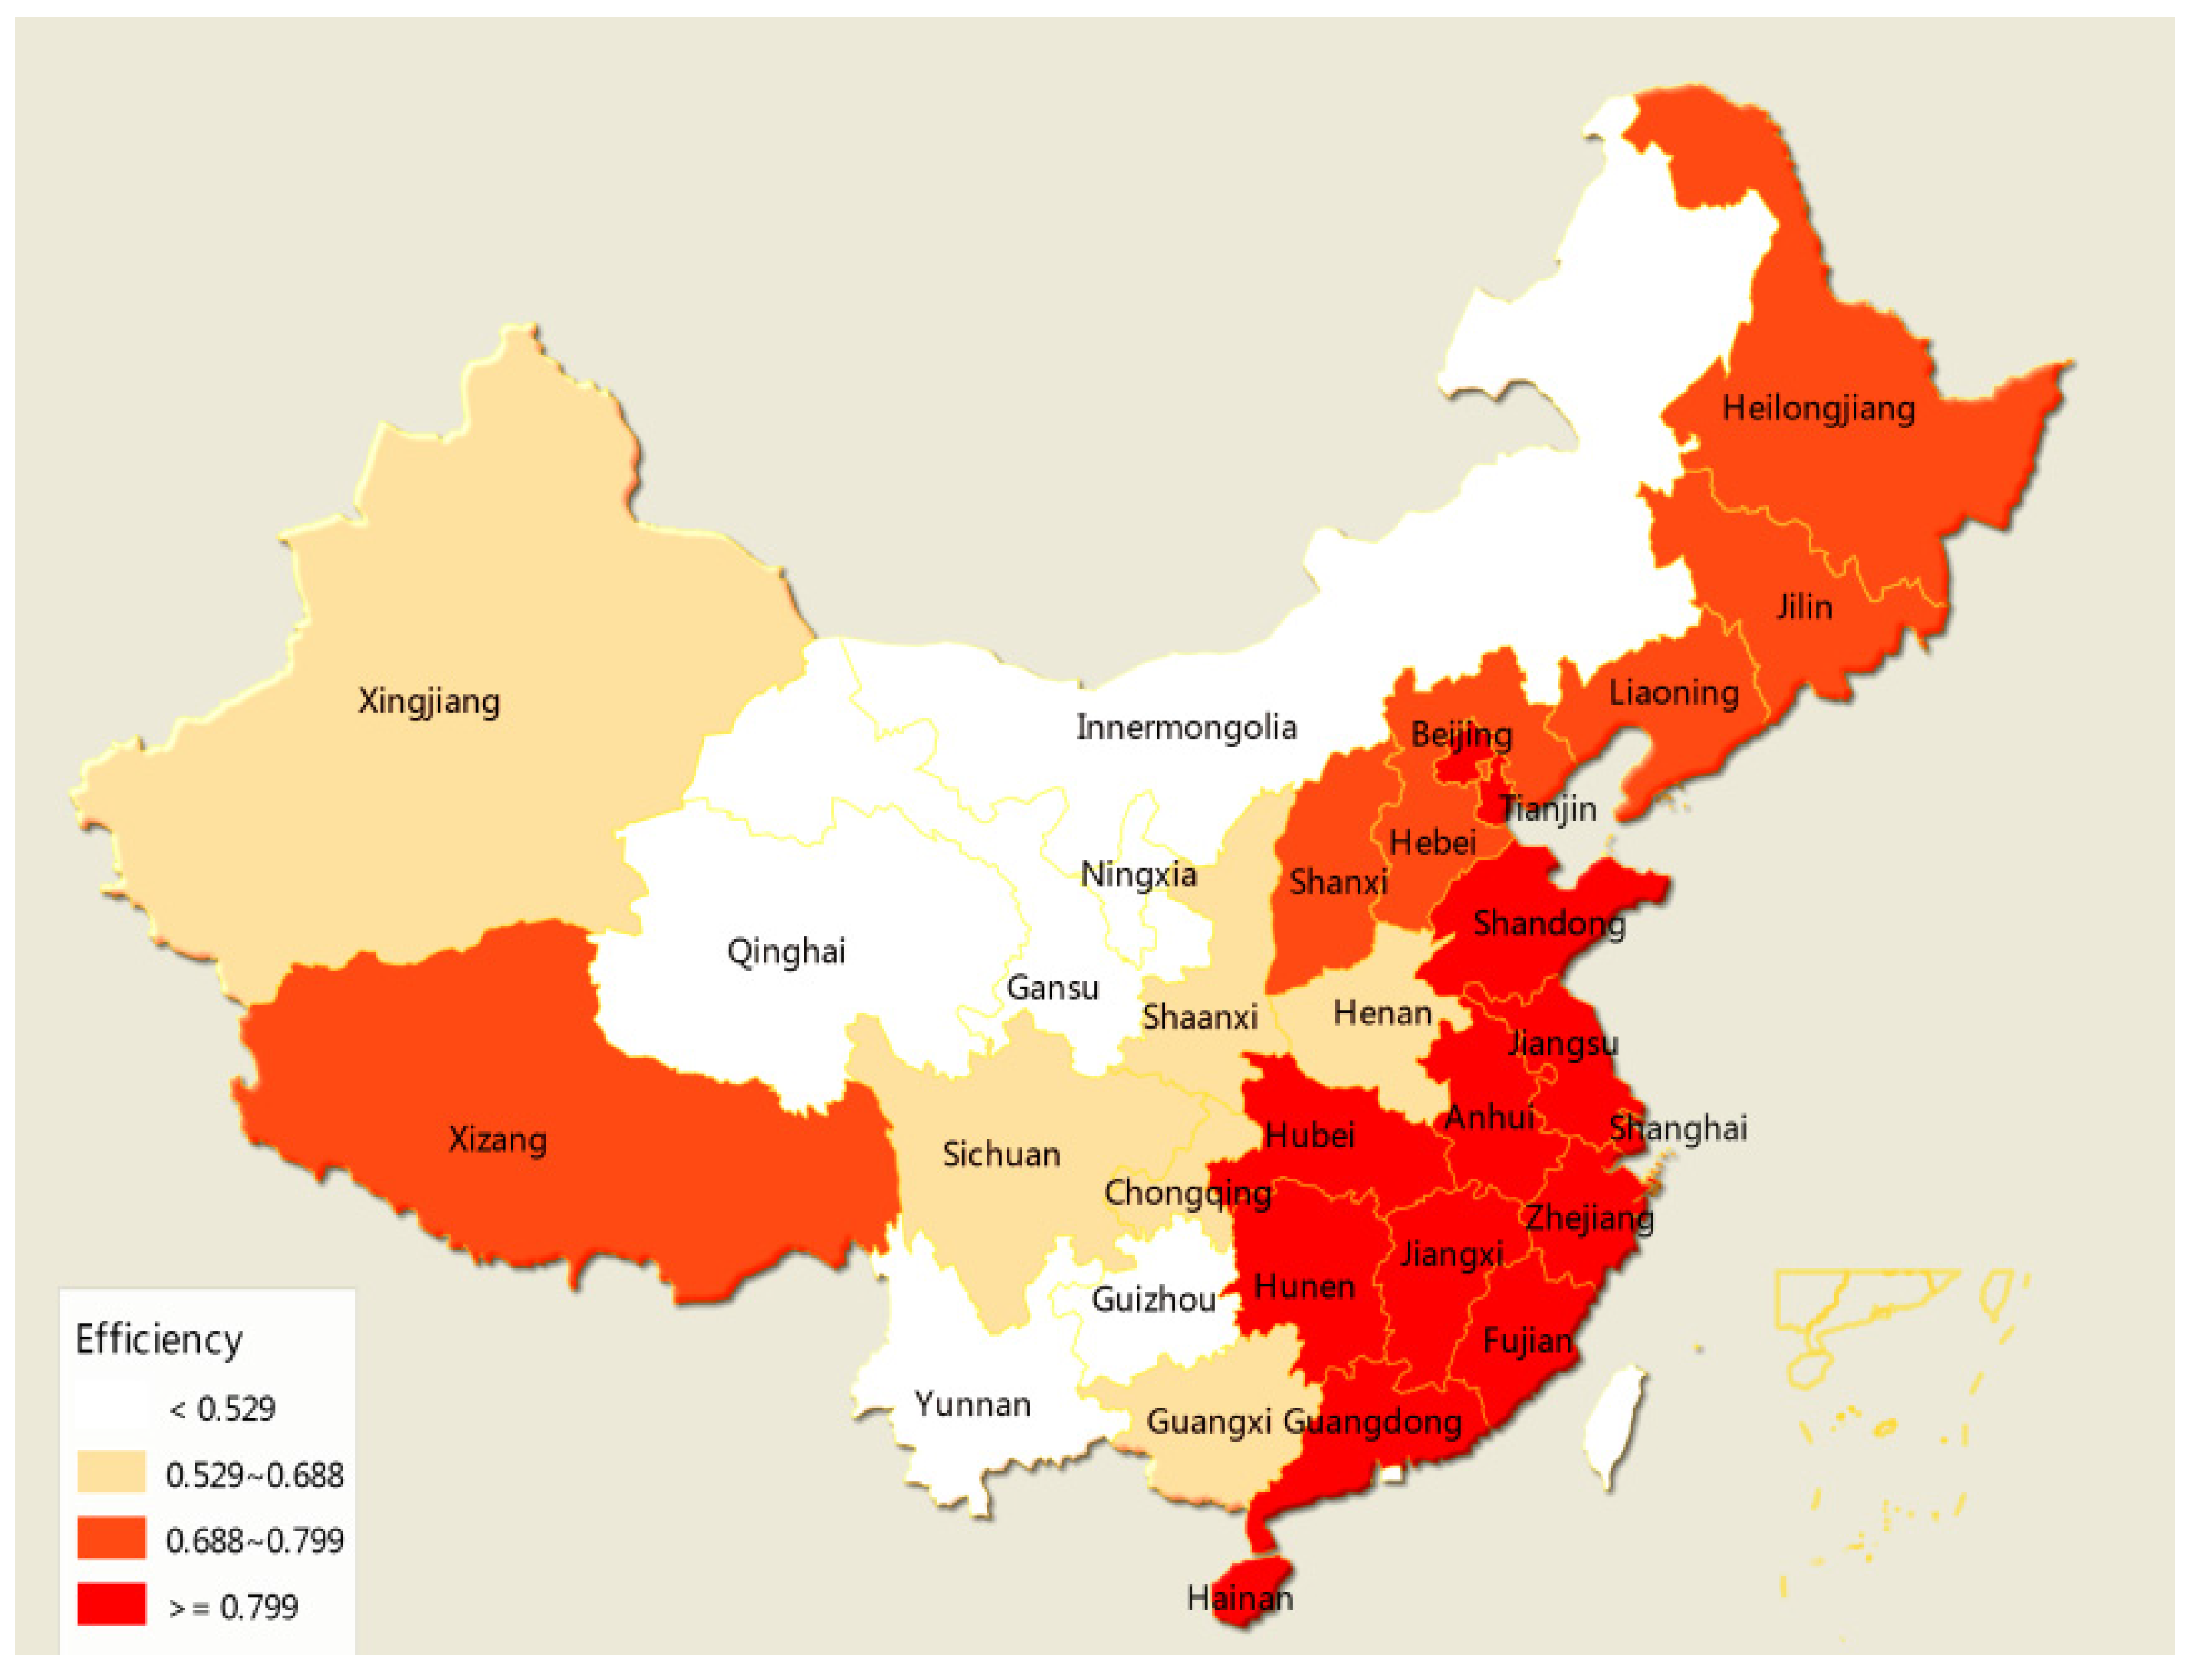
5.3. Stage III: The Adjusted DEA Model Results

DEAP2.1 software was used to measure and compare the efficiency after adjusting the input variables, and the results for the third stage are in Table 3.
As we can see from Table 3, the efficiency values for the provincial culture industry in the first and the third stages show major differences after the elimination of environmental and random factors. Comprehensive technical efficiency and scale efficiency values declined; the former decreased from 0.714 to 0.465, while the latter saw a larger decrease from 0.909 to 0.508. However, pure technical efficiency increased, rising from 0.778 to 0.857. Comparing the results also shows that, after the elimination of environmental and random factors, low technical efficiency is driven by the low scale efficiency in the third stage instead of pure technical inefficiency, as seen in the first stage.
To conduct further analysis, we performed the Wilcoxon significance test on the efficiency measurement results from the first stage and the third stage; the results are shown in Table 5.
As seen from Table 5, there were significant differences in technical efficiency, pure technical efficiency and scale efficiency before and after the adjustment, so it is necessary to adjust the original investment amount after eliminating environmental variables and random factors.
It also can be seen from Table 3 that the six provinces and cities representing the culture industrial production frontier are Beijing, Shanghai, Shandong, Zhejiang, Hunan and Guangdong. However, in the third stage and after the elimination of environmental and random factors, the frontier provinces are Beijing, Shanghai, Shandong and Guangdong. The proportion has decreased from 19.3% to 12.9%.

6. Analysis of the Culture Industry in the Provinces

TE represents the efficiency indicator for culture industry efficiency in the provinces and is analyzed first. From Table 2, it can be concluded that the indicator changes substantially after the adjustments. The efficiency of most of provinces falls after adjustment, with the average value of this indicator dropping by 0.249. Furthermore, the indicators for the eastern, central and western regions decreased from 0.893 to 0.708, 0.806 to 0.565, and 0.491 to 0.175, respectively. The western region shows the largest drop, followed by the central region and, then, the eastern region. This result reflects primarily the economic level of the different regions, which has an enormous effect on the efficiency of the culture industry. Moreover, Table 3 and Figure 2 shows that Beijing, Shanghai, Guangdong, Shandong, Zhejiang and Hunan represent the frontier of efficiency in the culture industry. However, Shandong and Hunan provinces are no longer in this group after the adjustment, which indicates that they have excellent and suitable environmental factors for the further development of cultural industries in the government, society, and human resources and others.
Second, the pure technical efficiency of provinces is analyzed. This indicator judges the level of operations management and techniques at the same scale. It can be seen from Table 3 that the pure technical efficiency after adjustment (PTE) for the majority of the provinces increases. The efficiency of operations and management of the overall country is impacted by a weaker policy and social environment. From the regional perspective, the PTE of the eastern region is 0.931 (before) and 0.970 (after), that of the central region is 0.863 and 0.919, respectively, and that of the western region is 0.581 and 0.713, respectively. It can be seen that the western region experiences the largest increase. This demonstrates that the western region is affected by the environment: if the environment changes, it will benefit progress in the western region. In contrast, the central and eastern regions see less of an increase. From the perspective of the provinces, Inner Mongolia and Shanxi see a large change, followed by Beijing, Shanghai, Jiangsu, Zhejiang, Shandong, Hainan, Guangdong Tibet and Xinjiang.
Finally, the scaled efficiency of provinces is analyzed. This indicator is used to judge the differences between current and optimal production capacity. If the indicator is closer to 1, capacity is closer to the optimal. On the whole, it increases after the adjustment. The overall average value for the 31 provinces is 0.909 (before) and 0.508 (after). Examining separate provinces, the scaled efficiency of Sichuan and Yunnan provinces show the biggest change, increasing by over 0.9,followed by Xinjiang, Shaanxi, and Inner Mongolia with an increase over 0.6. Taking the perspective of regions, the scaled efficiency of the eastern region is 0.956 (before) and 0.723 (after), while that for the central region is 0.853 and 0.237. The differences for the western region are greater than those for the others, which shows that the scale of western region cultural enterprises needs to be improved.
Beijing, Shanghai, Guangdong, Shandong, Zhejiang and Hunan are on the frontier of overall technical efficiency in the culture industry in the stage I as seen in the Table 3 and Figure 2. The reason is that these regions are developed in China.
However, Shandong and Hunan provinces are no longer in the frontier of overall technical efficiency in the culture industry in the stage III (after the elimination of environmental and random factors) as seen in the Table 3 and Figure 2. The reason is that Shandong and Hunan provinces should increase the scale of culture firms and scale efficiency.
In summary, after the elimination of environmental and random factors, the overall efficiency of the culture industry in 31 provinces has been greatly decreased by the adjustments, as seen in Table 3 and Figure 2. The low efficiency after industry adjustment is caused by scale inefficiency. This result is consistent with the fact that, currently, there are many Chinese cultural firms, and they are of small scale, which causes inefficiency and redundancy in the culture industries; therefore, expanding the scale is the key to improving the efficiency of the culture industry.
We can infer from the above that the current efficiency of China’s culture industry is low. The eastern, central and western regions are imbalanced. The indicators show that the culture industry in the eastern region is more developed than in the other two regions, while the western region shows a large gap from other two; the culture industry in the western region has the potential for benefits to be achieved through management and scale.

7. Conclusions

Through the three-stage DEA model, we draw the following conclusions.
First, the overall efficiency of the culture industry in China remains low. From the third-stage DEA model, we can see that, regardless of environmental factors, the average value is just 0.465. Culture industry efficiency still needs to be improved.
Second, the scale of the enterprise has become the major factor affecting culture industry efficiency. The results from the second stage of the SFA show that the excessive number of corporate units and their small scale reduce the efficiency of the culture industry; the results from the third-stage DEA model analysis confirm this finding. Small scale is the major factor leading to low efficiency in the culture industry.
Third, the environment has a major effect on the efficiency of the culture industry. Regardless of environmental factors, the efficiency of the culture industry in the provinces decreases between the analyses. The decrease is first driven by low pure technical efficiency and, second, by low scale efficiency.
Fourth, there is a big difference between culture industry efficiency in the eastern, central and western regions, and environmental factors have a different effect. Due to the highly developed economic level of the eastern region, environmental factors have less of an effect on the efficiency of its culture industry. In contrast, the western region is clearly affected by the environment. After the adjustment, the pure technical efficiency increases substantially, but scale efficiency decreases. Therefore, the western region needs many improvements in culture industry management and scale.

8. Policy Recommendations

As seen from the above conclusions, the overall efficiency of China’s culture industry still needs to be improved. We should therefore pay attention to these aspects when developing the culture industry.
The first, we should focus on expanding the scale of culture industry enterprises. We should gradually resolve current business problems, such as the high number of firms, complexity, firms’ small scale, and the proper allocation of industry resources; this is imperative to improving the efficiency of the culture industry.
The second, we need to accelerate market-oriented reform of institutional mechanisms. Among all of the factors affecting the efficiency of the culture industry, cultural system reform is the most effective way to improve efficiency. At present, culture industries and the career status of phase separation have seriously hampered the development of cultural industries as a whole. Market-oriented reforms that accelerate the establishment of autonomous, self-financing modern enterprises are the only way to resolve this conflict.
The third, we should pay attention to the efficiency gap in cultural industries between the eastern, central and western areas of China. We should use government power to support the development of cultural industries in the western region and encourage that region to explore its local potential around the development of culture industries. The geographic characteristics of each city in different regions and provinces can be processed as cultural products, which are the most valuable cultural resources.

Acknowledgments

This research paper is funded jointly by the China Natural Science Fund Project (No. 71473010); the China National Social Science Fund Key Project (11&ZD140); the Beijing education committee fund and the scientific research fund of economic and management college in the Beijing University of Technology (2016–2017). The authors are grateful to two anonymous reviewers whose comments have helped to improve the~manuscript.

Author Contributions

Shihong Zeng and Mimi Hu conceived of, designed and performed the experiments; Bin Su analyzed the data and contributed materials; all authors wrote the paper.

Conflicts of Interest

The authors declare no conflicts of interest.

References

  1. Pinheiro, R.; Hauge, E. Global scripts and local translations: The case of Cultural and Creative Industries (CCIs) in Norway. City Cult. Soc. 2014, 5, 87–95. [Google Scholar] [CrossRef] [Green Version]
  2. Shan, S.-L. Chinese cultural policy and the cultural industries. City Cult. Soc. 2014, 5, 115–121. [Google Scholar] [CrossRef]
  3. Tang, W.-S. Creative industries, public engagement and urban redevelopment in Hong Kong: Cultural regeneration as another dose of isotopia? Cities 2015. [Google Scholar] [CrossRef]
  4. Gu, X. Cultural industries and creative clusters in Shanghai. City Cult. Soc. 2014, 5, 123–130. [Google Scholar] [CrossRef]
  5. Zheng, J.; Chan, R. The impact of ‘creative industry clusters’ on cultural and creative industry development in Shanghai. City Cult. Soc. 2014, 5, 9–22. [Google Scholar] [CrossRef]
  6. Boggs, J. Cultural industries and the creative economy–vague but useful concepts. Geogr. Compass 2009, 3, 1483–1498. [Google Scholar] [CrossRef]
  7. Galloway, S.; Dunlop, S. A critique of definitions of the cultural and creative industries in public policy. Int. J. Cult. Policy 2007, 13, 17–31. [Google Scholar] [CrossRef]
  8. Gibson, C.; Kong, L. Cultural economy: A critical review. Prog. Hum. Geogr. 2005, 29, 541–561. [Google Scholar] [CrossRef] [Green Version]
  9. Grodach, C. Cultural economy planning in creative cities: Discourse and practice. Int. J. Urban Reg. Res. 2013, 37, 1747–1765. [Google Scholar] [CrossRef]
  10. Gonzalez, R.; Llopis, J.; Gasco, J. Social networks in cultural industries. J. Bus. Res. 2015, 68, 823–828. [Google Scholar] [CrossRef]
  11. World Bank. Thinking of Culture Industry Development Trend; World Bank Industrial Development Report; World Bank: Washington, DC, USA, 2005; pp. 99–100. [Google Scholar]
  12. Choi, Y.H.; Wu, Z. Korean Culture Industry Trends; Shanghai Translation Publishing House: Shanghai, China, 2005; pp. 89–90. (In Chinese) [Google Scholar]
  13. Banks, M.; Lovatt, A.; O’Connor, J.; Raffo, C. Risk and trust in the cultural industries. Geoforum 2000, 31, 453–464. [Google Scholar] [CrossRef]
  14. Zhang, W.; Zhou, L. Problems and countermeasures of investment and financing of China’s culture industry. Modern Commun. (J. Commun. Univ. China) 2006, 4, 106–112. (In Chinese) [Google Scholar]
  15. Xie, L. Culture industry financing analysis of the status of the perspective and countermeasures. J. Tongji Univ. (Soc. Sci. Sect.) 2010, 5, 40–44. (In Chinese) [Google Scholar]
  16. Yu, X.; Ren, Z. Analysis on the financial innovation of China’s culture industry. Shanghai Financ. 2011, 6, 105–108. (In Chinese) [Google Scholar]
  17. Li, H. European and American culture industry investment and financing system and its enlightenment to our country. Sci. Technol. Prog. Pol. 2012, 7, 107–112. (In Chinese) [Google Scholar]
  18. Wei, P. China’s culture industry financing environment and pattern analysis. J. Tongji Univ. (Soc. Sci. Sect.) 2010, 5, 46–50. (In Chinese) [Google Scholar]
  19. Wang, J.; Zhang, R. Based on stage 3 DEA model of China’s 31 provinces and municipalities in culture industry input-output efficiency studies. China Soft Sci. 2009, 9, 75–82. (In Chinese) [Google Scholar]
  20. Ma, X.; Zheng, S. Study on regional culture industry in China: Review and prospects. Econ. Perspect. 2010, 3, 3–6. (In Chinese) [Google Scholar]
  21. He, L.; Yuan, X.; Deng, H. China’s culture industry total factor productivity change and regional difference analysis, based on the analysis of malmquist productivity index. Inq. Into. Econ. Issues 2012, 3, 71–77. (In Chinese) [Google Scholar]
  22. Jiang, P.; Wang, Y. Caliber research on input-output efficiency of China’s culture industry. J. Quant. Tech. Econ. 2011, 12, 69–81. (In Chinese) [Google Scholar]
  23. Zheng, S.; Ge, J. Reform of the cultural system and culture industry total factor productivity growth. China Soft Sci. Mag. 2012, 10, 48–58. (In Chinese) [Google Scholar]
  24. Simões, P.; Marques, R.C. On the economic performance of the waste sector. A literature review. J. Environ. Manag. 2012, 106, 40–47. [Google Scholar] [CrossRef] [PubMed]
  25. Marques, R.C.; Berg, S.; Yane, S. Nonparametric benchmarking of Japanese water utilities: Institutional and environmental factors affecting efficiency. J. Water Resour. Plan. Manag. 2014, 140, 562–571. [Google Scholar] [CrossRef]
  26. Li, K.; Lin, B. Impact of energy conservation policies on the green productivity in China’s manufacturing sector: Evidence from a three-stage DEA model. Appl. Energ. 2016, 168, 351–363. [Google Scholar] [CrossRef]
  27. Stewart, C.; Matousek, R.; Nguyen, T.N. Efficiency in the Vietnamese banking system: A DEA double bootstrap approach. Res. Int. Bus. Finance 2016, 36, 96–111. [Google Scholar] [CrossRef]
  28. Wang, Q.; Zhou, P.; Zhao, Z.; Shen, N. Energy efficiency and energy saving potential in China: A directional meta-frontier DEA approach. Sustainability 2014, 6, 5476–5492. [Google Scholar] [CrossRef]
  29. Yang, Q.; Wan, X.; Ma, H. Assessing green development efficiency of municipalities and provinces in China integrating models of super-efficiency DEA and malmquist index. Sustainability 2015, 7, 4492–4510. [Google Scholar] [CrossRef]
  30. Chun, D.; Chung, Y.; Woo, C.; Seo, H.; Ko, H. Labor union effects on innovation and commercialization productivity: An integrated propensity score matching and two-stage data envelopment analysis. Sustainability 2015, 7, 5120–5138. [Google Scholar] [CrossRef]
  31. Lin, W.; Chen, B.; Xie, L.; Pan, H. Estimating energy consumption of transport modes in China using DEA. Sustainability 2015, 7, 4225–4239. [Google Scholar] [CrossRef]
  32. Wang, D.; Li, S.; Sueyoshi, T. DEA environmental assessment on U.S. industrial sectors: Investment for improvement in operational and environmental performance to attain corporate sustainability. Energ. Econ. 2014, 45, 254–267. [Google Scholar] [CrossRef]
  33. Basso, A.; Funari, S. Constant and variable returns to scale DEA models for socially responsible investment funds. Eur. J. Oper. Res. 2014, 235, 775–783. [Google Scholar] [CrossRef]
  34. Lamb, J.D.; Tee, K.-H. Resampling DEA estimates of investment fund performance. Eur. J. Oper. Res. 2012, 223, 834–841. [Google Scholar] [CrossRef] [Green Version]
  35. Zhong, W.; Yuan, W.; Li, S.X.; Huang, Z. The performance evaluation of regional R&D investments in China: An application of DEA based on the first official China economic census data. Omega 2011, 39, 447–455. [Google Scholar]
  36. Charnes, A.; Cooper, W.W.; Rhodes, E. Measuring the efficiency of decision making units. Eur. J. Oper. Res. 1978, 2, 429–444. [Google Scholar] [CrossRef]
  37. Banker, R.D.; Charnes, A.; Cooper, W.W. Some models for estimating technical and scale inefficiencies in data envelopment analysis. Manag. Sci. 1984, 30, 1078–1092. [Google Scholar] [CrossRef]
  38. Fried, H.O.; Lovell, C.A.K.; Schmidt, S.S.; Yaisawarng, S. Accounting for environmental effects and statistical noise in data envelopment analysis. J. Product. Anal. 2002, 17, 157–174. [Google Scholar] [CrossRef]
  39. Ye, L. Report of China's Culture Industry Development, 2012; Beijing University Press: Beijing, China, 2012. [Google Scholar]
  40. National Bureau of Statistics of China. China Statistical Yearbook, 2012; China Statistics Press: Beijing, China, 2012.
  41. National Bureau of Statistics of China. China Statistical Yearbook, 2013; China Statistics Press: Beijing, China, 2013.
  42. National Bureau of Statistics of China. China Statistical Yearbook, 2014; China Statistics Press: Beijing, China, 2014.
  43. National Bureau of Statistics of China. China Statistical Yearbook, 2015; China Statistics Press: Beijing, China, 2015.
  44. National Bureau of Statistics of China; The Propaganda Department of Cultural System Reform and Development Office. China Statistical Yearbook on Culture and Related Industries, 2015; China Statistics Press: Beijing, China, 2013.
  45. National Bureau of Statistics of China; The Propaganda Department of Cultural System Reform and Development Office. China Statistical Yearbook on Culture and Related Industries, 2015; China Statistics Press: Beijing, China, 2014.
  46. National Bureau of Statistics of China; The Propaganda Department of Cultural System Reform and Development Office. China Statistical Yearbook on Culture and Related Industries, 2015; China Statistics Press: Beijing, China, 2015.
Figure 1. The overall technical efficiency of the culture industry in the traditional DEA (stages I).
Sustainability 08 00324 g001
Figure 2. Overall technical efficiency of the culture industry in stage I and stage III.
Sustainability 08 00324 g002
Table 1. The input and output indexes and the environmental variables.
The Input Indexes and The Output IndexesThe Environmental Variables
The paid-in capital of the culture industry employeesThe per capita GDP (gross domestic product)
The number of corporate units of the culture industryThe average pay of culture consumption
The average number of the culture industry employeesThe number of corporate in the culture industry
The number of cultural institutions
The urbanization ratio
The operating receipts of the culture industryThe level of education for residents
The added value of the culture industryCultural undertakings cost/total government cost
The number of patent applications
Table 2. Correlation testing on the input and output indexes.
The Output IndexesPaid-in CapitalAverage Number of EmployeesNumber of Corporate Units
Operating receipts0.82630.90320.9112
Added value0.79050.93260.9057
Table 3. The efficiency of the culture industry in stages I and III.
RegionProvinceOverall Technical EfficiencyPure Technical EfficiencyScale EfficiencyReturns to Scale
Stage ⅠStage ⅢStage ⅠStage ⅢStage ⅠStage ⅢStage ⅠStage Ⅲ
EasternBeijing1.0001.0001.0001.0001.0001.000-- (1)--
EasternTianjin0.7990.5030.8310.9060.9610.555irs (2)irs
EasternHebei0.7130.4170.7610.8240.9370.506drs (3)irs
Central Shanxi0.6880.4070.7791.0000.8830.407--irs
WesternInner Mongolia0.4950.1710.5941.0000.8330.171drsirs
EasternLiaoning0.7200.5180.8030.9450.8970.548irsirs
Central Jilin0.7850.4730.7920.8890.9910.532drsirs
Central Heilongjiang0.7240.5390.8530.9020.8480.598drsirs
EasternShanghai1.0001.0001.0001.0001.0001.000irsirs
EasternJiangsu0.8310.6370.8831.0000.9410.637--irs
EasternZhejiang1.0001.0001.0001.0001.0001.000irsirs
Central Anhui0.8380.5290.8950.9140.9360.579irsirs
EasternFujian0.8740.6270.9730.9960.8980.629----
Central Jiangxi0.8590.5830.9120.9830.9420.593drsirs
EasternShandong1.0000.8821.0001.0001.0000.882irsirs
Central Henan0.6820.5140.7830.7920.8710.649irsirs
Central Hubei0.8740.6040.8950.9420.9770.641drsirs
Central Hunan (4)1.0000.8731.0000.9311.0000.937--irs
EasternGuangdong1.0001.0001.0001.0001.0001.000irsirs
WesternGuangxi0.5350.3170.6790.7430.7880.426drsirs
EasternHainan0.8830.5051.0001.0000.8830.205irsirs
WesternChongqing0.5380.1220.5790.6830.9290.178--irs
WesternSichuan0.6620.0290.6930.7730.9550.038drsirs
WesternGuizhou0.4160.2050.5390.7250.7720.696irsirs
WesternYunnan0.4120.0420.4130.5240.9980.080irsirs
WesternXizang0.7310.3121.0001.0000.7310.312--irs
WesternShaanxi0.5290.0210.6830.5910.7740.035drsirs
WesternGansu0.2840.1250.3150.4820.9010.259irsirs
WesternQinghai0.2140.0680.2810.5280.7610.129irsirs
WesternNingxia0.4850.1520.5830.5160.8320.294drsirs
WesternXingjiang0.5920.2310.6161.0000.9610.231irsirs
Average value0.7140.4650.7780.8570.9090.508
Note: (1) “--” represents constant returns to scale. (2) “irs” represents increasing returns to scale. (3) “drs” represents decreasing returns to scale. (4) Hunan is the same as Hunen in the paper.
Table 4. The regression results for the second stage.
CoefficientPaid-in CapitalAverage EmploymentNumber of Corporate Units
CoefficientStandard ErrorCoefficientStandard ErrorCoefficientStandard Error
Per capita GDP−1.013 **0.000−0.093 **0.000−0.027 **0.000
CECEPC (1)−82.901 ***0.535−9.977 ***0.114−3.220 ***0.005
NCU (2)0.951 ***0.0110.417 ***0.0040.884 ***0.007
NLI (3)0.382 ***0.0030.816 ***0.0010.927 ***0.000
RCU (4)29.873 ***1.05315.837 ***0.9613.058 ***1.628
REL (5)−104.68 ***12.961−67.63 ***1.773−13.59 ***0.683
CUF (6)1548.65 ***18.04436.77 ***1.00075.33 ***0.894
NPA (7)−0.001 ***0.000----
Constant term−122.453 ***10.56−55.479 ***2.974−1.7360.001
σ 2 139.75 ***3.42073.41 ***1.0006.925 ***0.965
γ 0.997 ***0.0050.988 ***0.0110.996 ***0.003
Log value−175.829−90.375.977
LR one-sided test6.033 ***9.643 ***25.697 ***
Note: ***, ** represent significance at the 1% and 5% levels, respectively. (1) CECEPC: Cultural and entertainment consumption expenditure per capita. (2) NCU: Number of corporate units. (3) NLI: Number of legal institutions. (4) RCU: Rate of city urbanization. (5) REL: Residents’ educational level. (6) CUF: Cultural undertaking fees. (7) NPA: Number of patent applications.
Table 5. Wilcoxon symbols rank test.
Test ValueComprehensive Technical EfficiencyPure Technical Efficiency Scale Efficiency
Z−4.832−4.195−5.022
P0.000 ***0.000 ***0.000 ***
Note: *** represent significance at the 1%.

